Abstract
A new sensor system for the determination of nitrogen-containing pharmaceutical substances has been proposed. It is based on the use of an ion association complex formed between cationic polyacrylamide (CPAA) and sulfonephthalein dye as a reagent. Bromocresol purple (BCP) interacts with CPAA to form a complex through hydrophobic interaction as well as electrostatic interaction. In the pH range from 3.5 to 5.5, this leads to an increase in the intensity of the dianionic form BCP band at 590 nm. The interaction between the polymer and the dye leads to an increase in the acidic properties of BCP, causing its pKa2 to shift from 6.3 to 3.75. Subsequently, when loratadine (LOR) is added to the CPAA/BCP system, the strong electrostatic interaction between the BCP monoanion and the protonated form of LOR leads to a decrease in the intensity of the band at 590 nm and an increase in the absorbance of the band at 432 nm, which is related to the dye monoanion. Here, we have demonstrated that this facile methodology can enable the rapid, reliable, and selective determination of LOR with a detection limit of 1.6 mg L−1 and a linear range from 5.0 to 120 mg L−1. The environmental friendliness of the developed method was assessed using the AGREE metric and is characterized by a high score of 0.83. The developed method represents a new approach to the creation of extraction-free spectrophotometric methods based on ionic associates of anionic dyes with protonated forms of nitrogen-containing medicinal compounds. The method was successfully applied to the determination of LOR in pharmaceutical preparations with satisfactory precision and accuracy. Overall, the results obtained indicate that this method has great potential for application in pharmaceutical analysis.
1. Introduction
Pharmaceutical substances often contain secondary or tertiary amino groups, or other nitrogen-containing groups capable of protonation in a weakly acidic medium. Such substances are easily converted into positively charged ions. This determines their ability to form stable ion association complexes (IACs) with certain anionic forms of organic dyes. IACs are an attractive analytical form for the development of spectrophotometric and luminescent methods, since they have very high color, fluoresce intensely, or are capable of resonance Rayleigh scattering as a result of the formation of an IAC. Dyes are readily available and inexpensive reagents. The reactions of IAC formation are fast, simple, and single-stage. However, there are significant difficulties associated with their use in spectrophotometry. These difficulties are related to the similarity or even coincidence of the spectral characteristics of the dyes themselves and the IAC formed by them. The traditional approach to analysis used to solve this problem is to separate the excess dye by extraction. This method has a number of disadvantages, including non-compliance with the principles of “green” analytical chemistry, such as the use of large quantities of organic solvents that are toxic to humans and the environment, as well as high labor intensity, lengthy determination, and complexity of automation. Therefore, methods that do not require extraction have recently become popular.
Recently, extraction-free methods based on the binding of fluorescein dyes to protonated forms of nitrogen-containing drug forms have become increasingly widespread [1,2,3,4]. During this reaction, poorly soluble finely dispersed IAC particles are formed. Significant changes are observed in the spectrum, which are explained by the aggregation of dye ions, simplified by their forced proximity within IAC microcrystals. The reaction is simple, fast, and highly sensitive, with molar absorptivities ranging from 20,000 to 50,000 mol−1 L cm−1. The downside of this method is that the aggregative stability of this system is limited, and IAC particles tend to sorb onto the walls of the vessel used in the analysis. This reduces reproducibility and makes it difficult to automate such reactions. To stabilize the analytical signal, solubilization with nonionic surfactant solutions is used. In diluted solutions, IACs are only stable to a limited extent without the addition of solubilizers. The interaction occurs only in the pH range where the single-charged anionic form of the fluorescein dye dominates and the drug is simultaneously protonated. These limitations explain the need to search for other non-extraction spectrophotometric methods using IACs.
Another non-extraction approach is also used in the analysis, but to a lesser extent. It utilizes the influence of ion associate formation on the tautomeric equilibria of the dye. In the medium of some polar solvents, sulfonephthalein dyes are predominantly found in a virtually colorless lactone tautomeric form. When pharmaceutical substances containing a sufficiently basic nitrogen atom are added to such a system, a stable IA is formed with the quinonoid tautomeric form of this dye, which is colored an intense yellow. This contributes to a shift in the tautomeric equilibrium toward the quinonoid form of the dye. The reaction for the formation of such an IA is also very fast, is highly sensitive, and can be automated, but the use of an organic solvent limits the attractiveness of this method.
There are several examples in the literature of other reactions that utilize IA formation in analysis without the need for extraction separation. An important part of such methods involves the use of polymers.
Polymers are widely used in the creation of chemosensors, primarily as substrate materials. Polymers are used to develop chemosensors in the form of solids, solutions, gels, nanoparticles, or films [5,6]. The polymer materials used in solid-state chemical sensors include natural and synthetic polymers, molecularly imprinted polymers, conductive polymers and their composites, hydrogels, etc. [7,8]. The polymer itself may contain functional groups capable of reacting with the analyte, or it may first be covalently or non-covalently modified by other reagents, after which it becomes capable of generating an analytical signal when interacting with the analyte [9,10]. When dissolved, polymers create an organized environment in aqueous solutions that allows the properties of the reacting substances to be changed in a favorable direction. IAs with polyelectrolytes are used as an analytical form for the determination of polymers [11]. The main reason for the change in the color of solutions is the shift in the acid–base equilibrium due to the selective binding of the polyelectrolyte to only one specific form of the dye. As a rule, the formation of an IA enhances the acidic properties of the dye. Other interactions are also involved in the binding, such as hydrophobic interactions, hydrogen bonding, and dispersion interactions of aromatic dye systems.
The change in the properties of reagents when interacting with a polymer can be used to develop “on–off”- or “off–on”-type chemosensors. The formation of IAs between fluorescent dyes and cationic polyelectrolytes is usually accompanied by fluorescence quenching. For example, when eosin reacts with polyethyleneimine (PEI), electrostatic and hydrophobic interactions lead to the formation of a complex in which the fluorescence of the dye is completely quenched. The subsequent addition of dodecyl sulfate leads to the formation of a more stable PEI associate with SDS, and eosin is displaced from the PEI/eosin complex [12]. This leads to the recovery of dye fluorescence. This method was used for the sensitive determination of SDS in real samples with a detection limit of 20 μg L−1. A similar reaction was used for the determination of perfluorooctanesulfonate [13].
In another study, a similar mechanism was used to determine heparin, using not only changes in fluorescence intensity as an analytical signal, but also changes in absorption and scattered light spectra [14]. In the first stage, an IA of PEI with phloxine B was obtained. In the second stage, upon the introduction of heparin, the IA PEI/phloxine B was destroyed and the IA PEI/heparin was formed. The dye was released in free form, the fluorescence of phloxine B was recovered, the absorbance at a certain wavelength increased, and the scattered light signal increased.
The polymers used in this work belong to the polyacrylamide type of cationic flocculants, as they are copolymers of acrylamide in terms of their structure. Polyacrylamides are the general name for a group of carbon-chain polymers and copolymers based on acrylamide and other unsaturated amides. Cationic polyacrylamides are widely used as stabilizing additives in the food industry, as mineral dispersants, as demulsifiers, as film formers for gelatin capsules, in the production of paper, in the production of food packaging, and as flocculants for clarifying natural and wastewater.
Loratadine (LOR) is a second-generation, long-acting antihistamine that does not cause sedation and is used to relieve allergy symptoms such as allergic rhinitis, urticaria, and hay fever. This is due to its action as a selective antagonist of histamine H1 receptors [15,16]. There are various analytical methods for determining LOR. These include chromatographic methods such as thin-layer chromatography, high-performance liquid chromatography, gas chromatography, gas chromatography–tandem mass spectrometry, and capillary electrophoresis [15,16,17,18,19,20], as well as several spectrophotometric methods [17,19,21,22,23,24,25,26,27,28].
This paper proposes a new approach to the use of IAs with organic dyes for the development of extraction-free methods based on the competitive reaction of anionic sulfonephthalein dyes with cationic polyacrylamide and protonated forms of nitrogen-containing preparations. Protonated forms of nitrogen-containing compounds are capable of destroying the IAs of dyes with polymers, since they form more stable complexes. Because cationic polymers form IAs with the dianionic form of sulfonephthalein dyes, and pharmaceutical compounds form IAs with the monoanionic form, contrasting changes occur in the absorption spectrum.
2. Materials and Methods
2.1. Reagents and Apparatus
The water-soluble FO brand polymers (SNF Floerger) used in this work are copolymers of acrylamide and methyl chloride ADAM (trimethylammonium ethyl acrylate chloride) with different charge densities (Figure 1). They are positively charged, with a charge density ranging from 5 to 95% and a molecular weight ranging from 3 to 15 million daltons. FO brand polymers with a charge density of 5, 10, 20, 55, 70, 80 (FO4800), and 95 (FO4990SH) % were used. By charge density, we mean the proportion of positively charged groups in relation to the total number of polymer links.
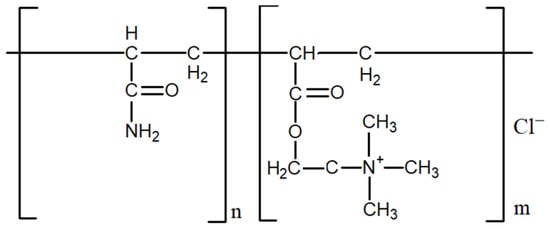
Figure 1.
Structural formula of FO brand cationic polyacrylamide.
All the reagents and solvents used were of analytical-reagent grade. Pharmaceutical-grade loratadine (4-(8-Chloro-5,6-dihydro-11H-benzo[5,6]cyclohepta[1,2-b]pyridin-11-ylidene-1-piperidinecarboxylic acid ethyl ester) was purchased from Sigma-Aldrich. The purchase of the cyclic sulfonate ester form of bromocresol purple (BCP) C21H16Br2O5S (ACS reagent) (Figure 2), as well as bromophenol blue and phenol red, was made from Sigma-Aldrich. A 1 mM stock solution of BCP was prepared weekly. Aqueous polymer solution (0.1 g L−1) was prepared by accurately weighing out 0.02 g of the polymer and dissolving it in double-distilled water in a 200 mL volumetric flask. The accuracy of the concentration of the prepared solution was checked according to [29]. Working solutions were prepared immediately before the experiment by diluting the starting solution. The required pH values were created by adding an acetate buffer solution with a concentration of 0.01 M. Measurements of absorbance and absorption spectra were performed on SF-26 (LOMO, Russia) and Specord S600 (Analytik Jena, Germany) spectrophotometers.

Figure 2.
Protolytic equilibrium between monoanionic and dianionic BCP forms.
2.2. Procedure for the Spectrophotometric Determination of LOR
A 2.5 mL volume of BCP solution with a concentration of 0.1 mM was added to 25 mL volumetric flasks; then, 5 mL of FO4990SH solution with a concentration of 0.1 g L−1, 1 mL of acetate buffer solution with a pH of 4.0, and 6.25 mL of the prepared drug solution were added to the flask. The volume was brought to the mark with distilled water, and the contents were mixed thoroughly. The absorbance of the solutions was measured on a spectrophotometer at 432 nm in a cuvette with an optical path length of 1 cm.
2.3. Analysis of Pharmaceutical Preparations Containing LOR
The accuracy and precision of the developed method were assessed using three pharmaceutical preparations containing LOR as the active ingredient. Each tablet of all three preparations contained 10 mg of LOR. The other ingredients in each tablet were as follows: Claritine (Bayer): 71.3 mg of lactose, magnesium stearate, maize starch; Loratadine-Darnitsa (Darnitsa): corn starch, lactose monohydrate, microcrystalline cellulose, colloidal anhydrous silica, croscarmellose sodium, magnesium stearate; Loratadine-Farmak (Farmak): potato starch, lactose, povidone, calcium stearate.
A fine powder was made by pulverizing ten tablets containing LOR. A quantity of tablet powder equivalent to 10 mg of LOR was measured out and placed into a 25 mL calibrated flask. Then, 15 mL of 0.1 M HCl was added and the mixture was shaken for 10 min. The volume was then adjusted to the specified mark with distilled water, mixed thoroughly, and filtered using Whatman No. 42 filter paper (pore size 2.5 µM). The first 5 mL portion of the filtrate was thrown away, and the rest was analyzed using the above-described procedure.
3. Results and Discussion
3.1. Interaction of BCP with CPAA
BCP in solution, depending on the pH of the medium, exists in neutral (H2R, pKa1 = −0.75) [30] and mono- (HR−, pKa2 = 6.3) and dianionic (R2−) forms. In a BCP solution at pH < 5.2, the monoionized form of the dye with λmax 432 nm dominates, and at pH > 6.8, the diionized form with λmax 590 nm prevails (Figure 3). When CPAA is added to the BCP solution in the pH range from 3.7 to 5.5, the band intensity of the doubly ionized form in the BCP spectrum increases, while that of the singly charged form decreases (Figure 3). As can be seen from these data, the polymer forms a more stable ionic associate with the doubly ionized form of the dye.
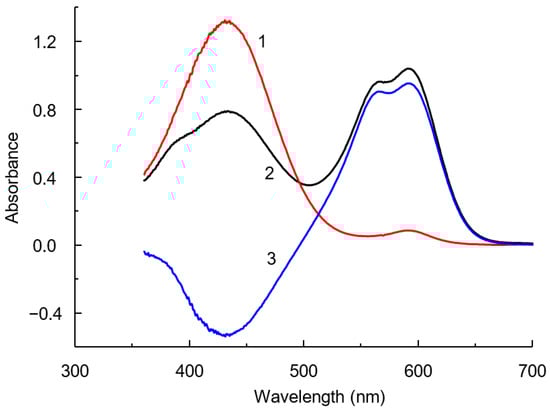
Figure 3.
Absorption spectra of BCP (1) and IA CPAA-BCP (2), and the difference spectrum (3). BCP: 10 µM; CPAA FO4990SH: 12 mg L−1; pH: 4.65; l = 1 cm.
We believe that changes in the spectra during the interaction of BCP with CPAA are caused by only one main reason—a shift in the acid–base equilibrium towards one of the dye forms due to the ion associative interaction of positively charged polymer groups and dye anions. In this case, the absorption maxima and the shape of the absorption bands remain virtually unchanged. Both maxima in the difference spectra are located at wavelengths that coincide with the maxima of the corresponding protonated forms of the dye. An isosbestic point is observed in the absorption spectra, which indicates a shift in the acid–base equilibrium and the presence of only two colored forms of the dye in solutions (Figure 4). Formally, changes in the spectrum are often described in the literature as an enhancement in the acidic properties of anionic dyes in solutions of cationic surfactants or polyelectrolytes [31]. The dissociation constant of a dye in the presence of a cationic polyelectrolyte is designated as pH1/2. Its apparent value, determined under the conditions of the proposed method, was 3.75. Thus, the pKa2 shift was ΔpH1/2 = 2.55.

Figure 4.
Effect of charge density of polymer on the absorption spectra of IA CPAA—bromophenol blue. Charge density of CPAA (%): 5 (1), 10 (2), 20 (3), 55 (4), 70 (5), 95 (6). Bromophenol blue concentration: 20 µM; CPAA concentration: 12 mg L−1; pH: 4.65; l = 1 cm.
The formation of an IA usually occurs when sufficiently large and hydrophobic cations and anions interact. The polymers and dyes used comply with this rule. Due to hydrophobic interaction, it is more advantageous for the dye to be inside the polymer particles in solution. Therefore, under certain acidity conditions, the formation of an ion associate can be observed, which is what happened in the systems under study.
The use of acrylamide and trimethylammonium ethyl acrylate copolymers in this work made it possible to trace the effect of polymer charge density on the nature of interaction with sulfonephthalein dyes. The introduction of CPAA with a charge density of 5% or 10% does not significantly affect the appearance of the bromophenol blue absorption spectrum (Figure 4, curves 1 and 2). When bromophenol blue was added to the solution in the pH range from 2.5 to 4.0, CPAA with a charge density of 20% or more showed a proportional increase in the intensity of the absorption band at 570 nm (Figure 4, curves 3–6). This is due to an increase in the concentration of positively charged polymer groups in the solution as the charge density increases. Based on this, a polymer with the maximum possible charge density of 95% was selected for further study.
In the studied system, under certain conditions, the formation of an IA is accompanied by the appearance of another band, hypsochromically shifted relative to the doubly charged band of BCP. It appears in the spectra as a band with a maximum at about 550 nm or as a shoulder (Figure 4). The second maximum, in our opinion, is due to the processes of dye aggregation [3,4]. For the absorption band of the singly ionized form (λmax = 432 nm), a hypsochromically shifted absorption band also appears, which manifests itself as a barely noticeable shoulder. Aggregation occurs due to the proximity of dye molecules in the polymer composition, which promotes the dispersion π-π interaction of the conjugated aromatic systems of BCP ions. With an increase in the charge density of the polymer, the proportion of positively charged polymer units statistically located next to each other increases. Accordingly, the probability that dye ions will be in close proximity increases, which promotes the aggregation process.
A similar explanation was proposed for the reaction between the cationic dye pseudoisocyanine (PIC) and the anionic polysaccharide heparin [32]. PIC J-aggregates formed on the surface of heparin, leading to a 400-fold increase in fluorescence intensity. In the absorption spectrum, upon the addition of heparin, the PIC band at 522 nm decreased in intensity along with the appearance and growth of a new sharp peak at 563 nm. This intense and sharp absorption band at a red wavelength shift is characteristic of J-type aggregates, in which dye molecules in the aggregate structure interact strongly with each other, leading to new electronic excitations.
In the pH < 2 range, the spectrum of the IA is practically indistinguishable from the spectrum of the dye, indicating the absence of interaction. This may be due to the low stability of the IA CPAA with a single-charged anionic form of the dye. Therefore, considering that other cations and anions are always present in the solution, the stability of the IA polymer with these anions or the stability of the IA monoanion of the dye with alkali metal cations may be greater than that of the IA CPAA-BCP.
The CPAA IA with BCP is formed in the pH range from 3.5 to 5.5 (Figure 5). The greatest deviation from additivity is observed in the pH range from approximately 3.8 to 5.0; a further increase in pH leads to a decrease in ΔA. At pH > 5.7, the spectra of the dye and the associate are identical. At pH values at which the dianionic form of BCP predominates or is completely formed, the formation of the IA no longer leads to a change in the spectra, since in this case, the spectra of the free dye and IA coincide. Subsequently, pH 4.6 was selected as optimal.
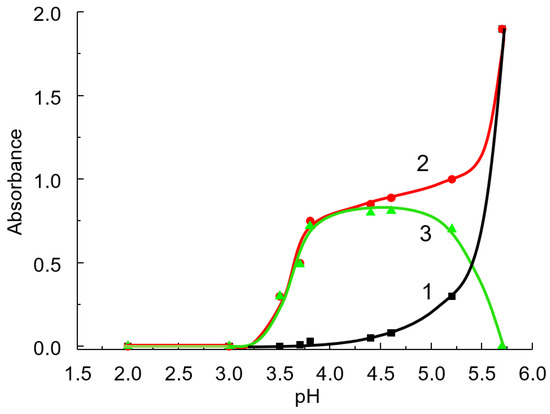
Figure 5.
Effect of solution pH on the absorbance of BCP (1) and IA CPAA-BCP (2), and the difference between (2) and (1) (3). BCP concentration: 10 µM; CPAA FO4990SH concentration: 4.8 mg L−1; λ = 595 nm; l = 5 cm.
The CPAA-BCP system differs significantly from other sulfonephthalein dyes in that there is a pH range in which the absorbance of the blank solution is close to zero (see Figure 5). This allows us to use a large excess of dye to completely shift the equilibrium towards the IA and increase the optical path length without losing the sensitivity and reproducibility of the analysis. The low absorbance of the blank solution is explained by the large difference between pKa2 BCP and pH1/2.
The curve showing the dependence of absorbance on BCP concentration has a clear inflection point at a dye concentration of 10 μM (see Figure 6). A further increase in BCP concentration leads to only a slight increase in absorbance.
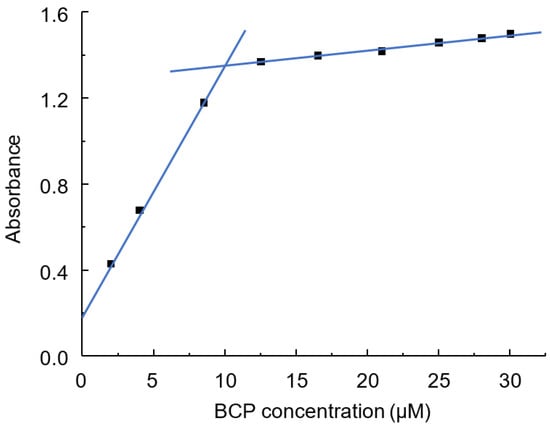
Figure 6.
Dependence of IA absorbance on BCP concentration. CPAA FO4990SH concentration: 1.0 mg L−1 (5 µM); pH = 4.6; λ = 595 nm; l = 2 cm.
3.2. Interaction of LOR with IA CPAA-BCP
The study of the interaction of nitrogen-containing active ingredients of pharmaceutical preparations with sulfonephthalein dyes showed that some of them, such as LOR, mebeverine, and levofloxacin, are capable of forming stable IAs. It has been established that, when sulfonephthalein dyes interact with protonated forms of nitrogen-containing organic compounds containing secondary or tertiary amino groups, the stability of an IA with a single-charge anionic form of the dye monoanion is higher than with a dianion [28,33]. At the same time, in the pH range at which IAs are formed, the color change is low-contrast or absent. A way out of this situation may be to use competing reactions.
In the previous part of the article, it was shown that cationic polymers form an ion association bond with the dianionic form of the dye, and the pH of IA formation shifts to the acidic range. Thus, there may be a range of acidity in which three conditions are simultaneously met. First, the IA of the dye with the polymer is sufficiently stable in this range. Second, in this range, the nitrogen-containing drug is in a protonated form and forms an IA with the monoionized form of the dye. And finally, third, the stability of the IA of the dye with the polymer is significantly less than the stability of the IA of the dye with the drug.
The proposed method for determining nitrogen-containing drugs is described by equilibria (1) and (2) using the example of determining LOR in the form of the IA with sulfonephtaleine dye (D).
DOHSO3− + CPAA+ = CPAA+DO−SO3− + H+
CPAA+DO−SO3− + HLOR+ + H+ = HLOR+DOHSO3− + CPAA+
In the first stage of determination, the monoanionic form of the dye reacts with cationic polyacrylamide. During this reaction, the color of the solution changes from yellow to purple, confirming the displacement of the phenolic proton and the formation of the dianionic form of the dye. In the second stage, the protonated form of LOR forms an ion association bond with the sulfo group of the dye. The phenolic group is protonated again, and the single-charged form of the dye is recovered in the new IAC. Accordingly, the yellow color of the solution is restored. The reasons why the polymer forms a stronger ion associative bond through the phenolic group, and the drug through the sulfo group, remain unclear.
This conversion scheme is illustrated by the absorption spectra we obtained in the dye–polymer–drug system (Figure 7). At pH 4.0, the dye is in a monoprotonated yellow form (Figure 7, curve 1, λmax = 432 nm), since its pKa2 is 6.3. The addition of polymer leads to the formation of an IAC, in which the dye is in the dianionic form (Figure 7, curve 2, λmax = 590 nm). The acidity constant for LOR was found to be pKa 5.25 [34]. Therefore, at pH 4.0, LOR is predominantly in the protonated form. Our previous article showed that only one pyridine nitrogen atom in the LOR molecule undergoes protonation [28] (Figure 8). This is also confirmed by the results of an experimental study conducted by other authors [34]. The addition of LOR into this system leads to the recovery of the spectrum of the monoanionic form of BCP (Figure 7, curve 4, λmax = 432 nm).
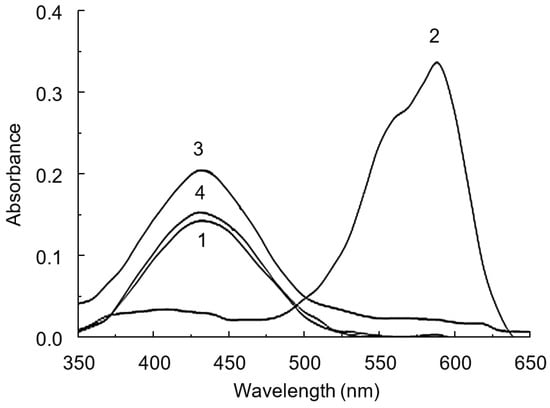
Figure 7.
Absorption spectra of BCP (1), CPAA FO4990SH-BCP (2), LOR-BCP (3), and LOR-CPAA FO4990SH-BCP (4) systems. CPAA FO4990SH concentration: 20 mg L−1; BCP concentration: 10 µM; LOR concentration: 50 µM; pH = 4.0; l = 1 cm.
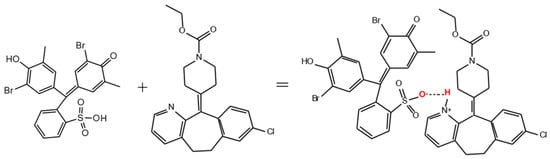
Figure 8.
Scheme of the reaction of IAC formation between BCP and LOR.
Thus, the IAC CPAA-BCP is a sensor system that is capable of responding to the presence of the drug in a solution. In terms of its operating principle, this sensor is similar to off–on systems, in which the addition of the analyte triggers a response to the presence of the drug and leads to the appearance of an analytical signal.
3.3. Optimization Study
Several factors influence the choice of dye. First, the stability of the dye’s IAC with the polymer must be sufficiently high. For example, phenol red also forms an IAC, and in the reaction with CPAA FO4990SH, the shift in the acidity constant ΔpH1/2 was the highest at 3.64. At the same time, this IAC is unstable, and even small concentrations of strong electrolytes can destroy it. Therefore, when analyzing real objects that may contain salts, this can lead to a large, uncorrectable systematic error. Another extreme case is the IAC with bromophenol blue. It proved to be the most stable compared to indicators with other studied sulfonephthalein dyes. However, the ΔpH1/2 for it turned out to be small, 1.4, which led to a decrease in the contrast of the reaction and high absorbance of the blank experiment.
The IAC of CPAA with BCP has intermediate stability. As mentioned earlier, the ΔpH1/2 shift for the dye is quite high. The blank absorbance is low due to the high contrast of the reaction. The concentration of the buffer solution was selected so that, on the one hand, the IAC with the polymer was practically not destroyed and, on the other hand, the buffer capacity was sufficient to neutralize the influence of hydrolyzing substances in the solutions of real samples. To account for the influence of strong electrolytes on the stability of the IAC, as well as the acid–base equilibrium of the dye, the dependence of the absorbance of the IAC on the concentration of the buffer solution was studied in preliminary experiments. In this experiment, a section of the curve was found where the absorbance was constant, indicating an insignificant influence of competing reactions on the stability of the IAC. For the IAC dye with the polymer, the absorbance of the IAC remained unchanged up to a concentration of 0.6 mM. A buffer solution concentration of 0.4 mM was chosen as optimal. The optimal concentration of BCP was chosen as 10 µM. At higher dye concentrations, the calibration range is wider. However, the absorbance of the blank solution increases strongly.
The study of the effect of pH on the determination of LOR using the IAC of CPAA with BCP as an analytical reagent showed that the maximum difference between experiments with and without LOR was observed in the pH range from 4 to 5 (Figure 9). The maximum analytical signal corresponded to a pH value of 4.5, which was selected as optimal.
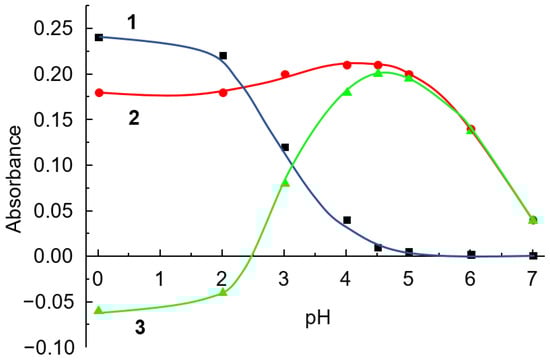
Figure 9.
Effect of pH of solution on absorbance of CPAA FO4990SH-BCP (1) and LOR-CPAA FO4800-BCP (2) systems and ΔA (3). CPAA FO4990SH concentration: 20 mg L−1; BCP concentration: 10 µM; LOR concentration: 50 µM; λ = 432 nm; l = 1 cm.
The addition of polymer into the LOR-BCP system leads to a decrease in the intensity of the band at 432 nm, since the polymer forms the IAC with the double-charged form of the dye, which leads to a decrease in the concentration of the monoanionic form. At the same time, as shown above, without the polymer, the contrast of the reaction is low or absent altogether. After 20 mg L−1, the effect of polymer concentration on absorbance is significantly lessened (Figure 10). This value was chosen as the optimal one.
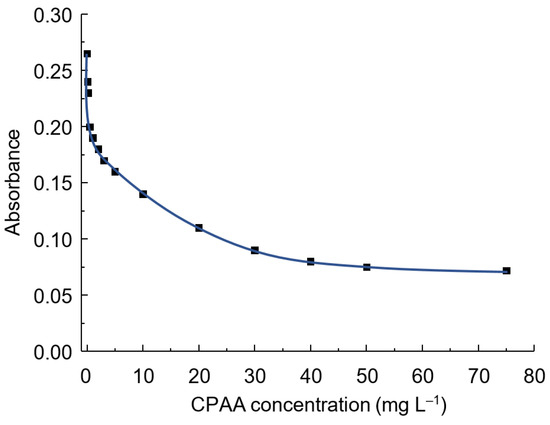
Figure 10.
Effect of CPPA concentration on the absorbance in the system LOR-CPAA FO4990SH-BCP. BCP concentration: 10 µM; LOR concentration: 50 µM; pH = 4.5; λ = 432 nm; l = 1 cm.
3.4. Analytical Performance
3.4.1. Method Validation
A spectrophotometric method for determining LOR was developed based on the optimal conditions found. The increase in the intensity of the BCP band at 432 nm is directly proportional to the concentration of LOR. Table 1 summarizes the analytical characteristics of the developed method. The limit of detection (LOD) and limit of quantification (LOQ) were calculated. This was performed according to the equations LOD = 3 × SR/b and LOQ = 10 × SR/b. Here, SR is the standard deviation of the regression. The calibration plot for the LOR determination has an inflection point at 120 mg L−1 (Figure 11). The absorbance, calculated as the difference in the absorbances for solutions containing LOR and without it, obeys Beer`s law in the LOR concentration range from 5 to 120 mg L−1 (Figure 11).

Table 1.
Characteristics of the proposed procedure and calibration curve.

Figure 11.
Calibration curve for LOR determination. BCP concentration: 10 µM; CPAA FO4990SH concentration: 20 mg L−1; pH = 4.5; λ = 432 nm; l = 1 cm.
3.4.2. Evaluation of Interference
One of the benefits of the suggested procedure is that it involves measuring the absorbance in the visible part of the spectrum. Therefore, substances that absorb in the ultraviolet part of the spectrum do not interfere with the determination. The main interfering effect is caused by substances containing sufficiently basic nitrogen atoms [34]. Strong electrolyte anions can affect the results of the determination. It turned out that sulfate ions have the strongest effect. We did not detect any interference for certain ingredients and common excipients in pharmaceutical preparations at interference concentrations exceeding those typically found in pharmaceutical preparations (Table 2).
Table 2.
Evaluation of interference in the determination of 100 mg L−1 of LOR using the proposed method.
3.4.3. Analysis of Pharmaceutical Formulations Containing LOR
The proposed method was used to determine the LOR in pharmaceutical preparations from various manufacturers. In all cases, good agreement was found between the results of the analyses of pharmaceutical formulations and the values declared by the producers, thus confirming the accuracy of the developed method (Table 3). The results obtained were then statistically compared with those of the reference UV spectrophotometric method [35]. The results obtained by the developed method were in close agreement with those of the reference method. No significant differences in accuracy and precision have been found between the developed method and the reference method. The accuracy of the results was between 97% and 102% for both the inter-day and intra-day tests, and the precision was good, with a relative standard deviation of less than 3.8%.
Table 3.
Intra-day and inter-day precision and accuracy data for the determination of LOR (mg/tablet ± Δ, n = 5, 95% confidence level).
The greenness of the developed method was assessed using the Analytical Greenness (AGREE) metric (Figure 12) [36]. The score of 0.83 confirms the high environmental friendliness of the proposed method. Such a high score is due to the fact that the reagents used in this method are environmentally safe. The polymer used is applied for the purification of natural or contaminated water. The use of organic solvents is completely excluded in this method. The volume of wastewater is limited and can be significantly reduced by automating the method.

Figure 12.
The greenness score for the developed procedure for the determination of LOR.
4. Conclusions
A new method for the extraction-free spectrophotometric determination of nitrogen-containing substances in pharmaceutical preparations using their ion association complexes with sulfonephthalein dyes has been proposed. It is based on the use of the IAC of sulfonephthalein dye with cationic polyacrylamide as a reagent. The dye and polymer bind through ion associative interactions, which are enhanced by hydrophobic interactions. This method can be used to determine only those nitrogen-containing substances that form significantly more stable IACs with the dye than the IACs of the dye with the polymer. For the first time, it has been shown that π-π dispersion interactions of dye ions play a significant role in the interaction between the dye and polymer. Using cationic polyacrylamides with different charge densities, it was shown that the probability of dye ion aggregation strongly depends on the charge density of the polymer. It is highest for polymers with charge densities of 80 and 95%, which we attribute to an increase in the statistical probability of dye ions being located close to each other.
It has been established that cationic polyacrylamides of the FO type form sufficiently strong IACs only with the dianionic form of the dye. That is, the binding occurs with the displacement of the phenolic proton of the dye. This enhances the acidic properties of the dye, which manifests itself in a shift in pH1/2. This creates conditions for a significant expansion of the pH range of the dianionic form into the acidic region down to 3.64 units. It has also been shown that nitrogen-containing drugs, such as LOR and some others, form IACs already at the sulfo group of the dye. Thus, the color of the solution changes due to the acid–base transition of the dye from the violet dianionic form to the yellow monoanionic form. Accordingly, when LOR is added to the IAC cationic polyacrylamide/BCP, the intensity of the monoanionic dye form band at 432 nm increases. This can be considered as the response of the polymer–dye sensor system to the analyte.
A simple, rapid, and extraction-free method for the spectrophotometric determination of LOR in pharmaceutical formulations was developed. The method fully complies with the principles of green analytical chemistry. According to the AGREE metric, it has a score of 0.83, which allows it to be classified as a highly green analytical procedure. The method can be easily automated, which can further increase its green rating. Under optimum conditions, the method displayed a detection limit as low as 1.6 mg L−1 for LOR and a good selectivity over other common ingredients of pharmaceutical formulations. The method proposed in this work has a sensitivity that is approximately on the same level with spectrophotometric methods that use the intrinsic absorption of LOR in the ultraviolet region of the spectrum [17,19,23,25] or the absorption of the ion associate of LOR with erythrosine in an acetonitrile medium [28]. The sensitivity of the extraction–photometric method, based on the extraction of the LOR IAC with BCP, is higher, but it uses 10 mL of chloroform per determination [21]. The sensitivity of the developed method is also no worse than that of the spectrophotometric method using a reaction with 4-chloro-7-nitrobenzofuran [26], as well as the HPLC method [22]. This method has been successfully applied to the determination of LOR in several pharmaceutical formulations with satisfactory results. Overall, these results demonstrate that this method has great potential for use in pharmaceutical analysis.
Author Contributions
Conceptualization, A.B.V. and Y.B.; data curation, A.B.V.; formal analysis, A.C.; funding acquisition, Y.B.; investigation, A.B.V. and A.C.; methodology, A.B.V. and Y.B.; project administration, Y.B.; resources, Y.B.; supervision, A.B.V. and Y.B.; visualization, A.B.V. and A.C.; writing—original draft, A.B.V. and A.C.; writing—review and editing, A.B.V. and Y.B. All authors have read and agreed to the published version of the manuscript.
Funding
This research was funded by the EU NextGenerationEU through the Recovery and Resilience Plan for Slovakia under the project No. 09I03-03-V01-00106 and VEGA grant number 1/0177/23.
Institutional Review Board Statement
Not applicable.
Informed Consent Statement
Not applicable.
Data Availability Statement
Dataset available on request from the authors.
Acknowledgments
Funded by the EU NextGenerationEU through the Recovery and Resilience Plan for Slovakia under the project No. 09I03-03-V01-00106 (Andrii Vyshnikin). Yaroslav Bazeľ and Andriy Vishnikin thank the Scientific Grant Agency VEGA of the Ministry of Education, Research, Development and Youth of the Slovak Republic and the Slovak Academy of Sciences for their support (grant no. 1/0177/23).
Conflicts of Interest
The authors declare that they have no known competing financial interests or personal relationships that could have appeared to influence the work reported in this paper.
References
- Zaafan, A.A.S.; Derayea, S.M.; Nagy, D.M.; Oraby, M. Evaluation of the on–off fluorescence method for facile measurement of vilazodone in pharmaceutical dosage form; Application to content uniformity testing and greenness evaluation. Spectrochim. Acta A 2024, 319, 124519. [Google Scholar] [CrossRef]
- Wang, J.; Liu, Z.; Liu, J.; Liu, S.; Shen, W. Study on the interaction between fluoroquinolones and erythrosine by absorption, fluorescence and resonance Rayleigh scattering spectra and their application. Spectrochim. Acta A 2008, 69, 956–963. [Google Scholar] [CrossRef]
- Hedjazi, M.; Vishnikin, A.B.; Okovytyy, S.I.; Miekh, Y.V.; Bazel, Y.R. Use of dye aggregation phenomenon for spectrophotometric and SIA-LAV determination of bismuth(III) as a specific ion association complex between tetraiodobismuthate and Astra Phloxine. J. Mol. Struct. 2022, 1251, 132015. [Google Scholar] [CrossRef]
- Hedjazi, M.; Vishnikin, A.B.; Balanenko, A.D. A green spectrophotometric method for determination of drotaverine hydrochloride in pharmaceutical preparations using formation of ion association complex with erythrosine. J. Chem. Technol. 2021, 29, 467–475. [Google Scholar] [CrossRef]
- Alberti, G.; Zanoni, C.; Losi, V.; Magnaghi, L.R.; Biesuz, R. Current trends in polymer based sensors. Chemosensors 2021, 9, 108. [Google Scholar] [CrossRef]
- Ruiz, J.A.R.; Vallejos, S.; García, F.C.; García, J.M. Polymer-based chemical sensors. Chemosensors 2018, 6, 42. [Google Scholar] [CrossRef]
- Alam, M.W.; Bhat, S.I.; Al Qahtani, H.S.; Aamir, M.; Amin, M.N.; Farhan, M.; Aldabal, S.; Khan, M.S.; Jeelani, I.; Nawaz, A.; et al. Recent progress, challenges, and trends in polymer-based sensors: A review. Polymers 2022, 14, 2164. [Google Scholar] [CrossRef]
- Sanjuán, A.M.; Ruiz, J.A.R.; García, F.C.; García, J.M. Recent developments in sensing devices based on polymeric systems. React. Funct. Polym. 2018, 133, 103–125. [Google Scholar] [CrossRef]
- Kim, H.N.; Guo, Z.; Zhu, W.; Yoon, J.; Tian, H. Recent progress on polymer-based fluorescent and colorimetric chemosensors. Chem. Soc. Rev. 2011, 40, 79–93. [Google Scholar] [CrossRef] [PubMed]
- Krämer, J.; Kang, R.; Grimm, L.M.; De Cola, L.; Picchetti, P.; Biedermann, F. Molecular probes, chemosensors, and nanosensors for optical detection of biorelevant molecules and ions in aqueous media and biofluids. Chem. Rev. 2022, 122, 3459–3636. [Google Scholar] [CrossRef]
- Ivanitsa, L.O.; Chernavskaya, A.Y.; Zabolotna, N.I.; Vishnikin, A.B. Spectrophotometric determination of polyacrylamide type flocculants. Methods Objects Chem. Anal. 2018, 13, 5–12. [Google Scholar] [CrossRef]
- Wen, T.; Li, N.B.; Luo, H.Q. A turn-on fluorescent sensor for sensitive and selective detection of sodium dodecyl sulfate based on the eosin y/polyethyleneimine system. Anal. Chem. 2013, 85, 10863–10868. [Google Scholar] [CrossRef]
- Liang, J.; Deng, X.; Tan, K. An eosin Y-based “turn-on” fluorescent sensor for detection of perfluorooctane sulfonate. Spectrochim. Acta A 2015, 150, 772–777. [Google Scholar] [CrossRef]
- Ling, Y.; Gao, F.; Zhou, Q.; Li, N.B.; Luo, H.Q. Multidimensional optical sensing platform for detection of heparin and reversible molecular logic gate operation based on the phloxine B/polyethyleneimine system. Anal. Chem. 2015, 87, 1575–1581. [Google Scholar] [CrossRef]
- Kunicki, P.K. Determination of loratadine in human plasma by high-performance liquid chromatographic method with ultraviolet detection. J. Chromatogr. B 2001, 755, 331–335. [Google Scholar] [CrossRef]
- Darwish, I.A.; Alzoman, N.Z. Dual fluorescence enhancement of loratidine by photoinduced electron transfer blocking and micellization: Application to the development of novel highly sensitive microwell spectrofluorimetric assay for analysis of dosage forms and urine samples. Spectrochim. Acta A 2024, 305, 123458. [Google Scholar] [CrossRef]
- Radhakrishna, T.; Narasaraju, A.; Ramakrishna, M.; Satyanarayana, A. Simultaneous determination of montelukast and loratadine by HPLC and derivative spectrophotometric methods. J. Pharm. Biomed. Anal. 2003, 31, 359–368. [Google Scholar] [CrossRef] [PubMed]
- Fernandez, H.; Ruperez, F.J.; Barbas, C. Capillary electrophoresis determination of loratadine and related impurities. J. Pharm. Biomed. Anal. 2003, 31, 499–506. [Google Scholar] [CrossRef]
- Mabrouk, M.M.; El-Fatatry, H.M.; Hammad, S.; Wahbi, A.A.M. Simultaneous determination of loratadine and pseudoephedrine sulfate in pharmaceutical formulation by RP-LC and derivative spectrophotometry. J. Pharm. Biomed. Anal. 2003, 33, 597–604. [Google Scholar] [CrossRef]
- Vlase, L.; Imre, S.; Muntean, D.; Leucuta, S.E. Determination of loratadine and its active metabolite in human plasma by high-performance liquid chromatography with mass spectrometry detection. J. Pharm. Biomed. Anal. 2007, 44, 652–657. [Google Scholar] [CrossRef]
- Gazy, A.A.; Mahgoub, H.; El-Yazbi, F.A.; El-Sayed, M.A.R.M.; Youssef, R.M. Determination of some histamine H1-receptor antagonists in dosage forms. J. Pharm. Biomed. Anal. 2002, 30, 859–867. [Google Scholar] [CrossRef]
- Ragehy, N.A.; Badawey, A.M.; El Khateeb, S.Z. Stability indicating methods for the determination of loratadine in the presence of its degradation product. J. Pharm. Biomed. Anal. 2002, 28, 1041–1053. [Google Scholar] [CrossRef]
- Mahgoub, H.; Gazy, A.A.; El-Yazbi, F.; El-Sayed, M.A.; Youssef, R.M. Spectrophotometric determination of binary mixtures of pseudoephedrine with some histamine H1-receptor antagonists using derivative ratio spectrum method. J. Pharm. Biomed. Anal. 2003, 31, 801–809. [Google Scholar] [CrossRef] [PubMed]
- Mohammadpoor, M.; Mohammadzadeh Kakhki, R.; Assadi, H. A bayesian regularized artificial neural network for simultaneous determination of loratadine, naproxen and diclofenac in wastewaters. Current Pharm. Sci. 2020, 16, 1083–1092. [Google Scholar] [CrossRef]
- Onur, F.; Yücesoy, C.; Dermiş, S.; Kartal, M.; Kökdil, G. Simultaneous determination of pseudoephedrine sulfate, dexbrompheniramine maleate and loratadine in pharmaceutical preparations using derivative spectrophotometry and ratio spectra derivative spectrophotometry. Talanta 2000, 51, 269–279. [Google Scholar] [CrossRef]
- El-Hay, S.S.A.; Colyer, C.L.; Hassan, W.S.; Shalahy, A. Utility of 4-chloro-7-nitrobenzofurazan (NBD-CI) for the spectrophotometric and spectrofluorometric determination of several antihistamine and antihypertensive drugs. J. AOAC Int. 2013, 96, 968–975. [Google Scholar] [CrossRef]
- Mahmoud, S.A.; El-Kosasy, A.M.; Fouad, F.A. Simultaneous determination of montelukast sodium and loratadine by eco-friendly densitometry and spectrophotometric methods. J. Chromatogr. Sci. 2023, 61, 907–917. [Google Scholar] [CrossRef] [PubMed]
- Al-Shwaiyat, M.; Vishnikin, A.; Kharadzha, A.; Bazel, Y. A non-extraction sequential injection method for determination of loratadine using formation of its ion-association complex with bromocresol purple in acetonitrile. Talanta 2024, 272, 125844. [Google Scholar] [CrossRef]
- Taylor, K.C.; Nasr-El-Din, H.A. Acrylamide copolymers: A review of methods for the determination of concentration and degree of hydrolysis. J. Pet. Sci. Eng. 1994, 12, 9–23. [Google Scholar] [CrossRef]
- Gupta, V.D.; Reed, J.B. First pKa Values of some acid-base indicators. J. Pharm. Sci. 1970, 59, 1683–1685. [Google Scholar] [CrossRef]
- Chmilenko, F.A.; Kharun, M.V.; Chmilenko, T.S.; Sobol, L.V.; Gladyshev, R.B. Triphenylmethane dye of sulfophthalein series adducts with polyvinylpyrrolidone and their use in chemical analysis. J. Anal. Chem. 2001, 56, 425–428. [Google Scholar] [CrossRef]
- Mudliar, N.H.; Dongre, P.M.; Singh, P.K. An efficient J-aggregate based fluorescence turn-on and ratiometric sensor for heparin. Sens Actuators B 2019, 301, 127089. [Google Scholar] [CrossRef]
- Al-Shwaiyat, M.K.E.A.; Galkina, K.; Sidorova, L.P.; Zhuk, L.P.; Matorina, K.V.; Chernyavskaya, A.Y.; Khudyakova, S.N.; Vishnikin, A.B. Use in pharmaceutical analysis of ionic association complexes formed between sulphonephthalein dyes and nitrogen-containing compounds in medium of organic solvent. J. Chem. Technol. 2023, 31, 713–726. [Google Scholar] [CrossRef]
- Popović, G.; Čakar, M.; Agbaba, D. Acid-base equilibria and solubility of loratadine and desloratadine in water and micellar media. J. Pharm. Biomed. Anal. 2009, 49, 42–47. [Google Scholar] [CrossRef]
- Ganorkar, S.B.; Rathi, A.A.; Kondalkar, A.R.; Joshi, Y.N. Spectrophotometric determination of loratadine in bulk and pharmaceutical formulations. Asian J. Chem. 2011, 23, 3350–3352. [Google Scholar]
- Pena-Pereira, F.; Wojnowski, W.; Tobiszewski, M. AGREE–Analytical GREEnness metric approach and software. Anal. Chem. 2020, 92, 10076–10082. [Google Scholar] [CrossRef] [PubMed]
Disclaimer/Publisher’s Note: The statements, opinions and data contained in all publications are solely those of the individual author(s) and contributor(s) and not of MDPI and/or the editor(s). MDPI and/or the editor(s) disclaim responsibility for any injury to people or property resulting from any ideas, methods, instructions or products referred to in the content. |
© 2025 by the authors. Licensee MDPI, Basel, Switzerland. This article is an open access article distributed under the terms and conditions of the Creative Commons Attribution (CC BY) license (https://creativecommons.org/licenses/by/4.0/).