Abstract
Detecting pathogenic bacteria and their phenotypes including microbial resistance is crucial for preventing infection, ensuring food safety, and promoting environmental protection. Raman spectroscopy offers rapid, seamless, and label-free identification, rendering it superior to gold-standard detection techniques such as culture-based assays and polymerase chain reactions. However, its practical adoption is hindered by issues related to weak signals, complex spectra, limited datasets, and a lack of adaptability for detection and characterization of bacterial pathogens. This review focuses on addressing these issues with recent Raman spectroscopy breakthroughs enabled by machine learning (ML), particularly deep learning methods. Given the regulatory requirements, consumer demand for safe food products, and growing awareness of risks with environmental pathogens, this study emphasizes addressing pathogen detection in clinical, food safety, and environmental settings. Here, we highlight the use of convolutional neural networks for analyzing complex clinical data and surface enhanced Raman spectroscopy for sensitizing early and rapid detection of pathogens and analyzing food safety and potential environmental risks. Deep learning methods can tackle issues with the lack of adequate Raman datasets and adaptability across diverse bacterial samples. We highlight pending issues and future research directions needed for accelerating real-world impacts of ML-enabled Raman diagnostics for rapid and accurate diagnosis and surveillance of pathogens across critical fields.
1. Introduction
Bacterial infections claim millions of lives annually, aggravated by the increasing threat of antibiotic-resistant strains. These infections worsen due to delays in diagnosis and ineffective treatment. In developed and developing nations, bacterial infections result in over 6.7 million deaths annually, while foodborne illnesses caused by microbial pathogens contribute to 420,000 deaths worldwide each year [1,2,3]. In the United States alone, treating bacterial infections costs an estimated USD 33 billion annually [4]. Antibiotic misuse and overuse accelerate the rise of dangerous antimicrobial resistance (AMR) [5]. Projections indicate that bacterial infections could become a leading cause of death, claiming 10 million lives annually by 2050 [6].
Traditional diagnostic methods face significant limitations. The time-consuming nature of culture-based techniques can prompt empirical broad-spectrum antibiotic use while awaiting results, potentially contributing to AMR when overused [7]. Popular molecular techniques like polymerase chain reaction (PCR) and enzyme-linked immunosorbent assay (ELISA) require complex sample preparation, specialized expertise, and expensive reagents, limiting their widespread deployment, particularly in resource-limited settings [8,9,10,11]. Phenotypic antibiotic susceptibility testing (AST) adds further delays, hindering effective treatment [12]. Even advanced tools like matrix-assisted laser desorption ionization–time of flight mass spectrometry (MALDI-TOF MS) may struggle to distinguish closely related bacterial species or accurately identify antibiotic-resistant strains [13,14]. Further challenges include the inability of many of these techniques to analyze individual cells within mixed populations, identify pathogens directly in their natural environments (like food or complex ecosystems), and reliably detect the unique pathogens present in marine environments. Other challenges with traditional methods include lack of speed, sensitivity, and adaptability. To combat bacterial infections and improve patient outcomes, safeguard food safety, and improve environmental monitoring, there is an urgent need for rapid, culture-free, accurate, and cost-effective diagnostic tools for detecting bacterial pathogens.
Raman spectroscopy can address these challenges by providing rapid, label-free bacterial detection based on the unique vibrational “fingerprints” of biomolecules within cells, offering a wealth of information on their molecular composition [15,16,17]. The Raman spectrum of a bacterial cell provides a detailed fingerprint of its key biomolecules, such as nucleic acids, proteins, lipids, carbohydrates, metabolites, and pigments. By analyzing the unique patterns (e.g., Raman shift, cm−1) and intensities of Raman peaks associated with these biomolecules, researchers can gain valuable information about the composition and structure of the microbial cells, aiding in various applications, including bacterial identification, characterization, differentiation of different strains and phenotypes, and monitoring of metabolic activities.Its rapid response, easier sample preparation, sensitivity, effectiveness across large scan areas, and non-destructive nature surpass traditional methods, enabling real-time analysis in both natural and engineered settings [18,19,20]. As explained in subsequent paragraphs, the emerging ML-based Raman spectroscopy serves as a powerful tool for the rapid detection of microorganisms. This allows for studying complex communities, identifying low bacterial loads, and maximizing information from a single sample. Figure 1A illustrates a typical workflow for Raman/SERS-based bacterial detection. For bacterial samples with weak Raman signals, nanoparticles are added to create a SERS effect, significantly amplifying the signal for improved detection.The process involves Raman/SERS analysis of processed bacterial samples transferred to suitable substrates such as aluminum, calcium fluoride (CaF2), Teflon, or silicon. Raman detection considers parameters like laser settings, grate size, acquisition time, power, and background subtraction to optimize signal quality and analysis speed. Machine learning models (unsupervised or supervised) are then employed for rapid and seamless bacterial detection at different levels of resolution, including genus, species, strain, and phenotypic response (Figure 1B). ML tackles data complexities for high-resolution bacterial identification in clinical, food safety, and environmental monitoring. Relevant case studies are provided in latter sections to discuss the key challenges addressed in the three key target areas (Figure 1B).
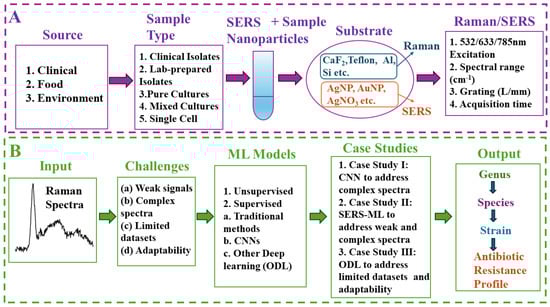
Figure 1.
Workflowfor Raman/SERS-based bacterial detection and machine learning applications. (A) Raman/SERS analysis of processed bacterial samples from diverse settings (clinical, environmental, food) followed by optional SERS modification. (B) Utilization of ML models for rapid and seamless detection of unique Raman signatures for target pathogens. The graphic highlights typical challenges “(a)–(d)”, typical unsupervised and supervised models, three case studies focused on in this article (1–3), and the envisioned resolution of Raman signatures at the genus, species, strain, and phenotype levels.
Emerging ML methods, along with new algorithms, large datasets, and increased computational power, have been successfully leveraged in diverse research fields [21,22,23,24]. Currently, they are being explored for enabling next-generation Raman/SERS methods for bacterial identification [17,25,26,27,28,29,30,31,32,33,34,35,36,37,38], including image analysis and ML-assisted MALDI-TOF MS [39,40,41,42,43,44,45,46,47,48]. This review article highlights the convergence of machine learning with Raman spectroscopy as a pivotal area for detecting bacteria including pathogens. These ML models have the potential to address some critical challenges, including (i) an inherently weak Raman signal, which leads to low signal-to-noise ratios (SNRs) [18,49] and hinders the ability to extract subtle spectral differences crucial for distinguishing unique phenotypes (e.g., antibiotic resistance) [18,50,51], (ii) convoluted and long peaks of varying widths, intensities, and positions, and (iii) the complexity of signals typical of surface-enhanced Raman spectroscopy (SERS), a powerful tool for amplifying the Raman signals based on trace amounts of pathogens [52,53,54,55,56,57,58]. ML methods can transform Raman-based bacterial detection processes by addressing issues with a typical need for experts trained in the meticulous preparation of samples and analyzing weak and complex signals. ML-based SERS can be used to analyze real-world clinical samples which contain complex mixtures of bacteria, body fluids, and other contaminants that obscure spectral information. Recent studies demonstrate its exceptional sensitivity towards subtle biomarkers for species and antibiotic resistance classification [59,60,61,62,63,64].
The convergence of machine learning and Raman spectroscopy within the past five years has unleashed a new era for rapid, label-free bacterial pathogen detection. While these convergent ML/Raman tools have been explored in certain branches [65,66,67,68,69,70,71], a focused review on their specific applications for bacterial detection, specifically to discriminate friends (beneficial bacteria) from foes (pathogens) is still needed. Based on the above background, this review article focuses on addressing key challenges with Raman-based bacterial detection; they include (a) weak Raman signals, (b) complex Raman spectra, (c) limited Raman datasets, and (d) lack of adaptability across diverse datasets. We will discuss the ML-based approaches for addressing these issues using three in-depth case studies. As mentioned earlier, this study focuses on fundamental aspects of ML-enabled Raman analysis for bacterial pathogen detection for clinical diagnostics, food safety, and environmental monitoring.
2. Raman and SERS: Fundamentals and Signal Enhancement
Raman spectroscopy is a non-invasive, label-free method for studying a bacterial cell’s interior by analyzing how its biomolecules’ unique structures vibrate in response to light. In other words, it works by analyzing how biomolecules scatter light, revealing their vibrational “fingerprint”. The incoming near-infrared (NIR) laser light bathes the microbial cell. The spectral wavelength, typically between 532 and 1064 nm, is chosen to achieve a good penetration depth within the cell (typically a few micrometers in size) and minimize damage to the cell itself. The laser spot size is focused on a tiny area, typically 1–10 μm in diameter, allowing researchers to target a single cell or a specific region within the cell even though the cell itself is much smaller. Please note that the diameter of typical bacterial cells ranges from 0.2 to 10 μm (e.g., 1 μm for Staphylococcus aureus, 1.5–4 μm for Mycobacterium tuberculosis) [72,73]. While laser light bathes the entire outer surface of the cell, it can penetrate to reach biomolecules within the cell. The laser light continuously illuminates the cell (seconds to minutes), and the key information of biomolecules comes from the femtosecond (fs) excitation (1 fs = 10−15 s) of the biomolecules (proteins, lipids, DNA, etc.) by the laser light. This excitation causes the molecules, which are much smaller than cells, to vibrate at their characteristic frequencies for a short period (picoseconds to nanoseconds). This vibrational state is a fleeting response (picoseconds to nanoseconds) as the bonds within the molecule pull it back to its original state. The biomolecule eventually relaxes by releasing the energy gained from the laser light. The Raman signal, which carries the fingerprint information of the biomolecules, is generated during this short vibrational state. By analyzing the Raman spectrum (pattern of scattered light intensities), scientists can identify the types of biomolecules present and their relative abundance within the cell. When the laser beam hits the bacterial cell or a biomolecule, most of the light scatters without changing energy, but a tiny fraction scatters at different frequencies. This change in frequency is called the Raman shift. The in-depth details regarding Raman mechanisms are documented elsewhere [74].
While Raman spectroscopy offers advantages, an even more powerful technique, SERS, can be used to address challenges like trace detection or complex mixtures. SERS boosts signal strength by harnessing the interaction of molecules with specially designed metallic nanostructures [75,76,77]. When light hits these nanostructures, it excites localized surface plasmon resonances (LSPRs)—essentially, waves of electrons moving across the metal’s surface [78,79]. LSPRs create intense electromagnetic fields that amplify the Raman signal of nearby molecules, making it possible to detect even minute traces of substances [80,81].
Beyond this powerful plasmonic effect, SERS sensitivity also draws from a chemical interaction between the molecule and the metal surface [82]. This involves a temporary exchange of electrons, acting as a bridge that can further amplify the molecule’s Raman signal [75]. Importantly, the chemical effect can further amplify or slightly reduce the Raman signal, but its overall contribution is typically less significant than the powerful boost provided by plasmons [83].
The sensitivity of SERS opens promising possibilities across various fields. It enables early detection of pathogens, allowing for the rapid treatment of infections. In food safety, SERS can detect minute traces of harmful bacteria or toxins, safeguarding consumers [52]. Additionally, SERS allows for the analysis of complex environmental samples for pollutants or other contaminants, aiding in environmental monitoring [84].
While offering significant advantages and sophisticated results, SERS still faces the challenge of analyzing complex spectral data. Subtle differences between closely related pathogens or the influence of background noise can be hard to distinguish using traditional methods. This is where machine learning enters the picture, providing essential assisting tools to extract meaningful patterns from complex Raman/SERS data. This leads to groundbreaking advancements in areas like bacterial pathogen detection.
For a deeper technical understanding of the mechanisms behind SERS enhancement, see Appendix A.
3. ML Techniques for Raman Spectroscopy: Traditional ML, CNNs, and Other Deep Learning Techniques
Machine learning models discussed in this section have been effectively used to address the previously discussed key challenges. Table 1 provides a comparative overview of the key ML techniques deployed in Raman spectroscopy for bacterial identification, exploring their specific advantages and challenges.

Table 1.
Unsupervised and supervised ML techniques for Raman spectroscopy: a comparative guide.
3.1. Unsupervised Machine Learning
Unsupervised machine learning techniques offer an exploratory approach to Raman data analysis, particularly valuable when dealing with unlabeled datasets. These techniques offer advantages such as the discovery of unknown bacterial subgroups, dimensionality reduction for simplified analysis, and guidance for hypothesis generation in basic research. Principal component analysis (PCA) reduces data dimensionality by identifying the principal components explaining most of the variance, making it ideal for visualizing data and identifying underlying patterns. Researchers have used PCA in combination with classification models for preliminary spectral exploration and biomarker identification [89]. K-means partitions data into “K” clusters based on similarity, effectively grouping similar spectra, but requires specifying the number of clusters. Hierarchical clustering creates a tree-like structure (dendrogram) representing spectral relationships, helpful for exploring hierarchical structures in data. Density-based spatial clustering of applications with noise (DBSCAN) discovers clusters of arbitrary shape based on density, making it ideal for identifying clusters with varying densities and dealing with outliers. Researchers have applied clustering methods like K-means and DBSCAN to Raman data for bacterial strain differentiation and to study microbial community dynamics [90].
3.2. Supervised Machine Learning
In contrast to unsupervised methods, supervised machine learning techniques leverage labeled datasets to learn specific relationships between spectral features and target outcomes (e.g., bacterial species, antibiotic resistance). This approach offers several advantages, including the potential for high accuracy when well-defined labels are available and the ability to directly predict specific biological characteristics of interest.
3.2.1. Traditional Machine Learning
Traditional machine learning algorithms, including support vector machine (SVM), decision tree (DT), random forest (RF), and others, offer a complementary approach, often focusing on extracting handcrafted features from spectral data. They can excel with smaller datasets (typically less than 1000 samples) and provide insights into the driving spectral features, offering valuable transparency. SVM constructs a hyperplane to separate classes and works well with high-dimensional data, while RF is an ensemble of decision trees that is robust to overfitting and handles non-linear relationships. DT is simple and interpretable but can be prone to overfitting, whereas KNN classifies based on proximity to neighbors in a feature space but is sensitive to noise and outliers. Ensemble methods combine multiple models to improve overall performance. For scenarios where computational resources are limited or rapid analysis is crucial, traditional ML methods can be highly suitable. However, they may struggle with highly complex spectral data or subtle differences between samples compared to deep learning techniques. Researchers have successfully used RF to classify complex bacterial communities in environmental samples and to explore SERS-based bacterial chemotaxonomy [60,86]. Additionally, various traditional ML methods have been combined with Raman spectroscopy for rapid, label-free clinical diagnostics, including antibiotic resistance profiling [91].
3.2.2. Deep Learning (DL)
Deep learning encompasses a powerful suite of supervised learning techniques that leverage multilayered neural networks to uncover complex relationships within data. In the context of Raman analysis, two key deep learning categories emerge: CNNs and other deep learning techniques.
Convolutional Neural Networks (CNNs)
CNNs, inspired by the structure of the visual cortex, have emerged as a dominant force due to their ability to process grid-like data [92].They excel at extracting intricate patterns and spatial features from complex Raman spectra. CNNs have demonstrated superior performance in identifying complex spectral patterns and can handle large, labeled datasets (often exceeding 1000 samples per class), making them ideal for differentiating closely related bacterial strains, identifying subtle antibiotic resistance markers, and handling samples with background noise [18,93,94,95]. They offer advantages such as automatic feature extraction, high accuracy with large datasets, and robustness to noise. CNNs can be trained to adapt to variations in sample preparation and spectral noise, enhancing their robustness in real-world clinical settings. Researchers have successfully employed CNNs to distinguish between closely related pathogens like Shigella spp. and Escherichia coli and for accurate identification even in complex clinical samples [87,96]. Additionally, CNNs have demonstrated the ability to detect subtle antibiotic resistance markers in bacteria such as Staphylococcus aureus [18]. However, CNNs can be computationally intensive and may be challenging to interpret. They also face challenges such as potential overfitting to training data and the need for large, well-labeled datasets [97].
Other Deep Learning (ODL)
Researchers are harnessing innovative ODL methods like vision transformers (ViTs), attentional neural networks (aNN), and generative adversarial networks (GANs) to tackle specific challenges, such as addressing dataset limitations, extracting subtle patterns, and handling real-world sample complexities. ViTs have proven effective for rapid antibiotic resistance classification in clinical settings [59], while aNNs show potential for analyzing complex extracellular vesicles, aiding in disease diagnostics [98]. GANs can be used to augment datasets for rare bacteria analysis, as exemplified by their use in enhancing datasets for rare deep-sea bacteria analysis [88]. These ODL methods offer advantages such as effectiveness for complex data, robustness to noise, and the ability to handle limited datasets. However, they can be computationally intensive, require careful validation, and demand domain expertise for optimal method selection.
4. Three Case Studies Based on Modern Trends in ML-Enabled Raman Detection of Bacterial Pathogens
A comprehensive review of the recent literature (from 2019 to 2024, keywords: machine learning, Raman spectroscopy, and bacterial detection) revealed research articles reflecting new research trends on ML-enabled Raman/SERS-based detection of bacterial pathogens. Our study thus focused on the critical analysis of 32 different research papers reflecting the trends. These papers were chosen for their emphasis on in-depth analysis of ML algorithms for analyzing Raman or SERS spectral data and their ability to address the key challenges (see Figure 1B) and to resolve bacterial signatures at levels including species, strain, and phenotype (e.g., antibiotic resistance). We then categorized these papers based on the types of ML approaches (CNN, traditional ML, and other deep learning), arranging them chronologically within each category to highlight trends and facilitate methodological comparisons (see Appendix B for a full list of the 32 papers and their categorization). The analysis of these 32 papers revealed key trends, including the dominance of CNN-based approaches (31%), increasing interest in SERS methods (34%), and the potential of cutting-edge ODL methods. These trends highlight the need to sustain ongoing research on ODL methods tailored to address issues with noisy Raman data and the lack of standardized SERS protocols and explainable AI techniques. To illustrate the evolution of ML methods for addressing key challenges in Raman-based bacterial detection, with a focus on detecting pathogens, we selected three in-depth case studies: (1) decoding bacterial identity with CNNs, especially to handle complex spectral data; (2) enhancing bacterial detection by SERS (e.g., for enhanced sensitivity and detection of subtle biomarkers); and (3) tackling data challenges and expanding Raman analysis with other deep learning (ODL) methods.
4.1. Case Study I: Decoding Bacterial Identity with CNNs
The antimicrobial resistance crisis demands swift, precise bacterial diagnostics, a challenge traditional methods often fail to meet. Recent advancements in CNNs offer a potential breakthrough, deciphering the intricate spectral language of Raman data to advance treatment decisions.
4.1.1. CNNs: Addressing Clinical Complexity in Bacterial Detection
Despite its power, Raman spectroscopy faces hurdles in clinical settings—analyzing intricate spectral patterns and combating low signal-to-noise ratios can be overwhelming. Traditional methods often struggle to distinguish subtle differences crucial for accurate bacterial identification and antibiotic susceptibility testing. However, recent advancements in deep learning, particularly CNNs, offer innovative solutions, tackling these shortcomings and enhancing bacterial detection and identification tasks. CNNs can even pinpoint antibiotic resistance markers, distinguishing between methicillin-resistant Staphylococcus aureus (MRSA) and methicillin-susceptible S. aureus (MSSA) strains with remarkable accuracy [18,89].
Convolutions are a core component of CNNs and act like filters that can automatically scan and extract important features from complex data, like the sophisticated peaks and valleys within a Raman spectrum. In essence, they help CNNs “see” the patterns within the data that hold the key to identifying different types of bacteria.
Ho et al. successfully used a CNN inspired by the ResNet architecture to identify bacterial isolates, predict effective treatments, and even detect antibiotic resistance [18]. This approach works well because of how CNNs analyze bacterial data and how ResNet elegantly addresses a common challenge in deep learning called the “vanishing gradient problem” [99]. In simple terms, imagine a researcher trying to analyze a long and complex Raman spectrum. As deep neural networks get more complex, they can sometimes struggle to remember important details from the beginning of the spectrum by the time they reach the end—this is the vanishing gradient problem. ResNet’s clever solution helps the network retain crucial information from earlier layers, leading to improved performance.
ResNet addresses this with “residual blocks”, acting like shortcuts within the network that let crucial details flow directly to later layers. This essentially helps the CNN model remember the most important details of the spectrum, even when analyzing complex data.
The specific CNN in this study had 26 layers, starting with a convolutional layer that used 64 filters to scan the Raman spectrum (see Figure 2 for a visual representation of this CNN architecture). These filters act as specialized magnifying glasses, focusing on information such as peak shapes and spacing that are key to identifying bacteria using Raman spectra. Next, residual layers with ResNet’s “shortcuts” ensured that these important features were fully utilized for analysis. A key advancement in this study involved replacing traditional pooling layers within the ResNet architecture with strided convolutions. While traditional pooling layers can lose valuable information about the precise location of peaks within the Raman spectrum—details crucial for distinguishing between bacteria—strided convolutions preserve this information. This enhancement is vital for detecting the subtle differences that indicate different bacterial strains or antibiotic resistance. After the convolutional layers (with their strided convolutions) have analyzed the data, a fully connected layer takes the results and makes the ultimate decision—identifying the specific bacteria and potential antibiotic resistance.
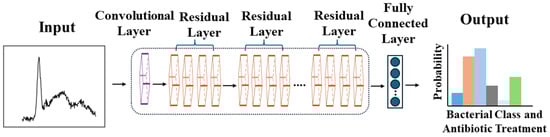
Figure 2.
Step-by-step transformation of complex Raman spectral data into an accurate bacterial identification and antibiotic treatment decision within a CNN. Adapted from Chi-Sing Ho et al., Nature Communications, 2019. Copyright 2019 [18].
To address the lack of large datasets for CNN implementation, Ho et al. gathered their own training data [18]. They collected a robust reference dataset of 60,000 spectra from 30 bacterial and yeast isolates. These isolates represent over 94% of bacterial infections treated at Stanford Hospital from 2016 to 2017, ensuring the dataset’s clinical relevance. This comprehensive dataset was used to train a CNN on the “Bacteria-ID” subset (60,000 preprocessed spectra). This initial training used a short measurement time of only 1 s per spectrum, demonstrating the potential for rapid analysis. The model was then fine-tuned on a smaller dataset of 3000 spectra for even greater accuracy. To rigorously evaluate its performance, the model was tested on a separate dataset of 3000 spectra it had never seen before. The results were impressive: the model achieved an average accuracy of 82.2% when classifying 30 different bacterial isolates. Remarkably, when the same CNN was used to classify bacteria into broader treatment groups and to detect antibiotic resistance, it achieved even higher accuracies of 97% and 89.1%, respectively [18]. The study also demonstrated the CNN’s superiority over traditional machine learning models like logistic regression and support vector machines.
While the CNN demonstrated strong performance, a limitation within its ResNet design held potential for further improvement. The filters in the architecture, analogous to magnifying glasses with a fixed zoom level, could only effectively analyze a specific range of peak sizes. However, Raman spectra contain peaks of varying widths—wide peaks need a “wider zoom” for proper analysis, while narrow peaks need a “closer zoom”. Having a fixed zoom across all CNN layers hinders the network’s ability to fully understand the complex patterns within the spectrum and accurately identify the bacteria.
To address this limitation, a subsequent study proposed using a CNN module that could analyze the spectrum at multiple scales [89]. This innovative approach builds upon the previous work, aiming to solve the fixed kernel size issue. It replaces a single, fixed “zoom level” with multiple branches, each with a progressively increasing kernel size. This functions like having a set of magnifying glasses with different zoom levels, allowing the CNN to capture both big-picture patterns and tiny details within the Raman spectrum. Each branch analyzes the spectrum at a different scale, capturing information from both broad and narrow peaks. This combined information provides a far richer understanding of the spectral data. Finally, the model refines these data and uses a fully connected layer to make the ultimate classification—identifying the specific type of bacteria present.
By leveraging this multiscale approach, the study successfully replicated the previous work using the Bacteria-ID dataset (identifying 30 bacterial isolates) and achieved a significant improvement in overall accuracy (86.7% compared to 82.2%). The improved model also excelled in classifying bacteria groups for treatment and antibiotic resistance analysis, achieving impressive accuracies of 98% and 92.7%, respectively.
4.1.2. RamanNet and Data Augmentation: Balancing Accuracy and Efficiency in Bacterial Detection
While the complex, multiscale CNN architecture described in the previous subsection successfully addressed the fixed zoom limitation, such models can be computationally demanding. For certain applications, a simpler CNN design optimized for the unique nature of Raman spectra might be advantageous. Given that Raman spectra are essentially one-dimensional representations of intensity variations across wavenumbers, they are inherently less complex than the multichannel image data that CNNs often excel in analyzing. This simplicity paves the way for effective yet computationally lightweight models.
Our next case study explores this concept, proposing a simplified CNN model specifically tailored for Raman spectra [100]. Often called “RamanNet”, this model incorporates key modifications. Firstly, it employs a simplified convolutional layer, utilizing a single layer with one kernel. This results in a reduced feature map (i.e., extracted information from the Raman spectra). Secondly, it reduces residual layers—instead of the usual six residual blocks in a standard ResNet, this model has only two. These modifications lead to a less complex CNN with the following advantages: (1) reduced model parameters, leading to decreased complexity; (2) faster training time; and (3) lower computational cost. In essence, RamanNet offers a balance between accuracy and efficiency, making it suitable for real-world applications where computational resources might be limited.
Utilizing the Ho et al. study’s Bacteria-ID dataset [18], the model demonstrates superior performance in detecting bacterial isolates, achieving an improved average accuracy of 84.7% compared to 82.2% in the previous work [100]. Additionally, it exhibits a high accuracy of 97.1% in identifying antibiotic treatments. However, when it comes to distinguishing antibiotic resistance (MRSA/MSSA) classes, RamanNet falls short of outperforming the baseline model, achieving an accuracy of 81.6% compared to 89.1%. This discrepancy may stem from the highly similar Raman spectra between MRSA and MSSA, posing a challenge for the simpler model to capture the nuanced differences effectively.
To demonstrate the power of data augmentation, consider the following study [89]. Faced with limitations in dataset size and diversity, the researchers strategically employed data augmentation to artificially expand their training data. They implemented four key techniques: (1) Gaussian noise, which introduced slight random variations in intensity values, mimicking potential noise during acquisition; (2) average blur, where variations in blurring were achieved by calculating new intensity values based on averaging with neighboring points using random filter sizes; (3) random dropping, simulating missing data points by “blanking out” small sections of the spectrum; and (4) randomly scaling the spectrum, where the overall intensity is randomly scaled up or down by a small factor. Importantly, while a spectrum had a 50% chance of augmentation, only one of the noise or blurring techniques was applied at a time, but they could be combined with dropping and scaling.
Utilizing this data augmentation method, the CNN model achieved a remarkable accuracy of 86.7% in classifying 30 bacterial isolates. The augmented model also achieved excellent accuracy of 98% and 92.7% in identifying bacterial treatment and MSSA/MRSA classification, respectively. This performance surpassed previous works [18], demonstrating the effectiveness of data augmentation. These results illustrate that data augmentation is a powerful tool for improving CNN performance in Raman spectral analysis, particularly when faced with limitations in dataset size and diversity.
Figure 3 provides a visual comparison of the three key CNN architectures discussed in this case study. Panel A shows the original ResNet-inspired CNN from Ho et al., with its multiple residual layers [18]. Panel B illustrates the multiscale 1D CNN approach from Deng et al., which addresses the fixed kernel size limitation [89]. Finally, Panel C depicts the simplified RamanNet structure from Zhou et al., designed for computational efficiency while maintaining high accuracy [100]. This visual comparison highlights the evolution of CNN designs in adapting to the unique challenges of Raman spectral analysis for bacterial identification.
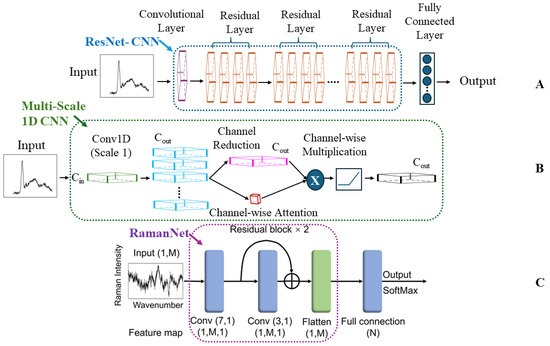
Figure 3.
Evolution of CNN architectures for Raman spectral analysis in bacterial identification. (A) ResNet-inspired CNN (Ho et al.), featuring multiple residual layers for deep learning [18]. (B) Multiscale 1D CNN (Deng et al.), incorporating various kernel sizes to capture features at different scales [89]. (C) RamanNet (Zhou et al.), a simplified architecture optimized for computational efficiency while maintaining high accuracy [100]. These architectures represent key advancements in applying CNNs to Raman spectroscopy for bacterial detection, highlighting the progression from complex deep networks to more specialized and efficient designs tailored for spectral data analysis.
4.1.3. A Comparative Analysis of CNN-Based Raman Approaches for Bacterial Diagnostics
Table 2 offers a detailed comparison of the pioneering CNN approaches explored in this case study, revealing their capabilities, limitations, and potential advantages in addressing the challenges of bacterial identification using Raman spectroscopy.
Table 2.
Optimizing CNN design for Raman spectroscopy.
The studies analyzed demonstrate the significant potential of CNNs to enhance bacterial identification using Raman spectroscopy. By overcoming the inherent challenges of Raman spectroscopy, CNNs achieve exceptional accuracy, even when discerning closely related pathogens and guiding antibiotic treatment decisions [18,62,87,96,101,102]. The evolution of CNN architectures, from the initial ResNet-inspired approach to the multiscale analysis and the computationally efficient RamanNet, reveals a drive towards increased precision and adaptability [87,89,100]. Additionally, the integration of SERS for signal enhancement and strategic data augmentation techniques demonstrates their combined power for enhancing model performance [62,87,96].
While CNN-based Raman spectroscopy offers significant advantages, ongoing efforts to address key challenges, such as limited dataset availability and the need for explainable models, will further enhance its potential. The availability of diverse, well-curated Raman spectral datasets of sufficient size remains crucial for developing robust, generalizable CNN models. Additionally, continued exploration of specialized CNN architectures tailored to the unique nature of Raman data could lead to further performance gains. To fully realize the potential of CNNs in clinical settings, a focus on standardization, the creation of user-friendly instruments, and the development of explainable models for spectral biomarker identification would be valuable for broader adoption. This need for explainability is particularly important in bacterial identification using Raman spectroscopy—interpreting how models arrive at their predictions is key to ensuring they have grasped the underlying scientific principles and guiding trust in their decisions. However, CNNs often suffer from being a “black box”, hindering full confidence in their decision-making process [104,105]. To address this challenge, techniques like gradient-weighted class activation mapping (Grad-CAM) offer a promising solution [89,106,107]. By carefully analyzing how the model makes decisions, Grad-CAM creates a special map that highlights the most important parts of the Raman spectrum for identifying bacteria. Grad-CAM pinpoints the most important spectral regions for identifying bacteria, revealing the features that guide the model’s classification. By visualizing this map, we can see the specific “fingerprints” within the spectrum that guide the model’s choices.
This case study demonstrates how CNNs effectively address the challenges of complex spectral data and low signal-to-noise ratios, offering significant potential in transforming infectious disease management and advancing our understanding of the microbial world. Building upon the power of CNNs, their combination with advanced signal enhancement techniques like SERS promises even greater precision in bacterial analysis. This integration is especially crucial for scenarios where sensitivity is pivotal, like detecting trace amounts of pathogens or subtle spectral variations signifying antibiotic resistance. Case Study II delves into the ways SERS empowers ML-driven Raman spectroscopy.
4.2. Case Study II: Enhancing Bacterial Detection by SERS
Delayed or inaccurate bacterial identification can have devastating consequences. In the treatment of a sepsis case, every hour without appropriate antibiotics increases the mortality risk. For foodborne outbreaks, rapid pathogen detection is key to preventing widespread illness. Yet, traditional methods often lack speed or specificity. SERS combined with machine learning promises a revolution in bacterial identification, offering unparalleled sensitivity and the power to unlock subtle markers for accurate classification.
4.2.1. SERS: Unlocking Precision in Clinical Diagnostics
In clinical settings, precise bacterial identification is paramount. Incorrect or delayed diagnoses lead to ineffective treatments and the potential for disease spread, and they contribute to the rise of antibiotic resistance. This rise, particularly in pathogens like Staphylococcus aureus (MRSA), necessitates rapid diagnostics to guide targeted therapy. SERS-ML offers the potential to pinpoint subtle biomarkers, not only distinguishing between closely related species but also revealing antibiotic resistance profiles. Previous studies by Ho et al. and Deng et al. demonstrated this, achieving accuracies of 89% and 92.7%, respectively, in MSSA/MRSA identification [18,89].
Tseng et al. address this challenge with a SERS-ML approach remarkable for its focus on clinical realism [59]. Unlike many studies relying on lab-grown bacteria or augmented data, they amassed 11,774 SERS spectra from bacteria isolated directly from blood cultures. This focus on clinical realism sets Tseng et al.’s study apart, ensuring their model is trained on the complexity of real-world infections. Demonstrating the power of this approach, they achieved a 98.5% accuracy in distinguishing MRSA from MSSA, highlighting the technique’s potential to guide antibiotic choice.
Their SERS-ML workflow begins with meticulous data preparation. By removing background fluorescence, focusing on the 400–2000 cm−1 region, and normalizing spectra, they ensure a clean and consistent dataset for training their machine learning model. This preprocessing is crucial because SERS signals can be complex. To tackle the intricate task of bacterial identification, the model works in a hierarchical manner. First, it distinguishes between Gram-positive and Gram-negative bacteria, providing crucial information for antibiotic choice. Next, it pinpoints the specific species, increasing accuracy. Finally, and most impressively for S. aureus, the model even detects antibiotic resistance—a capability with transformative potential for effective clinical decisions.
To tackle the complexity of these real-world SERS spectra, Tseng et al. utilized an innovative deep learning approach—the vision transformer (ViT) [59]. This architecture offers a wider field of view than traditional CNNs, making it particularly adept at identifying subtle differences in bacterial fingerprints. The ViT model achieves its breakthrough by combining a wider perspective with a powerful self-attention mechanism. Figure 4 demonstrates the difference between the CNN and ViT architectures. Unlike a CNN, which focuses on localized features, the ViT processes the SERS spectrum in smaller patches. This allows it to analyze both fine details and overarching patterns within the spectral data. The self-attention mechanism empowers the model to determine how different regions within the SERS spectrum relate to each other. This enables it to automatically focus on the most relevant areas for accurate bacterial identification. Furthermore, since SERS spectra are essentially one-dimensional sequences of intensity values, the ViT’s architecture is particularly well suited for this type of analysis. This design’s similarity to models used in natural language processing contributes to the ViT’s success in handling spectral data.
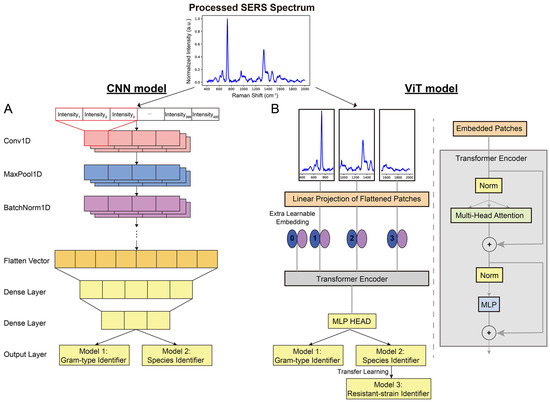
Figure 4.
Decoding bacterial identity: CNN vs. ViT. (A) In the traditional CNN architecture, convolutional and pooling layers extract features and reduce dimensionality. (B) The innovative ViT breaks the SERS spectrum into patches. Its self-attention mechanism analyzes both broad and detailed spectral patterns, enhancing its ability to distinguish subtle bacterial differences. Reprinted with permission from Yi-Ming Tseng, Ko-Lun Chen, Po-Hsuan Chao, et al., Applied Materials, 2023. Copyright 2023, American Chemical Society [59].
The researchers found that the ViT model outperformed the CNN in identifying bacterial species, especially for Enterobacter cloacae and Klebsiella Pneumoniae. The ViT’s self-attention mechanism and suitability for 1D sequence data contribute to its success. These advantages led to higher accuracies in both Gram typing (99.30%) and species identification (97.56%). Furthermore, the ViT model excels in identifying antibiotic-resistant strains like MRSA, even with limited data. By using transfer learning, it leverages knowledge from a pretrained model to achieve 98.5% accuracy, significantly faster and without overfitting. This capacity for rapid and accurate antibiotic resistance detection is particularly valuable in clinical settings. While designed for specific species, the ViT can still determine Gram type for unknown bacteria, providing doctors with vital information for rapid antibiotic selection.
Furthermore, Ciloglu et al. demonstrated the potential of SERS-ML in diagnosing antibiotic resistance by focusing on methicillin-resistant Staphylococcus aureus (MRSA) [108], a bacteria known for causing difficult-to-treat infections [109]. They used a deep learning algorithm to analyze a collection of 33,975 unique signals (spectra). Figure 5 illustrates the normalized mean spectra of MRSA and MSSA, revealing similar peak positions but distinct differences in relative band intensities.
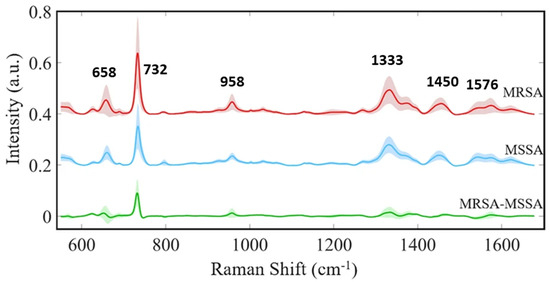
Figure 5.
SERS-based discrimination of MRSA and MSSA. Subtle spectral variations distinguish MRSA from MSSA. Key peaks reveal subtle structural variations associated with antibiotic resistance, particularly the prominent 732 cm−1 band in MRSA, linked to changes in the peptidoglycan layer. These distinct spectral features enable machine learning algorithms to accurately differentiate between these clinically significant bacterial strains. Reproduced with permission from Fatma Uysal Ciloglu et al., Scientific Reports, 2021. Copyright 2021 [108].
Both spectra exhibit strong bands at 658 cm−1 (COO− deformation of guanine), 732 cm−1 (flavin adenine dinucleotide derivatives and glycosidic ring mode of peptidoglycan components), 958 cm−1 (CN deformation of saturated lipids), 1333 cm−1 (C-N stretching of adenine), 1450 cm−1 (CH2 deformation of saturated lipids), and 1576 cm−1 (CN stretching of amide II) [58,108,110,111,112]. Notably, the 732 cm−1 peak exhibits significantly increased intensity in MRSA, potentially indicating alterations in the peptidoglycan layer associated with antibiotic resistance. This finding aligns with previous research demonstrating differences in cell wall thickness between MRSA and MSSA [113]. Additionally, minor intensity variations at 658, 958, and 1333 cm−1 suggest differences in the biomolecular composition within the cell wall. These subtle spectral distinctions provide crucial information for machine learning algorithms to accurately classify MRSA and MSSA, underscoring the power of SERS-ML to detect minute structural changes linked to antibiotic resistance. This technology holds potential for rapid and precise bacterial identification in clinical settings, aiding in timely and appropriate antibiotic selection to combat the growing threat of resistant pathogens.
4.2.2. SERS: A Transformative Toolkit for Microbiology
A compelling example demonstrates how SERS can uncover hidden biological information. Bacteria possess a unique outer layer called the extracellular matrix (ECM). This ECM, analogous to a personalized jacket, holds clues to the bacteria’s identity. Leong et al.’s novel approach avoids analyzing the bacteria directly, as their presence can be masked by the ECM [60]. Instead, they use a special chemical probe (4-mercaptopyridine, MPY) that interacts with this outer layer. This interaction produces a unique signal, similar to how different fabrics reflect light in distinct ways. By analyzing these signals with ML tools, researchers can uncover a wealth of information about the ECM’s makeup—everything from its overall charge to the specific molecules present. Since different bacterial species have unique ECMs, this “chemical fingerprint” allows for accurate classification, even within the complexities of natural environments. Figure 6A illustrates the mechanism of SERS-based bacterial ECM surface chemotaxonomy.
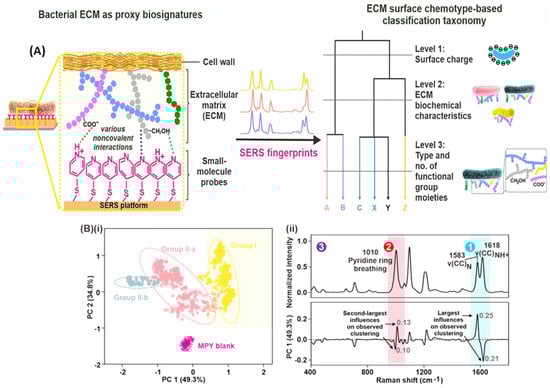
Figure 6.
Decoding bacterial identity with SERS. (A) SERS-based bacterial surface chemotaxonomy: Researchers use the special chemical probe 4-mercaptopyridine (MPY) to interact with the bacteria’s outer layer (ECM). This creates a unique spectral fingerprint for each species. (B) Machine learning reveals hidden patterns. (i) Unsupervised clustering of SERS spectra groups bacteria with similar ECM compositions. (ii) Key spectral features (top) and their influence on clustering (bottom) are highlighted, revealing the chemical distinctions between bacteria at different classification levels. Reprinted with permission from Shi Xuan Leong, Emily Xi Tan, Xuemei Han, et al., ACS Nano, 2023. Copyright 2023, American Chemical Society [60].
First, researchers used a silver nanocube array coated with a special chemical (MPY) to interact with the bacteria’s outer layer (ECM). This creates a unique signal for each bacterial species. To make sense of these complex spectral fingerprints, researchers turned to powerful machine learning techniques.
Specifically, they used unsupervised machine learning techniques—hierarchical clustering (HC) and principal component analysis (PCA). HC and PCA serve as powerful pattern recognition tools. HC sorted the spectra into groups based on similarity, revealing different levels of detail about the bacteria. Level 1 separated the bacteria broadly. Level 2 made finer distinctions, and Level 3 pinpointed the individual species. PCA worked similarly, visually organizing the bacteria into clusters that matched the HC groupings (Figure 6B). Importantly, these unsupervised models worked without any prior knowledge about the bacteria. The fact that they successfully sorted species demonstrates that each bacterial ECM interacts with the MPY probe in a unique way, producing a distinct SERS fingerprint.
Here is a breakdown of how researchers revealed these hidden patterns. In Level 1, the researchers found that the bacteria’s surface charge influences their SERS spectra. Bacteria with a more negative surface charge interact strongly with the MPY probe, altering the balance between different forms of MPY. This change is reflected in the strength of specific peaks within the SERS signal. In Level 2, subtle differences in the bacteria’s overall ECM chemical makeup cause shifts in specific SERS peaks of the MPY probe. Researchers used simulations to show that bacteria with exopolysaccharides that interact more strongly with MPY exhibit larger shifts in these peaks. In Level 3, the entire SERS spectrum acts as a unique fingerprint for each bacterium. Subtle differences in the bacteria’s ECM, including specific molecules and their arrangement, create these distinctive spectral patterns. Computer simulations supported the idea that different ECM compositions interact with the MPY probe in unique ways, leading to species-level distinctions.
Finally, the researchers used a supervised machine learning technique called a random forest classifier to analyze the complex SERS fingerprints. This model works like a decision tree, sorting the spectra based on key differences. After training on a large dataset, their model achieved over 98% accuracy in identifying all six bacteria. To ensure reliable results, they ran the test one hundred times with varying data, consistently obtaining high accuracy. The model pinpointed specific regions within the SERS signal that revealed the most significant differences between ECMs. A model built without the MPY probe performed poorly, highlighting a key point: the MPY amplifies subtle distinctions in the bacteria’s ECM, creating a much clearer fingerprint for the machine learning classifier. This demonstrates the power of their approach for accurate, rapid bacterial identification.
This work demonstrates that SERS coupled with machine learning has the potential to revolutionize how we classify and understand bacteria in diverse environments. Its ability to uncover subtle biological differences, as demonstrated by Leong et al. [60], positions SERS as a cornerstone in revolutionizing microbiology research and its applications. Beyond purely diagnostic applications, researchers are harnessing the power of SERS in other critical areas like food safety.
For example, Yan et al. developed a SERS-based test for the rapid detection of E. coli O157:H7 contamination in food [52]. This test uses tiny nanoparticles with antibodies that specifically target the bacteria. If E. coli is present in a liquid sample, the nanoparticles attach, creating a unique signal that indicates both its presence and its concentration. Notably, the study stands out as a unique example of applying machine learning for quantitative pathogenic bacteria detection using SERS, highlighting a current gap in the field where most studies focus on classification tasks. To analyze the complex data and accurately predict bacterial load, researchers employed a powerful pattern-finding algorithm called extreme gradient-boosting regression (XGBR). This model, surpassing the accuracy of traditional methods, demonstrated the exceptional sensitivity of SERS for rapid, point-of-care pathogen detection, highlighting the potential of regression-based approaches for addressing quantification challenges in SERS-ML research.
Overall, these studies spotlight SERS as a robust toolkit, ready to address challenges in clinical diagnostics and food safety and to expand our fundamental understanding of bacteria. This potential is due to its unparalleled sensitivity and specificity. Far beyond simple laboratory analysis, SERS’s ability to unlock hidden biological information positions it as a cornerstone in revolutionizing microbiology research and its applications.
4.2.3. Comparison of SERS-ML Approaches
While each of the studies examined displays the power of SERS-ML, their approaches differ significantly. Table 3 provides a side-by-side comparison, highlighting variations in experimental design, machine learning algorithms, and their specific strengths. This diversity in approaches underscores the flexibility of ML in SERS interpretation. Traditional ML methods remain valuable tools alongside cutting-edge deep learning models, offering complementary ways to extract powerful insights from complex spectral data. Examining these differences can assist future researchers in selecting the most appropriate methods and techniques for their specific applications.
Table 3.
A Guide to SERS-ML approaches: experimental design, algorithms, and strengths.
To aid researchers seeking optimal Raman spectroscopy parameters for their bacterial samples, we compiled the comprehensive Table A1 in Appendix B. This table details the key experimental settings (including excitation wavelength, spectral range, grating, and acquisition time) used in each of the 32 analyzed studies. By referencing this table, researchers can gain insights into effective parameter choices and tailor their own Raman/SERS-ML experiments for bacterial identification accordingly.
While the analyzed studies demonstrate the power of SERS-ML for bacterial identification, several key challenges and areas for advancement emerge. Careful preprocessing of SERS spectra is essential for maximizing accuracy. This crucial step involves denoising, baseline subtraction, normalization, outlier removal, dimensionality reduction, and peak alignment [116,117]. Techniques such as the Savitzky–Golay filter and wavelet denoising reduce electronic noise and cosmic ray artifacts, while baseline subtraction methods like polynomial fitting or asymmetrical least squares eliminate contaminating signals from instruments and substrates. Normalization, often through vector normalization, enables cross-experiment comparisons by accounting for variations in setup and sample preparation. Further refinement involves outlier removal and dimensionality reduction, with techniques like Principal component analysis (PCA) helping to distill essential spectral features. Peak alignment ensures consistency, particularly when comparing different samples or experimental conditions. Crucially, applying consistent preprocessing steps and parameters across all data is essential for valid quantitative comparisons. Researchers can utilize various software libraries such as Raman Processor (MATLAB, open-source, MIT license); OriginPro 2024b (OriginLab Corporation); LabSpec 6 (HORIBA); RamPy (Python, open-source, GNU GPL v2), Scipy.signal (Python, open-source, BSD license), and chemospec (R, open-source, GPL-3); and hyperspec (R, open-source, GPL-3) to facilitate these processes. This comprehensive preprocessing approach maximizes the accuracy and reliability of machine learning outcomes in Raman/SERS-based bacterial identification and related applications.
The choice of Raman excitation wavelength, along with techniques for processing spectra like Savitzky–Golay smoothing and standard normal variate, significantly reduce noise and enhance informative signals [61]. Though time-consuming, particularly for large datasets, researchers are constantly refining these preprocessing methods for efficiency. Reproducibility is another concern, as SERS results are sensitive to several factors that include variations in substrates, nanoparticles, and experimental protocols. Developing standardized SERS substrates and protocols and exploring low-cost substrate innovations will enhance reproducibility across different laboratories and applications. Furthermore, the transition from pure cultures to clinical samples poses challenges for SERS-based bacterial detection due to the complex spectral contributions from clinical matrices like blood, urine, or sputum. These matrices can mask bacterial signals, hindering accurate identification. The growth media components, including salts, nutrients, and metabolites, can further complicate the spectra by interacting with bacterial cells and SERS substrates. To address this, researchers have developed various strategies. Boardman et al. demonstrated a combined sample preparation and SERS detection method for identifying bacteria in whole blood, achieving high specificity and sensitivity for E. coli and S. aureus [118]. Similarly, Sivanesan et al. employed a bimetallic SERS substrate to enhance bacterial signals in blood for selective identification [119]. Furthermore, multivariate data analysis has proven crucial in distinguishing bacterial signals from media effects. Premasiri et al. showed that different bacterial species, including Klebsiella pneumoniae, E. coli, Pseudomonas aeruginosa, Enterococcus faecalis, and two strains of S. aureus all grown in the same growth medium (i.e., tryptic soy broth (TSB) except for K. pneumoniae, which was grown in nutrient broth (NB)) exhibit distinct SERS spectra, while the same species maintains its characteristic spectrum across different media [120]. Their study also highlighted the importance of proper washing procedures in removing medium contributions. This combined approach, leveraging both sample preparation techniques and multivariate analysis, significantly improves the reliability of SERS-based bacterial detection in complex clinical samples.
Addressing these limitations holds the key to unlocking the full potential of SERS-ML, transforming bacterial identification across research, clinical, and industrial settings. From the precision of clinical diagnostics to ensuring food safety, SERS offers unparalleled sensitivity and specificity. Its ability to unlock hidden biological information, like the subtle taxonomic distinctions revealed in the Leong et al. study [60], positions it to revolutionize our understanding of the microbial world. To achieve widespread adoption, SERS reproducibility and standardized substrates must be addressed. Additionally, creating extensive, shared spectral libraries will empower researchers to develop even more advanced ML models. By continuing to address these key challenges, SERS-ML is poised to become a cornerstone of microbiology research, driving breakthroughs in clinical care, food safety, and fundamental bacterial classification.
While Case Studies I and II demonstrated impressive precision, real-world samples are not always ideal. Case Study III explores how ODL not only expands datasets but also combats noise and complexity to ensure reliable results, making the transition to real-world applications smoother.
4.3. Case Study III: Tackling Data Challenges and Expanding Raman Spectroscopy with ODL Techniques
While CNNs excel in Raman spectroscopy, ODL offers unique advantages for tackling core challenges and expanding its potential. These techniques go beyond simply augmenting datasets. Notably, ODL methods can handle real-world spectral noise, ensuring reliable results even in less-than-ideal conditions. Additionally, they can detect subtle spectral shifts critical for applications like early disease detection. While Raman spectroscopy holds promise for early cancer detection, the difficulty of gathering large patient datasets can hinder model development [121]. A major hurdle in applying Raman spectroscopy clinically, especially for conditions like early-stage cancer, is limited datasets. Several innovative studies have employed techniques like generative adversarial networks (GANs) to augment spectral data. This paves the way for reliable models even when gathering numerous patient samples is difficult.
4.3.1. Expanding Raman’s Reach with Limited Data
Previous studies utilized 72,000 and 4200 datasets to build the CNN model for microbial identification [18,103]. However, clinicians rarely have access to such large datasets. To make this model applicable for real-world applications, we need to overcome this challenge. Liu et al. and Yu et al. successfully overcame this challenge by implementing GAN augmentation to deliver accurate taxonomic results with fewer samples [88,122]. GAN-based methods offer a solution to the challenge of limited datasets in Raman spectroscopy. GAN augmentation works by generating realistic synthetic spectra that closely mimic real ones. This expands the training dataset available to the model. With more “examples” to learn from, even if they are generated, the model becomes better at identifying the subtle patterns that distinguish different pathogens. This approach enables reliable classification while minimizing the need for laborious and costly data collection [123].
Figure 7 illustrates the GAN architecture, a deep learning framework where two neural networks (the generator, G, and discriminator, D) engage in an adversarial process to create and distinguish realistic data [124]. In this framework, the generator attempts to produce realistic spectra while the discriminator differentiates between real and generated examples. This ongoing competition drives the GAN to progressively improve its understanding of real data patterns.
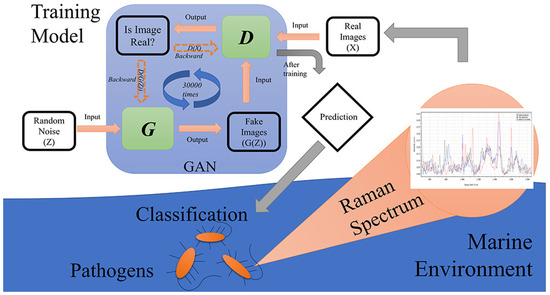
Figure 7.
Simplified GAN structure for Raman spectra augmentation. Reproduced with permission from Shixiang Yu, Hanfei Li, Xin Li, Yu Vincent Fu, and Fanghua Liu, Science of The Total Environment, 2020. Copyright 2020, Elsevier [88].
Yu et al. successfully leveraged GANs to address the challenge of limited spectral datasets common in Raman spectroscopy [88]. They designated a small subset of spectra (50 in this case) for each pathogen strain as training data, with additional spectra held for testing. By creating a labeled dataset (target strain spectra labeled “1”, all others “0”), the GAN could generate realistic spectra to augment the training data, ultimately boosting model performance and enabling accurate pathogen classification.
The model successfully pinpointed spectral regions between 800–850 cm−1 and 1400–1450 cm−1 wavenumbers as particularly important for differentiating between pathogen types. These findings could significantly improve marine pathogen monitoring. By focusing the analysis on the specified regions, faster and more efficient Raman tests for water quality or outbreak detection could be developed. Additionally, the success of this GAN-based approach in the marine context demonstrates its potential for broader diagnostic applications where sample collection is challenging.
While GAN models offer significant advantages, they can face stability challenges. To address these limitations and further enhance resolution, Liu et al. adopted the progressive growing of GANs (PGGAN) approach—a technique known for increasing stability and generating highly detailed images [122,125]. PGGAN functions similar to a skilled artist sketching a Raman spectrum, starting with a rough outline and progressively adding layers of detail. This refinement process allows the GAN to learn the spectrum’s overall structure before focusing on the finer nuances. Building upon this approach, Liu et al.’s study combined PGGAN with ResNet to generate a high-resolution Raman spectral dataset, leading to a powerful taxonomic model [122].
The researchers began with low spatial resolution (12 pixels) for both the generator (G) and discriminator (D) (Figure 8A). As training progressed, they incrementally added layers, increasing the resolution to 768 pixels. This gradual approach enables the model to learn the big picture of the data before getting into the finer details. Ultimately, the GAN-produced spectra become virtually indistinguishable from real ones (Figure 8B), greatly expanding the dataset while drastically reducing the time needed for collecting real-world spectral data.
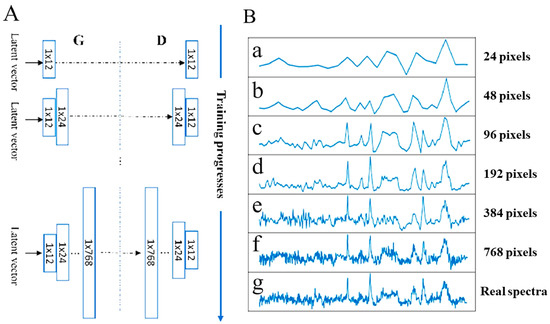
Figure 8.
Accelerating Raman spectroscopy with PGGAN. (A) The PGGAN training process for Fictibacillus sp. spectra generation. (B) Generated spectra become increasingly indistinguishable from real spectra (g) as resolution increases. Reproduced with permission from Bo Liu, Kunxiang Liu, Nan Wang, Kaiwen Ta, Peng Liang, Huabing Yin, and Bei Li, Talanta, 2022. Copyright 2022, Elsevier [122].
The study utilized the ResNet architecture developed by Ho et al. (refer to Figure 2) [18]. This ResNet model achieved a remarkable 99.8% accuracy in identifying bacterial species. This combined method addresses the need for large datasets and handles low-quality spectra. It enables rapid, non-invasive identification of individual bacterial cells, with the potential for cell sorting using microfluidics. The simplified sample preparation makes it ideal for challenging in-field analysis in microbiology and health care. However, the versatility of ODL extends far beyond the identification of microbes. Let us explore how researchers are applying these techniques to diverse challenges across the Raman spectroscopy landscape.
4.3.2. Beyond Bacteria: ODL Tackles Diverse Raman Applications
From the depths of the ocean to the intricacies of plant biology, ODL is transforming how we use Raman spectroscopy. Qin et al.’s and Pérez et al.’s studies highlight ODL’s remarkable power across diverse fields [98,126]. In medicine, Qin et al. demonstrate the potential to revolutionize disease diagnosis [98]. By analyzing extracellular vesicles (EVs), which function as potent “weapons” during infections [127], researchers achieved unprecedented accuracy in pinpointing EVs [98]. This groundbreaking work paves the way for advanced EV-based diagnostic tools, enabling early detection and targeted treatment of bacterial infections. Though challenges like isolating individual EVs from clinical samples remain, ODL’s unique capabilities position it to overcome such hurdles. Similarly, Pérez et al. show how ODL–Raman systems could revolutionize precision agriculture [126]. By detecting subtle changes caused by bacterial canker in tomato plants, farmers could intervene earlier, limiting disease spread and protecting yields.
Qin et al. combined the power of Raman spectroscopy with the innovative attentional neural network (aNN), achieving unprecedented accuracy in identifying EVs from different pathogens [98]. Inspired by how humans selectively focus on important visual details, the aNN utilizes attention mechanisms to prioritize the most informative spectral regions [128]. Figure 9a illustrates how this process functions. The aNN begins by analyzing a Raman spectrum of a sample suspected to contain EVs. Convolution modules function as smart filters, highlighting crucial patterns. Next, powerful attention modules refine the analysis by directing the model’s focus to the most informative spectral regions for distinguishing EVs. The aNN’s classifier then leverages this information to determine not only the type of bacteria present (e.g., Gram-positive or Gram-negative) but also the specific species, drug-resistance status, and even growth stage. This remarkably detailed identification has the potential to revolutionize infection diagnosis, leading to faster and more effective treatment decisions.
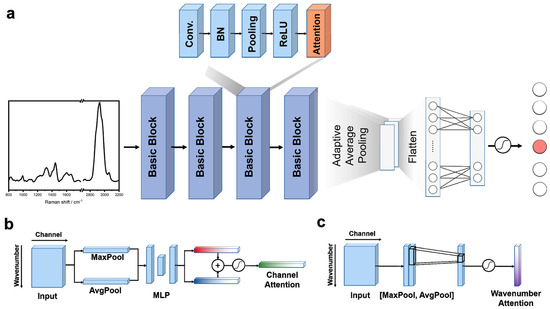
Figure 9.
Inside the aNN: from spectrum to EV identification. (a) aNN architecture: The aNN extracts intricate spectral patterns with four convolution modules. Attention modules then refine the analysis, zeroing in on the most important regions for EV identification. A classifier leverages this focused information to deliver remarkably detailed results. (b) Channel attention: Pinpointing key frequencies in the Raman spectrum, channel attention guides the aNN towards crucial clues for EV identification. (c) Wavenumber attention: Zeroing in on subtle molecular shifts, wavenumber attention reveals the hidden fingerprints that distinguish different EVs. Reprinted with permission from Yi-Fei Qin, Xin-Yu Lu, Zheng Shi, et al., Analytical Chemistry, 2022. Copyright 2022, American Chemical Society [98].
The attention module itself employs two key mechanisms (Figure 9b,c). Channel attention identifies important signal frequencies within the Raman spectrum, while wavenumber attention pinpoints subtle molecular shifts. It does this by highlighting the most relevant parts of the data, similar to how a magnifying glass zooms in on specific details. This focused analysis allows the aNN to accurately identify differences between EVs, even when those differences are very small.
Qin et al. demonstrated the immense potential of combining Raman spectroscopy with the aNN for high-precision EV analysis [98]. The model’s ability to classify EVs by species, antibiotic resistance, and even growth stage establishes a new benchmark for accuracy. This groundbreaking work paves the way for advanced EV-based diagnostic tools, enabling the early detection and targeted treatment of bacterial infections. While challenges remain in isolating individual EVs from clinical samples, the foundation laid by Qin et al.’s study, combined with advancements in Raman technology, brings this transformative diagnostic approach closer to reality.
The success of ODL in tackling the complexities of bacterial EVs highlights its adaptability for diverse biological challenges. Inspired by this potential, Pérez et al. applied Raman spectroscopy to combat a destructive plant disease: bacterial canker of tomato [126]. This disease severely impacts global tomato production, and early detection is key to limiting its spread. However, traditional diagnostics are often slow and unreliable, especially since the disease can remain latent. Pérez et al. explore how Raman spectroscopy can detect subtle biochemical changes caused by the pathogen, promising a fast, non-invasive solution for the early identification even in asymptomatic plants.
Researchers collected a total of 297 Raman spectra from both healthy (120) and infected but asymptomatic (177) tomato plants using a 785 nm excitation laser micro-Raman spectrometer. To ensure accurate analysis, they carefully prepared the data by removing background fluorescence to isolate true plant signals and using “standard normal variate (SNV)” normalization to minimize unrelated variations. These refined data were then analyzed with PCA (principal component analysis) to pinpoint the key spectral differences between healthy and infected plants. PCA functions as a pattern recognition tool, aiding researchers in identifying spectral features that distinguish between healthy and infected plants (see Figure 10).
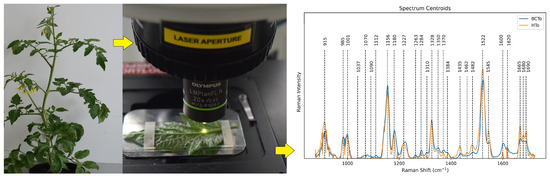
Figure 10.
Workflow for transforming Raman spectra into disease detection. Normalized spectra reveal subtle differences between healthy (HTo) and infected (BCTo) plants. Key compound wavenumbers (dashed lines) highlight potential disease markers. Reprinted from Moisés Roberto Vallejo-Pérez et al., Plants, MDPI 2021. Copyright 2021 [126].
To build a dependable predictive model, the researchers split their spectral data into training (70%) and testing (30%) sets.They implemented PCA to extract the most prominent features and then evaluated two classifiers—a multilayer perceptron (MLP) neural network and a traditional linear discriminant analysis (LDA) model. This double check ensured their disease detection method was not algorithm-dependent.
Both classification models (i.e., MLP and LDA) successfully differentiated healthy and infected plants. However, the MLP neural network slightly outperformed LDA, demonstrating its ability to handle non-linear patterns within the spectral data. Overall, the study highlights the power of Raman spectroscopy, combined with ML, to revolutionize disease management by enabling the early detection of bacterial canker in tomatoes. The success of both the bacterial EV analysis [98] and the plant disease detection [126] studies underscores the remarkable versatility of ODL techniques in Raman spectroscopy. To further highlight the benefits and potential applications of these techniques, let us examine them in a table format, exploring factors like the challenge solved, target identification, and clinical potential.
4.3.3. A Comparative Analysis of ODL Techniques for Raman-Based Bacterial Analysis
Table 4 provides a valuable guide for researchers seeking appropriate ODL techniques, highlighting their strengths and potential applications across diverse Raman-based bacterial analysis scenarios. This comparative analysis can aid in technique selection and the development of new ODL–Raman solutions.
Table 4.
Overcoming Raman spectroscopy challenges with other deep learning techniques.
Table 4 emphasizes the versatility of ODL techniques, demonstrating how they can overcome challenges ranging from small datasets [88,122] to handling complex samples [98] and the demand for precise disease detection [126]. While these techniques demonstrate immense promise in Raman spectroscopy, acknowledging current limitations is key for future progress. Despite techniques like GANs for data augmentation, sizable datasets remain a hurdle in some applications. Translating ODL–Raman solutions into real-world clinical practice requires standardization and robust validation on diverse samples. Additionally, research into computationally efficient ODL models tailored for Raman spectroscopy, along with explainable methods, is crucial. Understanding ODL model decisions will build trust within the clinical community and aid in identifying the spectral biomarkers that drive disease detection. The future holds exciting potential for hybrid techniques, novel applications like in situ monitoring and personalized medicine, multimodal diagnostics, and the development of accessible, user-friendly Raman–ODL instruments. This case study highlights ODL’s potential to address core challenges in Raman spectroscopy, positioning it to revolutionize various fields through data augmentation, robust real-world sample handling, and the identification of subtle spectral signatures.
5. Limitations and Future Directions
While the integration of machine learning with Raman spectroscopy demonstrates extraordinary potential, it is crucial to acknowledge its current limitations and chart a path for overcoming those challenges. To fully realize its transformative impact, the field must address dataset scarcity and lack of standardization and promote explainable AI methodologies.
- Data challenges: The development of robust, accurate models often depends on substantial, well-curated, and harmonized datasets. Initiatives for multi-institutional data sharing through accessible repositories with standardized metadata are essential to address smaller dataset limitations. Exploration of techniques like transfer learning and data augmentation also holds promise.
- Standardization: The lack of standardized protocols for sample preparation, spectral acquisition, and data analysis hinders reproducibility and clinical translation. Establishing best practices and guidelines will ensure reliable results across different laboratories and applications.
- Limited focus on quantification: Our review reveals a predominant focus on classification tasks in pathogen detection, highlighting an opportunity for further research into regression-based approaches for quantifying bacterial load. The study by Yan et al., as highlighted in Case Study II, demonstrates the potential of machine learning to accurately predict bacterial concentration using SERS, underscoring a promising avenue for future exploration.
- Explainable AI: While certain deep learning models deliver exceptional results, achieving a clear understanding of their decision-making processes remains a challenge. Developing explainable AI techniques, such as Grad-CAM, is vital for building trust in ML–Raman solutions, especially within the clinical context.
By focusing research efforts on these core areas, researchers can unlock the full potential of ML–Raman to revolutionize our approach to infectious diseases, food safety, and fundamental biological research. Recalling the challenges outlined in the Introduction, it is these limitations that often impede the translation of promising research into real-world applications.
The future of ML–Raman is immensely bright, with exciting potential for transformative advances in several areas:
- Open questions: The case studies examined highlight exciting open questions for future research. These include the development of ODL architectures specifically tailored for Raman spectroscopy, computationally efficient models for real-time applications, and the pursuit of spectral biomarkers for early disease detection.
- Multimodal analysis: Integrating Raman spectroscopy with complementary techniques like microfluidics and mass spectrometry paves the way for comprehensive analysis. This offers richer insights into bacterial phenotypes, antibiotic resistance mechanisms, and single-cell dynamics—areas crucial for combating the AMR crisis.
- Harnessing GenAI’s potential: The integration of cutting-edge generative AI (GenAI) models holds significant promise for Raman spectroscopy and microbiology. These models can further enhance data generation, aid in spectral interpretation, and potentially uncover novel biological insights.
- Cross-field collaboration: Fostering interdisciplinary collaboration between experts in Raman spectroscopy, machine learning, and microbiology is paramount. By combining diverse knowledge and expertise, researchers can develop innovative ML–Raman solutions tailored to address specific biological challenges and clinical needs.
The studies analyzed in this review powerfully demonstrate the transformative capabilities of machine learning in Raman spectroscopy. By critically addressing limitations, harnessing emerging technologies, and promoting cross-field collaboration, we can solidify the role of ML–Raman as a cornerstone of microbiology, ultimately improving patient outcomes and safeguarding global health.
6. Conclusions
This review journeyed through the groundbreaking synergy of machine learning and Raman spectroscopy for bacterial identification, revealing its transformative potential to revolutionize how we diagnose infections, ensure food safety, and understand the microbial world.
Case Study I established the potential of CNNs to revolutionize clinical diagnostics. Their ability to handle complex spectral data and pinpoint subtle biomarkers for antibiotic resistance underscores their potential impact on treatment decisions and the fight against AMR. Building upon those foundations, Case Study II delved into the power of SERS. By amplifying the Raman signal, SERS enables the detection of trace pathogens and offers unparalleled sensitivity for scenarios like food safety and early-stage disease detection. Finally, Case Study III highlighted the potential of other deep learning techniques. These innovative methods address challenges like limited datasets through techniques like GANs and extract insights from complex samples, greatly expanding the applications of Raman spectroscopy.
Throughout these case studies, the challenges and opportunities for advancement within the field became increasingly clear. The availability of diverse, well-curated Raman datasets, the standardization of experimental protocols, and the pursuit of explainable AI models are crucial areas for further development. However, the potential impact of addressing these challenges is immense. Imagine a future where ML–Raman enables the following:
- Rapid point-of-care diagnostics: Clinicians, equipped with portable, ML-powered Raman devices, can swiftly identify the cause of an infection and determine the most effective antibiotic, preventing needless delays and improving patient outcomes.
- Precision-guided food safety: Rapid ML-SERS-based tests screen food production lines for harmful bacteria, overcoming adaptability challenges to safeguard consumers and prevent costly outbreaks.
- Decoding the microbial world: Researchers harness the power of ML and Raman to unlock insights into complex bacterial communities, unraveling the mysteries of microbial ecosystems and their impact on the environment and human health.
The integration of machine learning and Raman spectroscopy is not simply about improving existing technologies—it holds the key to fundamentally transforming how we diagnose infections, protect our food supply, and understand the world around us. This burgeoning field demands continuous research and innovation to fully realize its transformative potential. The field is poised for rapid progress and invites researchers, clinicians, and innovators to join this revolutionary journey.
Author Contributions
Conceptualization, M.H.-U.R. and V.G.; methodology, M.H.-U.R.; validation, M.H.-U.R., R.S., M.T., M.Z., E.G.Z., B.K.J., A.B.D., T.Y. and V.G.; formal analysis, M.H.-U.R.; investigation, M.H.-U.R.; resources, V.G.; data curation, M.H.-U.R.; writing—original draft preparation, M.H.-U.R.; writing—M.H.-U.R., R.S., M.T., M.Z., E.G.Z., B.K.J., A.B.D., T.Y. and V.G.; visualization, M.H.-U.R. and R.S.; supervision, V.G.; project administration, V.G.; funding acquisition, V.G. All authors have read and agreed to the published version of the manuscript.
Funding
Gadhamshetty’s group acknowledges the support from National Science Foundation (NSF) RII FEC awards #1849206 and #1920954, and NSF CBET award #1454102. Gnimpieba acknowledges support from the Institutional Development Award (IDeA) from the National Institute of General Medical Sciences of the National Institutes of Health (P20GM103443).
Institutional Review Board Statement
Not applicable.
Informed Consent Statement
Not applicable.
Acknowledgments
R.S. and T.Y. would like to acknowledge the Civil and Environmental Engineering department of South Dakota School of Mines and Technology. M.T. and A.B.D. would like to acknowledge the University of Sussex strategic development fund.
Conflicts of Interest
The authors declare no conflicts of interest.The funders had no role in the design of the study; in the collection, analyses, or interpretation of data; in the writing of the manuscript; or in the decision to publish the results.
Appendix A. Technical Details of SERS Enhancement Mechanisms
SERS achieves its remarkable sensitivity through a combination of electromagnetic and chemical enhancement mechanisms [75]. These two contributions arise due to the fundamental phenomenon of Raman scattering intensity (IR), which is proportional to the square of the induced dipole moment (), which is the product of Raman polarizability () and magnitude of electric field (E) [76]. In the SERS measurement, when the incident light strikes over a metallic nanoparticle of smaller dimensions than the wavelength, it leads to the excitation of surface plasmons, which is the coupling of photons to the charge density oscillations of conducting electrons, Figure A1a [78]. Under these excitations, localized surface plasmons (LSPRs) occur when the frequency () of incident light matches the frequency of the oscillating electron. It leads to the locally enhanced electric field (Eloc) at the particle surface compared to the incident electromagnetic field (Eo) by a factor of Gex given in the following relation of enhancement factor [79,81].
The resonance frequency of plasmons in the metallic structure depends on certain factors: dielectric function of the metal, effective electron mass, local surroundings, and structural geometry for the propagation [133]. In the localized surroundings, other oscillation sources are generated, such as the modified Raman dipole (Po). Generally, the interaction between of the molecule with Po is higher in magnitude (2–3 orders) than the free molecules not attached to the metals. Thus, these mutual excitations of () by (Eo), and vice versa, further enhance the SERS signal by enhancement factor GR given below.
where is the Raman-shifted frequency. For the molecules exhibiting low vibrational frequencies in the Raman mode, is considered roughly equal, and the electromagnetic field enhancement factors of Equations (A1) and (A2) are considered comparable. Thus, overall enhancement under the effect of the electromagnetic field in the SERS (G) scale with the fourth power of the Eo is responsible for the sensitivity of SERS techniques, capable of addressing minor changes in the local field enhancement [77].
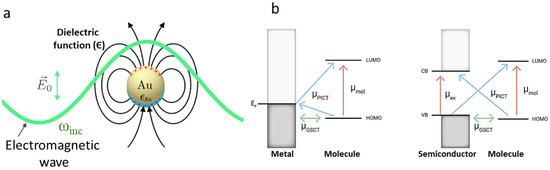
Figure A1.
(a) In the presence of electromagnetic waves of incoming frequency () over metallic nanoparticle (Au) generating a localized surface plasmon resonance (LSPR). Reprinted with permission from Sebastian Schlücker, Angewandte Chemie International Edition, 2014. Copyright 2014, John Wiley and Sons [80]. (b) The chemical contribution in SERS shows a charge transfer mechanism for the attached molecule over the metal and semiconductor interface. The arrows represent the direction of charge transfer and the spheres represent molecular orbitals. Reprinted with permission from Shan Cong et al., The Innovation, Elsevier, 2020. Copyright 2020 [134].
In the chemical enhancement mechanism of SERS, the surface plasmon resonance absorption occurs far from the laser excitation wavelength (within a certain sensing volume) through the charge transfer transition () mechanism either through the molecule-to-metal or metal-to-molecule pathway. Three different types of mechanisms have been proposed during chemical enhancement: interfacial ground state charge transfer (), photon-induced charge transfer (), and the occurrence of the electronic exciting resonance within the molecule [135]. In the vicinity of the metallic nanoparticles, the generation of electrons after photo-irradiation is either excited from the highest occupied molecular orbital (HOMO) of the adsorbed molecule transferred to the Fermi energy level (EF) of the metal or excited from the EF of the metal and transferred to the lowest occupied molecular orbital of the molecule (LUMO), Figure A1b. In the case of semiconductors, the energy band gap (Eg) and its associated EF play a crucial role in plasmonic nanoparticles in the charge transfer process. It is important to note that the chemical-contributed mechanism during SERS could either lead to quenching or enhancement of the scattering [82]. Nevertheless, the chemical contribution to the SERS enhancement is not significant (factor of 103), as observed in electromagnetically induced plasmons (105 to 109) [83]. The total enhancement factor constituting the electromagnetic and chemical contribution is generalized in relation (Equation (A4)), given below.
The relation evaluated for a single excitation wavelength describes the average Raman enhancement, where ISERS is the intensity of the Raman band of the adsorbed molecule, INRS is the normal Raman intensity (i.e., without SERS effect), and Nsur and Nvol are the average number of molecules in the scattering volume of SERS and non-SERS Raman spectroscopic measurements [136].
Appendix B
Researchers can optimize their Raman spectroscopy–ML experimental design for bacterial identification by referencing Table A1. This table offers a valuable guide to Raman spectroscopy parameters, sample details, bacterial species/strains, algorithms, and accuracy metrics drawn from 32 diverse studies. This resource can streamline the process by providing insights into effective parameter choices and methodological comparisons.
Table A1.
Design effective Raman spectroscopy–ML experiments: a parameter guide for bacterial research.
Table A1.
Design effective Raman spectroscopy–ML experiments: a parameter guide for bacterial research.
| Sample Type | Specific Bacteria | Algorithm Category | Accuracy Metric | Input (No. of Spectra) | Raman Parameters | Ref. |
|---|---|---|---|---|---|---|
| Pure bacterial cultures | E. coli (2 strains), Shigella spp. (8 strains) | CNN | 99.64% | 1600 | Excitation: 784.56 nm, 25 mW grating: 600 L/mm, spectral range: 400–2300 cm−1, exposure = 60 s, objective = 100× | [87] |
| Clinical isolates + AgNPs | 30 species, 9 genera | CNN | CNN: 99.80% (genus), 98.37% (species) | 17,149 | Excitation: 785 nm, 20 mW, spectral range: 65–2800 cm−1, exposure = 5 s | [96] |
| Pure cultures | 30 isolates, 15 species | CNN | 84.7 ± 0.3% (isolate), 97 ± 0.3% (treatment ID) | ≈60,000 | N/A | [100] |
| K. pneumoniae clinical isolates | K. pneumoniae (71 strains) | CNN | >94% for antibiotic resistance genes | 7455 | Excitation: 785 nm, 150 mW, grating: 1200 L/mm, spectral range: 390.79–1552.14 cm−1, objective = 50× | [101] |
| N/A | N/A | CNN | 86.7% (isolate), 92.7% (MRSA/MSSA) | Paper 10 data | N/A | [89] |
| Genomic DNA isolates | Brucella spp., Bacillus spp. | CNN | CNN: 96.33% | 843 | Excitation: 785 nm, 30 mW, grating: 600 L/mm, spectral range: 600–1700 cm−1, exposure = 60 s, objective = 100× | [85] |
| Pure bacterial cultures + AuNPs | S. Enteritidis, S. Typhimurium, S. Paratyphi | CNN | 97% | 1854 | Excitation: 785 nm, 5 mW, spectral range: 550–1676 cm−1, exposure = 2 s | [62] |
| Individual microbes and cells on Teflon | 12 species (Gram +ve and −ve) + fungi | CNN | 95–100% | ≈6000 per organism | Excitation: 532 nm, 20 mW | [102] |
| Bacteria, archaea, yeast under various conditions | 14 species | CNN | 95.64 ± 5.46% | >4200 (train) 1400 (test) | Excitation: 785 nm, <16 mW, grating: 600 L/mm, spectral range: 600–1800 cm−1, exposure = 60–90 s, objective = 100× | [103] |
| Lab-prepared isolates | S. aureus (MRSA/MSSA pair) + yeast | CNN | 82% (isolate), 97% (treatment), 89% (MRSA/MSSA) | 72,000 | Excitation: 633 nm, 13.17 mW, grating: 300 L/mm, spectral range: 381.98–1792.4 cm−1, background: poly fit (5) | [18] |
| Mixed bacterial cultures | E. coli, S. aureus, S. typhimurium | Traditional ML | ANN: R2 > 0.95, RMSE < 0.06 | N/A | N/A | [84] |
| Bacterial cultures | 6 distinct species | Traditional ML | >98% | 100 per species | Excitation: 532 nm, 0.3–0.4 mW, spectral range: 400–1800 cm−1, objective = 20× | [60] |
| Clinical isolates, some cultured | 12 species (Gram +ve/−ve) + 2 fungi | Traditional ML | RF: 90.73% (species ID), 99.92% (antibiotic resistance) | >300 per species (train), 80 per species (test) | Integration time = 60–90 s | [91] |
| Clinical isolates on aluminum | 9 species (Gram +ve/−ve) | Traditional ML | Simple filter: 92% (1 s/cell), DAE: 84% (0.1 s/cell) | ≈11,141 | Excitation: 532 nm, 7 mW, grating: 1200 L/mm, spectral range: 280–2186 cm−1, exposure = 0.01, 0.1, 1, 10, or 15 s, objective = 100× | [137] |
| Clinical isolates + AgNPs | 117 S. aureus strains | Traditional ML | DBSCAN: 0.9733, Rand index, CNN: 98.21% Accuracy | 2752 | Excitation: 785 nm, spectral range: 519.56–1800.8 cm−1, exposure = 20 s | [90] |
| Bacterial cultures on silver-coated slides | 30 species, 7 genera | Traditional ML | 86.23 ± 0.92% (all, single model); 87.1–95.8% (hierarchical) | 15,890 | Excitation: 532 nm, 5 mW, grating: 300 L/mm, spectral range: 400–1800 cm−1, objective = 20× | [19] |
| Single prokaryotic cells | 3 bacteria, 3 archaea | Traditional ML | >98% | 40 per species | N/A | [86] |
| Pure cultures on silicon wafer | E. coli ATCC 8739 | Traditional ML | N/A | N/A | Excitation: 532 nm, 8 mW, spectral range: 650–3300 cm−1, exposure = 0.033 s, background: poly fit (6) | [138] |
| Bacterial isolates + AgNPs | S. aureus (MRSA/MSSA), L. pneumophila | Traditional ML | 97.8 ± 0.63% (kNN) | 230 | Excitation: 785 nm, 3 mW, spectral range: 550–1700 cm−1, exposure = 1 s, objective = 50× | [114] |
| Milk, beef | E. coli O157:H7 (and others) | Traditional ML | Limit of detection: 6.94 × 101 CFU/mL, Recovery 86–128% | 2700 | Excitation: 633 nm, grating: 300 L/mm, exposure = 2 s, objective = 50× | [52] |
| Heat-inactivated bacterial cells | B. mallei, B. pseudomallei, other Burkholderia spp. | Traditional ML | 95.5% sensitivity (core group), 83.4% sensitivity (others) | ≈ 200 per strain | Excitation: 532 nm, 7 mW, grating: 920 L/mm, spectral range: 15–3275 cm−1, exposure = 5 s, objective = 100× | [139] |
| Bacteria from blood cultures | 8 common species | Other deep learning | 99.3% Gram type, 97.56% species, 98.5% MRSA/MSSA | 11,774 | Excitation: 632.8 nm, objective = 20× | [59] |
| Clinical isolates + AgNO3 | A. xylosoxidans, B. cepacian, C. indologenes, + 12 others | Other deep learning | CNN: 99.86% | ≈6950 | Excitation: 785 nm, 20 mW, spectral range: 519.56–1800.81 cm−1, exposure = 5 s | [115] |
| Extracellular vesicles (EVs) | 6 bacterial species | Other deep learning | >96% (Gram/species), 93% (strain), 87% (physiological) | 4335 | Excitation: 532 nm, 5 mW, grating: 300 L/mm, spectral range: 800–1800 & 2700–3200 cm−1, exposure = 9 s, objective = 100× | [98] |
| Clinical isolates | ESKAPE pathogens | Other deep learning | 99.99% (training), 98.66% (validation) | >160 per species | Excitation: 633 nm, grating: 1200 L/mm, spectral range: 600–1700 cm−1, exposure = 20 s, objective = 100× | [129] |
| Single bacterial cells (deep-sea) | 5 deep-sea strains | Other deep learning | 99.8 ± 0.2% | Initial: 300 per strain (augmented) | Excitation: 785 nm, grating: 1800 L/mm | [122] |
| Partially covered CaF2 surfaces | 15 bacterial/non-bacterial classes, incl. MR/MS | Other deep learning | 96% (15 classes), 95.6% (MR/MS) | 5200 per species | Excitation: 785 nm, 60 mW, grating: 950 L/mm, spectral range: 700–1600 cm−1 | [130] |
| N/A | N/A | Other deep learning | 86.3% (species-level), 97.84% (empiric treatment), 95% (antibiotic resistance) | Paper 10 data | N/A | [131] |
| Clinical isolates + AgNPs | S. aureus (19 MRSA, 1 MSSA) | Other deep learning | 97.66% accuracy, 99.2% specificity, 96.1% sensitivity | ≈1699 per isolate | Excitation: 785 nm, 3 mW, grating: 1200 L/mm, spectral range: 550–1700 cm−1, exposure = 1 s, objective: 100× | [108] |
| Tomato plant leaves | C. michiganensis subsp. michiganensis | Other deep learning | PCA + MLP: 99% Acc, 95% Spec, PCA + LDA: 97% Acc, 88% Spec | 177 (infected), 120 (healthy) | Excitation: 785 nm, 20 mW, grating: 1200 L/mm, spectral range: 800–1800 cm−1 exposure = 10 s, objective = 20× | [126] |
| Pure bacterial cultures (intestinal pathogens) | 8 strains from Urechis unicinctus | Other deep learning | 94% isolation-level accuracy | 150 per strain | Excitation: 785 nm, grating: 600 L/mm, spectral range: 600–1800 cm−1, exposure = 60 s, objective = 100× | [132] |
| Pure bacterial cultures | S. hominis, V. alginolyticus, B. licheniformis | Other deep learning | N/A | 100 per strain | Grating: 1200 L/mm, exposure = 60 s, objective = 100× | [88] |
References
- Fleischmann, C.; Scherag, A.; Adhikari, N.K.; Hartog, C.S.; Tsaganos, T.; Schlattmann, P.; Angus, D.C.; Reinhart, K. Assessment of global incidence and mortality of hospital-treated sepsis current estimates and limitations. Am. J. Respir. Crit. Care Med. 2016, 193, 259–272. [Google Scholar] [CrossRef] [PubMed]
- DeAntonio, R.; Yarzabal, J.P.; Cruz, J.P.; Schmidt, J.E.; Kleijnen, J. Epidemiology of community-acquired pneumonia and implications for vaccination of children living in developing and newly industrialized countries: A systematic literature review. Hum. Vaccines Immunother. 2016, 12, 2422–2440. [Google Scholar] [CrossRef]
- Estimating the Burden of Foodborne Diseases. Available online: https://www.who.int/activities/estimating-the-burden-of-foodborne-diseases (accessed on 9 April 2024).
- Torio, C.M.; Moore, B.J. National Inpatient Hospital Costs: The Most Expensive Conditions by Payer, 2013. In Healthcare Cost and Utilization Project (HCUP) Statistical Briefs; Agency for Healthcare Research and Quality: Rockville, MD, USA, 2016. [Google Scholar]
- Fleming-Dutra, K.E.; Hersh, A.L.; Shapiro, D.J.; Bartoces, M.; Enns, E.A.; File, T.M.; Finkelstein, J.A.; Gerber, J.S.; Hyun, D.Y.; Linder, J.A.; et al. Prevalence of Inappropriate Antibiotic Prescriptions among US Ambulatory Care Visits, 2010–2011. JAMA 2016, 315, 1864–1873. [Google Scholar] [CrossRef] [PubMed]
- No Time to Wait: Securing the Future from Drug-Resistant Infections. Available online: https://www.who.int/publications/i/item/no-time-to-wait-securing-the-future-from-drug-resistant-infections (accessed on 19 April 2024).
- Järvinen, A.K.; Laakso, S.; Piiparinen, P.; Aittakorpi, A.; Lindfors, M.; Huopaniemi, L.; Piiparinen, H.; Mäki, M. Rapid identification of bacterial pathogens using a PCR- and microarray-based assay. BMC Microbiol. 2009, 9, 161. [Google Scholar] [CrossRef]
- Abram, T.J.; Cherukury, H.; Ou, C.Y.; Vu, T.; Toledano, M.; Li, Y.; Grunwald, J.T.; Toosky, M.N.; Tifrea, D.F.; Slepenkin, A.; et al. Rapid bacterial detection and antibiotic susceptibility testing in whole blood using one-step, high throughput blood digital PCR. Lab Chip 2020, 20, 477–489. [Google Scholar] [CrossRef]
- Strommenger, B.; Kettlitz, C.; Werner, G.; Witte, W. Multiplex PCR assay for simultaneous detection of nine clinically relevant antibiotic resistance genes in Staphylococcus aureus. J. Clin. Microbiol. 2003, 41, 4089–4094. [Google Scholar] [CrossRef] [PubMed]
- Shih, C.M.; Chang, C.L.; Hsu, M.Y.; Lin, J.Y.; Kuan, C.M.; Wang, H.K.; Huang, C.T.; Chung, M.C.; Huang, K.C.; Hsu, C.E.; et al. Paper-based ELISA to rapidly detect Escherichia coli. Talanta 2015, 145, 2–5. [Google Scholar] [CrossRef] [PubMed]
- Febo, T.D.; Schirone, M.; Visciano, P.; Portanti, O.; Armillotta, G.; Persiani, T.; Giannatale, E.D.; Tittarelli, M.; Luciani, M. Development of a Capture ELISA for Rapid Detection of Salmonella enterica in Food Samples. Food Anal. Methods 2019, 12, 322–330. [Google Scholar] [CrossRef]
- Baltekin, Ö.; Boucharin, A.; Tano, E.; Andersson, D.I.; Elf, J. Antibiotic susceptibility testing in less than 30 min using direct single-cell imaging. Proc. Natl. Acad. Sci. USA 2017, 114, 9170–9175. [Google Scholar] [CrossRef] [PubMed]
- Singhal, N.; Kumar, M.; Kanaujia, P.K.; Virdi, J.S. MALDI-TOF mass spectrometry: An emerging technology for microbial identification and diagnosis. Front. Microbiol. 2015, 6, 144398. [Google Scholar] [CrossRef]
- Sloan, A.; Wang, G.; Cheng, K. Traditional approaches versus mass spectrometry in bacterial identification and typing. Clin. Chim. Acta 2017, 473, 180–185. [Google Scholar] [CrossRef] [PubMed]
- Lee, K.S.; Landry, Z.; Pereira, F.C.; Wagner, M.; Berry, D.; Huang, W.E.; Taylor, G.T.; Kneipp, J.; Popp, J.; Zhang, M.; et al. Raman microspectroscopy for microbiology. Nat. Rev. Methods Prim. 2021, 1, 80. [Google Scholar] [CrossRef]
- Butler, H.J.; Ashton, L.; Bird, B.; Cinque, G.; Curtis, K.; Dorney, J.; Esmonde-White, K.; Fullwood, N.J.; Gardner, B.; Martin-Hirsch, P.L.; et al. Using Raman spectroscopy to characterize biological materials. Nat. Protoc. 2016, 11, 664–687. [Google Scholar] [CrossRef] [PubMed]
- Wang, P.; Sun, Y.; Li, X.; Wang, L.; Xu, Y.; He, L.; Li, G. Recent advances in dual recognition based surface enhanced Raman scattering for pathogenic bacteria detection: A review. Anal. Chim. Acta 2021, 1157, 338279. [Google Scholar] [CrossRef] [PubMed]
- Ho, C.S.; Jean, N.; Hogan, C.A.; Blackmon, L.; Jeffrey, S.S.; Holodniy, M.; Banaei, N.; Saleh, A.A.; Ermon, S.; Dionne, J. Rapid identification of pathogenic bacteria using Raman spectroscopy and deep learning. Nat. Commun. 2019, 10, 4927. [Google Scholar] [CrossRef]
- Yan, S.; Wang, S.; Qiu, J.; Li, M.; Li, D.; Xu, D.; Li, D.; Liu, Q. Raman spectroscopy combined with machine learning for rapid detection of food-borne pathogens at the single-cell level. Talanta 2021, 226, 122195. [Google Scholar] [CrossRef] [PubMed]
- Graf, A.A.; Ogilvie, S.P.; Wood, H.J.; Brown, C.J.; Tripathi, M.; King, A.A.; Dalton, A.B.; Large, M.J. Raman Metrics for Molybdenum Disulfide and Graphene Enable Statistical Mapping of Nanosheet Populations. Chem. Mater. 2020, 32, 6213–6221. [Google Scholar] [CrossRef]
- Jordan, M.I.; Mitchell, T.M. Machine learning: Trends, perspectives, and prospects. Science 2015, 349, 255–260. [Google Scholar] [CrossRef] [PubMed]
- Sikder, R.; Zhang, T.; Ye, T. Predicting THM Formation and Revealing Its Contributors in Drinking Water Treatment Using Machine Learning. ACS ES T Water 2024, 4, 899–912. [Google Scholar] [CrossRef]
- Rahman, M.H.U.; Bommanapally, V.; Abeyrathna, D.; Ashaduzzman, M.; Tripathi, M.; Zahan, M.; Subramaniam, M.; Gadhamshetty, V. Machine Learning-Assisted Optical Detection of Multilayer Hexagonal Boron Nitride for Enhanced Characterization and Analysis. In Proceedings of the 2023 IEEE International Conference on Bioinformatics and Biomedicine (BIBM), Istanbul, Turkiye, 5–8 December 2023; pp. 4506–4508. [Google Scholar] [CrossRef]
- Rahman, M.H.U.; Dip, B.; Gurung, S.; Jasthi, B.K.; Gnimpieba, E.Z.; Gadhamshetty, V. Automated Crack Detection in 2D Hexagonal Boron Nitride Coatings Using Machine Learning. Coatings 2024, 14, 726. [Google Scholar] [CrossRef]
- Udupa, R.; Yegneswaran, P.P.; Lukose, J.; Chidangil, S. Utilization of Raman spectroscopy for identification and characterization of fungal pathogens. Fungal Biol. Rev. 2024, 47, 100339. [Google Scholar] [CrossRef]
- Usman, M.; Tang, J.W.; Li, F.; Lai, J.X.; Liu, Q.H.; Liu, W.; Wang, L. Recent advances in surface enhanced Raman spectroscopy for bacterial pathogen identifications. J. Adv. Res. 2023, 51, 91–107. [Google Scholar] [CrossRef]
- Rodriguez, L.; Zhang, Z.; Wang, D. Recent advances of Raman spectroscopy for the analysis of bacteria. Anal. Sci. Adv. 2023, 4, 81–95. [Google Scholar] [CrossRef]
- Liu, L.; Ma, W.; Wang, X.; Li, S. Recent Progress of Surface-Enhanced Raman Spectroscopy for Bacteria Detection. Biosensors 2023, 13, 350. [Google Scholar] [CrossRef] [PubMed]
- Zhu, A.; Ali, S.; Jiao, T.; Wang, Z.; Ouyang, Q.; Chen, Q. Advances in surface-enhanced Raman spectroscopy technology for detection of foodborne pathogens. Compr. Rev. Food Sci. Food Saf. 2023, 22, 1466–1494. [Google Scholar] [CrossRef] [PubMed]
- Wu, L.; Tang, X.; Wu, T.; Zeng, W.; Zhu, X.; Hu, B.; Zhang, S. A review on current progress of Raman-based techniques in food safety: From normal Raman spectroscopy to SESORS. Food Res. Int. 2023, 169, 112944. [Google Scholar] [CrossRef]
- Jayan, H.; Pu, H.; Sun, D.W. Recent developments in Raman spectral analysis of microbial single cells: Techniques and applications. Crit. Rev. Food Sci. Nutr. 2022, 62, 4294–4308. [Google Scholar] [CrossRef] [PubMed]
- Rebrosova, K.; Samek, O.; Kizovsky, M.; Bernatova, S.; Hola, V.; Ruzicka, F. Raman Spectroscopy—A Novel Method for Identification and Characterization of Microbes on a Single-Cell Level in Clinical Settings. Front. Cell. Infect. Microbiol. 2022, 12, 866463. [Google Scholar] [CrossRef]
- Wang, L.; Liu, W.; Tang, J.W.; Wang, J.J.; Liu, Q.H.; Wen, P.B.; Wang, M.M.; Pan, Y.C.; Gu, B.; Zhang, X. Applications of Raman Spectroscopy in Bacterial Infections: Principles, Advantages, and Shortcomings. Front. Microbiol. 2021, 12, 683580. [Google Scholar] [CrossRef]
- Berry, M.E.; Kearns, H.; Graham, D.; Faulds, K. Surface enhanced Raman scattering for the multiplexed detection of pathogenic microorganisms: Towards point-of-use applications. Analyst 2021, 146, 6084–6101. [Google Scholar] [CrossRef]
- Ahmad, W.; Wang, J.; Li, H.; Jiao, T.; Chen, Q. Trends in the bacterial recognition patterns used in surface enhanced Raman spectroscopy. TrAC Trends Anal. Chem. 2021, 142, 116310. [Google Scholar] [CrossRef]
- Akanny, E.; Bonhommé, A.; Bessueille, F.; Bourgeois, S.; Bordes, C. Surface enhanced Raman spectroscopy for bacteria analysis: A review. Appl. Spectrosc. Rev. 2021, 56, 380–422. [Google Scholar] [CrossRef]
- Chen, H.; Das, A.; Bi, L.; Choi, N.; Moon, J.I.; Wu, Y.; Park, S.; Choo, J. Recent advances in surface-enhanced Raman scattering-based microdevices for point-of-care diagnosis of viruses and bacteria. Nanoscale 2020, 12, 21560–21570. [Google Scholar] [CrossRef] [PubMed]
- Chisanga, M.; Linton, D.; Muhamadali, H.; Ellis, D.I.; Kimber, R.L.; Mironov, A.; Goodacre, R. Rapid differentiation of Campylobacter jejuni cell wall mutants using Raman spectroscopy, SERS and mass spectrometry combined with chemometrics. Analyst 2020, 145, 1236–1249. [Google Scholar] [CrossRef]
- Wu, Y.; Gadsden, S.A. Machine learning algorithms in microbial classification: A comparative analysis. Front. Artif. Intell. 2023, 6, 1200994. [Google Scholar] [CrossRef]
- Kotwal, S.; Rani, P.; Arif, T.; Manhas, J.; Sharma, S. Automated Bacterial Classifications Using Machine Learning Based Computational Techniques: Architectures, Challenges and Open Research Issues. Arch. Comput. Methods Eng. 2022, 29, 2469–2490. [Google Scholar] [CrossRef]
- Zhang, Y.; Jiang, H.; Ye, T.; Juhas, M. Deep Learning for Imaging and Detection of Microorganisms. Trends Microbiol. 2021, 29, 569–572. [Google Scholar] [CrossRef]
- Rani, P.; Kotwal, S.; Manhas, J.; Sharma, V.; Sharma, S. Machine Learning and Deep Learning Based Computational Approaches in Automatic Microorganisms Image Recognition: Methodologies, Challenges, and Developments. Arch. Comput. Methods Eng. 2021, 29, 1801–1837. [Google Scholar] [CrossRef] [PubMed]
- Goodswen, S.J.; Barratt, J.L.; Kennedy, P.J.; Kaufer, A.; Calarco, L.; Ellis, J.T. Machine learning and applications in microbiology. FEMS Microbiol. Rev. 2021, 45, fuab015. [Google Scholar] [CrossRef]
- Nami, Y.; Imeni, N.; Panahi, B. Application of machine learning in bacteriophage research. BMC Microbiol. 2021, 21, 193. [Google Scholar] [CrossRef]
- Anahtar, M.N.; Yang, J.H.; Kanjilal, S. Applications of Machine Learning to the Problem of Antimicrobial Resistance: An Emerging Model for Translational Research. J. Clin. Microbiol. 2021, 59. [Google Scholar] [CrossRef] [PubMed]
- Peiffer-Smadja, N.; Dellière, S.; Rodriguez, C.; Birgand, G.; Lescure, F.X.; Fourati, S.; Ruppé, E. Machine learning in the clinical microbiology laboratory: Has the time come for routine practice? Clin. Microbiol. Infect. 2020, 26, 1300–1309. [Google Scholar] [CrossRef] [PubMed]
- Weis, C.V.; Jutzeler, C.R.; Borgwardt, K. Machine learning for microbial identification and antimicrobial susceptibility testing on MALDI-TOF mass spectra: A systematic review. Clin. Microbiol. Infect. 2020, 26, 1310–1317. [Google Scholar] [CrossRef] [PubMed]
- Qu, K.; Guo, F.; Liu, X.; Lin, Y.; Zou, Q. Application of machine learning in microbiology. Front. Microbiol. 2019, 10, 451710. [Google Scholar] [CrossRef] [PubMed]
- Rathnayake, R.A.; Zhao, Z.; McLaughlin, N.; Li, W.; Yan, Y.; Chen, L.L.; Xie, Q.; Wu, C.D.; Mathew, M.T.; Wang, R.R. Machine learning enabled multiplex detection of periodontal pathogens by surface-enhanced Raman spectroscopy. Int. J. Biol. Macromol. 2024, 257, 128773. [Google Scholar] [CrossRef] [PubMed]
- Liu, C.Y.; Han, Y.Y.; Shih, P.H.; Lian, W.N.; Wang, H.H.; Lin, C.H.; Hsueh, P.R.; Wang, J.K.; Wang, Y.L. Rapid bacterial antibiotic susceptibility test based on simple surface-enhanced Raman spectroscopic biomarkers. Sci. Rep. 2016, 6, 23375. [Google Scholar] [CrossRef]
- Lu, X.; Samuelson, D.R.; Xu, Y.; Zhang, H.; Wang, S.; Rasco, B.A.; Xu, J.; Konkel, M.E. Detecting and tracking nosocomial methicillin-resistant Staphylococcus aureus using a microfluidic SERS biosensor. Anal. Chem. 2013, 85, 2320–2327. [Google Scholar] [CrossRef] [PubMed]
- Yan, S.; Liu, C.; Fang, S.; Ma, J.; Qiu, J.; Xu, D.; Li, L.; Yu, J.; Li, D.; Liu, Q. SERS-based lateral flow assay combined with machine learning for highly sensitive quantitative analysis of Escherichia coli O157:H7. Anal. Bioanal. Chem. 2020, 412, 7881–7890. [Google Scholar] [CrossRef] [PubMed]
- Cheong, Y.; Kim, Y.J.; Kang, H.; Choi, S.; Lee, H.J. Rapid label-free identification of Klebsiella pneumoniae antibiotic resistant strains by the drop-coating deposition surface-enhanced Raman scattering method. Spectrochim. Acta. Part A Mol. Biomol. Spectrosc. 2017, 183, 53–59. [Google Scholar] [CrossRef]
- Li, J.; Wang, C.; Shi, L.; Shao, L.; Fu, P.; Wang, K.; Xiao, R.; Wang, S.; Gu, B. Rapid identification and antibiotic susceptibility test of pathogens in blood based on magnetic separation and surface-enhanced Raman scattering. Microchim. Acta 2019, 186, 475. [Google Scholar] [CrossRef]
- Wu, X.; Xu, C.; Tripp, R.A.; Huang, Y.W.; Zhao, Y. Detection and differentiation of foodborne pathogenic bacteria in mung bean sprouts using field deployable label-free SERS devices. Analyst 2013, 138, 3005–3012. [Google Scholar] [CrossRef] [PubMed]
- Kumar, A.; Islam, M.R.; Zughaier, S.M.; Chen, X.; Zhao, Y. Precision classification and quantitative analysis of bacteria biomarkers via surface-enhanced Raman spectroscopy and machine learning. Spectrochim. Acta Part A Mol. Biomol. Spectrosc. 2024, 320, 124627. [Google Scholar] [CrossRef] [PubMed]
- Tang, J.W.; Yuan, Q.; Wen, X.R.; Usman, M.; Tay, A.C.Y.; Wang, L.; Wang, C.L. Label-free surface-enhanced Raman spectroscopy coupled with machine learning algorithms in pathogenic microbial identification: Current trends, challenges, and perspectives. Interdiscip. Med. 2024, e20230060. [Google Scholar] [CrossRef]
- Jarvis, R.M.; Goodacre, R. Discrimination of bacteria using surface-enhanced Raman spectroscopy. Anal. Chem. 2004, 76, 40–47. [Google Scholar] [CrossRef] [PubMed]
- Tseng, Y.M.; Chen, K.L.; Chao, P.H.; Han, Y.Y.; Huang, N.T. Deep Learning-Assisted Surface-Enhanced Raman Scattering for Rapid Bacterial Identification. ACS Appl. Mater. Interfaces 2023, 15, 26398–26406. [Google Scholar] [CrossRef] [PubMed]
- Leong, S.X.; Tan, E.X.; Han, X.; Luhung, I.; Aung, N.W.; Nguyen, L.B.T.; Tan, S.Y.; Li, H.; Phang, I.Y.; Schuster, S.; et al. Surface-Enhanced Raman Scattering-Based Surface Chemotaxonomy: Combining Bacteria Extracellular Matrices and Machine Learning for Rapid and Universal Species Identification. ACS Nano 2023, 17, 23132–23143. [Google Scholar] [CrossRef] [PubMed]
- Sun, J.; Xu, X.; Feng, S.; Zhang, H.; Xu, L.; Jiang, H.; Sun, B.; Meng, Y.; Chen, W. Rapid identification of salmonella serovars by using Raman spectroscopy and machine learning algorithm. Talanta 2023, 253, 123807. [Google Scholar] [CrossRef] [PubMed]
- Ding, J.; Lin, Q.; Zhang, J.; Young, G.M.; Jiang, C.; Zhong, Y.; Zhang, J. Rapid identification of pathogens by using surface-enhanced Raman spectroscopy and multi-scale convolutional neural network. Anal. Bioanal. Chem. 2021, 413, 3801–3811. [Google Scholar] [CrossRef] [PubMed]
- Wang, W.; Wang, X.; Huang, Y.; Zhao, Y.; Fang, X.; Cong, Y.; Tang, Z.; Chen, L.; Zhong, J.; Li, R.; et al. Raman spectrum combined with deep learning for precise recognition of Carbapenem-resistant Enterobacteriaceae. Anal. Bioanal. Chem. 2024, 416, 2465–2478. [Google Scholar] [CrossRef]
- Al-Shaebi, Z.; Ciloglu, F.U.; Nasser, M.; Kahraman, M.; Aydin, O. Staphylococcus Aureus-Related antibiotic resistance detection using synergy of Surface-Enhanced Raman spectroscopy and deep learning. Biomed. Signal Process. Control 2024, 91, 105933. [Google Scholar] [CrossRef]
- Qi, Y.; Hu, D.; Jiang, Y.; Wu, Z.; Zheng, M.; Chen, E.X.; Liang, Y.; Sadi, M.A.; Zhang, K.; Chen, Y.P. Recent Progresses in Machine Learning Assisted Raman Spectroscopy. Adv. Opt. Mater. 2023, 11, 2203104. [Google Scholar] [CrossRef]
- Rahman, M.H.U.; Tripathi, M.; Dalton, A.; Subramaniam, M.; Talluri, S.N.; Jasthi, B.K.; Gadhamshetty, V. Machine Learning-Guided Optical and Raman Spectroscopy Characterization of 2D Materials. In Machine Learning in 2D Materials Science; CRC Press: Boca Raton, FL, USA, 2023; pp. 163–177. [Google Scholar] [CrossRef]
- Zhou, H.; Xu, L.; Ren, Z.; Zhu, J.; Lee, C. Machine learning-augmented surface-enhanced spectroscopy toward next-generation molecular diagnostics. Nanoscale Adv. 2023, 5, 538–570. [Google Scholar] [CrossRef] [PubMed]
- Luo, R.; Popp, J.; Bocklitz, T. Deep Learning for Raman Spectroscopy: A Review. Analytica 2022, 3, 287–301. [Google Scholar] [CrossRef]
- Pan, L.; Zhang, P.; Daengngam, C.; Peng, S.; Chongcheawchamnan, M. A review of artificial intelligence methods combined with Raman spectroscopy to identify the composition of substances. J. Raman Spectrosc. 2022, 53, 6–19. [Google Scholar] [CrossRef]
- Ralbovsky, N.M.; Lednev, I.K. Towards development of a novel universal medical diagnostic method: Raman spectroscopy and machine learning. Chem. Soc. Rev. 2020, 49, 7428–7453. [Google Scholar] [CrossRef] [PubMed]
- Lussier, F.; Thibault, V.; Charron, B.; Wallace, G.Q.; Masson, J.F. Deep learning and artificial intelligence methods for Raman and surface-enhanced Raman scattering. TrAC Trends Anal. Chem. 2020, 124, 115796. [Google Scholar] [CrossRef]
- Monteiro, J.M.; Fernandes, P.B.; Vaz, F.; Pereira, A.R.; Tavares, A.C.; Ferreira, M.T.; Pereira, P.M.; Veiga, H.; Kuru, E.; Vannieuwenhze, M.S.; et al. Cell shape dynamics during the staphylococcal cell cycle. Nat. Commun. 2015, 6, 8055. [Google Scholar] [CrossRef] [PubMed]
- Cook, G.M.; Berney, M.; Gebhard, S.; Heinemann, M.; Cox, R.A.; Danilchanka, O.; Niederweis, M. Physiology of Mycobacteria. Adv. Microb. Physiol. 2009, 55, 81–182, 318–319. [Google Scholar] [CrossRef] [PubMed]
- Raman, C.V.; Krishnan, K.S. A New Type of Secondary Radiation. Nature 1928, 121, 501–502. [Google Scholar] [CrossRef]
- Han, X.X.; Rodriguez, R.S.; Haynes, C.L.; Ozaki, Y.; Zhao, B. Surface-enhanced Raman spectroscopy. Nat. Rev. Methods Prim. 2022, 1, 87. [Google Scholar] [CrossRef]
- Stiles, P.L.; Dieringer, J.A.; Shah, N.C.; Duyne, R.P.V. Surface-enhanced Raman spectroscopy. Annu. Rev. Anal. Chem. 2008, 1, 601–626. [Google Scholar] [CrossRef]
- Ding, S.Y.; Yi, J.; Li, J.F.; Ren, B.; Wu, D.Y.; Panneerselvam, R.; Tian, Z.Q. Nanostructure-based plasmon-enhanced Raman spectroscopy for surface analysis of materials. Nat. Rev. Mater. 2016, 1, 16021. [Google Scholar] [CrossRef]
- Willets, K.A.; Duyne, R.P.V. Localized surface plasmon resonance spectroscopy and sensing. Annu. Rev. Phys. Chem. 2007, 58, 267–297. [Google Scholar] [CrossRef]
- Hutter, E.; Fendler, J.H. Exploitation of Localized Surface Plasmon Resonance. Adv. Mater. 2004, 16, 1685–1706. [Google Scholar] [CrossRef]
- Schlücker, S.; Schlücker, S. Surface-Enhanced Raman Spectroscopy: Concepts and Chemical Applications. Angew. Chem. Int. Ed. 2014, 53, 4756–4795. [Google Scholar] [CrossRef]
- Pérez-Jiménez, A.I.; Lyu, D.; Lu, Z.; Liu, G.; Ren, B. Surface-enhanced Raman spectroscopy: Benefits, trade-offs and future developments. Chem. Sci. 2020, 11, 4563–4577. [Google Scholar] [CrossRef] [PubMed]
- Ru, E.C.L.; Etchegoin, P.G. Quantifying SERS enhancements. MRS Bull. 2013, 38, 631–640. [Google Scholar] [CrossRef]
- Halas, N.J.; Lal, S.; Chang, W.S.; Link, S.; Nordlander, P. Plasmons in strongly coupled metallic nanostructures. Chem. Rev. 2011, 111, 3913–3961. [Google Scholar] [CrossRef] [PubMed]
- Zhao, Y.; Zhang, Z.; Ning, Y.; Miao, P.; Li, Z.; Wang, H. Simultaneous quantitative analysis of Escherichia coli, Staphylococcus aureus and Salmonella typhimurium using surface-enhanced Raman spectroscopy coupled with partial least squares regression and artificial neural networks. Spectrochim. Acta. Part A Mol. Biomol. Spectrosc. 2023, 293, 122510. [Google Scholar] [CrossRef]
- Sil, S.; Mukherjee, R.; Kumbhar, D.; Reghu, D.; Shrungar, D.; Kumar, N.S.; Singh, U.K.; Umapathy, S. Raman spectroscopy and artificial intelligence open up accurate detection of pathogens from DNA-based sub-species level classification. J. Raman Spectrosc. 2021, 52, 2648–2659. [Google Scholar] [CrossRef]
- Kanno, N.; Kato, S.; Ohkuma, M.; Matsui, M.; Iwasaki, W.; Shigeto, S. Machine learning-assisted single-cell Raman fingerprinting for in situ and nondestructive classification of prokaryotes. iScience 2021, 24, 102975. [Google Scholar] [CrossRef] [PubMed]
- Liu, W.; Tang, J.W.; Mou, J.Y.; Lyu, J.W.; Di, Y.W.; Liao, Y.L.; Luo, Y.F.; Li, Z.K.; Wu, X.; Wang, L. Rapid discrimination of Shigella spp. and Escherichia coli via label-free surface enhanced Raman spectroscopy coupled with machine learning algorithms. Front. Microbiol. 2023, 14, 1101357. [Google Scholar] [CrossRef] [PubMed]
- Yu, S.; Li, H.; Li, X.; Fu, Y.V.; Liu, F. Classification of pathogens by Raman spectroscopy combined with generative adversarial networks. Sci. Total Environ. 2020, 726, 138477. [Google Scholar] [CrossRef] [PubMed]
- Deng, L.; Zhong, Y.; Wang, M.; Zheng, X.; Zhang, J. Scale-Adaptive Deep Model for Bacterial Raman Spectra Identification. IEEE J. Biomed. Health Inform. 2022, 26, 369–378. [Google Scholar] [CrossRef] [PubMed]
- Tang, J.W.; Liu, Q.H.; Yin, X.C.; Pan, Y.C.; Wen, P.B.; Liu, X.; Kang, X.X.; Gu, B.; Zhu, Z.B.; Wang, L. Comparative Analysis of Machine Learning Algorithms on Surface Enhanced Raman Spectra of Clinical Staphylococcus Species. Front. Microbiol. 2021, 12, 696921. [Google Scholar] [CrossRef] [PubMed]
- Lu, W.; Li, H.; Qiu, H.; Wang, L.; Feng, J.; Fu, Y.V. Identification of pathogens and detection of antibiotic susceptibility at single-cell resolution by Raman spectroscopy combined with machine learning. Front. Microbiol. 2023, 13, 1076965. [Google Scholar] [CrossRef] [PubMed]
- Gu, J.; Wang, Z.; Kuen, J.; Ma, L.; Shahroudy, A.; Shuai, B.; Liu, T.; Wang, X.; Wang, G.; Cai, J.; et al. Recent advances in convolutional neural networks. Pattern Recognit. 2018, 77, 354–377. [Google Scholar] [CrossRef]
- Tewes, T.J.; Kerst, M.; Pavlov, S.; Huth, M.A.; Hansen, U.; Bockmühl, D.P. Unveiling the efficacy of a bulk Raman spectra-based model in predicting single cell Raman spectra of microorganisms. Heliyon 2024, 10, e27824. [Google Scholar] [CrossRef] [PubMed]
- Hu, J.; He, L.; Wang, G.; Liu, L.; Wang, Y.; Song, J.; Qu, J.; Peng, X.; Yuan, Y. Rapid and accurate identification of marine bacteria spores at a single-cell resolution by laser tweezers Raman spectroscopy and deep learning. J. Biophotonics 2024, 17, e202300510. [Google Scholar] [CrossRef] [PubMed]
- Contreras, J.; Mostafapour, S.; Popp, J.; Bocklitz, T. Siamese Networks for Clinically Relevant Bacteria Classification Based on Raman Spectroscopy. Molecules 2024, 29, 1061. [Google Scholar] [CrossRef]
- Wang, L.; Tang, J.W.; Li, F.; Usman, M.; Wu, C.Y.; Liu, Q.H.; Kang, H.Q.; Liu, W.; Gu, B. Identification of Bacterial Pathogens at Genus and Species Levels through Combination of Raman Spectrometry and Deep-Learning Algorithms. Microbiol. Spectr. 2022, 10, e02580-22. [Google Scholar] [CrossRef] [PubMed]
- Alzubaidi, L.; Zhang, J.; Humaidi, A.J.; Al-Dujaili, A.; Duan, Y.; Al-Shamma, O.; Santamaría, J.; Fadhel, M.A.; Al-Amidie, M.; Farhan, L. Review of deep learning: Concepts, CNN architectures, challenges, applications, future directions. J. Big Data 2021, 8, 53. [Google Scholar] [CrossRef] [PubMed]
- Qin, Y.F.; Lu, X.Y.; Shi, Z.; Huang, Q.S.; Wang, X.; Ren, B.; Cui, L. Deep Learning-Enabled Raman Spectroscopic Identification of Pathogen-Derived Extracellular Vesicles and the Biogenesis Process. Anal. Chem. 2022, 94, 12416–12426. [Google Scholar] [CrossRef] [PubMed]
- Basodi, S.; Ji, C.; Zhang, H.; Pan, Y. Gradient amplification: An efficient way to train deep neural networks. Big Data Min. Anal. 2020, 3, 196–207. [Google Scholar] [CrossRef]
- Zhou, B.; Tong, Y.K.; Zhang, R.; Ye, A. RamanNet: A lightweight convolutional neural network for bacterial identification based on Raman spectra. RSC Adv. 2022, 12, 26463–26469. [Google Scholar] [CrossRef] [PubMed]
- Lu, J.; Chen, J.; Liu, C.; Zeng, Y.; Sun, Q.; Li, J.; Shen, Z.; Chen, S.; Zhang, R. Identification of antibiotic resistance and virulence-encoding factors in Klebsiella pneumoniae by Raman spectroscopy and deep learning. Microb. Biotechnol. 2022, 15, 1270–1280. [Google Scholar] [CrossRef] [PubMed]
- Maruthamuthu, M.K.; Raffiee, A.H.; Oliveira, D.M.D.; Ardekani, A.M.; Verma, M.S. Raman spectra-based deep learning: A tool to identify microbial contamination. MicrobiologyOpen 2020, 9, e1122. [Google Scholar] [CrossRef]
- Lu, W.; Chen, X.; Wang, L.; Li, H.; Fu, Y.V. Combination of an Artificial Intelligence Approach and Laser Tweezers Raman Spectroscopy for Microbial Identification. Anal. Chem. 2020, 92, 6288–6296. [Google Scholar] [CrossRef]
- Guidotti, R.; Monreale, A.; Ruggieri, S.; Turini, F.; Giannotti, F.; Pedreschi, D. A Survey of Methods for Explaining Black Box Models. ACM Comput. Surv. (CSUR) 2018, 51, 93. [Google Scholar] [CrossRef]
- Zhang, Q.; Wu, Y.N.; Zhu, S.C. Interpretable Convolutional Neural Networks. In Proceedings of the IEEE Computer Society Conference on Computer Vision and Pattern Recognition, Salt Lake City, UT, USA, 18–23 June 2018; pp. 8827–8836. [Google Scholar] [CrossRef]
- Selvaraju, R.R.; Cogswell, M.; Das, A.; Vedantam, R.; Parikh, D.; Batra, D. Grad-CAM: Visual Explanations from Deep Networks via Gradient-Based Localization. Int. J. Comput. Vis. 2020, 128, 336–359. [Google Scholar] [CrossRef]
- Zhang, X.; Xu, J.; Yang, J.; Chen, L.; Zhou, H.; Liu, X.; Li, H.; Lin, T.; Ying, Y. Understanding the learning mechanism of convolutional neural networks in spectral analysis. Anal. Chim. Acta 2020, 1119, 41–51. [Google Scholar] [CrossRef] [PubMed]
- Ciloglu, F.U.; Caliskan, A.; Saridag, A.M.; Kilic, I.H.; Tokmakci, M.; Kahraman, M.; Aydin, O. Drug-resistant Staphylococcus aureus bacteria detection by combining surface-enhanced Raman spectroscopy (SERS) and deep learning techniques. Sci. Rep. 2021, 11, 18444. [Google Scholar] [CrossRef] [PubMed]
- Tong, S.Y.; Davis, J.S.; Eichenberger, E.; Holland, T.L.; Fowler, V.G. Staphylococcus aureus infections: Epidemiology, pathophysiology, clinical manifestations, and management. Clin. Microbiol. Rev. 2015, 28, 603–661. [Google Scholar] [CrossRef] [PubMed]
- Walter, A.; März, A.; Schumacher, W.; Rösch, P.; Popp, J. Towards a fast, high specific and reliable discrimination of bacteria on strain level by means of SERS in a microfluidic device. Lab Chip 2011, 11, 1013–1021. [Google Scholar] [CrossRef] [PubMed]
- Zhou, H.; Yang, D.; Ivleva, N.P.; Mircescu, N.E.; Niessner, R.; Haisch, C. SERS detection of bacteria in water by in situ coating with Ag nanoparticles. Anal. Chem. 2014, 86, 1525–1533. [Google Scholar] [CrossRef]
- Schuster, K.C.; Reese, I.; Urlaub, E.; Gapes, J.R.; Lendl, B. Multidimensional information on the chemical composition of single bacterial cells by confocal Raman microspectroscopy. Anal. Chem. 2000, 72, 5529–5534. [Google Scholar] [CrossRef] [PubMed]
- García, A.B.; Viñuela-Prieto, J.M.; López-González, L.; Candel, F.J. Correlation between resistance mechanisms in Staphylococcus aureus and cell wall and septum thickening. Infect. Drug Resist. 2017, 10, 353–356. [Google Scholar] [CrossRef]
- Ciloglu, F.U.; Saridag, A.M.; Kilic, I.H.; Tokmakci, M.; Kahraman, M.; Aydin, O. Identification of methicillin-resistant Staphylococcus aureus bacteria using surface-enhanced Raman spectroscopy and machine learning techniques. Analyst 2020, 145, 7559–7570. [Google Scholar] [CrossRef]
- Tang, J.W.; Li, J.Q.; Yin, X.C.; Xu, W.W.; Pan, Y.C.; Liu, Q.H.; Gu, B.; Zhang, X.; Wang, L. Rapid Discrimination of Clinically Important Pathogens through Machine Learning Analysis of Surface Enhanced Raman Spectra. Front. Microbiol. 2022, 13, 843417. [Google Scholar] [CrossRef]
- Gautam, R.; Vanga, S.; Ariese, F.; Umapathy, S. Review of multidimensional data processing approaches for Raman and infrared spectroscopy. EPJ Tech. Instrum. 2015, 2, 8. [Google Scholar] [CrossRef]
- Byrne, H.J.; Knief, P.; Keating, M.E.; Bonnier, F. Spectral pre and post processing for infrared and Raman spectroscopy of biological tissues and cells. Chem. Soc. Rev. 2016, 45, 1865–1878. [Google Scholar] [CrossRef] [PubMed]
- Boardman, A.K.; Wong, W.S.; Premasiri, W.R.; Ziegler, L.D.; Lee, J.C.; Miljkovic, M.; Klapperich, C.M.; Sharon, A.; Sauer-Budge, A.F. Rapid detection of bacteria from blood with surface-enhanced Raman spectroscopy. Anal. Chem. 2016, 88, 8026–8035. [Google Scholar] [CrossRef] [PubMed]
- Sivanesan, A.; Witkowska, E.; Adamkiewicz, W.; Dziewit, Ł.; Kamińska, A.; Waluk, J. Nanostructured silver–gold bimetallic SERS substrates for selective identification of bacteria in human blood. Analyst 2014, 139, 1037–1043. [Google Scholar] [CrossRef] [PubMed]
- Premasiri, W.R.; Gebregziabher, Y.; Ziegler, L.D. On the difference between surface-enhanced raman scattering (SERS) spectra of cell growth media and whole bacterial cells. Appl. Spectrosc. 2011, 65, 493–499. [Google Scholar] [CrossRef] [PubMed]
- Auner, G.W.; Koya, S.K.; Huang, C.; Broadbent, B.; Trexler, M.; Auner, Z.; Elias, A.; Mehne, K.C.; Brusatori, M.A. Applications of Raman spectroscopy in cancer diagnosis. Cancer Metastasis Rev. 2018, 37, 691–717. [Google Scholar] [CrossRef] [PubMed]
- Liu, B.; Liu, K.; Wang, N.; Ta, K.; Liang, P.; Yin, H.; Li, B. Laser tweezers Raman spectroscopy combined with deep learning to classify marine bacteria. Talanta 2022, 244, 123383. [Google Scholar] [CrossRef]
- Kong, J.L.; Dong, L.Q.; Wang, Q.Q.; Wei, K.; Xiangli, W.T.; Teng, G.E.; Liu, W.W.; Cui, X.T. Extending the spectral database of laser-induced breakdown spectroscopy with generative adversarial nets. Opt. Express 2019, 27, 6958–6969. [Google Scholar] [CrossRef]
- Goodfellow, I.J.; Pouget-Abadie, J.; Mirza, M.; Xu, B.; Warde-Farley, D.; Ozair, S.; Courville, A.; Bengio, Y. Generative Adversarial Networks. Sci. Robot. 2014, 3, 2672–2680. [Google Scholar] [CrossRef]
- Karras, T.; Aila, T.; Laine, S.; Lehtinen, J. Progressive Growing of GANs for Improved Quality, Stability, and Variation. In Proceedings of the 6th International Conference on Learning Representations, ICLR 2018—Conference Track Proceedings, Vancouver, BC, Canada, 30 April–3 May 2018. [Google Scholar] [CrossRef]
- Vallejo-Pérez, M.R.; Sosa-Herrera, J.A.; Navarro-Contreras, H.R.; Álvarez Preciado, L.G.; Rodríguez-Vázquez, Á.G.; Lara-Ávila, J.P.; Potosí, L.; de la Cruz, E.P.; de Graciano Sánchez, S.; Potosí, S.L. Raman Spectroscopy and Machine-Learning for Early Detection of Bacterial Canker of Tomato: The Asymptomatic Disease Condition. Plants 2021, 10, 1542. [Google Scholar] [CrossRef]
- Kaparakis-Liaskos, M.; Ferrero, R.L. Immune modulation by bacterial outer membrane vesicles. Nat. Rev. Immunol. 2015, 15, 375–387. [Google Scholar] [CrossRef]
- Woo, S.; Park, J.; Lee, J.Y.; Kweon, I.S. CBAM: Convolutional block attention module. In Lecture Notes in Computer Science (Including Subseries Lecture Notes in Artificial Intelligence and Lecture Notes in Bioinformatics); Springer: Cham, Switzerland, 2018; Volume 11211 LNCS, pp. 3–19. [Google Scholar] [CrossRef]
- Singh, S.; Kumbhar, D.; Reghu, D.; Venugopal, S.J.; Rekha, P.T.; Mohandas, S.; Rao, S.; Rangaiah, A.; Chunchanur, S.K.; Saini, D.K.; et al. Culture-Independent Raman Spectroscopic Identification of Bacterial Pathogens from Clinical Samples Using Deep Transfer Learning. Anal. Chem. 2022, 94, 14745–14754. [Google Scholar] [CrossRef] [PubMed]
- Thomsen, B.L.; Christensen, J.B.; Rodenko, O.; Usenov, I.; Grønnemose, R.B.; Andersen, T.E.; Lassen, M. Accurate and fast identification of minimally prepared bacteria phenotypes using Raman spectroscopy assisted by machine learning. Sci. Rep. 2022, 12, 16436. [Google Scholar] [CrossRef] [PubMed]
- Al-Shaebi, Z.; Ciloglu, F.U.; Nasser, M.; Aydin, O. Highly Accurate Identification of Bacteria’s Antibiotic Resistance Based on Raman Spectroscopy and U-Net Deep Learning Algorithms. ACS Omega 2022, 7, 29443–29451. [Google Scholar] [CrossRef]
- Yu, S.; Li, X.; Lu, W.; Li, H.; Fu, Y.V.; Liu, F. Analysis of Raman Spectra by Using Deep Learning Methods in the Identification of Marine Pathogens. Anal. Chem. 2021, 93, 11089–11098. [Google Scholar] [CrossRef]
- Kelly, K.L.; Coronado, E.; Zhao, L.L.; Schatz, G.C. The optical properties of metal nanoparticles: The influence of size, shape, and dielectric environment. J. Phys. Chem. B 2003, 107, 668–677. [Google Scholar] [CrossRef]
- Cong, S.; Liu, X.; Jiang, Y.; Zhang, W.; Zhao, Z. Surface Enhanced Raman Scattering Revealed by Interfacial Charge-Transfer Transitions. Innovation 2020, 1, 100051. [Google Scholar] [CrossRef]
- Jensen, L.; Aikens, C.M.; Schatz, G.C. Electronic structure methods for studying surface-enhanced Raman scattering. Chem. Soc. Rev. 2008, 37, 1061–1073. [Google Scholar] [CrossRef]
- McFarland, A.D.; Young, M.A.; Dieringer, J.A.; Duyne, R.P.V. Wavelength-scanned surface-enhanced Raman excitation spectroscopy. J. Phys. Chem. B 2005, 109, 11279–11285. [Google Scholar] [CrossRef]
- Xu, J.; Yi, X.; Jin, G.; Peng, D.; Fan, G.; Xu, X.; Chen, X.; Yin, H.; Cooper, J.M.; Huang, W.E. High-Speed Diagnosis of Bacterial Pathogens at the Single Cell Level by Raman Microspectroscopy with Machine Learning Filters and Denoising Autoencoders. ACS Chem. Biol. 2022, 17, 376–385. [Google Scholar] [CrossRef] [PubMed]
- Barzan, G.; Sacco, A.; Mandrile, L.; Giovannozzi, A.M.; Portesi, C.; Rossi, A.M. Hyperspectral chemical imaging of single bacterial cell structure by raman spectroscopy and machine learning. Appl. Sci. 2021, 11, 3409. [Google Scholar] [CrossRef]
- Moawad, A.A.; Silge, A.; Bocklitz, T.; Fischer, K.; Rösch, P.; Roesler, U.; Elschner, M.C.; Popp, J.; Neubauer, H. A Machine Learning-Based Raman Spectroscopic Assay for the Identification of Burkholderia mallei and Related Species. Molecules 2019, 24, 4516. [Google Scholar] [CrossRef] [PubMed]
Disclaimer/Publisher’s Note: The statements, opinions and data contained in all publications are solely those of the individual author(s) and contributor(s) and not of MDPI and/or the editor(s). MDPI and/or the editor(s) disclaim responsibility for any injury to people or property resulting from any ideas, methods, instructions or products referred to in the content. |
© 2024 by the authors. Licensee MDPI, Basel, Switzerland. This article is an open access article distributed under the terms and conditions of the Creative Commons Attribution (CC BY) license (https://creativecommons.org/licenses/by/4.0/).