Article

Origami Paper-Based Electrochemical Immunosensor with Carbon Nanohorns-Decorated Nanoporous Gold for Zearalenone Detection

Instituto de Química de San Luis (INQUISAL), Facultad de Química, Bioquímica y Farmacia (FQBF), Universidad Nacional de San Luis (UNSL), Consejo Nacional de Investigaciones Científicas y Técnicas (CONICET), INQUISAL (UNSL—CONICET), Chacabuco 917, San Luis D5700BWS, Argentina
*
Author to whom correspondence should be addressed.
Chemosensors 2024, 12(1), 10; https://doi.org/10.3390/chemosensors12010010
Submission received: 8 November 2023 / Revised: 22 December 2023 / Accepted: 29 December 2023 / Published: 5 January 2024
(This article belongs to the Special Issue Microfluidic Device Based Chemical and Biochemical Sensors)

Abstract

:
Nowadays, mycotoxin contamination in cereals and wastewater exposes a safety hazard to consumer health. This work describes the design of a simple, low-cost, and sensitive origami microfluidic paper-based device using electrochemical detection for zearalenone determination. The microfluidic immunosensor was designed on a paper platform by a wax printing process. The graphitized carbon working electrode modified with carbon nanohorns-decorated nanoporous gold showed a higher surface area, sensitivity, and adequate analytical performance. Electrodes were characterized by scanning electron microscopy, energy-dispersive spectroscopy, and cyclic voltammetry. The determination of zearalenone was carried out through a competitive immunoassay using specific antibodies immobilized by a covalent bond on the electrode surface. In the presence of HRP-labeled enzyme conjugate, substrate, and catechol, zearalenone was detected employing the developed immunosensor by applying −0.1 V to the working electrode vs silver as a pseudo-reference electrode. A calibration curve with a linear range between 10 and 1000 µg Kg−1 (R2 = 0.998) was obtained, and the limit of detection and quantification for the electrochemical immunosensor were 4.40 and 14.90 µg Kg−1, respectively. The coefficient of variation for intra- and inter-day assays was less than 5%. The selectivity and specificity of the sensor were evaluated, comparing the response against zearalenone metabolites and other mycotoxins that could affect the corn samples. Therefore, origami is a promising approach for paper-based electrochemical microfluidic sensors coupled to smartphones as a rapid and portable tool for in situ mycotoxins detection in real samples.

1. Introduction

In recent years, origami microfluidic papers [1] and their electroanalytical derivations [2] have played an essential role as modern analytical tools and have been applied in several areas such as food science [3], environmental analysis [4], medicine [5], forensics [6], and the pharmaceutical industry [7]. These devices provide appropriate sensitivity to detect not only metabolites [8] and toxins [9] but also pathogens [10]. Paper represents one of the most attractive materials for microfluidic applications due to its accessibility and affordability as a substrate. For these reasons, several groups have recently explored the design and construction of paper-based devices for addressing mycotoxin contamination in cereals [11] and wastewater [12].
Mycotoxins are chemical compounds produced by fungi as part of their metabolic processes. Fungi naturally occur in the environment and can affect growth on a wide range of organic materials, including crops, grains, fruits, and nuts. These toxins are frequently present in various food products and animal feed, representing a significant risk to humans and animals. Consumption of food contaminated with mycotoxins can result in multiple adverse health effects, including cancer, liver and kidney damage, immune system suppression, and neurological issues. Livestock animals are particularly vulnerable, experiencing reduced growth, decreased feed efficiency, immune suppression, and reproductive problems when exposed to mycotoxin-contaminated feed [13]. For the reasons mentioned and to protect consumers, government agencies and industry organizations established guidelines and maximum allowable limits for mycotoxin concentrations in food and feed. Timely and accurate detection of mycotoxins in these products can prevent harm to humans and animals [14].
In this sense, zearalenone (ZEA) could be mentioned among the relevant mycotoxins. It is a resorcylic acid lactone generated by fusarium fungi and is considered a nonsteroidal estrogenic mycotoxin [15]. ZEA has been reported to cause harmful effects on the reproductive system, manifesting as decreased fertility, attributable to its influence on the endocrine system [16]. In livestock farming, using feed contaminated with mycotoxins can lead to various adverse health effects on farm animals and severe economic losses [17]. In addition, once food from farms, milk, meat, or eggs contaminated with mycotoxins reaches the consumer, human health is affected [18]. Considering the points mentioned, it becomes evident that conducting mycotoxin in food is essential to ensure food safety. Various methods have been developed and documented in research publications to determine ZEA. High-performance liquid chromatography (HPLC) and gas chromatography (GC) are commonly employed to analyze and quantify ZEA levels in different samples [19,20,21,22]. Generally, these methods have high sensitivity and selectivity, making them accurate for ZEA determination. However, they often require complex sample pretreatment procedures. To address this analytical challenge, we present the design and construction of a simple, cost-effective, and sensitive origami microfluidic paper-based device for ZEA determination.
Bioanalytical sensors coupled to different detection systems offer a favorable alternative for mycotoxin determinations [23,24]. Particularly, those with electrochemical detection provide excellent sensitivity, selectivity, and rapid analysis without complex pretreatment procedures, making them advantageous for fast and straightforward determination methods. Additionally, these systems enable real-time and portable analysis, making them well suited for precise mycotoxin quantification in remote locations or field analysis scenarios [25,26].
This work describes the development of a microfluidic immunosensor designed on a paper platform by a wax printing process. The proposed determination method involves a competitive immunoassay employing specific antibodies to capture the mycotoxin in the presence of an HRP-labeled enzyme conjugate. The antibodies were immobilized by a covalent bond on the surface of graphite paper modified with carbon nanohorns and gold nanoporous, used as a working electrode. The selectivity of the sensor was also evaluated. It is important to highlight that this electrochemical microfluidic sensor based on origami coupled with smartphones demonstrates promise as a rapid and portable tool for on-site detection of mycotoxins in real samples.

2. Materials and Methods

2.1. Reagents and Materials

All reagents were of analytical grade. Potassium chloride, sodium chloride, monobasic/dibasic sodium phosphate, potassium ferricyanide, and ferrocyanide were acquired from Merck (Darmstadt, Germany). Whatman No. 1 filter paper, bovine serum albumin, hydrogen peroxide, and catechol were purchased from Sigma Chemical Co., (St. Louis, MO, USA). Dimethylformamide (DMF), oxidized carbon nanohorns (CNH), tetrachloroauric acid (HAuCl4), 3-mercaptopropionic acid (MPA), 1-ethyl-3-(3-dimethylaminopropyl)carbodiimide hydrochloride (EDC), and n-hydroxysuccinimide (NHS) were purchased from Sigma-Aldrich (Buenos Aires, Argentina). Solid wax ink cartridge was acquired from Xerox (Buenos Aires, Argentina). The commercial Zearalenone Test Kit (containing ZEA standard solutions and ZEA-HRP enzyme conjugate) was acquired from Romer Labs, Inc. (Union, MO, USA), anti-zearalenone (Anti-ZEA) antibody to analyte was purchased from Abcam (Waltham, MA, USA), and used following the manufacturer’s specifications. All other reagents and solvents were used without further purification and the presence of ZEA was not detected in the working range.

2.2. Equipment

Origami microfluidic paper-based devices (OMPDs) with their delimited microzones were designed using CorelDraw 12 software and printed with a Xerox ColorQube 8570 printer from Xerox (Buenos Aires, Argentina). A Samsung M288x Series was used to print the mask. Graphitized paper electrodes (GPEs) were deposited on the mask in the detection microzone by sputtering (SPI-Module Sputter Coater with Etch mode, Structure Probe Inc., West Chester, PA, USA) and the thickness of the electrodes was measured using a Model 12,161 quartz crystal thickness monitor (Structure Probe Inc.). A hot plate model MG-2 from Argenlab (Buenos Aires, Argentina) was used to thermally treat the devices. Electrochemical measurements were performed using an Autolab PGSTAT302N potentiostat/galvanostat (Metrohm Autolab B.V., Utrecht, The Netherlands). Scanning electron microscope (SEM) images were obtained by LEO 1450VP. The elemental composition of modified surfaces was analyzed using energy-dispersive spectroscopy (EDS) by the Genesis 2000 spectrometer. The structures and composition of the nanocomposite were studied by X-ray diffraction (XRD) with a Rigaku D-MAX IIIC diffractometer using copper radiation (ka = 0.154178 nm) and containing a nickel filter. Purified water was employed in the preparation of all solutions and standards using a Millipore Milli-Q system (Bedford, MA, USA). To determine the pH values in the solutions and buffers, an Orion Analyzer Model EA 940 (Orion Research Inc., Cambridge, MA, USA) equipped with a glass combination electrode was utilized. Absorbance was measured using a BioTek Epoch microplate spectrophotometer model Take3 (Winooski, VT, USA). All the measurements were carried out using homemade devices.

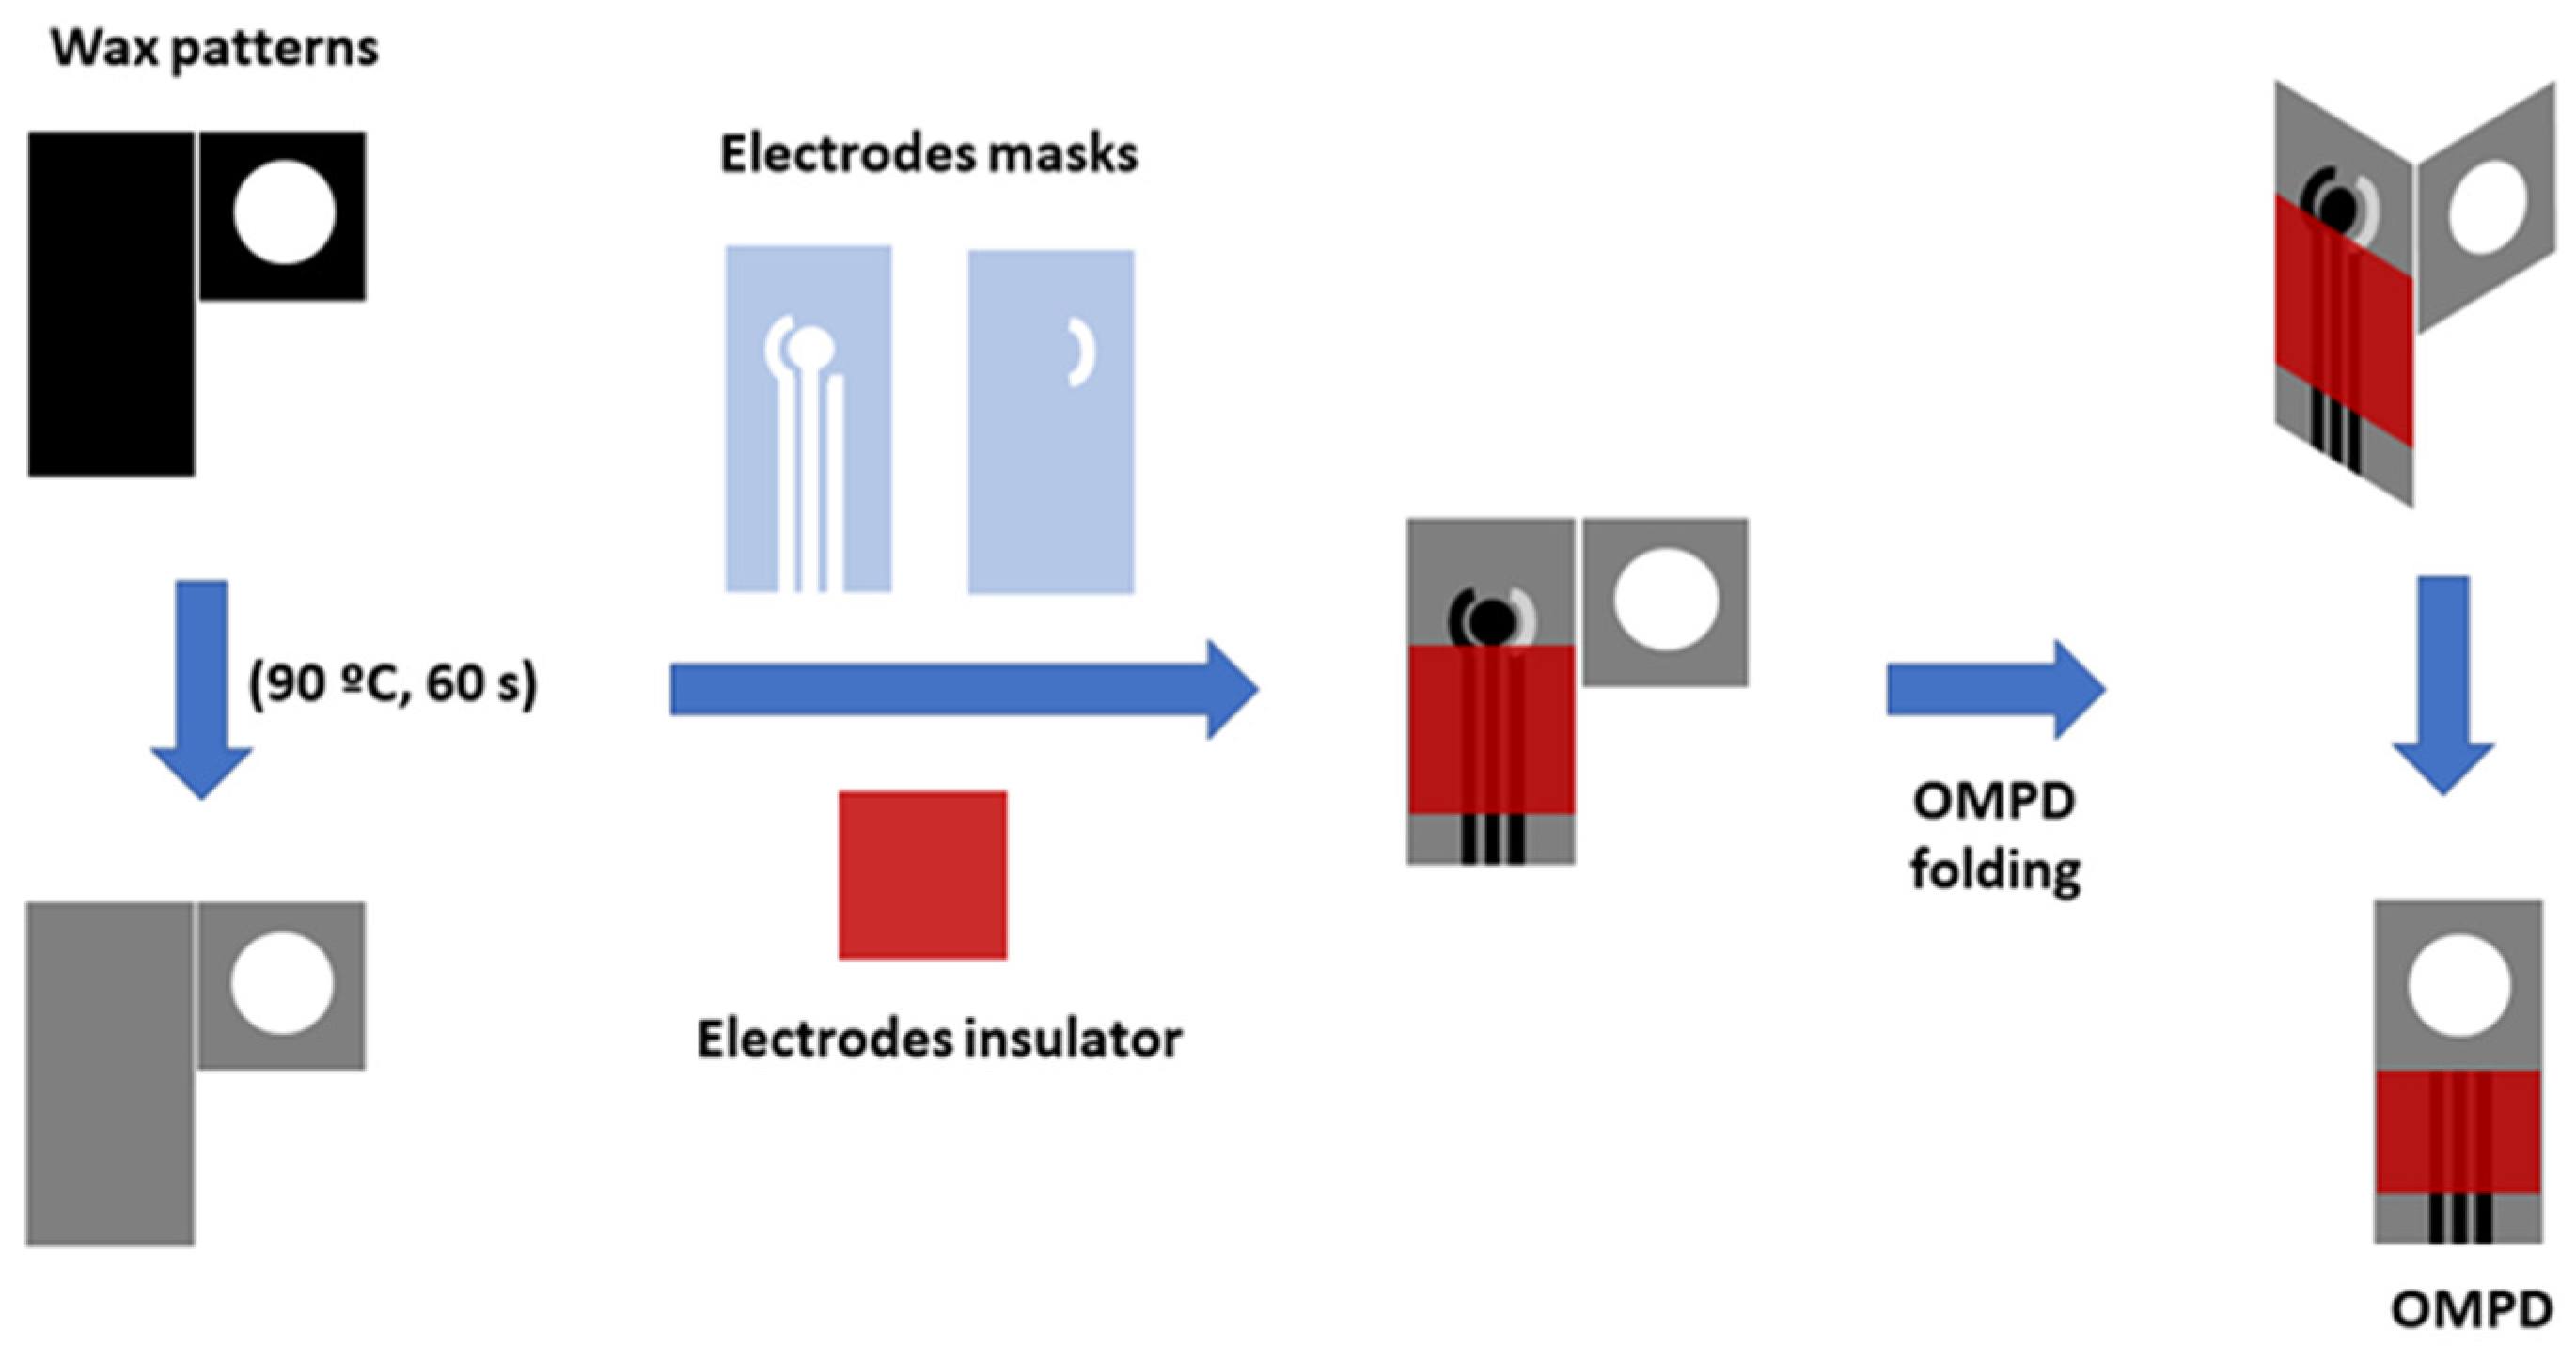
2.3. Design and Fabrication of the OMPDs with Electrochemical Detection

OMPDs were designed using CorelDraw 12 software and transferred to Whatman No. 1 filter paper. The patterns were printed on the paper surface using commercial solid ink as a hydrophobic barrier. Firstly, the hydrophobic zone was printed and exposed to heat on a hotplate, which caused the wax to penetrate the paper. Secondly, masks were used to construct the electrodes. One mask was placed in the center of the detection microzone, and a layer of graphitized carbon was deposited by sputtering to create the working and auxiliary electrodes. Afterward, a second mask was utilized to generate the reference electrodes using commercial silver ink. Then, the mask was removed, leaving the electrodes marked on the paper. Thirdly, the contacts of the three electrodes were isolated using a layer of commercial wax. The paper zone adjacent to the electrode zone (consisting of a 10 mm diameter circle delimited by commercial solid ink) represents the immunoreaction area. The diameter of the working electrode was 5 mm. The Randles–Sevcik equation was used to calculate the electroactive surface area and the theoretical model is presented in Supporting Information S1. Finally, each OMPD device was cut and stored away from light (Figure 1).

2.4. Modification of the GPE Working Electrode with the CNH/GNP Nanocomposite

CNHsox dispersion was prepared prior to the electrode surface modification. Initially, 10 mg of CNH were weighed and dispersed in 1 mL of DMF and then sonicated (50 Hz) for 1 min. Subsequently, 10 μL of the initial dispersion was diluted using 1 mL of DMF to achieve a final dispersion concentration of 100 μg mL−1. CNH/GNP nanoarchitecture on the working electrode surface was obtained using the DHBT method. For this, 1 mL of the initial CNH dispersion was diluted by half (50 μg mL−1 CNH) and was added to 1 mmol L−1 HAuCl4 solution in an acid medium (0.5 mol L−1 H2SO4) and sonicated for 15 min. Next, the suspension was placed on the surface of the GPE, and a fixed potential of −3.0 V was applied for 150 s. Under these experimental conditions, the GNP electrodeposition and CNH reduction were achieved simultaneously. Methodological conditions such as the electrodeposition time and potential, CNH concentration, and optimum pH, among others, were optimized in Section 3.2. Finally, the GPE/CNH/GNP were washed with Milli-Q water several times and stored away from light, followed by XRD, SEM, EDS, and CV characterization.

2.5. Functionalization and Immobilization of the OMPD Microzones

The OMPD microzone containing the detection system was conditioned to immobilize the mouse monoclonal anti-ZEA antibodies specific to ZEA. The GPE/CNH/GNP working electrode was put in contact with a 3-mercaptopropionic acid solution (MPA 0.05 mol L−1) in EtOH/H2O (75/25, v/v) for 15 h at 25 °C. In this step, the −SH group of MPA reacts with the surface of gold nanoporous material, leaving free −COOH groups. In order to covalently immobilize specific antibodies, these groups were activated through the EDC and NHS stage (0.05 mol L−1 phosphate buffer saline (PBS, pH 7.20)) and then evaporated to dryness. Then, the detection microzone was rinsed with purified water and dried with pure nitrogen gas. Finally, the modified working electrode was exposed to 20 μL of an antibody solution (10 μg mL−1 in 0.01 mol L−1 PBS, pH 7.20) overnight at 4 °C. The microzone was finally washed with a phosphate buffer (pH 7.0) and stored at 4 °C until use. Additionally, the paper zone adjacent to the detection microzone was wetted with the ZEA-HPR enzyme conjugate solution (0.01 mol L−1 PBS, pH 7.20) and dried at room temperature. The functionalized devices were stable for at least 1 month.

2.6. Sample Preparation and Extraction

The samples were extracted and pretreated using the AgraQuant® Zearalenone Plus Test Kit. Representative samples of corn were ground until at least 75% of the ground material passed through a 20-mesh sieve, the particle size of a fine instant coffee. A total of 25 g of corn samples were blended with 125 mL of an aqueous solution of 70% methanol (v/v) and were shaken vigorously for 3 min. The obtained extracts were filtered using a Whatman #1 filter and collected. Then, the filtrate was diluted fourfold with purified water and used as a sample for all assays.

2.7. Analytical Procedure Detail for ZEA Determination on the OMPDs—GPE/CNH/GNP

The devices were applied to ZEA determination in contaminated and non-contaminated corn samples. The non-specific bindings on the immunodetection microzone were blocked by 5 min treatment at 37 °C with 3% skim milk in 0.01 mol L−1 PBS pH 7.20 and washed with the same buffer. The sample filtrate was diluted twice with 0.01 mol L−1 PBS pH 7.20, then 20 μL was deposited on the zone adjacent to the detection microzone and incubated for 5 min at room temperature. In this area, the immunocompetence occurred between the ZEA and ZEA-HPR enzyme conjugate for the active sites of the anti-ZEA specific antibodies immobilized on GPE/CNH/GNP. After, this microzone was washed with 0.01 mol L−1 PBS pH 7.20. Finally, 20 μL of substrate solution (1 mmol L−1 catechol in phosphate-citrate buffer, pH 5.0 containing 1 mmol L−1 H2O2) was deposited on the folded microzone and incubated for 1 min at room temperature. Later, the enzymatic product (o-benzoquinone) was measured on the working electrode surface. A calibration curve was obtained by amperometry following our protocol with a series of standards that covered a ZEA concentration range from 10 to 1000 µg Kg−1. Amperometric detection was performed on the GPE/CNH/GNP modified working electrode at −0.1 V vs. Ag as a pseudo-reference electrode at room temperature in a 0.1 mol L−1 phosphate-citrate buffer pH 5.0. The resulting cathodic current was inversely proportional to the ZEA concentration in the corn samples.

2.8. Commercial ELISA Kit ZEA

ZEA standards for experimental and correlation assays were provided from the commercial kit (see Section 2.1). A calibration curve for the spectrophotometric method was obtained by following the manufacturer’s protocol with a range of concentrations from 25 to 1000 µg Kg−1 at 650 nm.

3. Results and Discussion

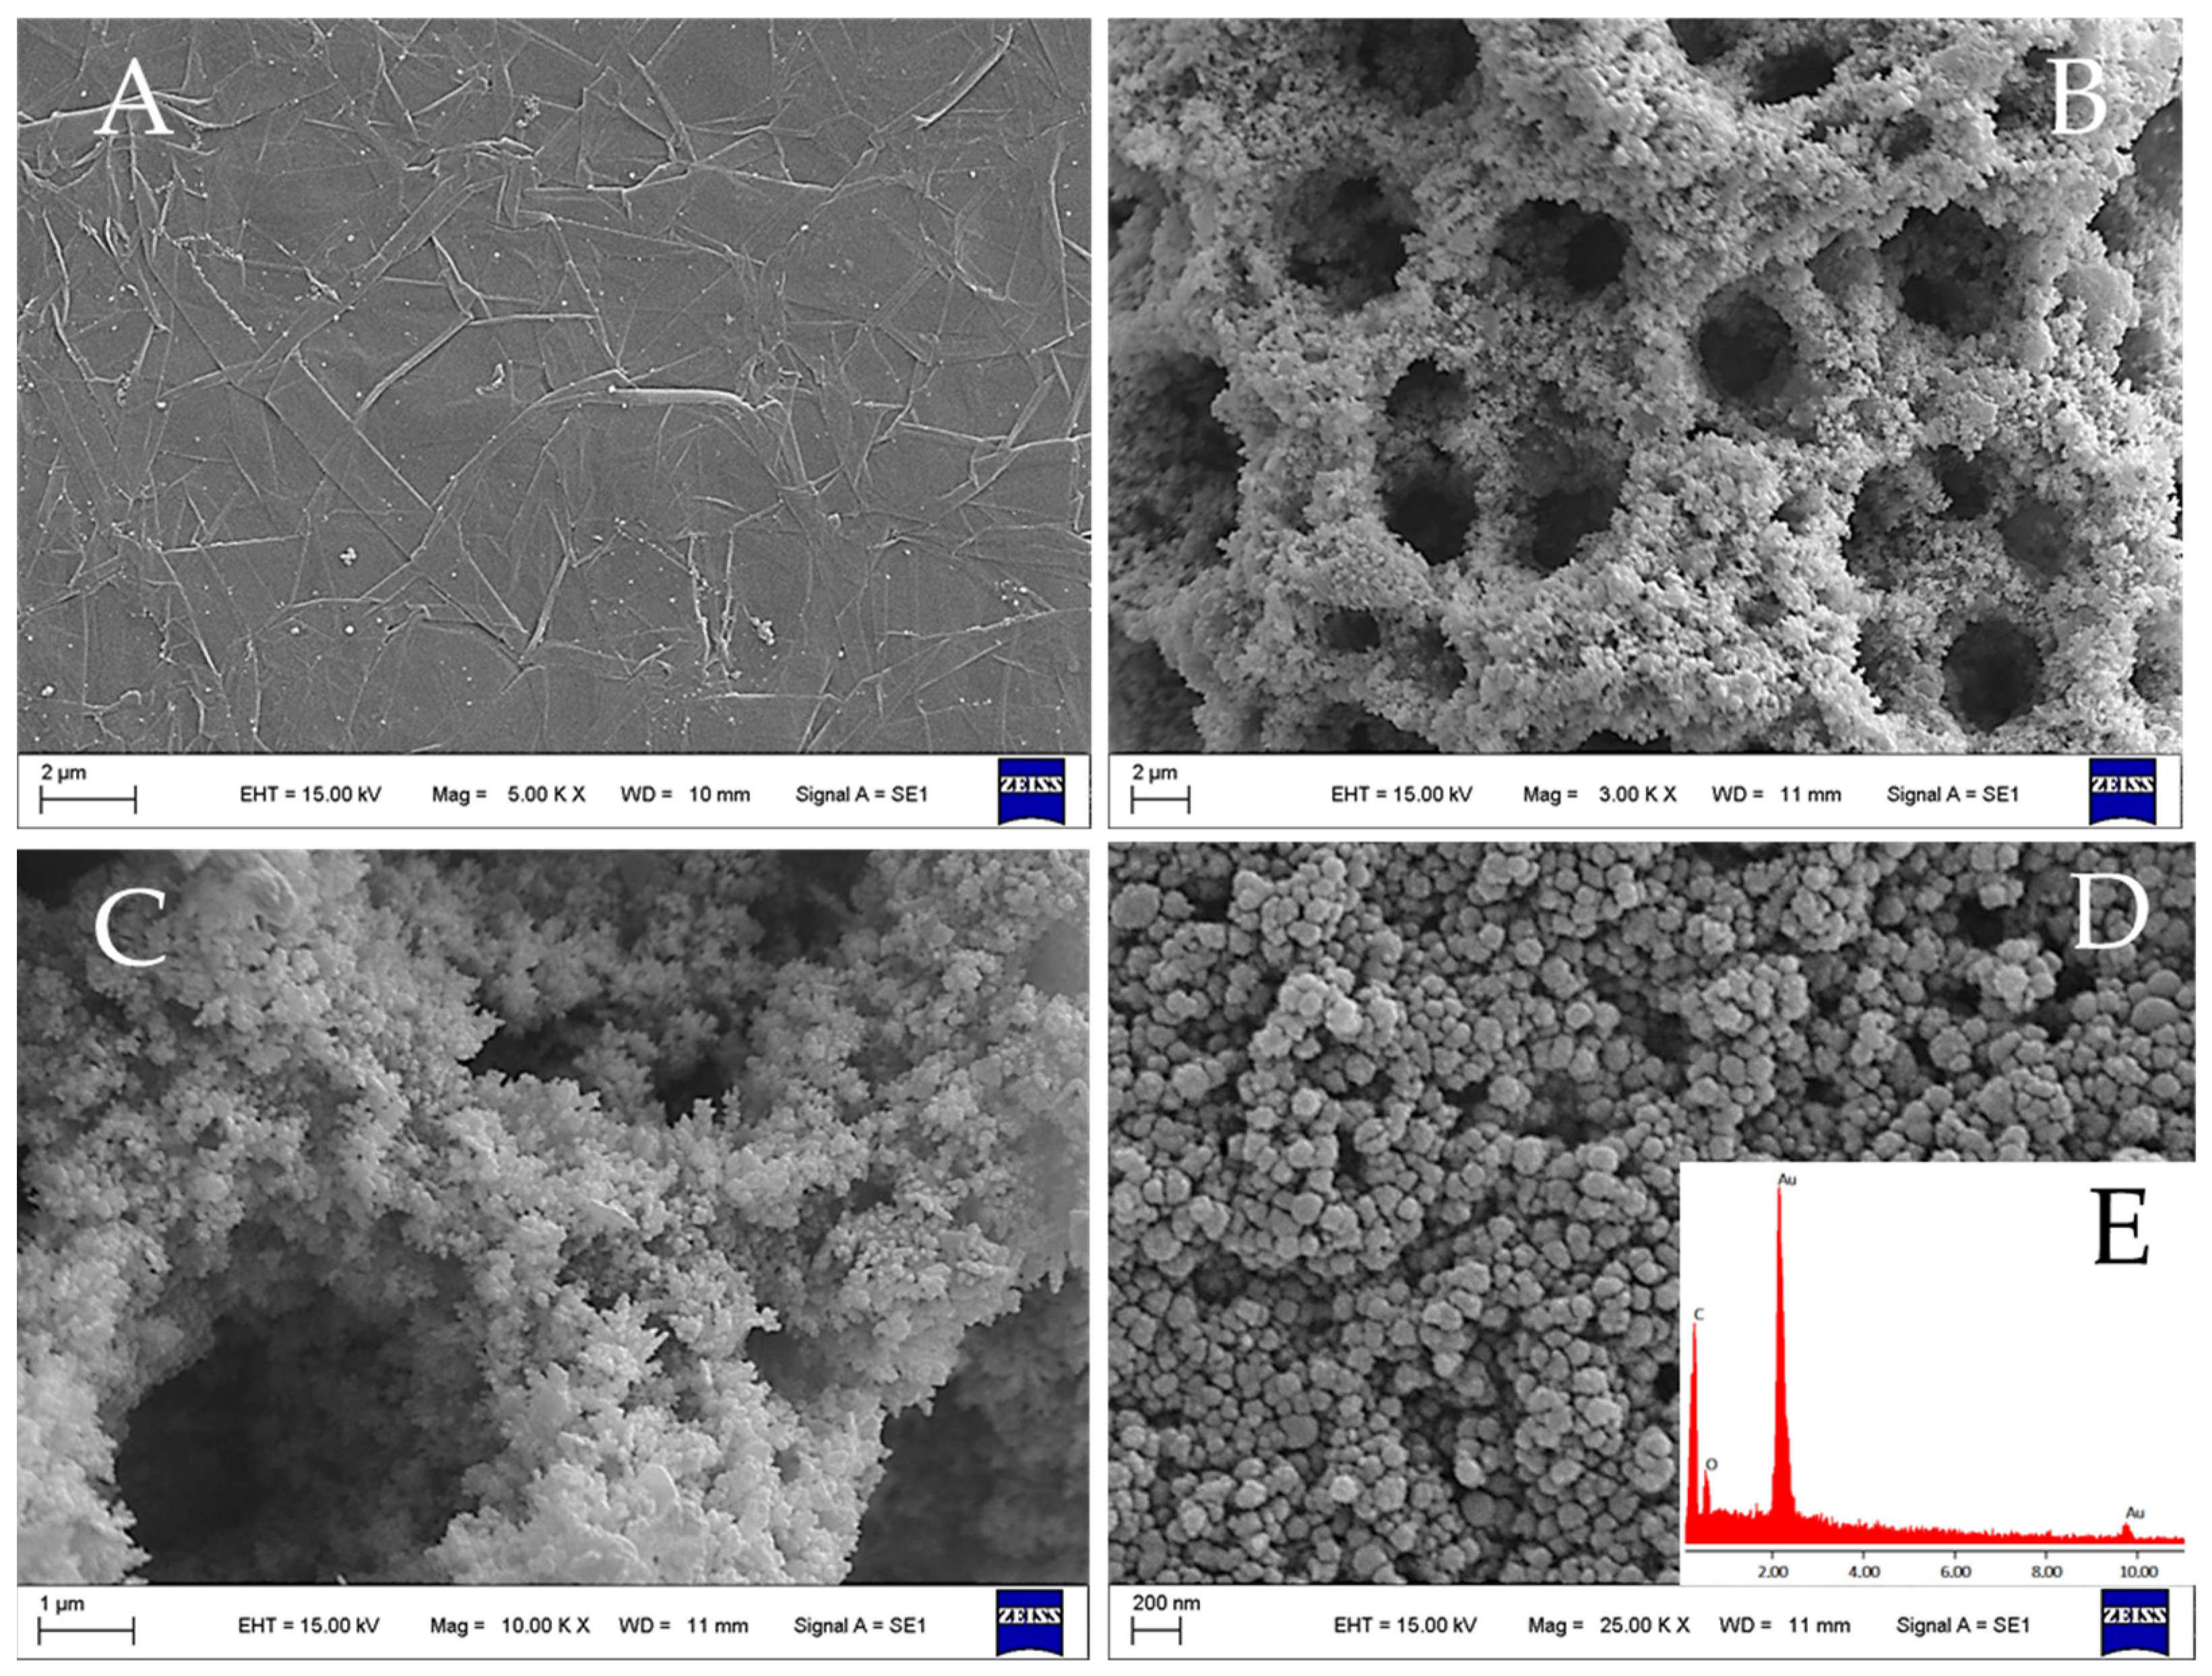
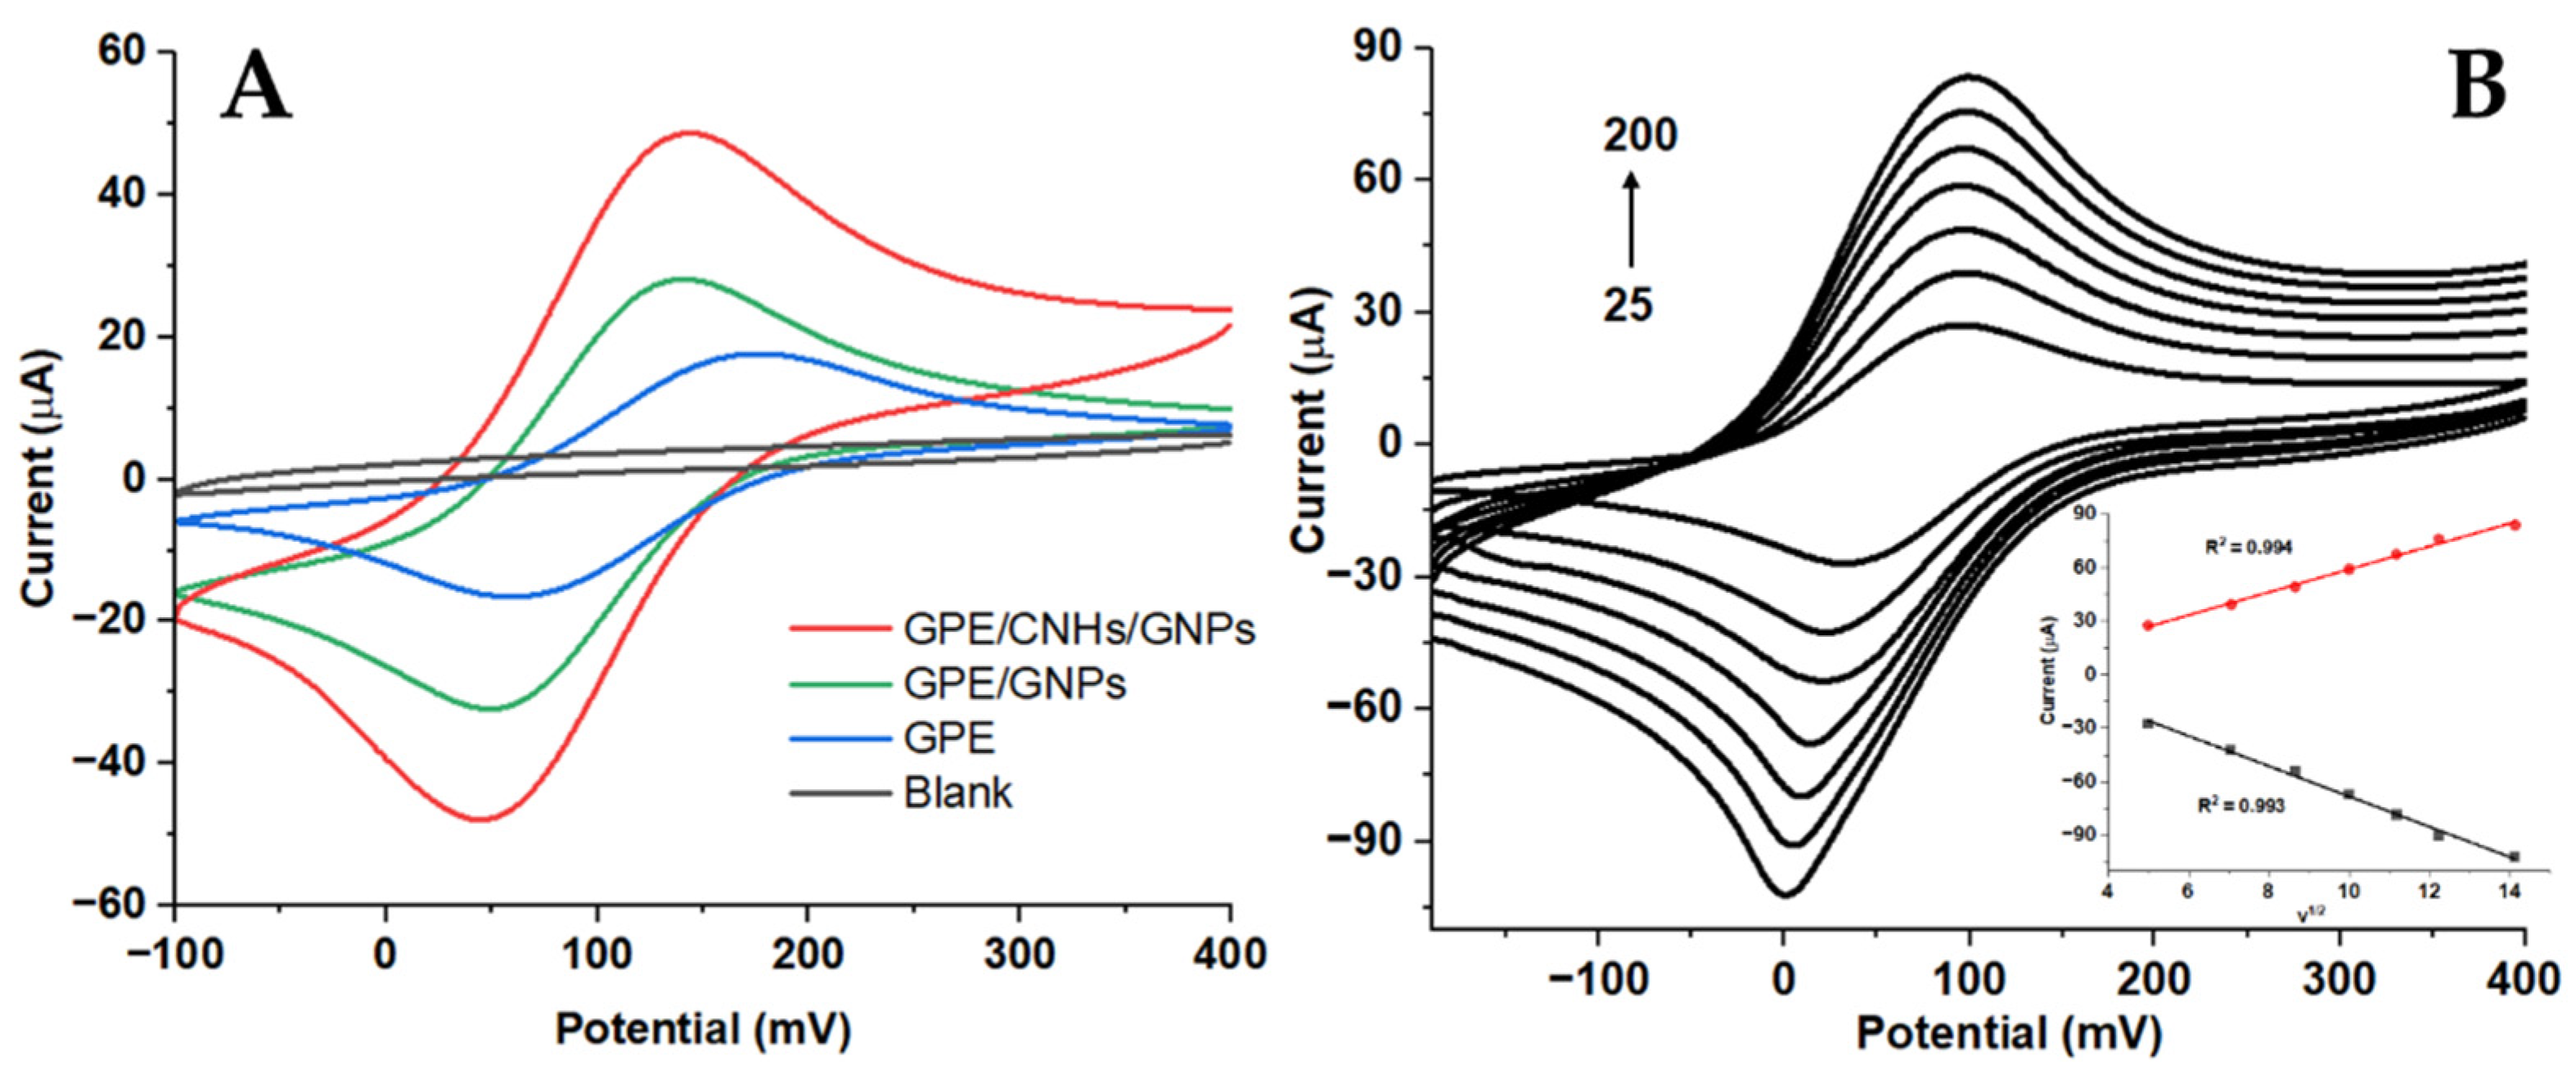
3.1. Synthesis and Characterization of the GPE/CNH/GNP Working Electrode

The CNH/GNP nanocomposite was synthesized via DHBT electrodeposition on the GPE working electrode. The DHBT electrodeposition method relies on generating hydrogen bubbles at the electrode surface by applying a negative potential in an acid medium. These hydrogen bubbles effectively hinder the migration of gold ions to nucleation sites on the electrode, leading to the spontaneous formation of random micropores during the metal deposition process. This resulting honeycomb-like dendritic structure significantly enhances the surface roughness, thereby providing an enlarged surface area [27]. The GPE/CNH/GNP were subjected to morphological characterization through SEM imaging at various magnification levels. Figure 2A exhibits the unaltered morphology of the graphite carbon surface prior to any modification procedure. Figure 2B,C provide a detailed view of the distinctive, uniformly distributed gold nanoporous honeycomb-like structures that emerge following the graphite modification. The nanocomposite surface exhibits structural anomalies resulting from the intertwining network of CNH with dendritic gold formations. Also, Figure 2D illustrates the presence of CNH, acting as the scaffolding for generating the dendritic gold honeycomb structures. An EDS spectrum was examined to investigate the elemental composition of the nanoarchitecture. As depicted in Figure 2E (inset), the spectrum exhibits distinct peaks corresponding to carbon (C) at an energy of 0.24 KeV and gold (Au) at energies of 2.35 and 9.91 KeV. In the semi-quantitative microanalysis, it was determined that the concentration of gold (Au) accounted for 90%, while carbon (C) constituted 10% of the elemental composition. The crystalline structure of the GPE/CNH/GNP was characterized by XRD measurement. The peaks at 2θ (23.1 and 26.5°) were from graphite and CNH, respectively, and the peaks at 2θ (42.6, 54.3 and 68.9°) resulted from the GNP. The XRD pattern is shown in Supporting Information (Figure S1).
The contact angle between the GPE/CNH/GNP working electrode and liquid (Milli-Q water) was measured using specific software (DROP Image Advanced 2.2v). The obtained contact angle was higher than 90°, indicating the hydrophobicity of the modified electrode surface.
Cyclic voltammograms of the [Fe(CN)6]−3/−4 redox probe serve as a practical and invaluable tool for monitoring the properties of an electrode surface. In Figure 3A, we present the electrochemical responses of the GPE at various stages of modification. CVs were conducted for three distinct electrode configurations: the unmodified GPE (represented in blue), the GPE with incorporated gold nanoporous (GNP, depicted in green), and the GPE featuring a nanocomposite of carbon nanohorns (CNH) and GNP (illustrated in red). These measurements were carried out in a 1 mmol L−1 [Fe(CN)6]−3 solution, using a 0.1 mol L−1 KCl electrolyte with a pH of 6.50. The potential sweep ranged from +400 to −100 mV (vs Ag), with a scan rate of 75 mV s−1. CVs of the unmodified GPE exhibited well-defined features and a diffusion-controlled redox process. Importantly, when comparing the modified electrodes to the unmodified GPE, a discernible increase in peak currents was observed. This behavior highlights the enhanced electrochemical behavior achieved through electrode modification, providing valuable insights into the improved characteristics of the electrode surface. Furthermore, a shift in the electrode potential towards less positive values was observed for the GPE/GNP and GPE/CNH/GNP configurations compared to the unmodified electrode. This shift can primarily be attributed to the exceptional electrical conductivity and the incremented electroactive surface area conferred by the modifications. The second effect can be ascribed to the improved electron transfer kinetics resulting from the presence of active sites. This behavior could also be evidenced in a report article [27], which focuses on modifying the working electrode with gold and carbon nanofibers for prostate-specific antigen detection. These sites originate from the numerous defects within the interspersed carbon nanohorns on the nanoporous gold surface. An evaluation of the influence of scan rate on peak current was undertaken to examine the electrochemical behavior of the GPE/CNH/GNP nanocomposite. This analysis was performed in a 5 mmol L−1 [Fe(CN)6]−3 solution at a potential range from +400 to −100 mV, as depicted in Figure 3B. The experiments enclosed a range of scan rates, varying from 25 to 200 mV s−1. Notably, a linear relationship was established between the anodic and cathodic peak current values and the square root of the scan rate. This finding confirms that the electrochemical behavior of the redox probe at the CNH/GNP nanocomposite electrode is subject to a diffusion-controlled process.

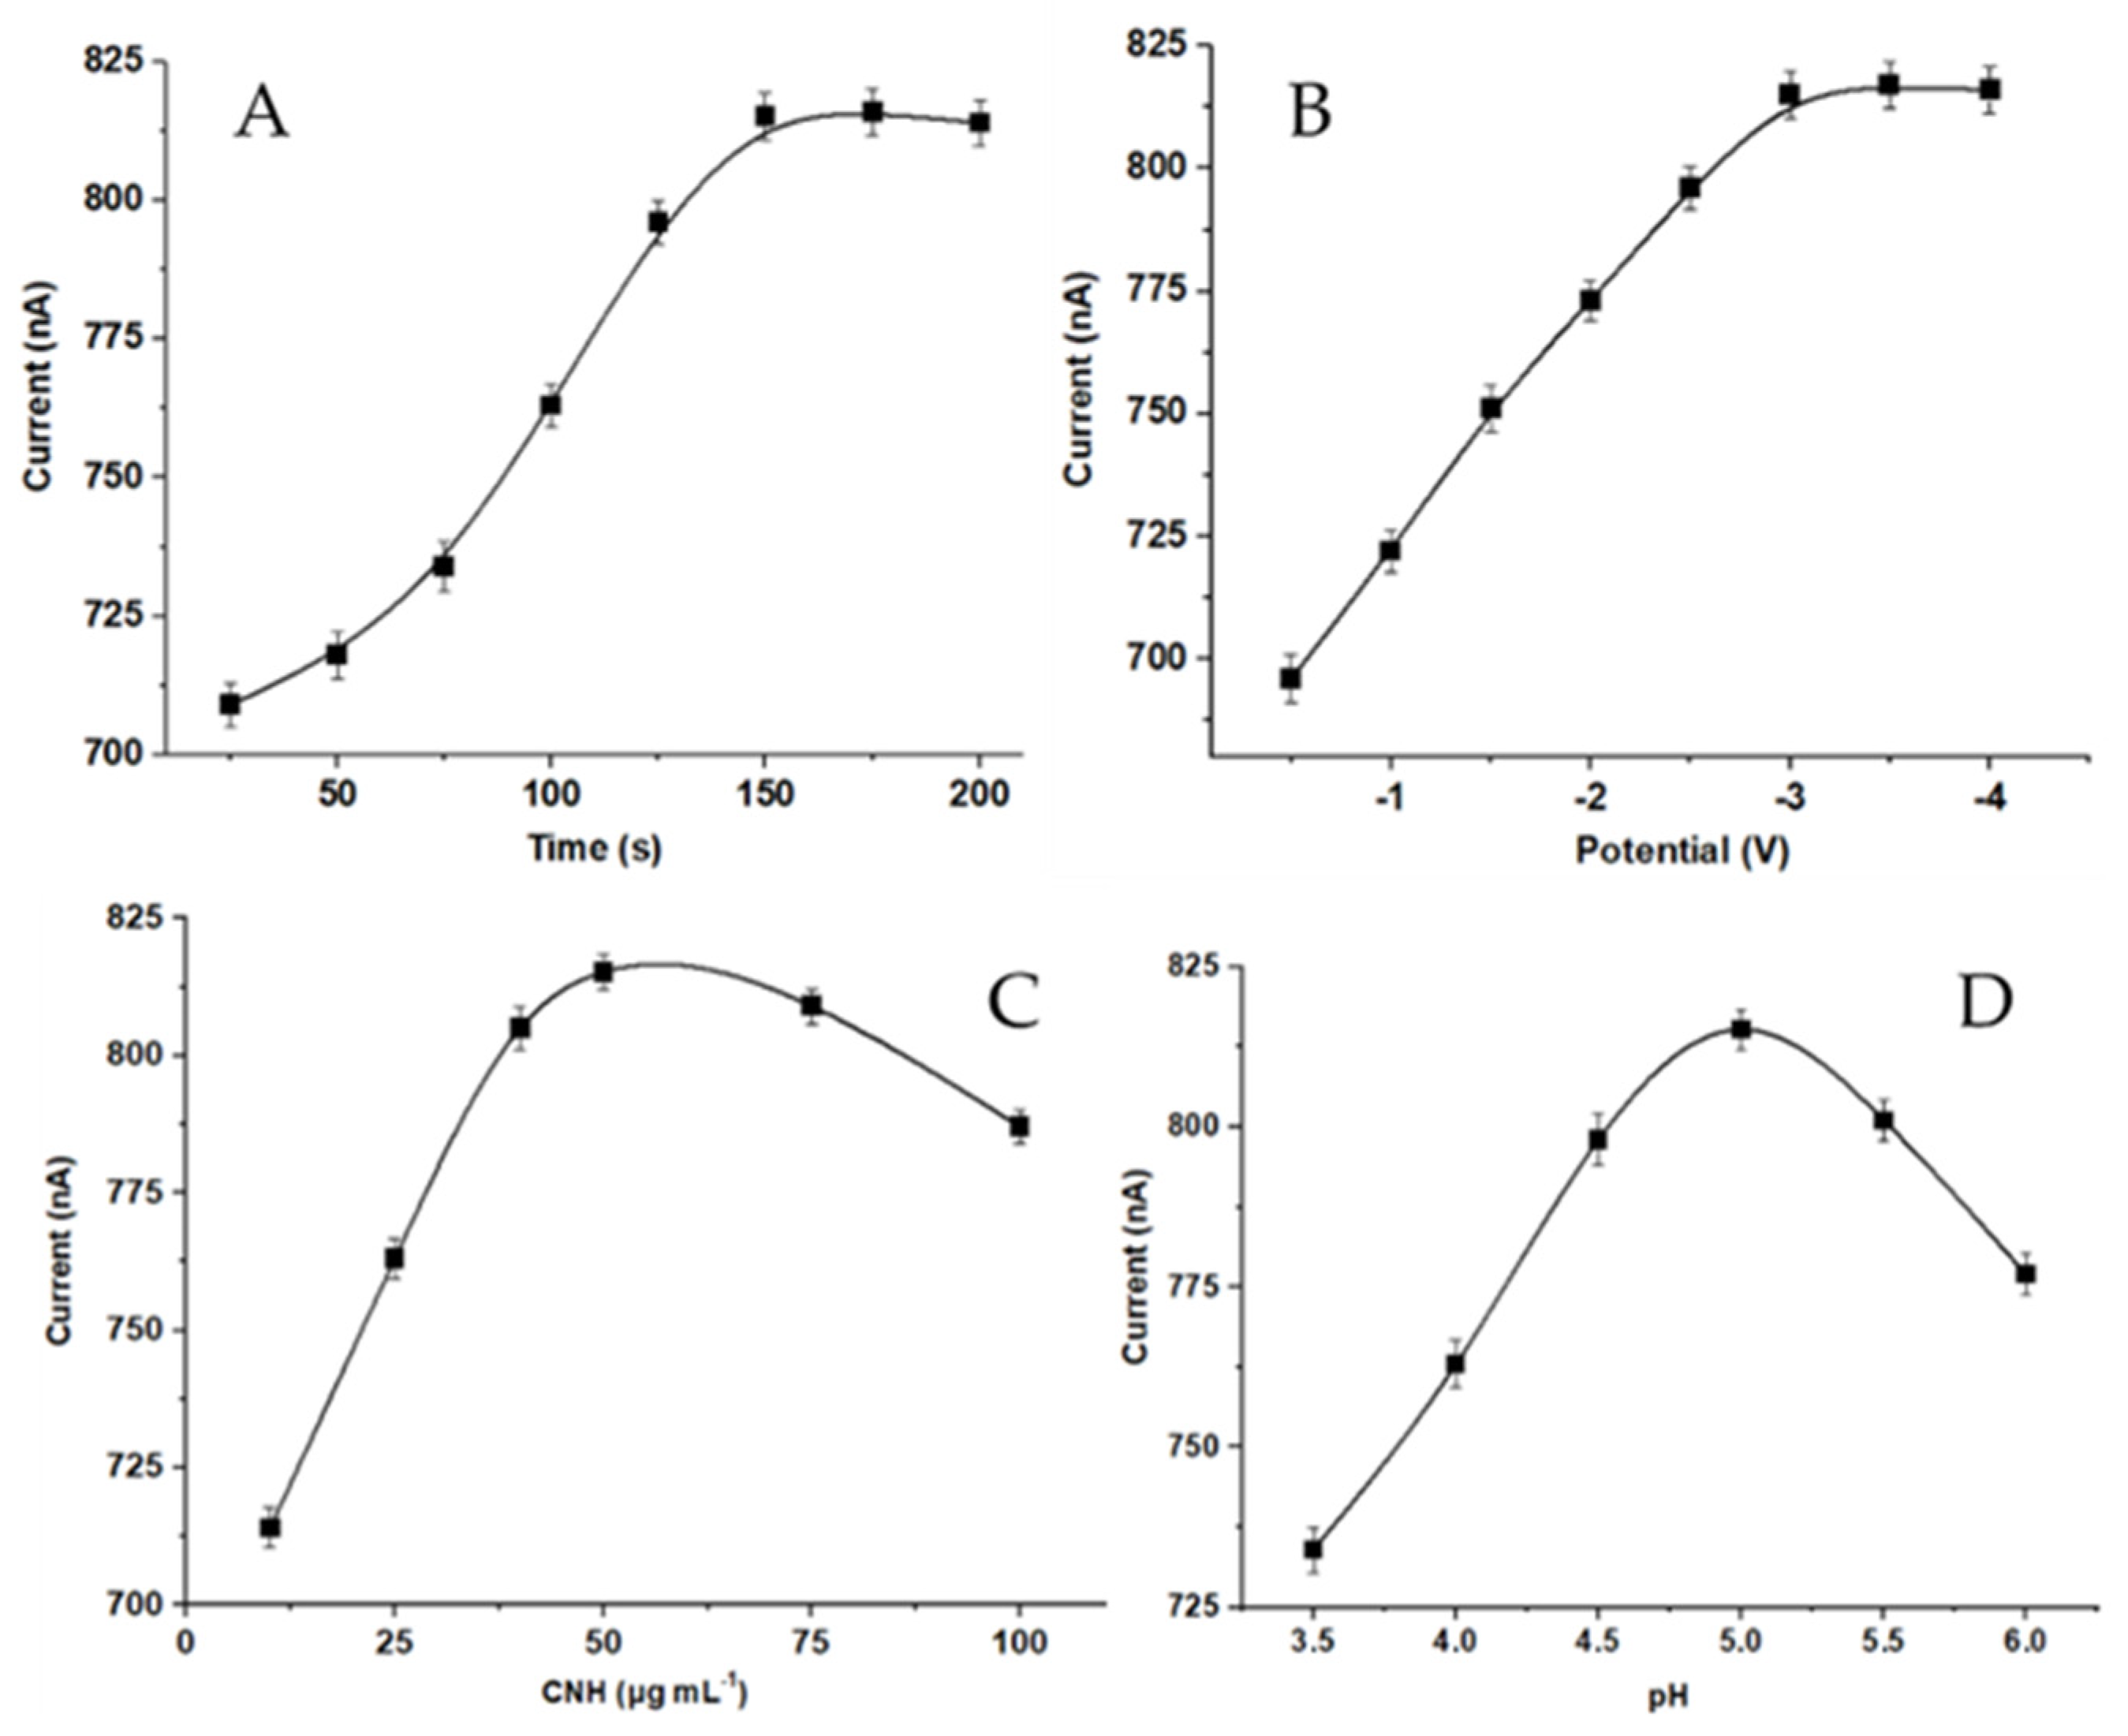
3.2. Analytical Optimization of Experimental Parameters

The electrochemical deposition method was selected for the fabrication of the modified electrode due to its suitability for controlling the size, shape, and composition of the nanocomposite. These attributes can be adjusted by controlling parameters such as the electrolyte solutions, current density, and deposition potentials during the deposition process. Additionally, the time and potential applied during the electrodeposition procedure are critical factors with significant influence on the sensitivity and performance of the resulting device. The successful deposition of the nanocomposite on the GPE surface relies on optimizing two key parameters: the deposition time (Tdep) and deposition potential (Edep). These parameters were systematically adjusted to achieve the most favorable analytical performance. In the context of Tdep optimization, experiments were conducted at Edep = −3.0 V, with Tdep varying from 25 to 200 s. As depicted in Figure 4A, the current exhibited an increasing trend with higher Tdep values until it reached a plateau at 150 s. Beyond this point, the current remained relatively constant, thus indicating that a Tdep of 150 s represents the optimal condition for the deposition process. Furthermore, the deposition potential (Edep) was evaluated within the range of −0.5 to −4.0 V, while maintaining a constant Tdep of 150 s. As illustrated in Figure 4B, a marked increase in current values was observed as the applied potential became more negative, reaching a peak at −3.0 V. Beyond this value, the current remained constant in the range of −3.0 to −4.0 V. Consequently, it was determined that the optimal conditions for the electrodeposition process involve Tdep = 150 s and Edep = –3.0 V, which were subsequently employed in all measurements. Another critical parameter impacting the electrochemical response was the concentration of carbon nanohorns. An evaluation of the electrochemical signal was conducted across CNH concentrations ranging from 10 to 100 μg mL−1, as depicted in Figure 4C. In this investigation, a significant enhancement in current was observed as the CNH concentration increased up to 50 μg mL−1, with the current reaching a plateau at higher concentrations. This result confirmed that the optimal CNH concentration for the desired electrochemical performance was 50 μg mL−1. Furthermore, to establish the optimal pH conditions for the enzymatic reaction, ZEA detection was carried out over a pH range from 3.5 to 6.0, as indicated in Figure 4D. The obtained signal exhibited a peak response at pH 5.0 when a phosphate-citrate buffer was employed as the solvent. Furthermore, the optimization of the concentration of the anti-ZEA antibody employed in the immobilization process was conducted, although the detailed data are not presented here. Various concentrations of the anti-ZEA capturing antibody, ranging from 1 to 20 µg mL−1, were covalently immobilized onto the GPE/CNH/GNP platform. Subsequent measurement of the enzymatic reaction revealed that the most favorable antibody concentration for achieving optimal performance was 10 µg mL−1.

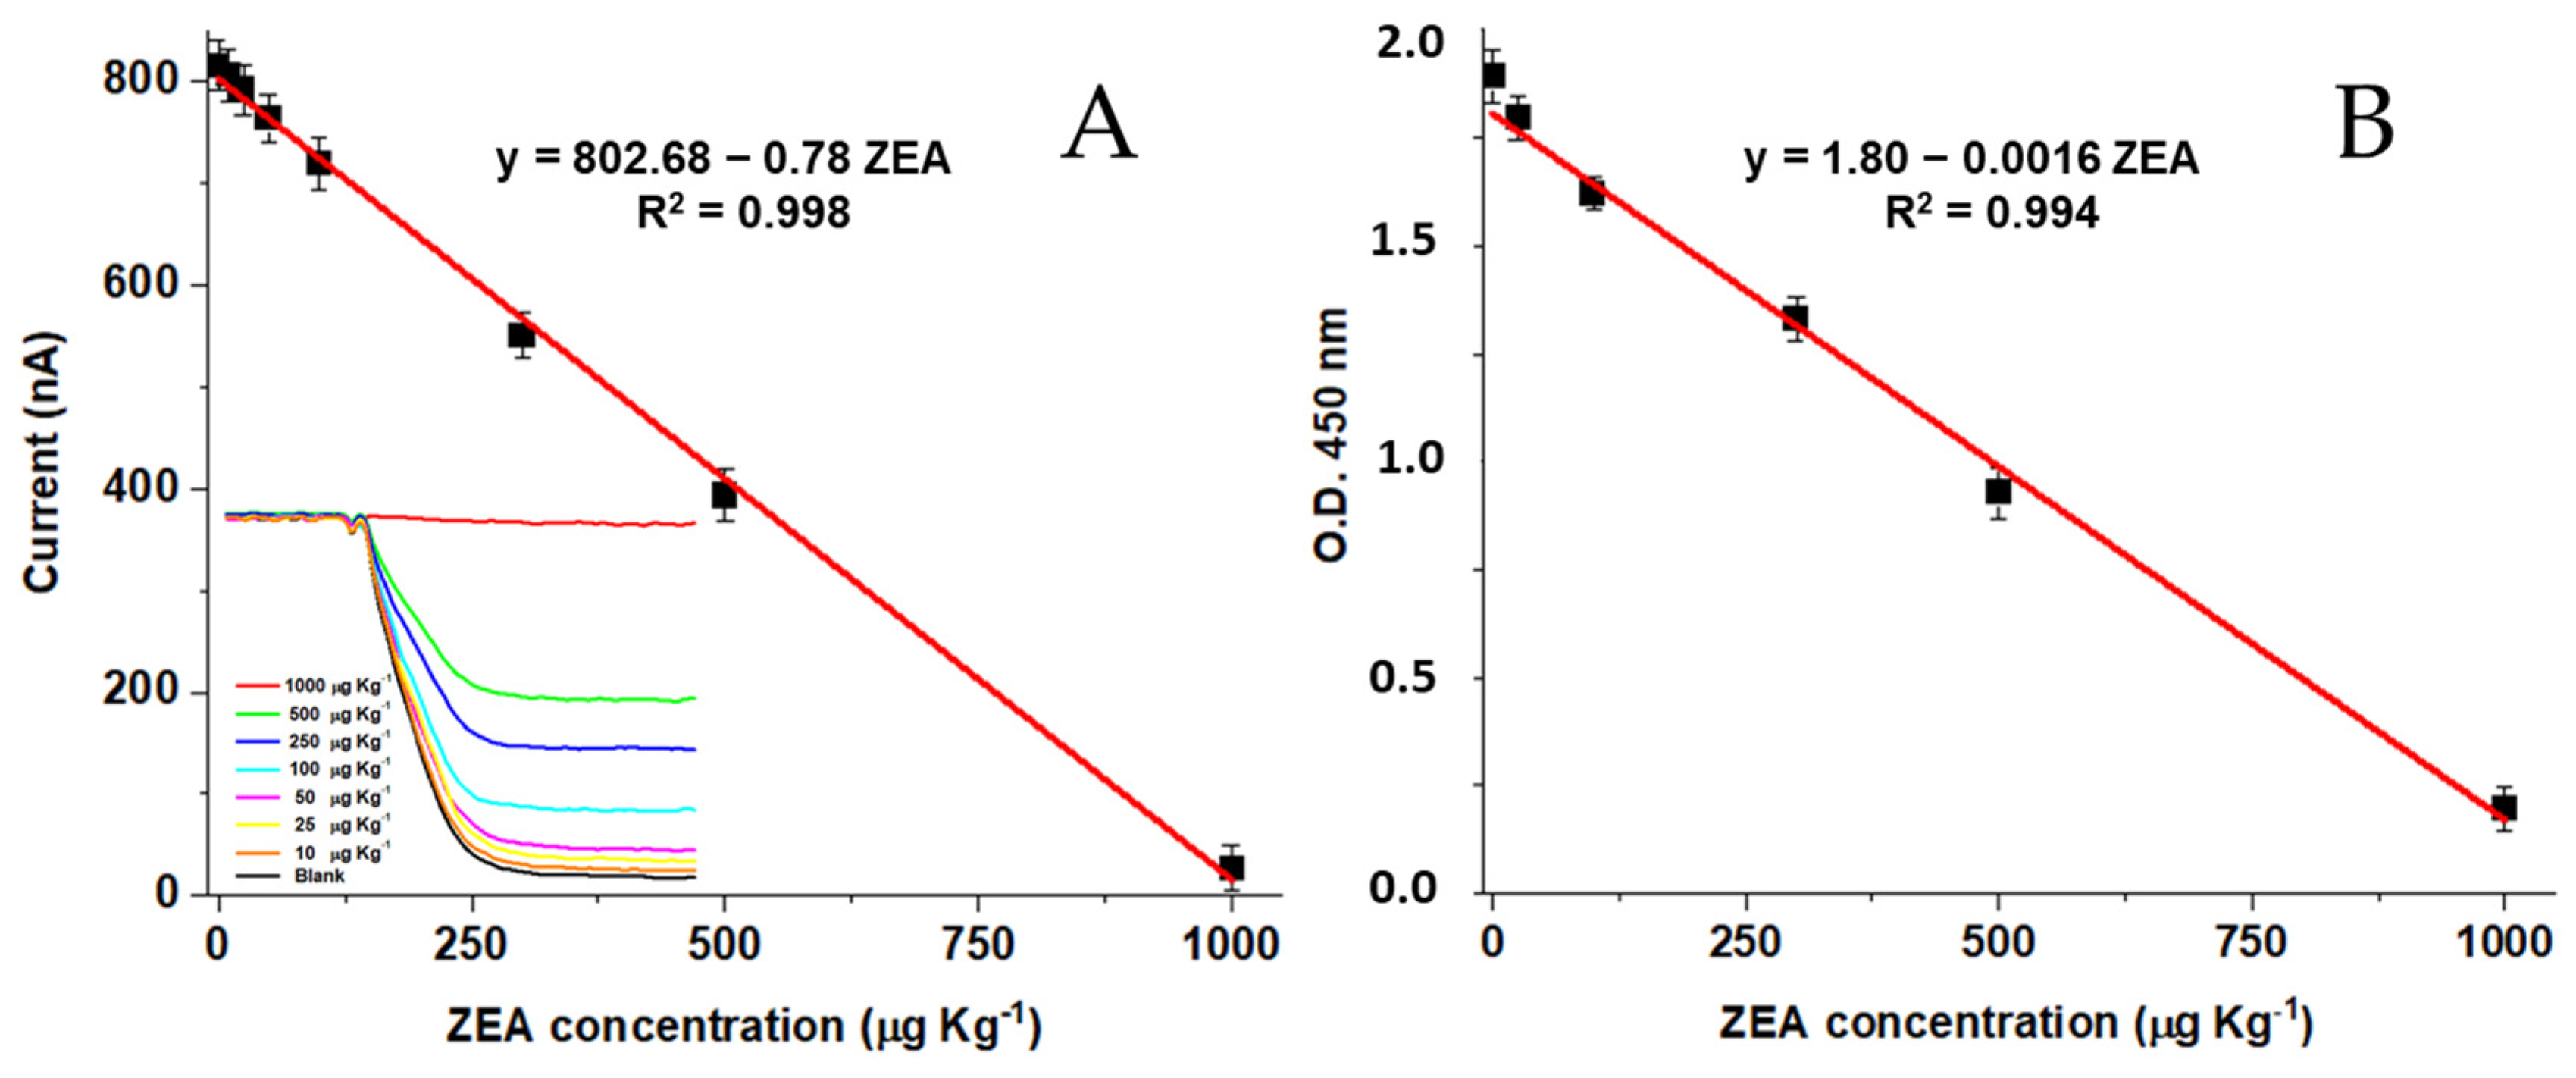
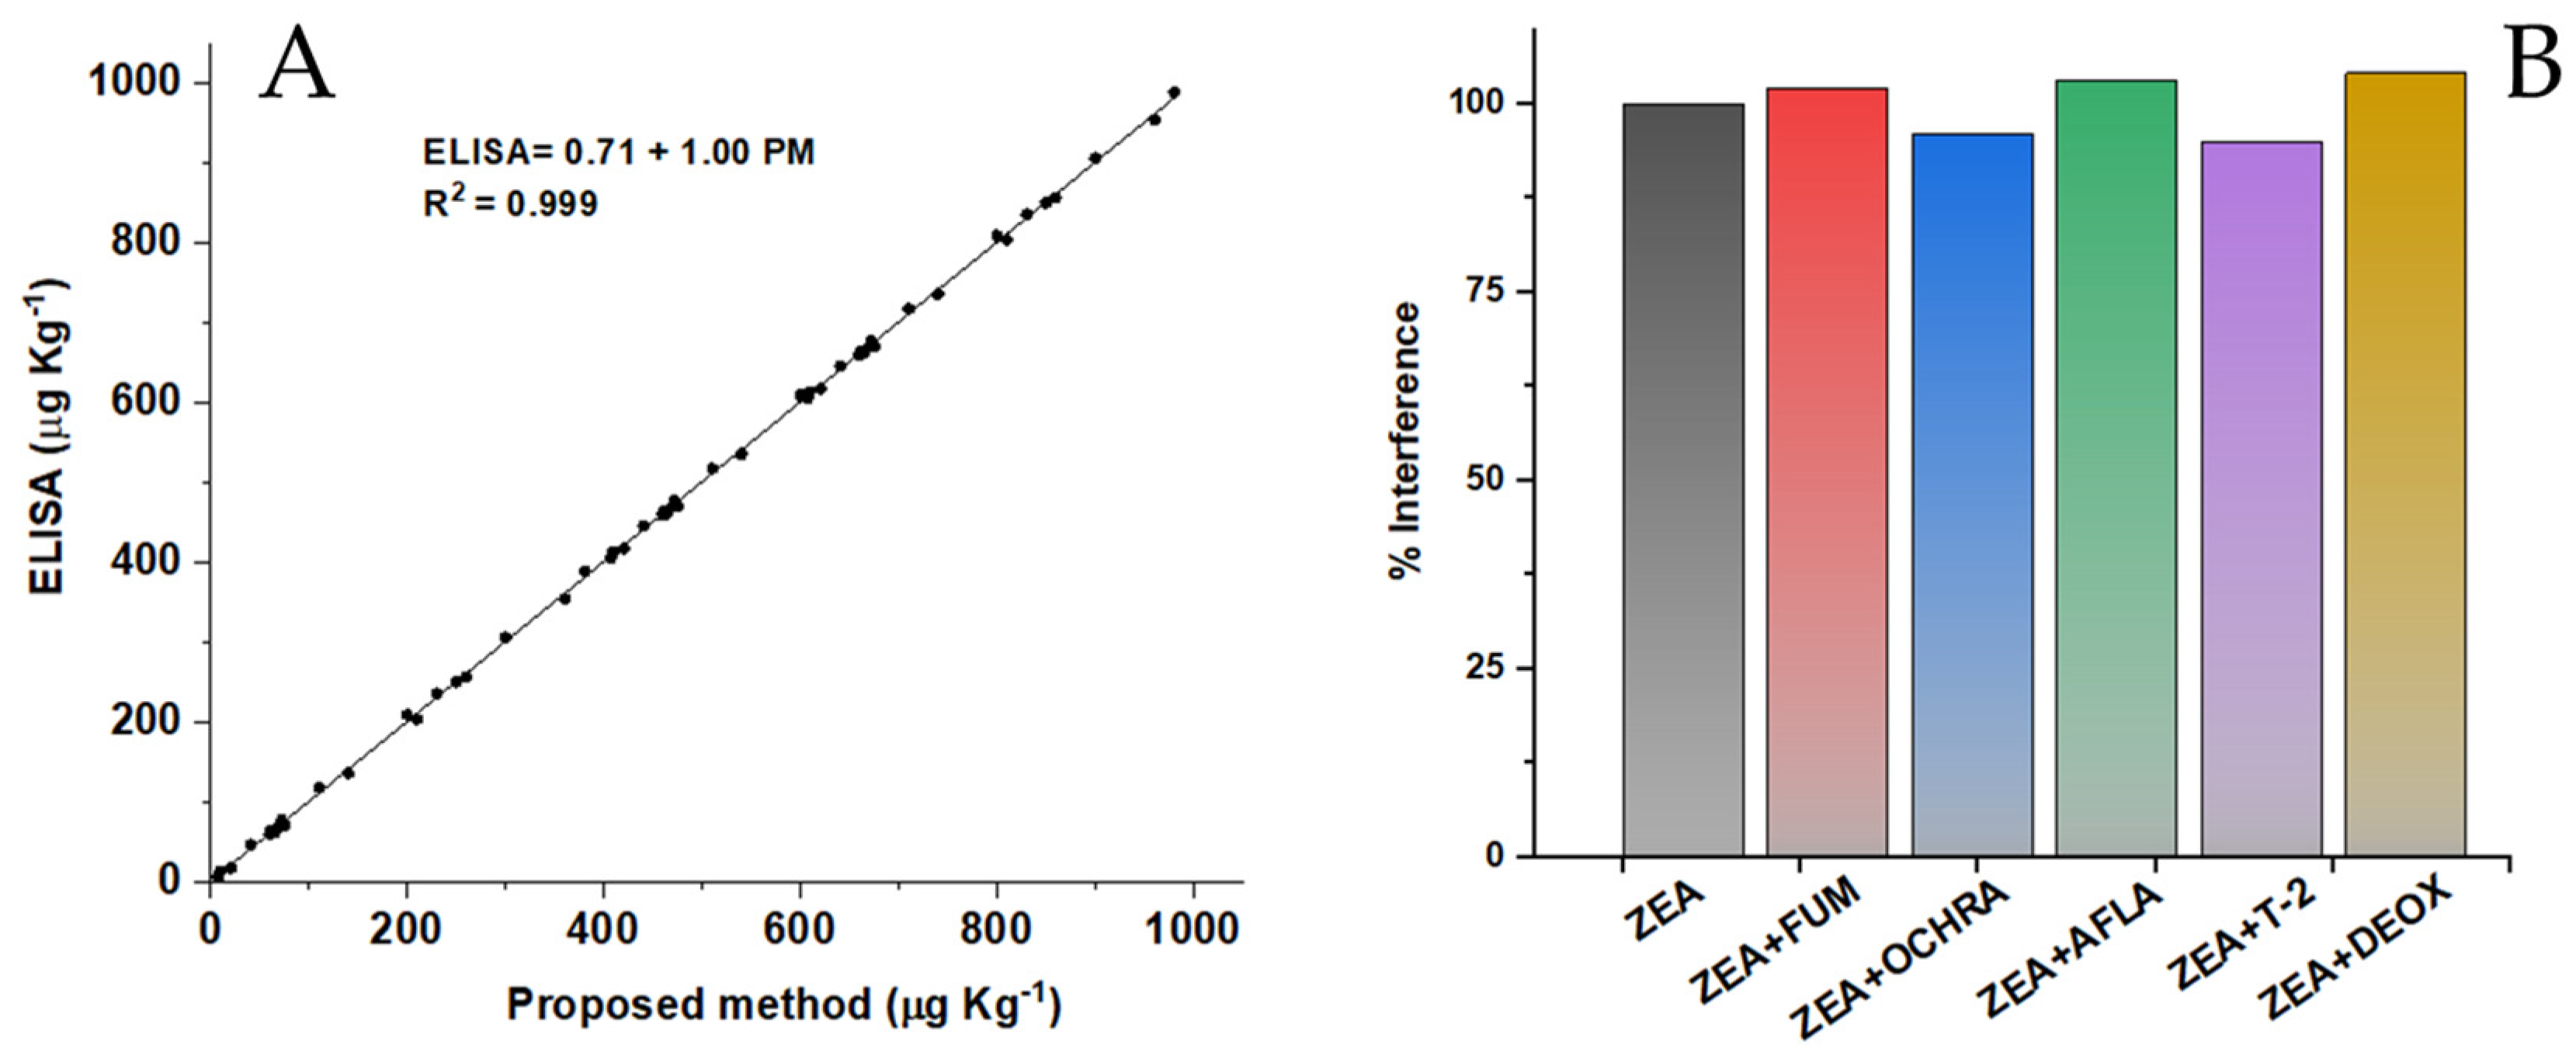
3.3. Analytical Performance of the OMPDs

The ZEA determination using the developed device was performed under the optimized experimental parameters, and the results were analyzed in comparison with the commercial ELISA test kit. The calibration curve was constructed using a 10 to 1000 µg Kg−1 concentration standard. A linear relationship was observed in the proposed concentration range, according to the I (nA) = 802.68 − 0.78 CZEA linear regression equation, with an R2 = 0.998 (Figure 5A, inset: electrochemical signals obtained for the analytical curve). The coefficient of variation (CV%) for the 100 µg Kg−1 ZEA standard solution was 3.95% (n = 5).
The commercial ELISA kit showed a linear relationship from 25 to 1000 µg Kg−1, according to the A (O.D.) = 1.80 + 0.0016 CZEA equation with a R2 = 0.994 (Figure 5B). The coefficient of variation (CV%) for the 100 µg Kg−1 ZEA standard solution was 7.05% (n = 5). The limit of detection (LOD) and limit of quantification (LOQ) for the OMPD and ELISA were 4.40 and 21.53 µg Kg−1, respectively, and 14.90 and 25 µg Kg−1, respectively (according to IUPAC recommendations). These values demonstrated that our OMPD can be used for ZEA determination in cereals with a wide range of concentrations, and the sensitivity of the electrochemical method was superior in comparison to the spectrophotometric method.
A comparison of the analytical capabilities of the method developed using OMPDs with the traditional ELISA analysis was conducted. ZEA standard solutions were analyzed across a wide range of concentrations. In Figure 6A, the correlation between the results obtained by both methods is depicted; the resulting curve presents a slope close to 1 and an R2 value of 0.999. This result exhibited the correspondence between both methods, thereby emphasizing the notable analytical capabilities of OMPD. Moreover, the total time of the assay procedure for ZEA determination was 10 min, less than the time required to perform the ELISA test. The selectivity of the OMPD for ZEA determination was studied against a 100 µg Kg−1 ZEA standard solution containing some typical mycotoxins (Fumonisin, Ochratoxin, Aflatoxin, T-2 Toxin, and Deoxynivalenol) in five-fold concentration. As can be seen in Figure 6B, the mycotoxins induced less than a 3% variation in the analytical signal. The results demonstrate the selectivity of the system for its subsequent application.
The OMPD precision was studied with a 100 µg Kg−1 ZEA standard solution (Table 1). Within-assay precision was evaluated by measuring responses five times on the same day. During three consecutive days, the same analysis was repeated. The analysis of ZEA exhibited adequate precision, as indicated by CV% values of less than 5% for both intra-assay and inter-assay measurements.
The analytical applicability of the OMPD was assessed through ZEA determination in one uncontaminated sample and six samples spiked under the conditions detailed in Section 2.7. The obtained results were subjected to paired t-tests for comparison with results obtained using the commercial ELISA kit, and the findings indicated statistical equivalence between the two methods with a confidence level of 95%, as illustrated in Table 2. Furthermore, the stability of the device was examined by storing the OMPD in PBS at 4 °C for one month. This investigation revealed a minimal sensitivity loss of less than 5% compared to the immediate response after fabrication.
In recent years, different methods and techniques have been developed to obtain more precise results and conduct systematic analyses of food products. In this sense, chromatographic methods focus on their great sensitivity and the possibility of simultaneous determination. On the other hand, the design of origami microfluidic paper-based devices based on new materials and specific biomolecules has proven to achieve adequate sensitivity at a lower cost. Moreover, it achieved reasonable LOD and linear range for the suitable determination of ZEA in food samples. Our method was compared to reported articles (Table 3), offering the advantage of portability, low cost, and miniaturization to be applied in the food safety field.

4. Conclusions

In this work, we have developed a novel microfluidic immunosensor designed on a paper platform using a wax printing method for ZEA determination. The sensor employed a graphitized carbon working electrode modified with carbon nanohorns-decorated nanoporous gold to immobilize specific monoclonal antibodies. Our results reveal the robustness of our electrochemical immunosensor with a calibration curve exhibiting a linear range from 10 and 1000 µg Kg−1 (R2 = 0.998). The detection and quantification limits for the electrochemical immunosensor were 4.40 and 14.90 µg Kg−1, respectively. A notable advantage of this system is its efficiency, with a significant reduction in the assay time compared to the frequently used commercial ELISA methods. Our findings suggest that this microfluidic sensor, integrated with origami technology and smartphone compatibility, holds great potential as a rapid, portable, and on-site tool for detecting mycotoxins in real samples.

Supplementary Materials

The following supporting information can be downloaded at: https://www.mdpi.com/article/10.3390/chemosensors12010010/s1, S1: Theoretical model to know the electroactive surface area, Figure S1: XRD pattern of the GPE/CNH/GNP crystalline structure.

Author Contributions

Conceptualization, A.L., M.D.R. and F.A.B.; methodology, A.L., S.V.P. and G.A.M.; validation, A.L., S.V.P. and M.A.F.-B.; formal analysis, J.R., M.D.R. and F.A.B.; resources, G.A.M., J.R. and F.A.B.; writing—original draft preparation, A.L., S.V.P., G.A.M., M.A.F.-B., M.D.R. and F.A.B.; writing—review and editing, S.V.P., M.A.F.-B., M.D.R. and F.A.B.; supervision, J.R. and F.A.B.; project administration, S.V.P., G.A.M. and F.A.B.; funding acquisition, S.V.P., G.A.M., M.A.F.-B. and F.A.B. All authors have read and agreed to the published version of the manuscript.

Funding

Funding is acknowledged from the Universidad Nacional de San Luis (PROICO 02-2220), from Agencia Nacional de Promoción Científica y Tecnológica (AGENCIA, FONCyT, Argentina, PICT-2021-GRF-TII-0390, PICT-2021-GRF-TI-0136, PICT-2020-2347, and PICT-2020-2369), from Consejo Nacional de Investigaciones Científicas y Técnicas (CONICET, Argentina, PIP11220200100033CO) and from Ministerio de Ciencia, Tecnología e Innovación, Argentina, Proyectos de Redes Federales de Alto Impacto: NANOQUIMISENS (IF-2023-85161983-APN-DNOYPI#MCT).

Institutional Review Board Statement

Not applicable.

Informed Consent Statement

Not applicable.

Data Availability Statement

The complete data of this work can be obtained upon request from the corresponding author.

Acknowledgments

The Laboratorio de Bioanalítica’s research group (INQUISAL CONICET—UNSL) would like to extend their gratitude to Julio Raba for his years of hard work, camaraderie, and friendship, as well as his selfless dedication to science and scientific knowledge.

Conflicts of Interest

The authors declare no conflicts of interest.

References

  1. Sun, K.; Fan, Y.; Hebda, M.; Zhang, Y. Origami Microfluidics: A Review of Research Progress and Biomedical Applications. Biomed. Mater. Devices 2022, 1, 388–401. [Google Scholar] [CrossRef]
  2. Arduini, F. Electrochemical paper-based devices: When the simple replacement of the support to print ecodesigned electrodes radically improves the features of the electrochemical devices. Curr. Opin. Electrochem. 2022, 35, 101090. [Google Scholar] [CrossRef]
  3. Colozza, N.; Di Meo, E.; Mucaria, A.; Moscone, D.; Arduini, F. An origami paper-based electrochemical biosensing platform for quality control of agri-food waste in the valorization strategy. Microchim. Acta 2022, 189, 311. [Google Scholar] [CrossRef]
  4. Arduini, F.; Cinti, S.; Caratelli, V.; Amendola, L.; Palleschi, G.; Moscone, D. Origami multiple paper-based electrochemical biosensors for pesticide detection. Biosens. Bioelectron. 2019, 126, 346–354. [Google Scholar] [CrossRef]
  5. Jin, Y.; Aziz, A.U.R.; Wu, B.; Lv, Y.; Zhang, H.; Li, N.; Liu, B.; Zhang, Z. The road to unconventional detections: Paper-based microfluidic chips. Micromachines 2022, 13, 1835. [Google Scholar] [CrossRef]
  6. Silva-Neto, H.A.; Rocha, D.S.; Pradela-Filho, L.A.; Paixão, T.R.; Coltro, W.K.T. (Bio)electrodes on Paper Platforms as Simple and Portable Analytical Tools for Bioanalytical Applications. In Advances in Bioelectrochemistry; Crespilho, F.N., Ed.; Springer International Publishing: Berlin/Heidelberg, Germany, 2023; Volume 5, pp. 181–202. [Google Scholar]
  7. Li, J.; Chang, H.; Zhang, N.; He, Y.; Zhang, D.; Liu, B.; Fang, Y. Recent advances in enzyme inhibition based-electrochemical biosensors for pharmaceutical and environmental analysis. Talanta 2022, 253, 124092. [Google Scholar] [CrossRef]
  8. Weng, X.; Fu, Z.; Zhang, C.; Jiang, W.; Jiang, H. A portable 3D microfluidic origami biosensor for cortisol detection in human sweat. Anal. Chem. 2022, 94, 3526–3534. [Google Scholar] [CrossRef]
  9. Loo, J.F.C.; Ho, A.H.P.; Mak, W.C. Printed microfluidic biosensors and their biomedical applications. In Microfluidic Biosensors; Academic Press: Cambridge, MA, USA, 2023; pp. 1–40. [Google Scholar]
  10. Ozer, T.; Henry, C.S. Paper based analytical devices for virus detection: Recent strategies for current and future pandemics. TrAC Trends Anal. Chem. 2021, 144, 116424. [Google Scholar] [CrossRef]
  11. Tsagkaris, A.S.; Nelis, J.L.; Campbell, K.; Elliott, C.T.; Pulkrabova, J.; Hajslova, J. Smartphone and microfluidic systems in medical and food analysis. In Microfluidic Biosensors; Academic Press: Cambridge, MA, USA, 2023; pp. 233–257. [Google Scholar]
  12. Pan, Y.; Mao, K.; Hui, Q.; Wang, B.; Cooper, J.; Yang, Z. Paper based devices for rapid diagnosis and wastewater surveillance. TrAC Trends Anal. Chem. 2022, 157, 116760. [Google Scholar] [CrossRef]
  13. Hussein, H.S.; Brasel, J.M. Toxicity, metabolism, and impact of mycotoxins on humans and animals. Toxicology 2001, 167, 101–134. [Google Scholar] [CrossRef]
  14. Wang, M.; Cui, J.; Wang, Y.; Yang, L.; Jia, Z.; Gao, C.; Zhang, H. Microfluidic Paper-Based Analytical Devices for the Determination of Food Contaminants: Developments and Applications. J. Agric. Food Chem. 2022, 70, 8188–8206. [Google Scholar] [CrossRef]
  15. Caglayan, M.O.; Şahin, S.; Üstündağ, Z. Detection strategies of zearalenone for food safety: A review. Crit. Rev. Anal. Chem. 2022, 52, 294–313. [Google Scholar] [CrossRef]
  16. Jafari-Nodoushan, A.A. Zearalenone, an abandoned mycoestrogen toxin, and its possible role in human infertility. Int. J. Reprod. Biomed. 2022, 20, 151–153. [Google Scholar] [CrossRef]
  17. Ji, J.; Yu, J.; Ye, Y.; Sheng, L.; Fang, J.; Yang, Y.; Sun, X. Biodegradation methods and product analysis of zearalenone and its future development trend: A review. Food Control 2022, 145, 109469. [Google Scholar] [CrossRef]
  18. Majer-Baranyi, K.; Adányi, N.; Székács, A. Biosensors for deoxynivalenol and zearalenone determination in feed quality control. Toxins 2021, 13, 499. [Google Scholar] [CrossRef]
  19. Wang, Y.F.; Mu, G.D.; Wang, X.J.; Zhang, F.; Li, Y.L.; Lu, D.J.; Chen, F.M.; Yang, M.L.; He, M.Y.; Liu, T. Fast construction of core-shell structured magnetic covalent organic framework as sorbent for solid-phase extraction of zearalenone and its derivatives prior to their determination by UHPLC-MS/MS. Microchim. Acta 2021, 188, 246. [Google Scholar] [CrossRef]
  20. Lijalem, Y.G.; Gab-Allah, M.A.; Choi, K.; Kim, B. Development of isotope dilution-liquid chromatography/tandem mass spectrometry for the accurate determination of zearalenone and its metabolites in corn. Food Chem. 2022, 384, 132483. [Google Scholar] [CrossRef]
  21. Zhang, B.; Liu, W.; Liu, Z.; Fu, X.; Du, D. High-performance liquid chromatography for the sensitive zearalenone determination by the automated immunomagnetic beads purifier for one-step sample pre-treatment. Eur. Food Res. Technol. 2022, 248, 109–117. [Google Scholar] [CrossRef]
  22. Zhang, Y.; Liu, D.; Peng, J.; Cui, Y.; Shi, Y.; He, H. Magnetic hyperbranched molecularly imprinted polymers for selective enrichment and determination of zearalenone in wheat proceeded by HPLC-DAD analysis. Talanta 2020, 209, 120555. [Google Scholar] [CrossRef]
  23. Wang, X.; Lu, D.; Huang, Q.; Yang, J. Microfluidics-Based Time-Resolved Fluorescence Immunoassay for the On-Site Detection of Aflatoxins B1 Zearalenone and Deoxynivalenol in Cereals. Foods 2022, 11, 1319. [Google Scholar] [CrossRef]
  24. Feng, S.; Hua, M.Z.; Roopesh, M.S.; Lu, X. Rapid detection of three mycotoxins in animal feed materials using competitive ELISA-based origami microfluidic paper analytical device (μPAD). Anal. Bioanal. Chem. 2023, 415, 1943–1951. [Google Scholar] [CrossRef]
  25. Lin, X.; Li, C.; Tong, X.; Duan, N.; Wang, Z.; Wu, S. A portable paper-based aptasensor for simultaneous visual detection of two mycotoxins in corn flour using dual-color upconversion nanoparticles and Cu-TCPP nanosheets. Food Chem. 2023, 404 Pt B, 134750. [Google Scholar] [CrossRef]
  26. Jin, L.; Liu, W.; Xiao, Z.; Yang, H.; Yu, H.; Dong, C.; Wu, M. Recent Advances in Electrochemiluminescence Biosensors for Mycotoxin Assay. Biosensors 2023, 13, 653. [Google Scholar] [CrossRef]
  27. Felici, E.; Regiart, M.D.; Pereira, S.V.; Ortega, F.G.; Angnes, L.; Messina, G.A.; Fernández-Baldo, M.A. Microfluidic Platform Integrated with Carbon Nanofibers-Decorated Gold Nanoporous Sensing Device for Serum PSA Quantification. Biosensors 2023, 13, 390. [Google Scholar] [CrossRef]
  28. Zenga, Y.; Camarada, M.B.; Lu, X.; Tanga, K.; Lia, W.; Qiu, D.; Wen, Y.; Wu, G.; Luo, Q.; Bai, L. Detection and electrocatalytic mechanism of zearalenone using nanohybrid sensor based on copper-based metal-organic framework/magnetic Fe3O4-graphene oxide modified electrode. Food Chem. 2022, 370, 131024. [Google Scholar] [CrossRef]
  29. Na, Y.; Zhang, J.; Zhang, S.; Liang, N.; Zhao, L. Fluorescence Sensor for Zearalenone Detection Based on Oxidized Single-walled Carbon Nanohorns/N-doped Carbon Quantum Dots-aptamer. J. Fluoresc. 2023, 13, 1–13. [Google Scholar] [CrossRef]
  30. Moya-Cavas, T.; Navarro-Villoslada, F.; Urraca, J.L.; Serrano, L.A.; Orellana, G.; Moreno-Bondia, M.C. Simultaneous determination of zearalenone and alternariol mycotoxins in oil samples using mixed molecularly imprinted polymer beads. Food Chem. 2023, 412, 135538. [Google Scholar] [CrossRef]
  31. Zhang, Z.; Cai, Y.; Fan, K.; Huang, Q.; Zhao, X.; Cao, H.; Zhao, Z.; Tangni, E.K.; Zheng, H. Development of a reliable UHPLC-MS/MS method for simultaneous determination of zearalenone and zearalenone-14-glucoside in various feed products. Front. Chem. 2022, 10, 955266. [Google Scholar] [CrossRef]
Figure 1. Design and fabrication of the OMPD with electrochemical detection.
Chemosensors 12 00010 g001
Figure 2. SEM images of (A) GPE, (B) GPE/CNH/GNP at 3×, (C) GPE/CNH/GNP at 10× (D) GPE/CNH, and (E) EDS of GPE/CNH/GNP.
Chemosensors 12 00010 g002
Figure 3. (A) CVs of blank in the GPE/CNH/GNP (black line), GPE (blue line), GPE/GNP (green line), and GPE/CNH/GNP (red line) recorded in 1 mmol L−1 [Fe(CN)6]−3 in 0.1 mol L−1 KCl at a 75 mV s−1 scan rate. (B) CVs recorded with the GPE/CNH/GNP in [Fe(CN)6]−3 in 0.1 mol L−1 KCl at 25, 50, 75, 100, 125, 150, and 200 mV s−1. Inset: Dependence of the redox peak current values on the square root of the scan rate (ν1/2).
Chemosensors 12 00010 g003
Figure 4. Experimental parameter optimization. ZEA detection was optimized using a 100 µg Kg−1 ZEA standard solution. (A) deposition time (Tdep), (B) deposition potential (Edep), (C) CNH concentration and (D) pH conditions for the enzymatic reaction.
Chemosensors 12 00010 g004
Figure 5. (A) Calibration curve of the OMPD (inset: electrochemical signals), and (B) commercial ELISA kit for ZEA determination.
Chemosensors 12 00010 g005
Figure 6. (A) Correlation curve between the results obtained with our OMPD and the commercial ELISA kit for ZEA determination. (B) Determination of 100 µg Kg−1 ZEA in the absence and presence of 500 µg Kg−1 Fumonisin, Ochratoxin, Aflatoxin, T-2 Toxin, and Deoxynivalenol.
Chemosensors 12 00010 g006
Table 1. Comparison of the analytical performance between the OMPD and ELISA for ZEA determination.
MethodCV % a
Within-Assay
CV % a
Between-Assay
Linear Range bLOD bTime
(min)
ELISA6.197.1425–100020>20
OMPD4.244.8910–10004.410
a Five replicates (n = 5). b µg Kg−1 ZEA.
Table 2. Comparison of ZEA concentration in corn spiked samples, obtained with the OMPD and the commercial ELISA test kit.
ZEA aELISARecovery (%) cOMPDRecovery (%)
109.1 ± 0.6 b919.9 ± 0.399
2523.5 ± 1.49425.3 ± 1.1101.2
10096.2 ± 6.596.2102.7 ± 4.6102.7
300315.8 ± 19.7105.2298.2 ± 14.599.4
500522.9 ± 33.9104.5494.1 ± 21.798.8
10001025.8 ± 69.2102.58987.87 ± 45.198.7
N-C d<20N.A.<4.40N.A.
a ZEA corn spiked sample (µg Kg−1). b Mean of five determinations + SD. c [found/added] × 100. d Non-contaminated sample.
Table 3. Comparison between different methods for ZEA determination.
MethodLinear Range
(µg Kg−1)
LOD
(µg Kg−1)
Sample Ref.
Microfluidics-Based Time-Resolved Fluorescence1.5–3755Cereals[23]
ELISA-based origami microfluidic paper 0–401000Animal feed[24]
Portable paper-based aptasensor0.5–1000.44Corn flour[25]
Sensor Metal-Organic159–286523.14 Breakfast cereal, maize powder and rice flour[28]
Fluorescence Sensor20–100 18.0 Corn and flour[29]
HPLC-FLD/MIP100–500 5.0 Refined corn oil[30]
UHPLC-MS/MS0.50–200 0.15 Feed [31]
OMPD10–10004.40 Corn This work
Disclaimer/Publisher’s Note: The statements, opinions and data contained in all publications are solely those of the individual author(s) and contributor(s) and not of MDPI and/or the editor(s). MDPI and/or the editor(s) disclaim responsibility for any injury to people or property resulting from any ideas, methods, instructions or products referred to in the content.

