Article

Fast Protein and Metabolites (Nucleotides and Nucleosides) Liquid Chromatography Technique and Chemical Sensor for the Assessment of Fish and Meat Freshness

1
AS Ldiamon, 50411 Tartu, Estonia
2
Veterinary Biomedicine and Food Hygiene, Estonian University of Life Sciences, 51006 Tartu, Estonia
3
Jeko Disain OÜ, 51014 Tartu, Estonia
4
Department of Photonics, Saint Petersburg Electrotechnical University “LETI”, Saint Petersburg 197022, Russia
5
Research Institute of Fisheries and Oceanography, Moscow 105187, Russia
6
Institute of Chemistry, University of Tartu, Ravila 14A, 50411 Tartu, Estonia
7
Department of Engineering, University of Applied Sciences Brandenburg, 14770 Brandenburg an der Havel, Germany
*
Author to whom correspondence should be addressed.
Chemosensors 2023, 11(1), 69; https://doi.org/10.3390/chemosensors11010069
Submission received: 30 November 2022 / Revised: 5 January 2023 / Accepted: 11 January 2023 / Published: 14 January 2023
(This article belongs to the Special Issue Advanced Techniques for the Analysis of Protein and RNA)

Abstract

:
Fast protein and metabolite liquid chromatography (FPLMC) was introduced years ago to enable the easy separation of high-molecular compounds such as proteins from small molecules and the identification of the low-molecular substances. In this paper, the method is applied for the rapid evaluation of freshness and monitoring the aging of animal meat and fish. A novel chromatographic sensor was developed with a deep UV LED-based photometric detection unit (255–265 nm), an original flow cuvette and registration scheme; the processing of a chromatogram with the sensor takes approximately 15 min. Strict isochronism between the elution of ATP metabolites, mainly hypoxanthine (Hx) and inosine monophosphate (IMP), and the time of maturation of meat or fish, was discovered. A new freshness index H* = [Hx]/[IMP] was introduced, which is proportional to the instrumental delay time in the FPMLC chromatograms: the H* index < 0.5 indicates the presence of inosine monophosphate (IMP) and the high quality of the meat or fish. Reasonably strong correlations were revealed between data obtained by FPMLC and total volatile basic nitrogen TVB-N (for fish) or volatile fatty acids VFA (for meat) content. Moreover, putative nucleotide salvage and an increase in the concentration of IMP were observed in fish after heat treatment using the FPMLC sensor and NMR technique.

1. Introduction

Fast protein liquid chromatography (FPLC) is a form of liquid chromatography that was developed in 1982 by Pharmacia LKB (Uppsala, Sweden) for proteins as a partial alternative to high-performance liquid chromatography (HPLC) [1]. Initially, FPLC was considered exclusively as a preparative technique for the purification and fractionation of proteins and other biopolymers, but later it was widely demonstrated that the method can be successfully used in analytical tasks as a more affordable and cost-effective method than HPLC. The price of an FPLC column is approximately ten times lower than the price of a corresponding HPLC column, and the total cost of the test can be up to 30 times lower [2,3]. The positive features of FPLC include high loading capacity, biocompatible aqueous buffer systems, high flow rates, and the availability of stationary phases for most common chromatographic modes (e.g., ion exchange, gel filtration, reversed phase, and affinity chromatography) [4]. The use of FPLC as a characterization and analytical technique can be particularly relevant in the fields where the availability of rapid and affordable analytical methods and tools is crucial, e.g., routine test in healthcare or the food industry [2,3,5,6,7,8,9]. In this context, FPLC can be modified and enhanced with the ability to fractionate and detect low and middle molecular weight metabolites: ATP metabolites nucleotides and nucleosides, advanced glycation end products (AGE), uric acid, and other metabolic products originating from various biological samples [5,7,8,9]. In our opinion, the term fast protein and metabolites liquid chromatography (FPMLC) is more appropriate for such applications and will continue be used in this paper.
The ability of FPMLC to separate and detect ATP metabolites can be particularly important in food science and technology, because relative changes in the concentrations of ATP metabolites: adenosine diphosphate (ADP), adenosine monophosphate (AMP), inosine (Ino), inosine monophosphate (IMP), and hypoxanthine (Hx) during the post-mortem catabolism of adenosine triphosphate (ATP) in muscle tissue have been proven to be a reliable indicator of the freshness of animal or fish meat. The chain of ATP transformations after animal slaughter or harvesting fish is accompanied by a gradual decrease in the molecular weights of the ATP metabolites (the molecular weights in Daltons are in parentheses) [10,11]:
ATP(507) → ADP(427) → AMP(347) → IMP(348) → Ino(268) → Hx(136).
The first step of the chain is relatively fast: the biochemical processes of ATP, ADP and AMP transformation to IMP are generally limited to 24 h. As a result, muscle tissue rapidly accumulates IMP, which is partly responsible for the pleasant taste (umami) and high nutritional value of meat and fish products [12]. In the following slower step, IMP is further degrading into Ino and Hx; the process is often associated with loss of freshness. In the final stage of bacterial spoilage, Hx is converted to xanthine, uric acid, and other circle cleavage end products [10,11]. The freshness index K is calculated as the ratio the concentrations of ATP metabolites concentrations (usually presented in µmol/L) [13]:
K = [ Ino ] + [ Hx ] [ ATP ] + [ ADP ] + [ AMP ] + [ IMP ] + [ Ino ] + [ Hx ] 100 %
This index was first introduced in 1959 in Japan and has been widely used worldwide to evaluate fish freshness [14]. This correlates with fish taste and flavor: very high-grade products have a K-value of less than 10%; high-grade products have K-values lower than 20% or 30%, depending on fish species; fish with a K-value up to 50% are of medium grade; K-values larger than 50–70% are obtained for low-grade samples [15]. Multiple alternative indices based on ATP catabolism (K, K0, KI, H, P, G, Fr, Hx, etc.) were also proposed for various fish and shellfish species [10]. The index KI is of particular interest, because it was specifically designed to assess freshness after more than 24 h post-mortem, when almost all ATP, ADP and AMP have already been catabolized:
K I = [ Ino ] + [ Hx ] [ IMP ] + [ Ino ] + [ Hx ] 100 % .
Starting from the 1980s, the K-value and, in some cases, the index KI have been also applied for pork, beef, rabbit, and poultry [16,17,18,19]. Nevertheless, there are still no universal approaches to freshness evaluation based on ATP breakdown, which are equally applicable for meat and fish testing, and leading researchers in these fields work independently [15,19].
The main convenience of the K-value approach compared with universally accepted standard methods, e.g., determination of total volatile basic nitrogen (TVB-N), trimethylamine nitrogen (TMA-N) or volatile fatty acids (VFA), is the ability to detect changes in food freshness during storage at an early stage of quality declination, before any evidence of microbial spoilage appears [20,21]. Despite the obvious advantages of this approach, it is still used quite rarely in routine food quality control because conventional laboratory methods for the determination of ATP metabolites, including HPLC, nuclear magnetic resonance (NMR) spectroscopy, and mass spectrometry, are cumbersome, time consuming, and require extremely expensive analytical instruments operated by highly qualified staff [22,23]. By their nature, these instrumental methods cannot ensure rapid on-site freshness testing, and sensory evaluation by organoleptic methods, which are strictly regulated by national standards (GOST 7631-2008 in Russia and Council Regulation (EC) No 2406/96 in EU), are still dominant in the industry. An alternative approach to the EU standard is the quick Quality Index Method (QIM) [24].
Biosensor and microfluidic technologies have demonstrated great potential in the field of medical testing and food quality control [25,26,27]. The development of biosensors for the express testing of fish freshness is particularly active, as low testing time and the possibility of on-site analysis play a crucial role here. Electrochemical and enzymatic biosensors are capable of detecting marker substances such as xanthine, hypoxanthine, histamine, and uric acid; gas biosensors can detect volatile amines [19,28,29,30,31]. Moreover, multienzyme biosensors were developed for the simultaneous detection of ATP and its post-mortem breakdown products, which can directly measure the freshness indices K and KI [19,29,30,31,32,33,34,35,36]. In addition to enzymatic biosensors, more conventional assay kits based on enzymatic reactions with microplate spectrophotometric detection are available on the market, but the price per test is quite high [37].
Undoubtedly, biosensors and microfluidic technologies can significantly simplify sampling procedures, detection efficiency, and portability of analytical systems for fish and meat freshness evaluation. At the same time, obvious difficulties in achieving high reproducibility and stability of characteristics during biosensor manufacturing and storage, the complexity of detection systems, and the high cost of disposable biosensors, comparable with the cost of some fish species [28], prevent their wider practical application as a convenient and cost-effective alternative to conventional analytical techniques and organoleptic evaluation. Prospects for the development of microfluidic biosensor chips are also inextricably linked with progress in chip technology [38] and on-wafer techniques for characterization purposes [39,40].
The obvious gap between sophisticated and expensive laboratory analytical instruments and miniaturized biosensing microfluidic devices can be filled with compact, simplified mid-range instruments based on classical methods of analysis, but which can be used on-site, outside the laboratory, do not require complex sample preparation, and are suitable for express testing. The aim of this work is the development and validation of a compact, affordable, non-disposable optical chemical sensor and analytical protocol for the rapid on-site evaluation of meat and fish freshness using FPMLC with UV photometric detection complemented with the ability to determine the relative content of the nutritional nucleotide and nucleoside originating from ATP post-mortem degradation.

2. Materials and Methods

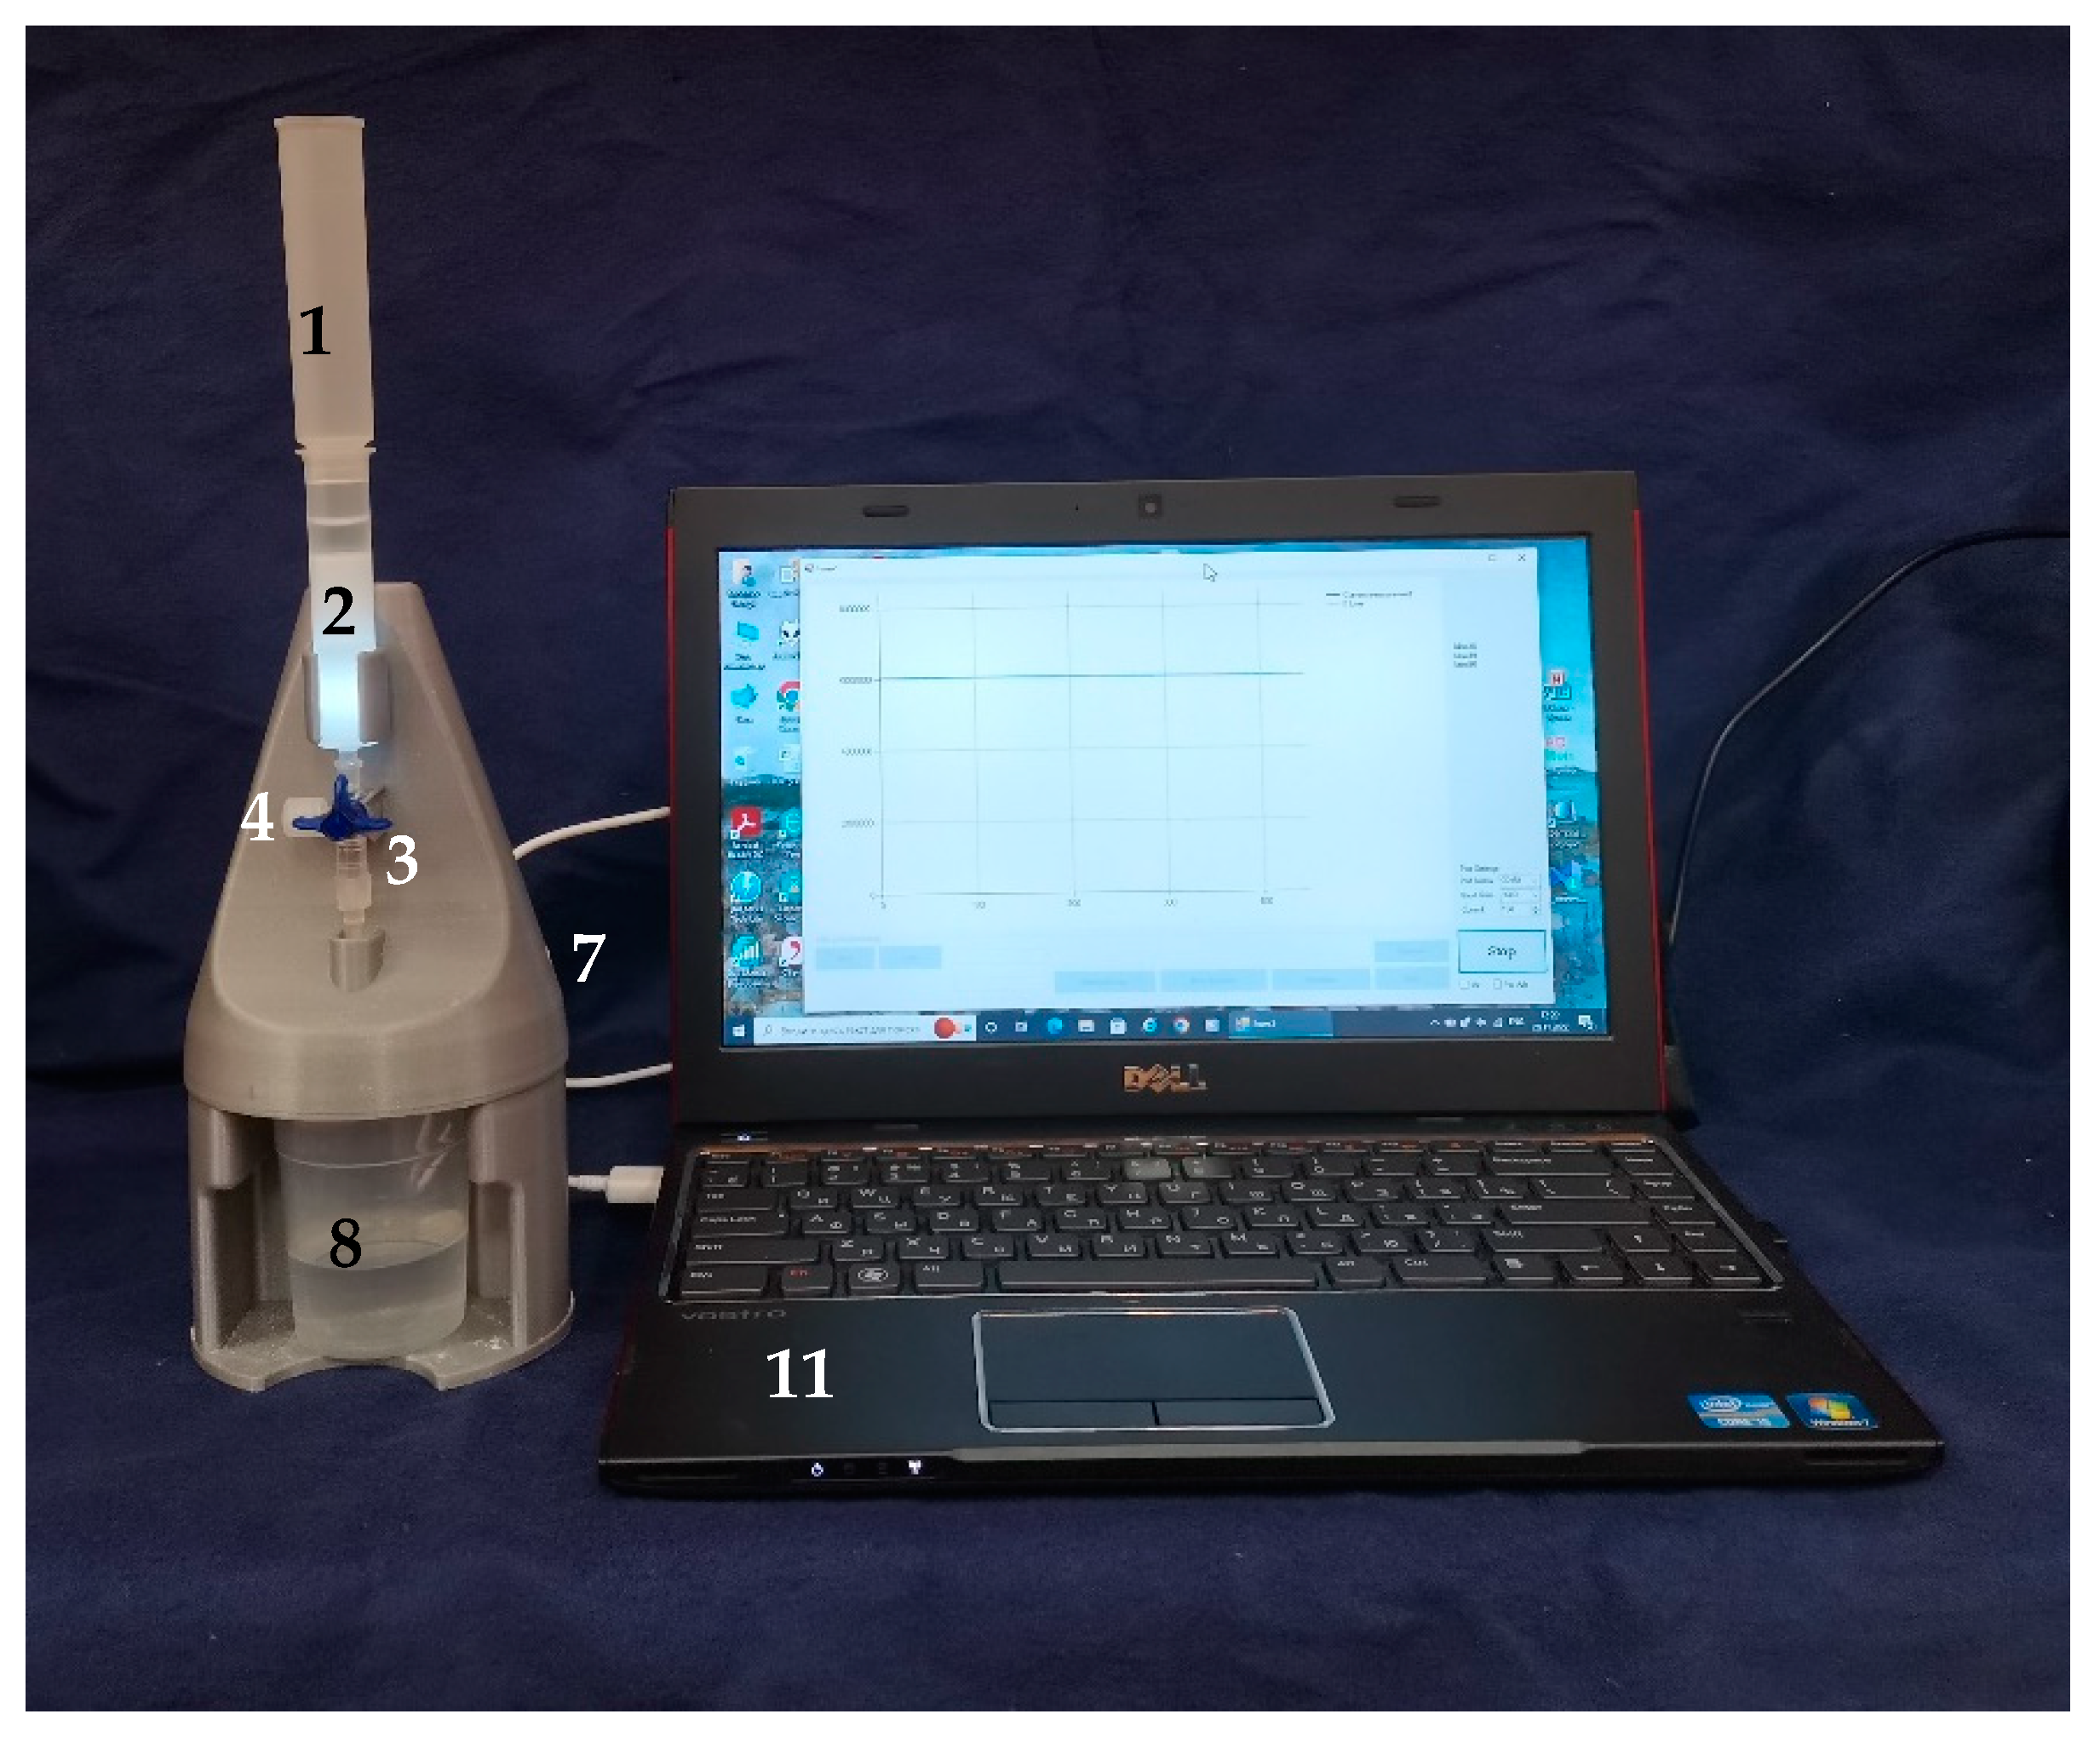
2.1. FPLMC Optical Chemical Sensor

An optical chromatographic sensor based on FPMLC with UV photometric detection at a wavelength of 260 nm was designed and manufactured by Ldiamon AS (Tartu, Estonia) for meat and fish freshness evaluation. Previously, optical sensors based on the same principles were developed by the authors of this work for point-of-care diagnosis and screening of proteinuria, and assessment of protein loss during continuous ambulatory peritoneal dialysis; the instruments were clinically tested on urine and effluent peritoneal dialysate samples, respectively [6,7].
The chromatographic sensor is adapted for low-cost commercially available PD-10 protein desalting columns (Code No. 17-0851-01) from GE Healthcare® Bio-Sciences AB (Uppsala, Sweden), repurposed for the separation and detection of nutritional nucleotides and nucleosides. The PD-10 is a gel-filtration column filled with Sephadex G-25 Medium chromatographic gel originally designed for protein purification; the column is a single-use type according to the instruction for use, but it was demonstrated that it can be successfully regenerated and used multiple times up to several hundred tests [7]. The photometric detection unit employs a narrow-band (255–265 nm) deep UV LED with a quartz collimator and a visible-blind UV photodetector (Figure 1a). The detection wavelength corresponds to the UV absorption maxima of the ATP and its main metabolites: ATP, ADP, and AMP (259 nm); IMP and Ino (248 nm); Hx (249 nm) [41]. The UV absorption spectrum of ATP aqueous solution (concentration 0.3 mM, cuvette thickness 10 mm) and the normalized spectrum of the UV LED emission (maximum emission 262 nm, FWHM 12 nm) measured with the AvaSpec-2048 spectrophotometer from Avantes B.V. (Apeldoorn, The Netherlands) are presented in Figure 1b. The photo of the device is presented in the Figure 2.
The sensor is a gravity flow chromatograph instrument: reservoir 1 is filled with TRIS buffer (pH 8.0), which flows via column 2 into flow cell 6 of the photometric detection unit into drain vessel 8. A mechanical regulator 7 is necessary to adjust buffer flow rate: in normal operation, it is about 2 mL/min when the buffer reservoir is full and about 1 mL/min when the reservoir is almost empty. The three-way valve 3 can be set to three positions: (a) the column is locked (standby mode), (b) the column is connected to the flow cell (chromatogram-recording or column-regeneration modes), and (c) the flow cell is connected to the service port 4 for manual cleansing or air bubble removal (a Luer-Lock syringe filled with buffer solution must be connected to the service port for this operation). A more detailed description of the device can be found in Kuznetsov et al., 2022 [7].

2.2. Chemicals

TRIS buffer (pH 8.0) contained 10 mM of tris(hydroxymethyl)aminomethane (TRIS), 150 mM of sodium chloride (NaCl), and 2 mM of ethylenediaminetetraacetic acid disodium salt (EDTA-Na2); washing solution (pH 13.0) was 200 mM of sodium hydroxide (NaOH). TRIS (Product No. GE17-1321-01), EDTA (Product No. ED), sodium hydroxide (Product No. S5881), and sodium chloride (Product No. S9888) were purchased from Sigma-Aldrich (Darmstadt, Germany).
Standards of bovine serum albumin (BSA), ATP, IMP, Ino and Hx were also from Sigma-Aldrich., TRIS buffer, acetonitrile of ultra lc grade for LC-MS was from Romil PC (Cambridge, UK); ultrapure water was prepared by EASYpure RF, Barnstead type.

2.3. Sample Preparation

As samples of animal products for freshness testing with the FPMLC device, porcine longissimus dorsi muscle (striploin) obtained from a slaughterhouse within 24 h post-slaughter and completely fresh or within 24 h after catch farmed fish fillets of Trout (Oncorhynchus mykiss), Carp (Cyprinus carpio) were used. To analyze the effects, the thermal processing and putative nucleotide salvage defrosted fish fillets of Alaska pollack (Theragra chalcogramma), Hake (Merluccius), Norway haddock (Sebastes), Pangasius (Pangasianodon hypophthalmus), Wolffish (Anarhichas) from a local supermarket were used as samples of consumer products. Alaska pollack was frozen on 10 January 2021and the best before day (BBD) was 2 August 2023; Wolffish was frozen on 22 September 2021and the BBD was 22 September 2022; the experiments with Wolffish were carried out late August 2022; the other fish fillets had no data on the packaging.
The muscle tissue was finely minced with a meat grinder or cut into small pieces, approximately, of 2 mm× 2 mm × 2 mm, two grams of the ground meat (pH = 5.6) were placed into a 15 mL test tube with 6 mL of TRIS buffer (pH = 8.0). The mixture was shaken for 10–15 min in a rotator Biosan Multi RS60 (BioSan, Riga, Latvia), and used a syringe filter Whatman® GF/B (Product No. Z242195) from Merck KGaA (Darmstadt, Germany). For thermal processing, the samples were put in a microwave oven for 1–2 min at 400 W or steam cooked at +100 °C for 15–60 min; in this case, the fish fillets were cut into slightly larger pieces of 5 mm× 5 mm × 2 mm.
When working in the fields, a simplified version of the just-described sample preparation protocol is possible; for instance, when a rotator is not available, the tube with sample pieces can be manually shaken.

2.4. pH Determination

pH values of the samples were determined in homogenates composed of 1 g of sample and 9 mL of distilled water. Readings were taken with Consort C833 digital pH-meter (Consort, Turnhout, Belgium) at room temperature, and the pH meter calibration was regularly checked.

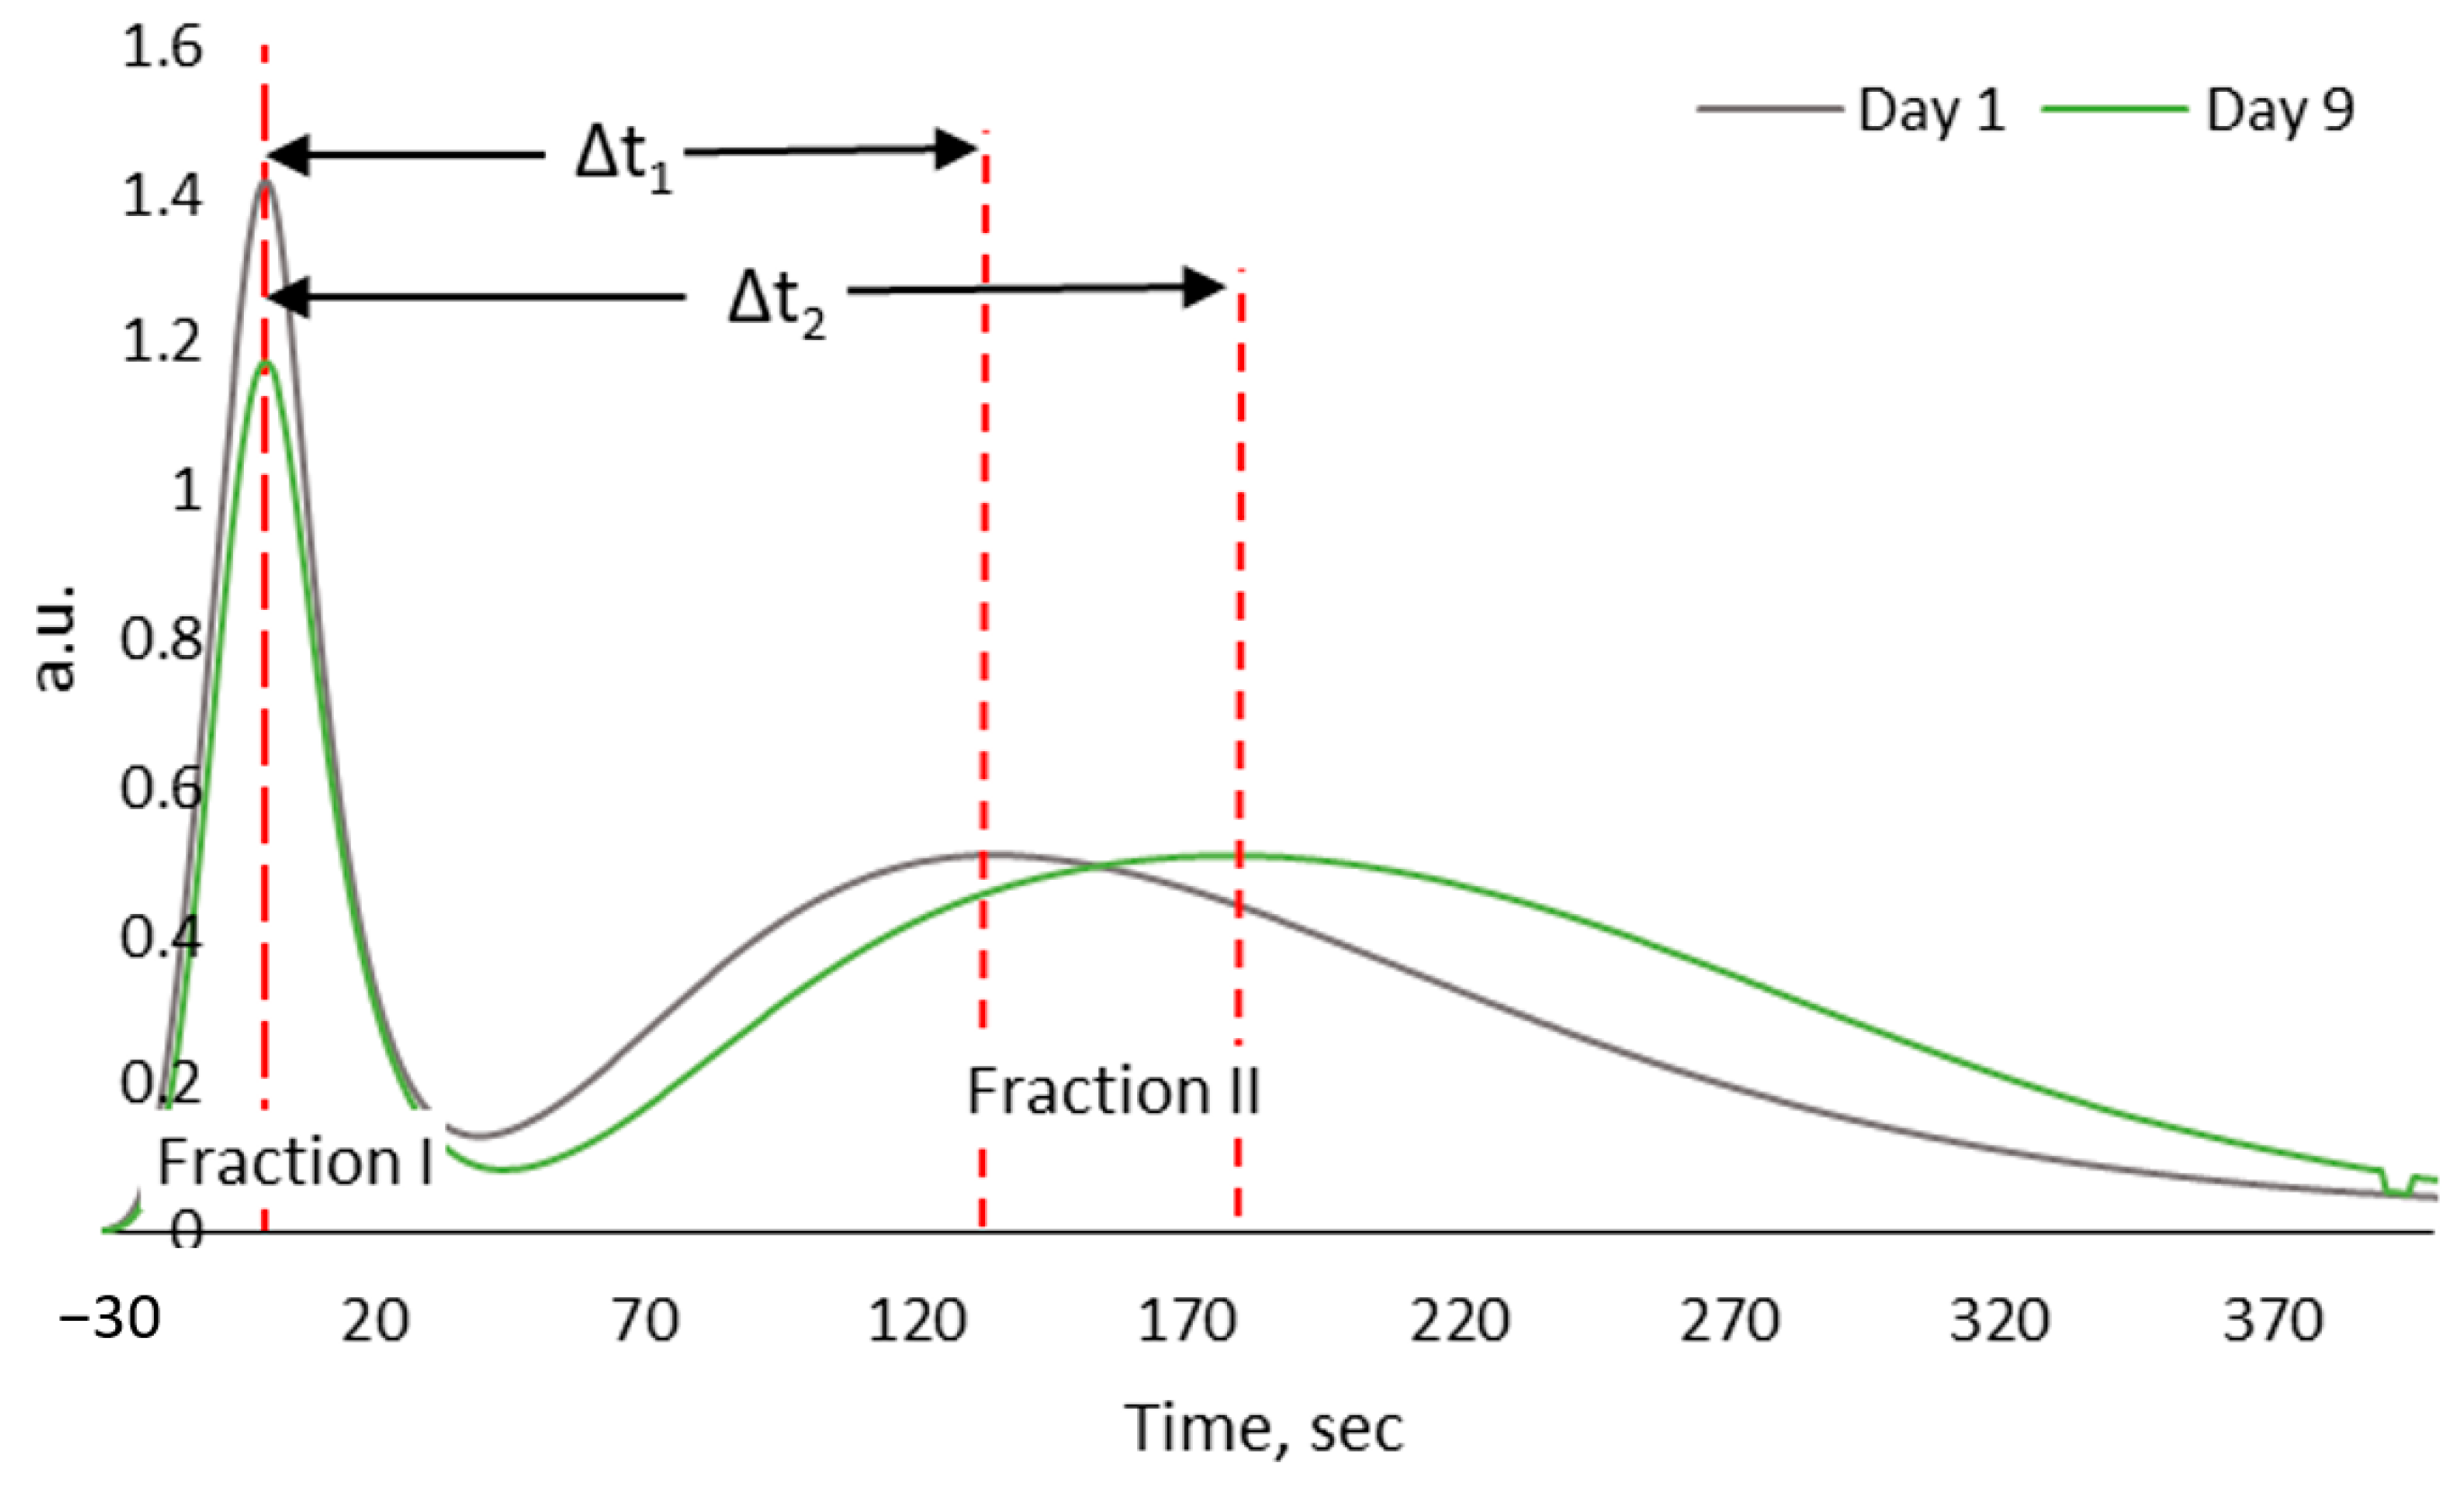
2.5. FPMLC Measurement Protocol and New Freshness Index H*

The FPMLC device was operated in the same mode as previously described in [42,43]. A total of 6 drops (200–300 µL) of the extract prepared according to the procedure described in Section 2.3 were placed directly on the gel surface in the PD-10 column previously washed with the NaOH wash solution (pH 13.0) and regenerated with 25 mL of TRIS buffer (pH 8.0). After the sample was completely absorbed by the gel, another 25 mL of TRIS buffer was added to the reservoir, and chromatograms were measured according to the procedure described in the work [7].
Gel filtration separates the molecules in the extract based on their size: proteins and other macromolecules larger than the pores of the gel matrix (the exclusion limit of the PD-10 column is Mr = 5000 Da) are quickly eluted with the void buffer volume outside the matrix, while smaller molecules, e.g., nucleotides and nucleosides, enter the pores and elute later at different times depending on the molecular weight [44,45]. The photometric detection unit of the sensor continuously measures the UV transmittance T(t) of the eluate at a wavelength of 260 nm and records it at a time interval of 1 s; the optical transmission signal T(t) is then converted into the optical density of the eluate (OD); the recording time of one chromatogram is about 15 min.
FPMLC chromatograms of both fish and mammalian meat samples consist of two main parts: a sharp protein peak and a broad post-protein band (Figure 3), which is formed by the merger of individual peaks of the main nucleotide and nucleoside actors. During meat storage, ATP is broken down by the enzymes into metabolites with a lower molecular weight according to the chain of transformations presented in (1), as a result of which, the retention time of the metabolites increases. The main parameter of FPMLC used in the measurements is the interval between the retention times of the broad band maxima of the metabolites (FPMLC fraction II) and the sharp protein peak (fraction I) on the FPMLC chromatograms (Figure 3), hereafter referred to as the index Time. This parameter directly corresponds to the relative content of different ATP metabolites and increases gradually during meat storage.
The first stage of this process, often described as absolute freshness, when ATP, ADP and AMP are still detected in a sample in significant amounts, lasts only several hours post-mortem; thus, fresh meat or fish are extremely rare in the food industry. In the following stages, IMP, Ino, and Hx become dominant and determine the shape of chromatograms and the index Time. In the final stage of massive bacterial contamination and obvious spoilage, Hx is mainly detected, and the maximum retention time for FPMLC fraction II is reached.
To establish the relationship between FPLMC data and the relative content of the ATP metabolites, Equation (3) can be further simplified, and a new freshness index H*, proportional to the instrumental lag time, can be introduced:
H * = [ Hx ] [ IMP ] .
This assumption is based on the anticorrelation between the concentrations of inosine monophosphate [IMP] and hypoxanthine [Hx]. The anticorrelation phenomenon makes it possible to level out random deviations in the concentrations of Hx and IMP and increase the accuracy of measurements to the value Stdev/Mean ≈ 3%. H* index < 0.5 indicates the presence of IMP and high quality of the meat/fish.

2.6. Validation Methods

Results obtained by FPLMC were validated by direct identification and quantification of ATP metabolites by LC-DAD MS or NMR spectroscopy, and by comparison with widely recognized standard meat (VFA) and fish (TVB-N) quality control test methods.

2.6.1. LC-DAD MS

Liquid chromatographic analysis of the broad band of metabolites fraction II from FPMLC was carried out on a 1290 Infinity system (Agilent Technologies, Waldbronn, Germany) coupled to an Agilent 6450 Q-ToF mass spectrometer equipped with a Jetstream ESI source. Samples were subjected to a Zorbax 300SB-C18 column 2.1 × 150 mm; 5 µm (Agilent Technologies), and maintained at 40 °C. A gradient of 0.1% of formic acid in water (A) and 5% of water in acetonitrile (B) was used to separate the compounds as follows: 0.0 min 1% B, 3.0 min 1% B, 3.01 min 99% B, 11.1 min 99% B, 11.01 min 1% B, and a regeneration time of 8 min. The eluent flow rate was 0.3 mL/min and the injection volume was 2.5 µL. The mass-spectrometer was operated in the negative ion mode in the mass-to-charge ratio (m/z) range of 100–1000 Da. UV absorbance was measured at λ = 250 nm. Data acquisition and initial data processing were performed with MassHunter software (Agilent Technologies).
Identification of IMP, Ino and Hx in the fraction II of the FPMLC eluate samples was performed by comparing MS/MS and UV spectra of these substances with respective parameters of analytical standards. IMP, Ino, and Hx were quantified by UV absorption at 250 nm using the external calibration curve method. Methanolic standard solutions were prepared at concentrations of 3.125, 6.25, 12.5, 25, 50 and 100 µM for analytical standards of all three metabolites. Calibration curves were characterized by a high correlation coefficient (R2 = 1) [46].

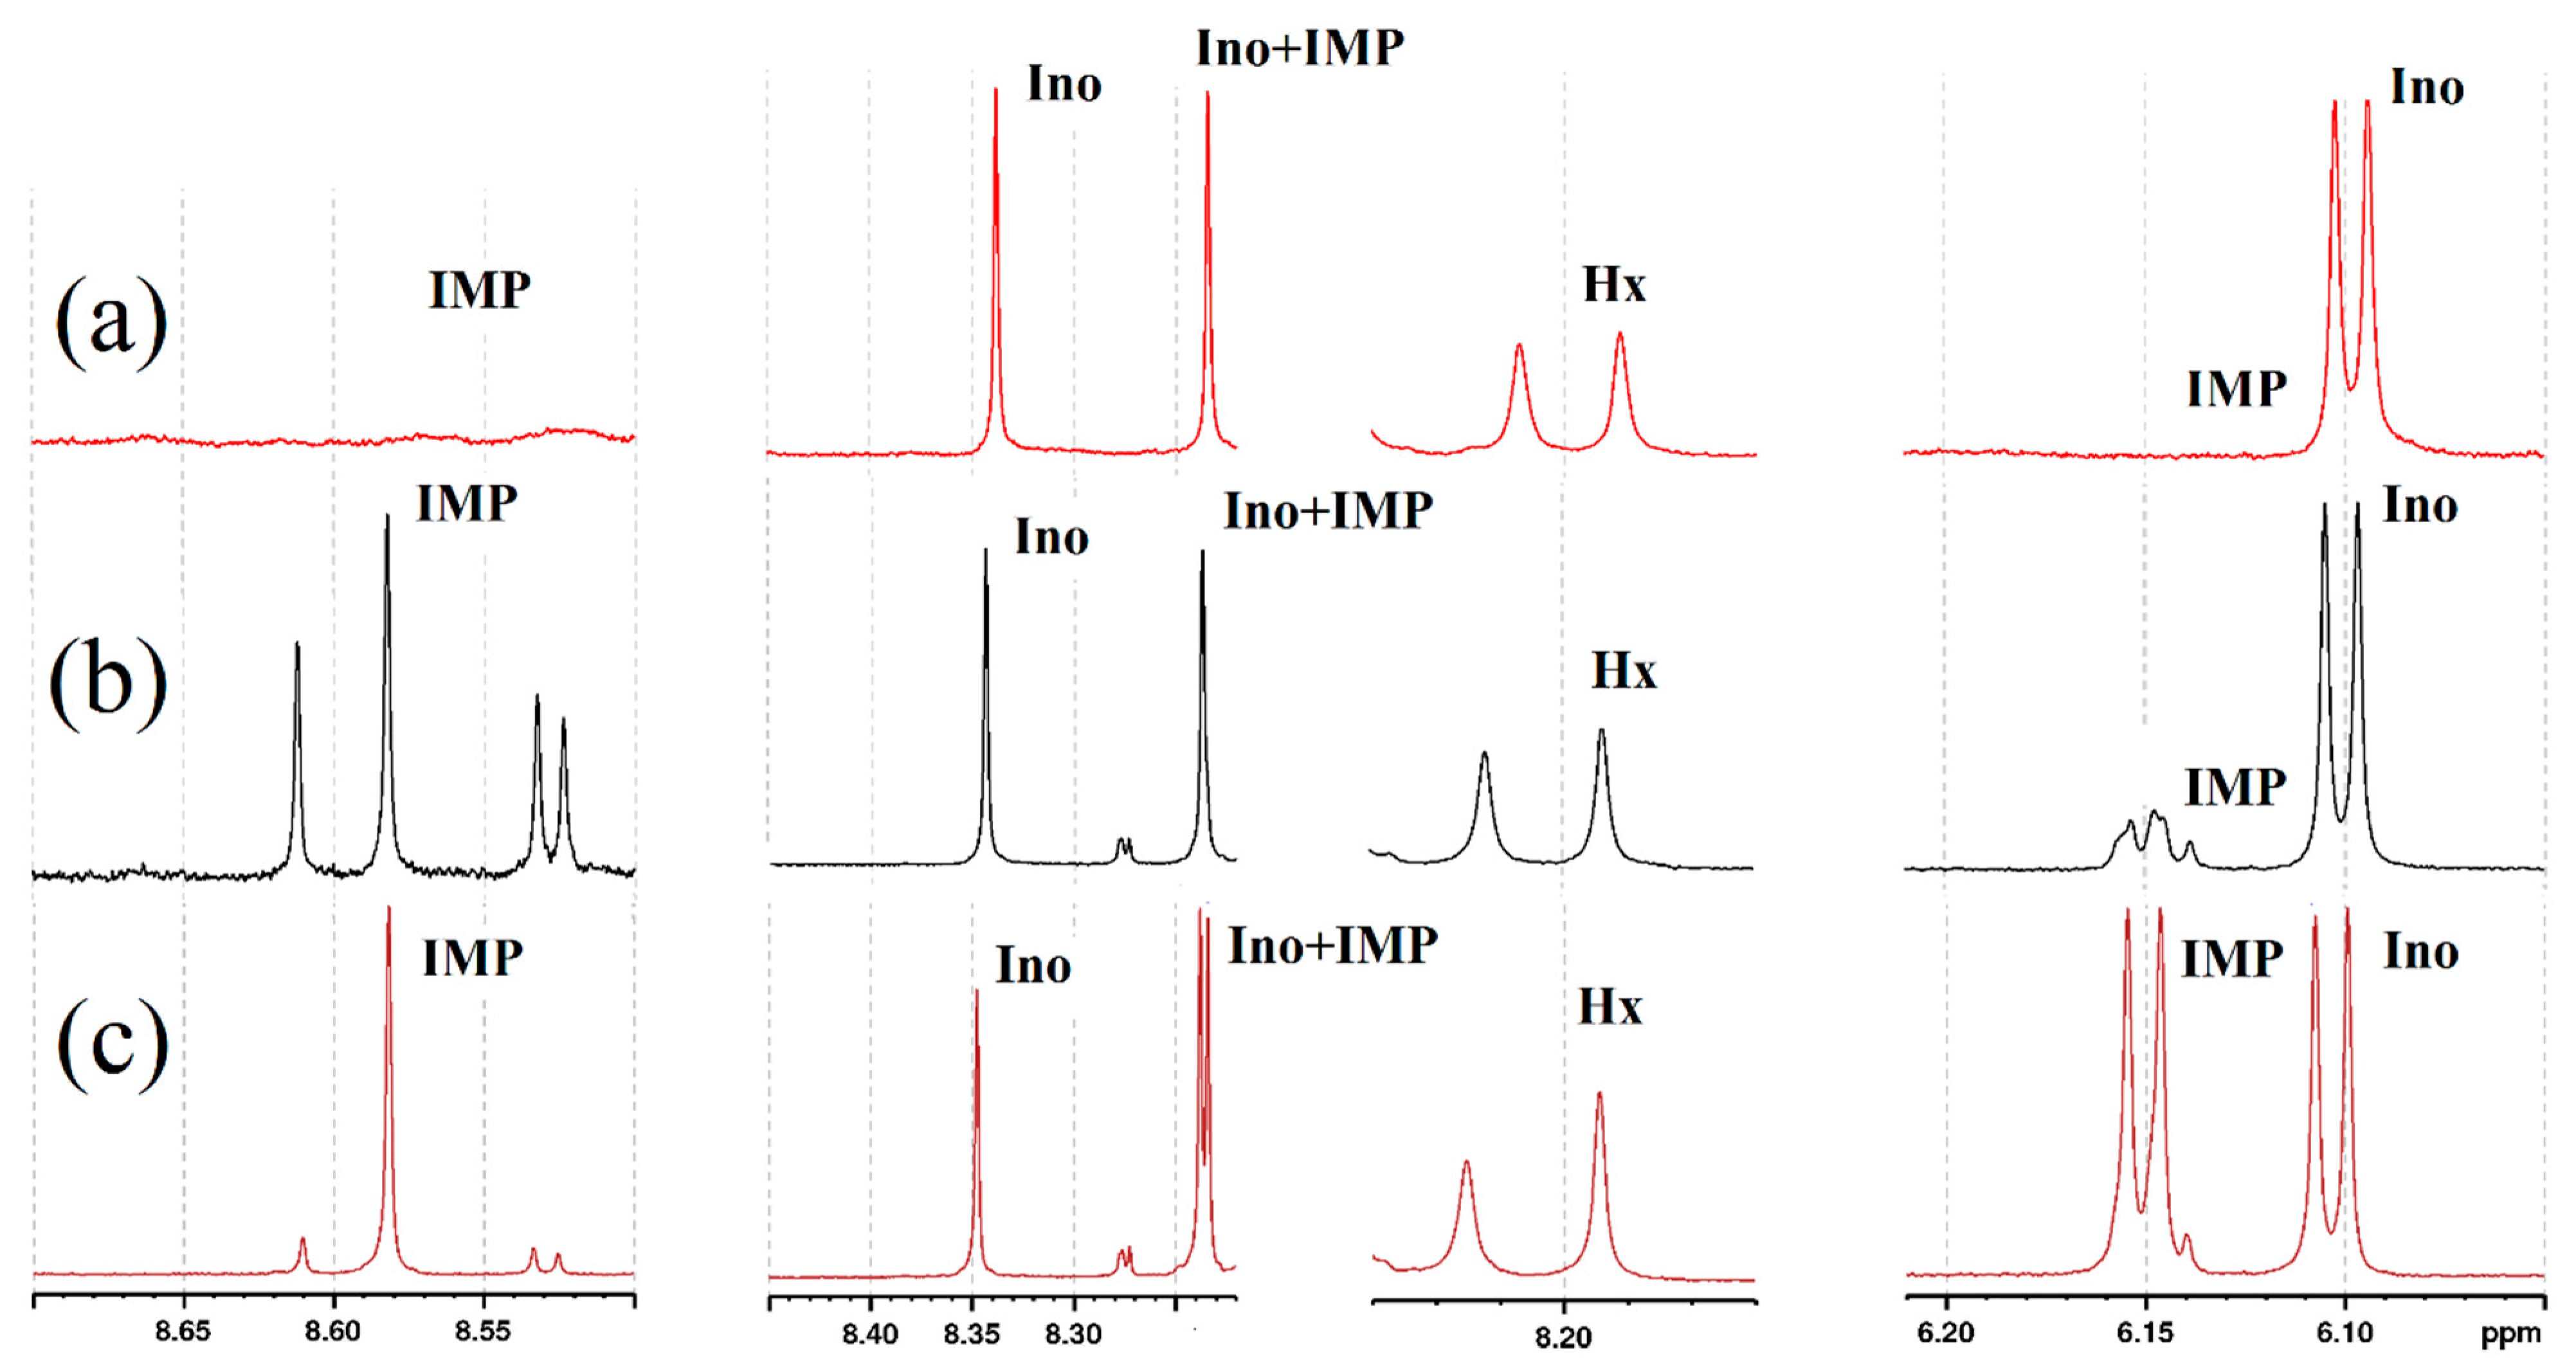
2.6.2. NMR Spectroscopy

The water-soluble polar metabolites of fish samples were extracted with 7.5% trichloroacetic acid (TCA) solution, as described in [47,48]. For this purpose, 25 g of fish muscle was added to 50 mL of 7.5% TCA and homogenized with a vertical homogenizer. The homogenate was filtered through a paper filter and the filtrate was neutralized with 9 M solution of KOH up to a pH of 7.8. The solution was filtered through a regular paper filter and stored at minus 40 °C.
NMR measurements were performed using a Bruker Avance III 700 NMR spectrometer equipped with a 5 mm BBO probe. The 1H Larmor frequency was 700.08 MHz. The ¹H NMR spectra were measured at 298 K with solvent suppression using the noesypr1d pulse sequence. The acquisition time was 3.67 s; the recycle delay was set to 6.00 s. For every ¹H NMR spectra, 1520 scans were collected. NMR solutions were prepared by adding approximately 20% of D2O containing 0.05% (w/v) sodium 2,2,3,3-tetradeuterio-3-trimethylsilylpropanoate (TSP-d4) to the aqueous samples. All spectra were referenced to TSP-d4 (0 ppm). Corrections of phase and baseline were performed with the Bruker Topspin 3.6.2 (Bruker, Rheinstetten, Germany). The free induction decays (FIDs) were multiplied by a line-broadening function of 0.3 Hz prior to Fourier transformation.

2.6.3. TVB-N and VFA Determination

The evaluation of VFA (for pork) and TVB-N (for fish) was carried out the at National Centre for Laboratory Research and Risk Assessment (before 1 January 2023–Estonian Veterinary and Food Laboratory, Tartu, Estonia, https://labris.agri.ee/en, accessed on 2 January 2023), according to the requirements of standard EVS-EN ISO/IEC 1705:2017 and Laboratory of Fish Products Quality Control, Russian Federal Research Institute of Fisheries and Oceanography (Moscow, Russia, http://vniro.ru/en/, accessed on 2 January 2023) independently. The measurements of TVB-N were conducted according to the method EU 2074/2016 (Estonia) or GOST 7636-85 (Russia); VFA content has been measured according to GOST 23392-78-2/1980.

3. Results

3.1. FPLMC Sensor Calibration

As a general rule in gel-filtration chromatography, the elution time of chemical substances with a molecular weight higher than the column exclusion limit depends on the molecular weight. For ATP metabolites, this means that the lowest elution time belongs to ATP, which has the largest molecular weight (M = 507) among the substances in the transformation chain (1), and the highest elution time to Hx, which has the lowest molecular weight (M = 136).
On the contrary, all proteins and other high molecular weight substances, such as free RNA and DNA, are synchronously eluted shortly after the process is started, as larger molecules cannot penetrate the gel pores. Since various water-soluble proteins are always present in animal and fish products, the first protein peak could be used as a reference point (zero on the timescale) from which elution times of nucleotides and nucleosides are counted.
To calibrate the FPMLC device, 100 µL of 1 g/l BSA and 100 µL of ATP, IMP, Ino, or Hx standard solutions were applied to the PD-10 column, and respective chromatograms were recorded (Figure 4) according to the procedure described in [7,42,43]. The mean time intervals between the BSA peak and the peaks of ATP, IMP, Ino, and Hx are presented in the Table 1: as predicted, the elution time monotonously increases in inverse proportion to the decrease in the molecular weight.
In case of routine measurements, this procedure should be repeated regularly, at least with hypoxanthine, and corresponding to the final point on the timescale; the time between BSA and Hx peaks should be kept constant near 275 ± 5 s by adjusting the buffer flow rate if necessary.

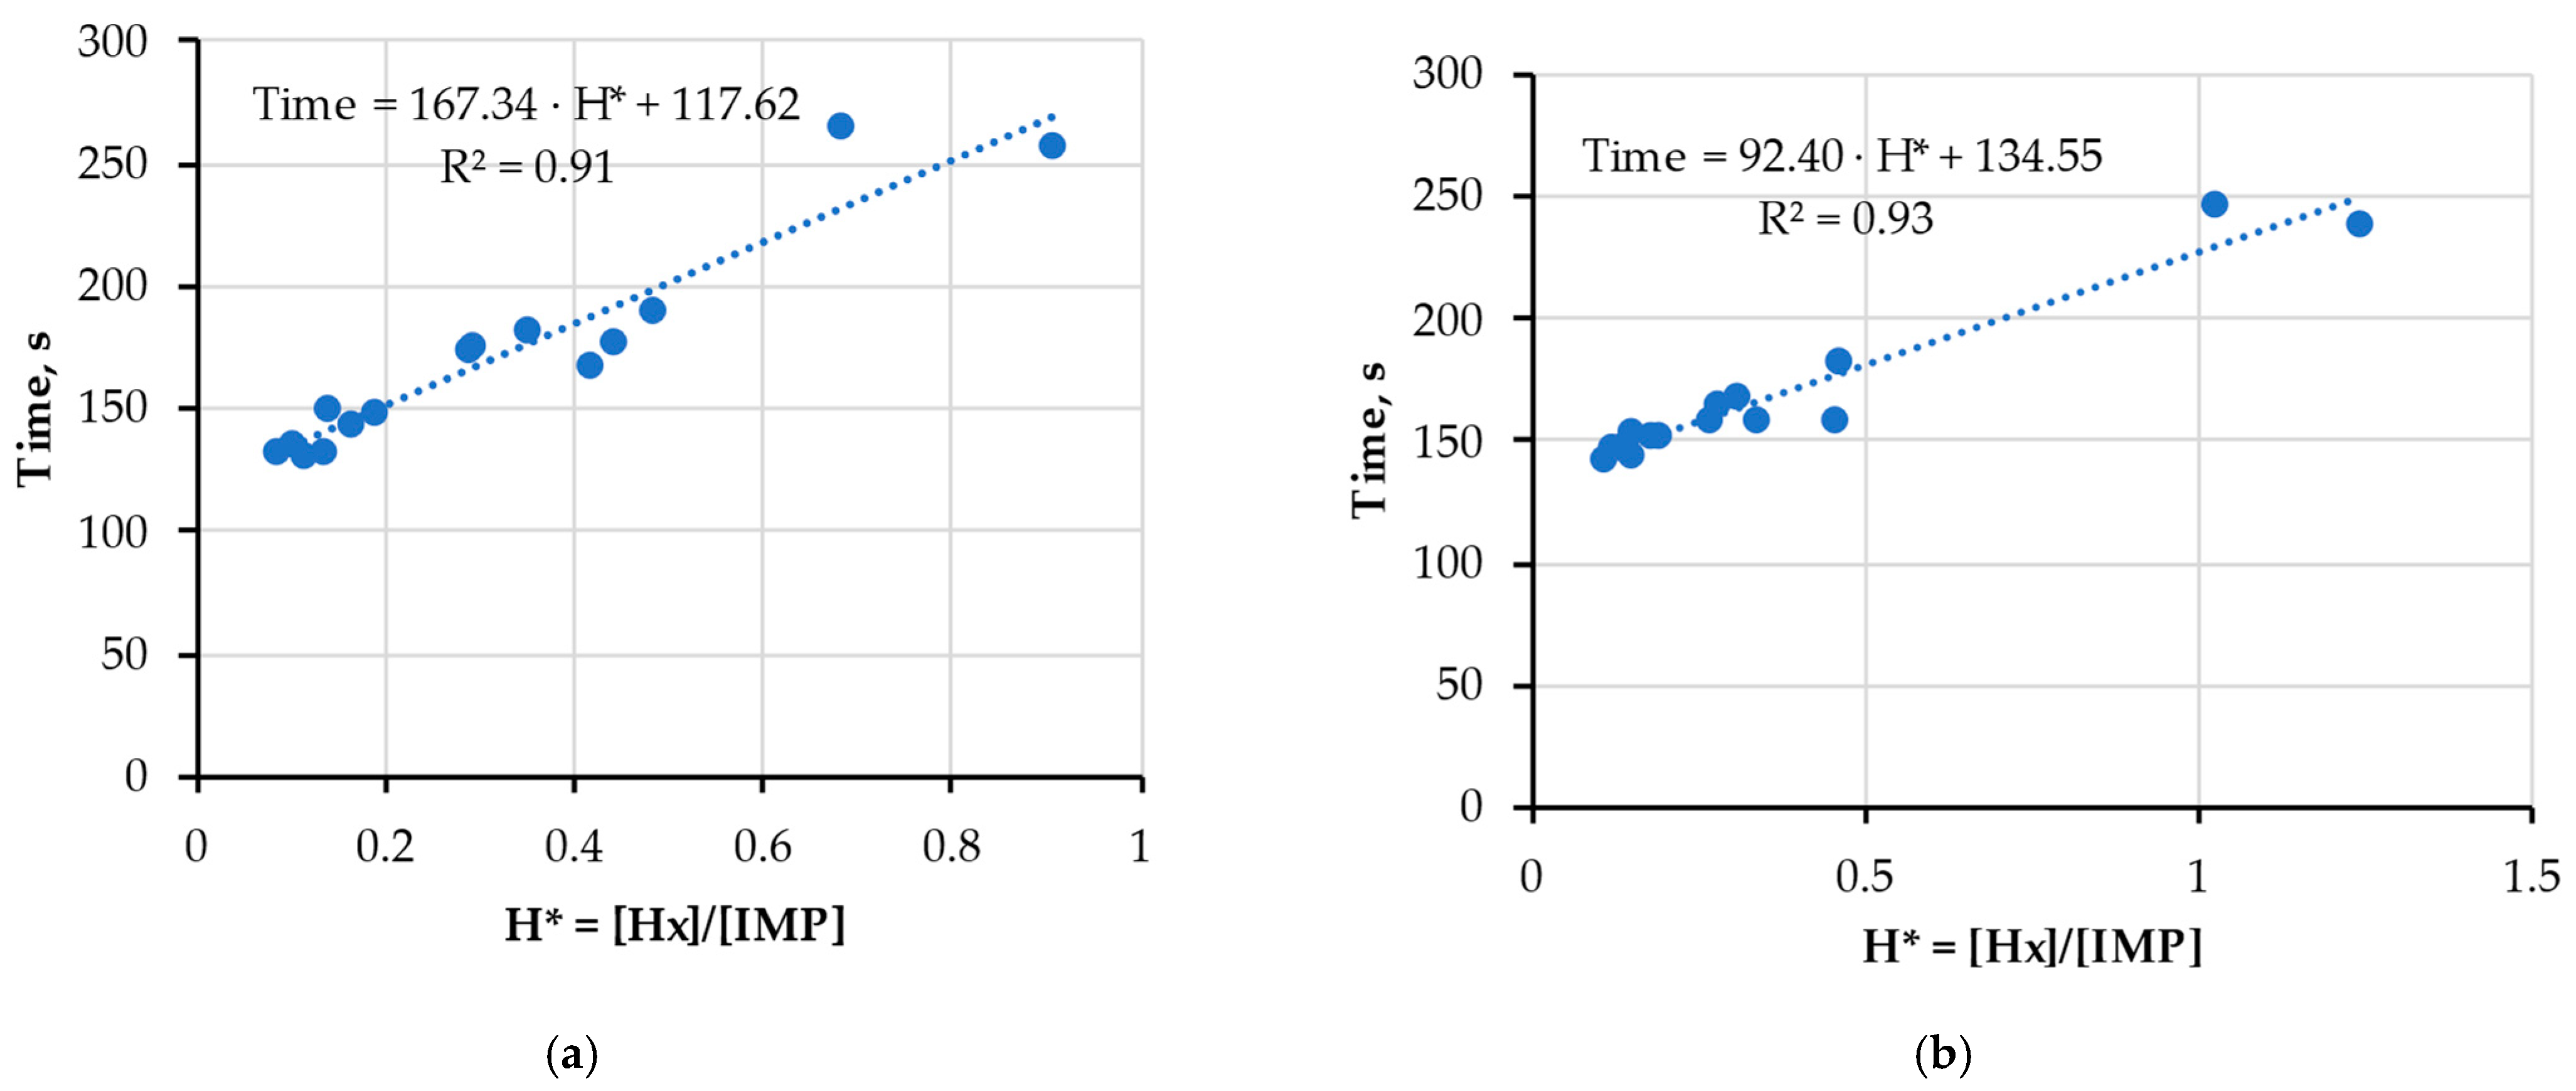
3.2. Verification of Compatibility of New Index H* and FPMLC Data

The next step was to establish the correlation between the independently obtained new freshness index H* = [Hx]/[IMP] (LC-DAD MS technique) and the index Time (FPMLC technique). This experiment can be also considered as a verification procedure of the FPMLC method by the LC-DAD MS technique [46]. Figure 5 shows the interdependences of the indices Time and H* measured during the tests of pork, both for raw samples stored aerobically (Figure 5a) and for the same samples after cooking (Figure 5b). The largest values exceeding the threshold H* >> 1 were excluded from the datasets for the diagrams in Figure 5.
The correlations in Figure 5a,b are similar, but still have important peculiarities. In case of H* ≈ 0, the meat is absolutely fresh and the value of Time is correspondingly the smallest. For raw meat (Figure 5a), this value derived from the correlation formula is 117.6 s. The Special Time measurement within four hours after slaughter gave Time = 114 ± 5.7 s for another pork in pieces. The good agreement between the extrapolated and directly measured values strengthens confidence in the validity and perfect compatibility of the H* and Time indices.

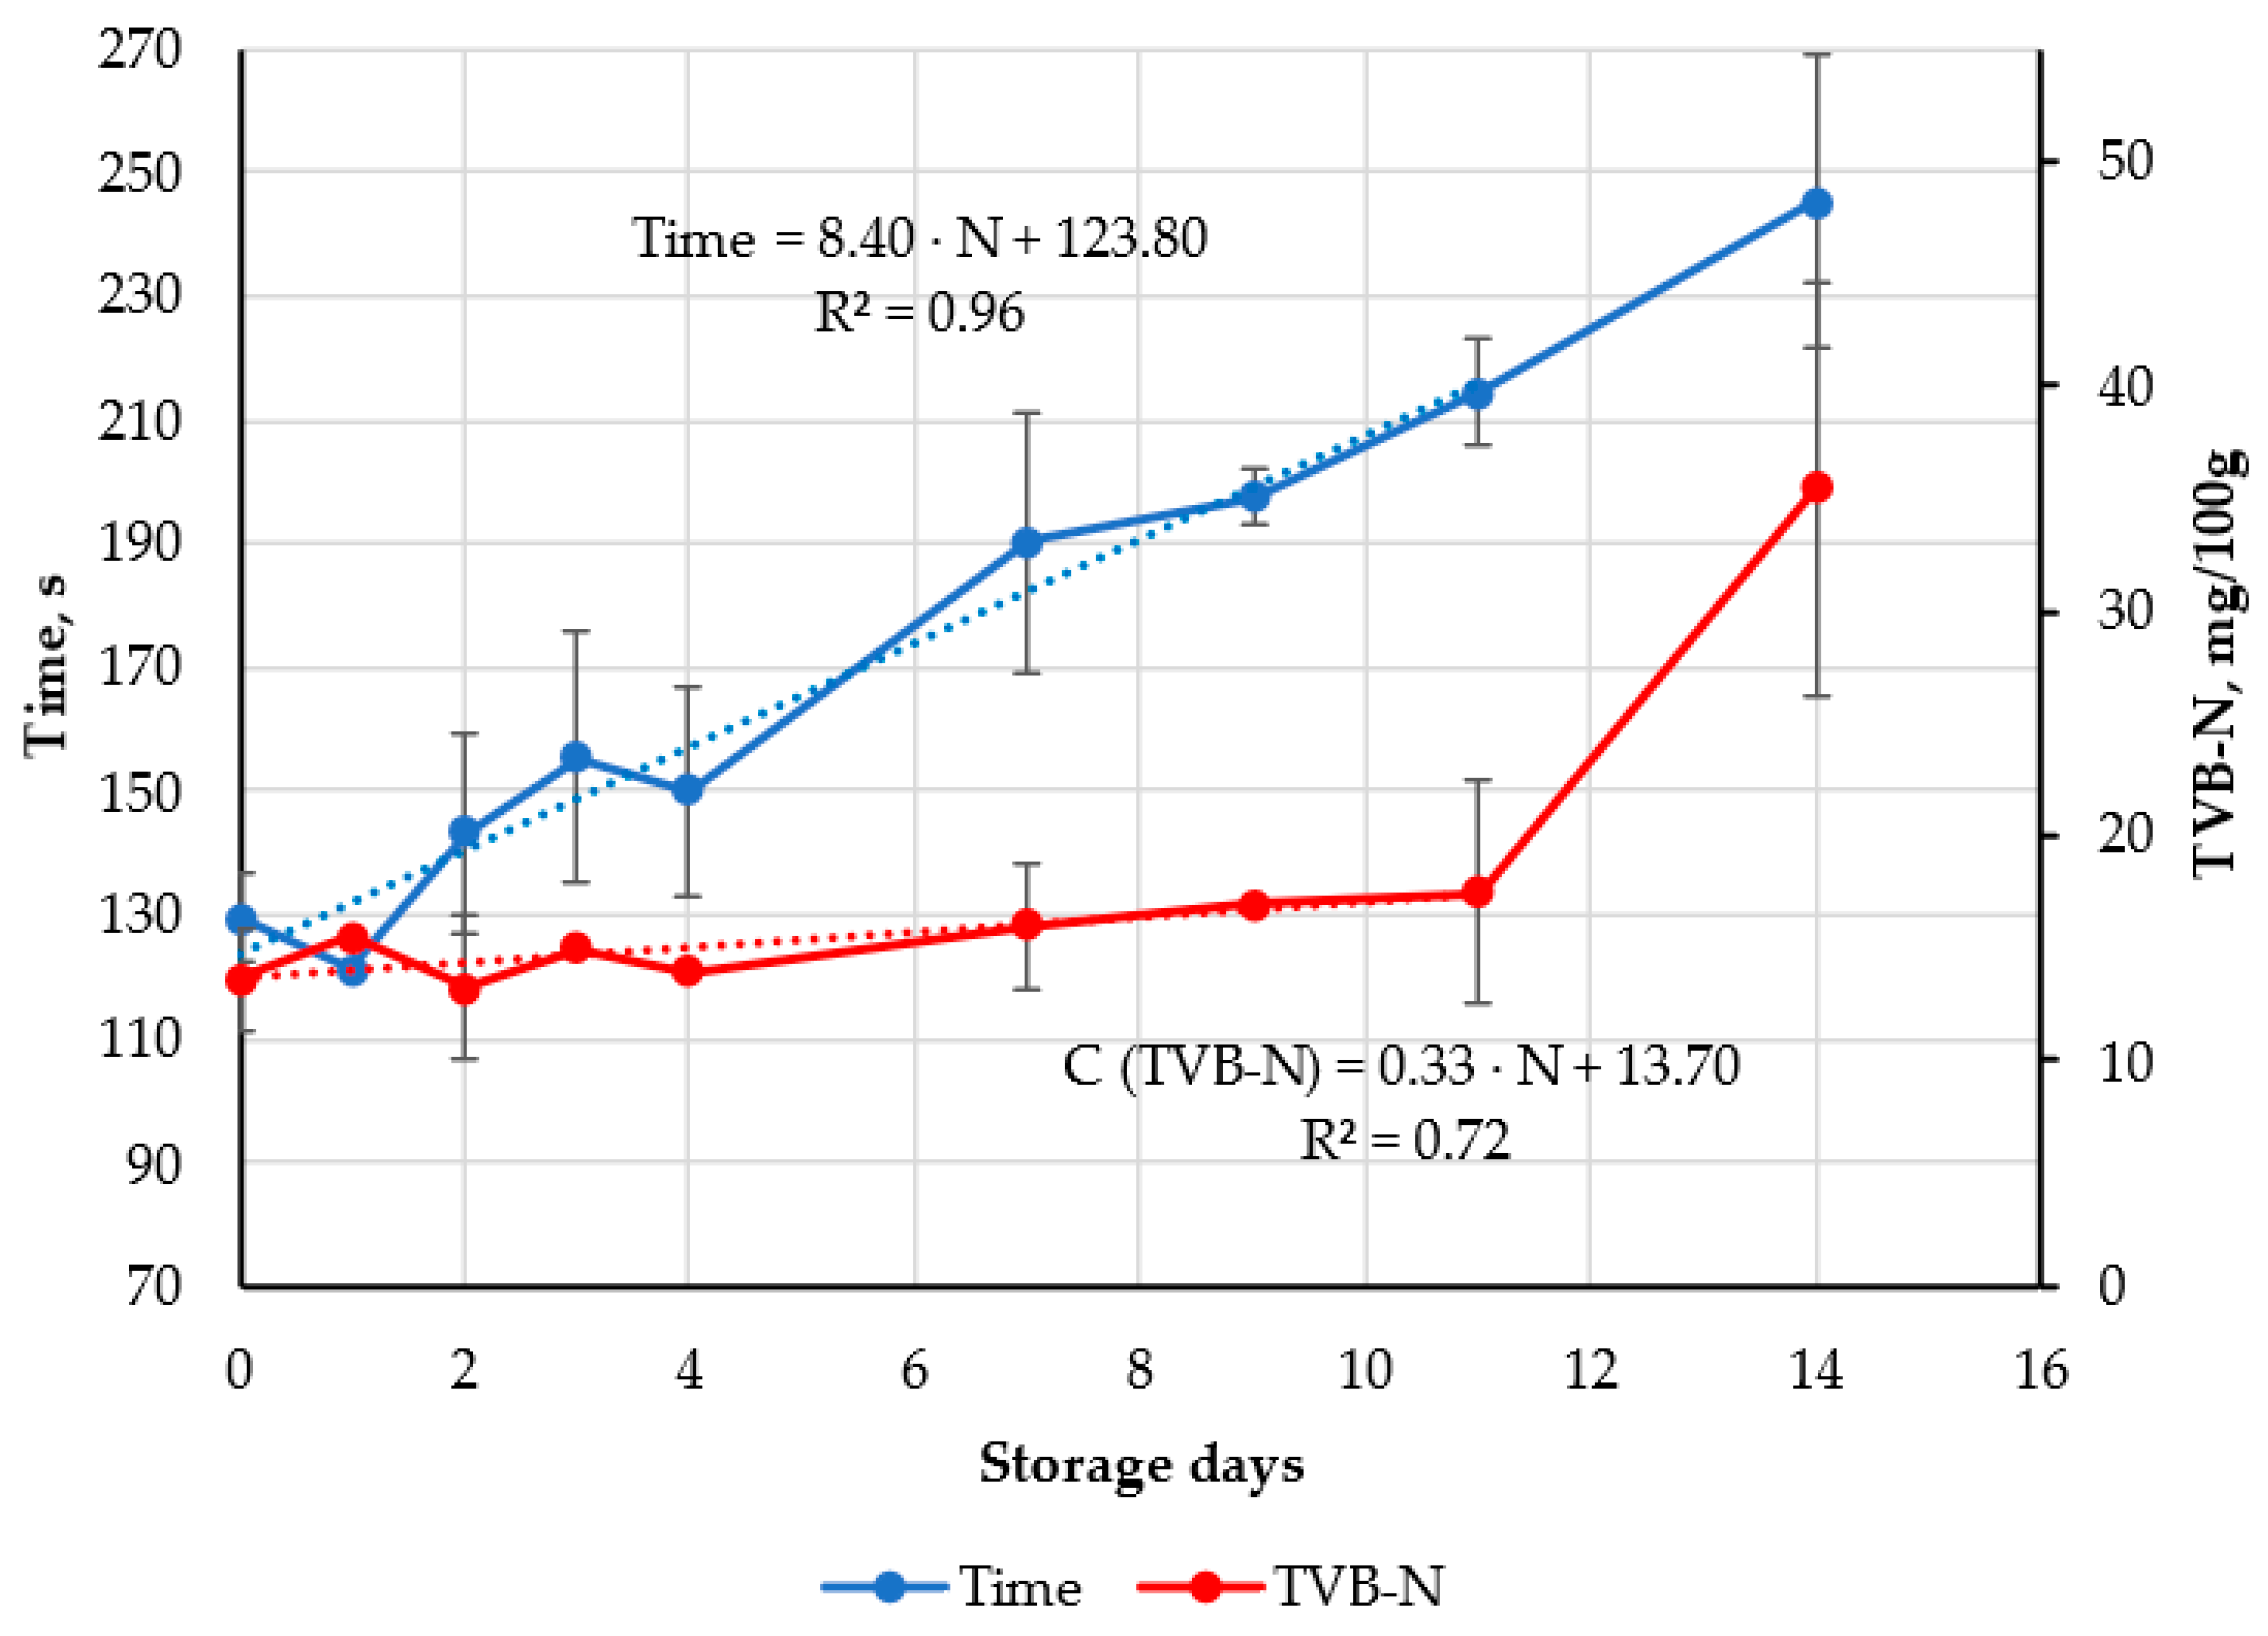
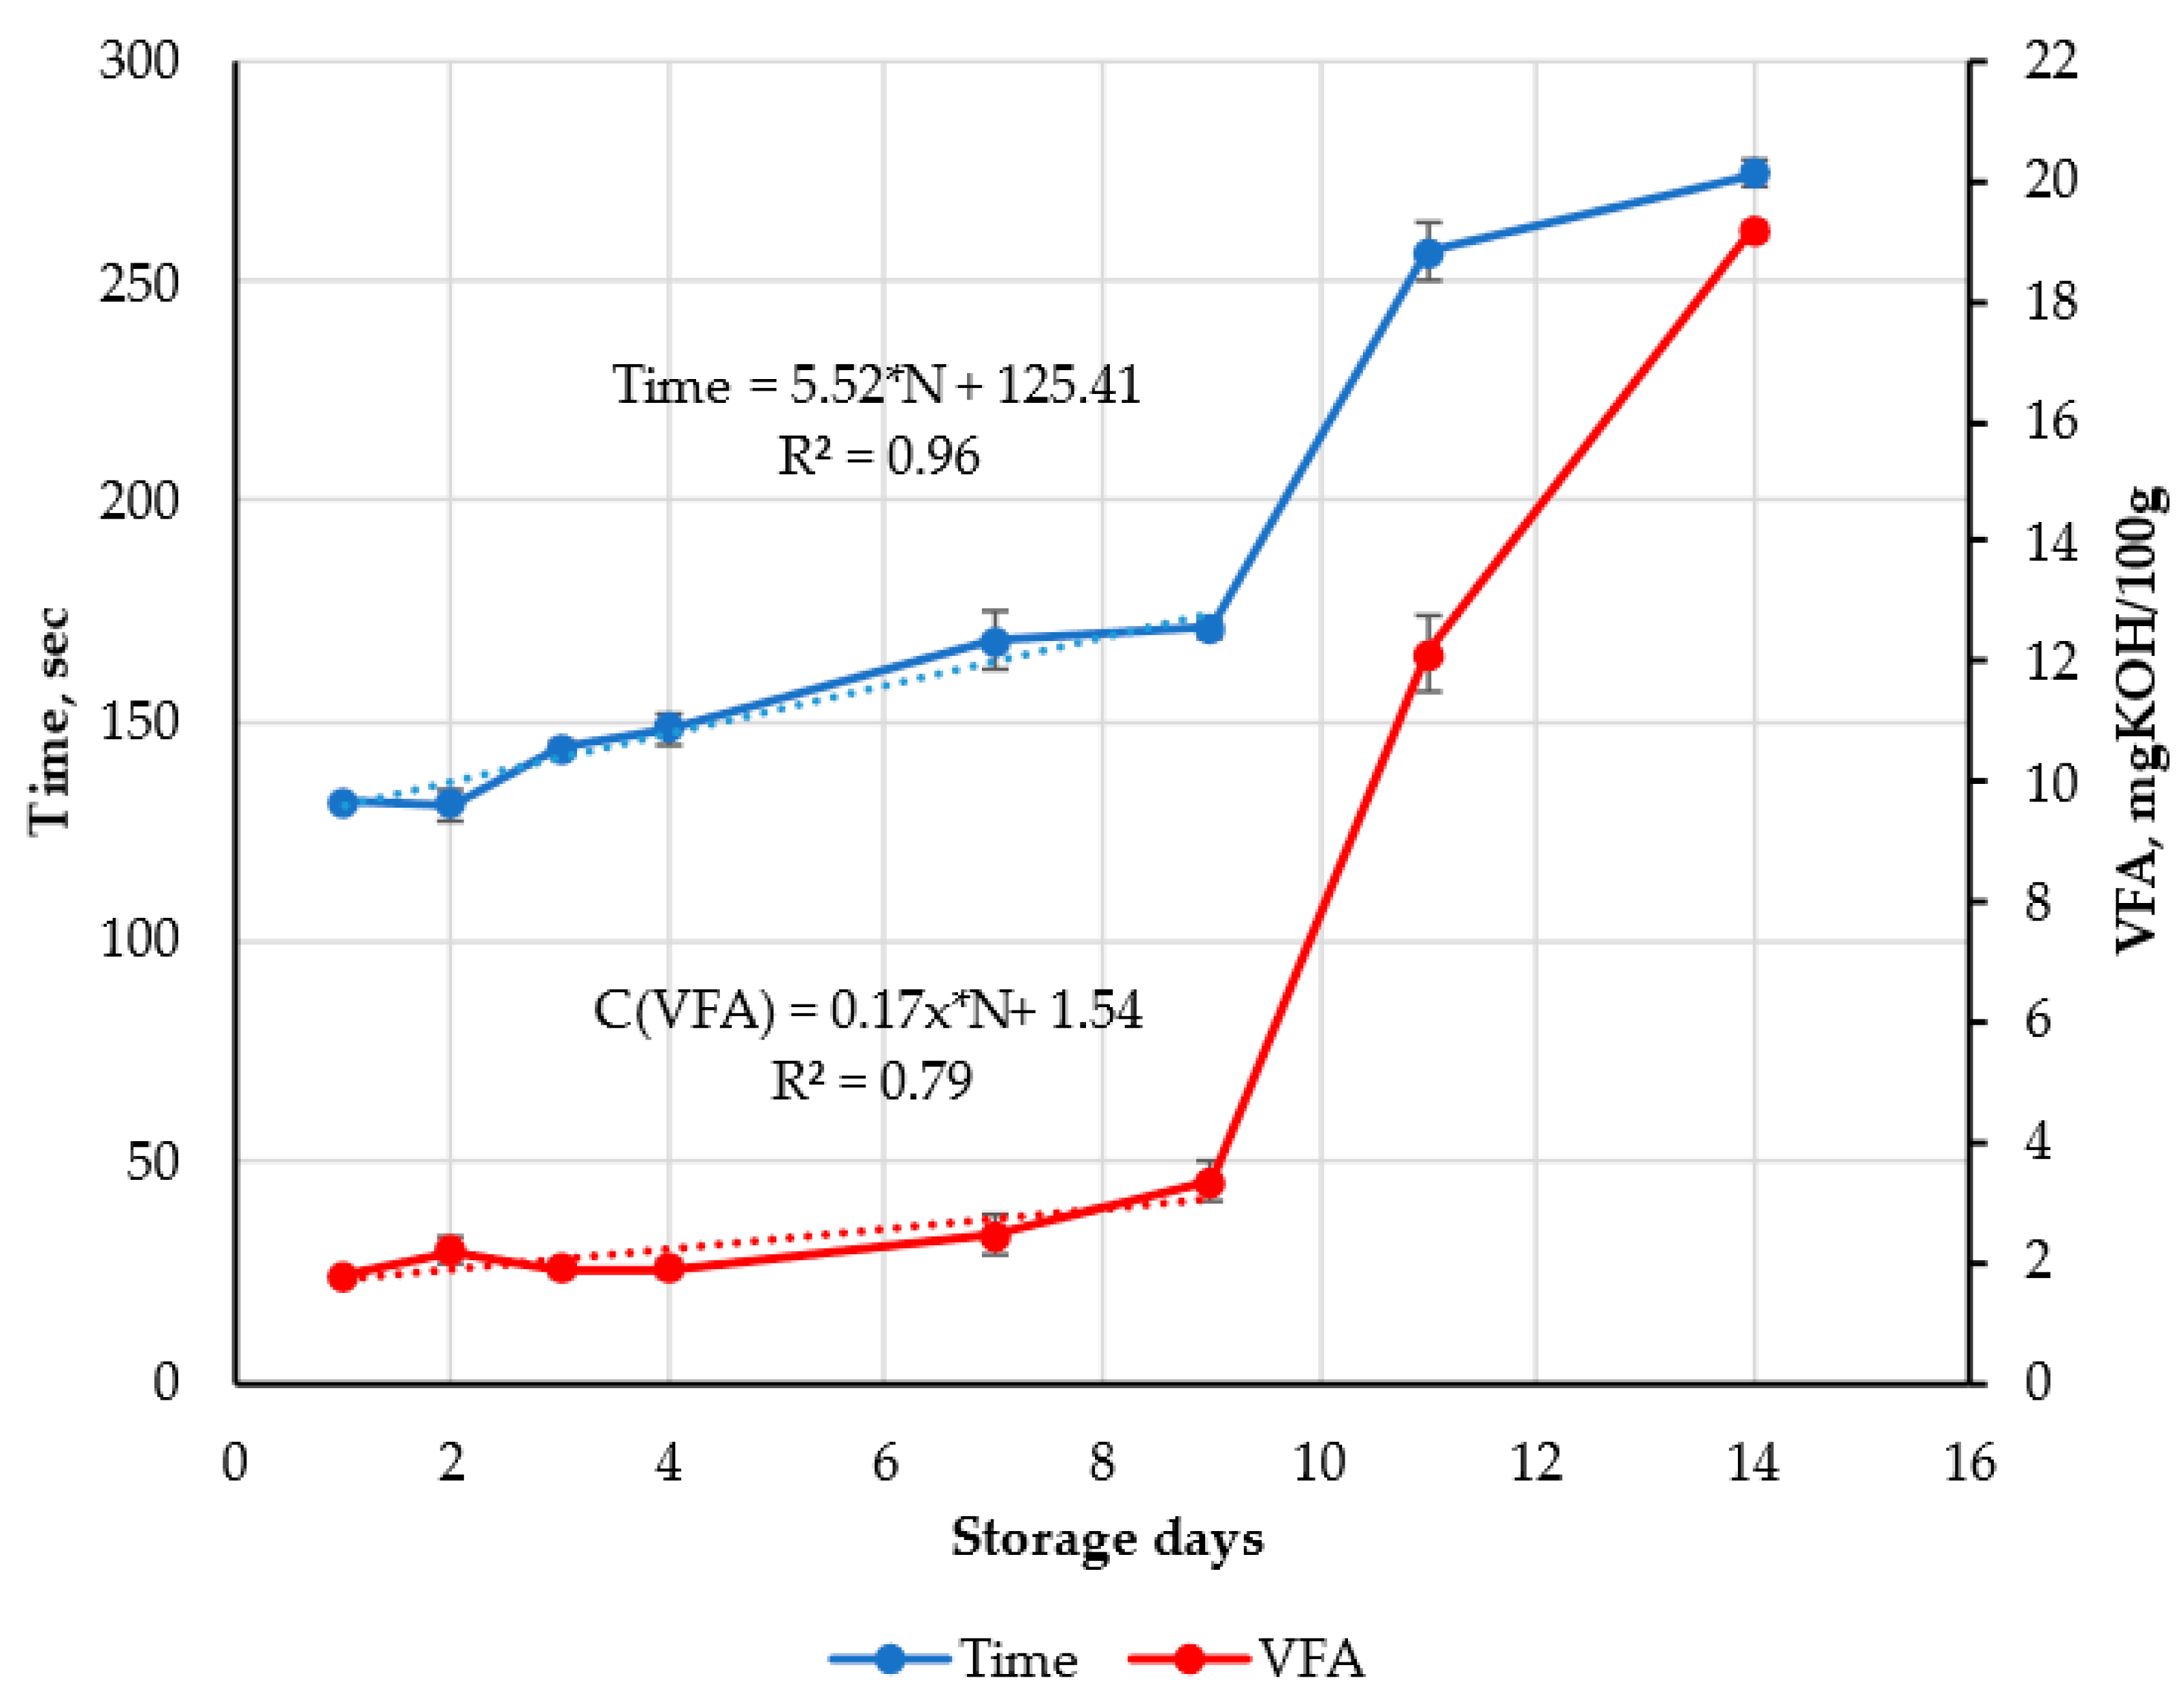
3.3. Results of Validation of FPMLC Data by VFA and TVB-N Methods

The test results obtained with the FPMLC device were verified by the TVB-N method with farmed trout and carp samples during storage from the day 0 to day 14 in aerobic conditions at +4 °C. Figure 6 shows the dynamics of the average index Time and TVB-N values obtained with farmed trout caught in spring and autumn seasons. It can be observed that both curves are close in shape and correlate with the coefficient r = 0.85. The onset of the strong TVB-N increase observed on day 11 and later on correlates well with the published data [37,49,50,51]. Moreover, the value TVB-N at day 7 in Figure 6 (the very onset of bacterial contamination according to the FAO scheme [52]) of 16 ± 2.83 mg/100g agrees very well with the average value that can be deduced from the data in [37,49,50,51], i.e., 16.25 ± 4.2 mg/100g. This means that quite typical trout fish have been used.
A similar comparison of Time and TVB-N values was conducted for carp and a correlation r = 0.8 was obtained. This, it can be concluded that the FPMLC device can provide relevant data for freshness, at least, of the well-known trout and carp fish.
The compatibility of the freshness test results with the FPMLC device with widely accepted meat quality control method based on VFA content was evaluated for porcine longissimus dorsi muscle (loin), obtained from a slaughterhouse the day after slaughter. The fillet sample was minced by means of a manual grinder with a sieve with 3 mm orifices. Minced meat was stored aerobically (in a plastic box) at +4 °C for 14 days. Measurements with the FPMLC device and by the VFA method were performed twice in each measurement during the 14-day period synchronously, with an accuracy not worse than 2 h. The relative standard deviations (Stdev/Mean) of the Time index and TVB-N content were in the interval of 0−5% usually around 2.5%. Bacterial contamination (CFU/g) was also estimated, but microbiological tests were synchronized more freely (within the same day’s work shift) with the FPLMC and VFA measurements, due to the fixed working schedule of the microbiological laboratory.
The evolution of the Time index and VFA content during the storage period is presented in the Figure 7: the data demonstrate that VFA content increased slowly during the first 9 days, then both the Time index and VFA jump sharply, accompanied by an increase in bacterial contamination to 1.6 × 10⁸ CFU/g from the initial level 7.2 × 10³ CFU/g and pH 7.0 from the initial value of pH 5.6.
Figure 7 shows the strictly parallel trajectories of the Time and VFA curves during the first 9 days of storage, which is confirmed by the high correlation coefficient r = 0.96 between these two parameters. The results obtained by the FPLMS method are quite compatible with the data of microbiological safety, which prove that the product is safe for consumption until the 9th day of storage at +4 °C. After the 11th day, the minced meat had an unpleasant off-smell of spoilage and a bad appearance, which made it unacceptable for culinary use.
A more detailed comparison of the curves at the initial stage of storage highlights a significant fact: when the meat is still in the autolysis phase (bacterial contamination on the 7th day was 2 × 10⁶ CFU/g, which is below the threshold level 107 [53]) the trajectories of the curves are parallel, but the irregularities of the Time index are much less obvious than for VFA data, and the Time index correlates much better with the duration of storage (R2 = 0.96) than VFA content (R2 = 0.79)
It can be argued that for fresh pork, the Time is more preferable as a freshness index than VFA content, and testing meat with the FPMLC device is much faster, cheaper, and simpler than the complicated determination of VFA. We expect that after further research, this conclusion may become more general and be extended to the meat of other animals.

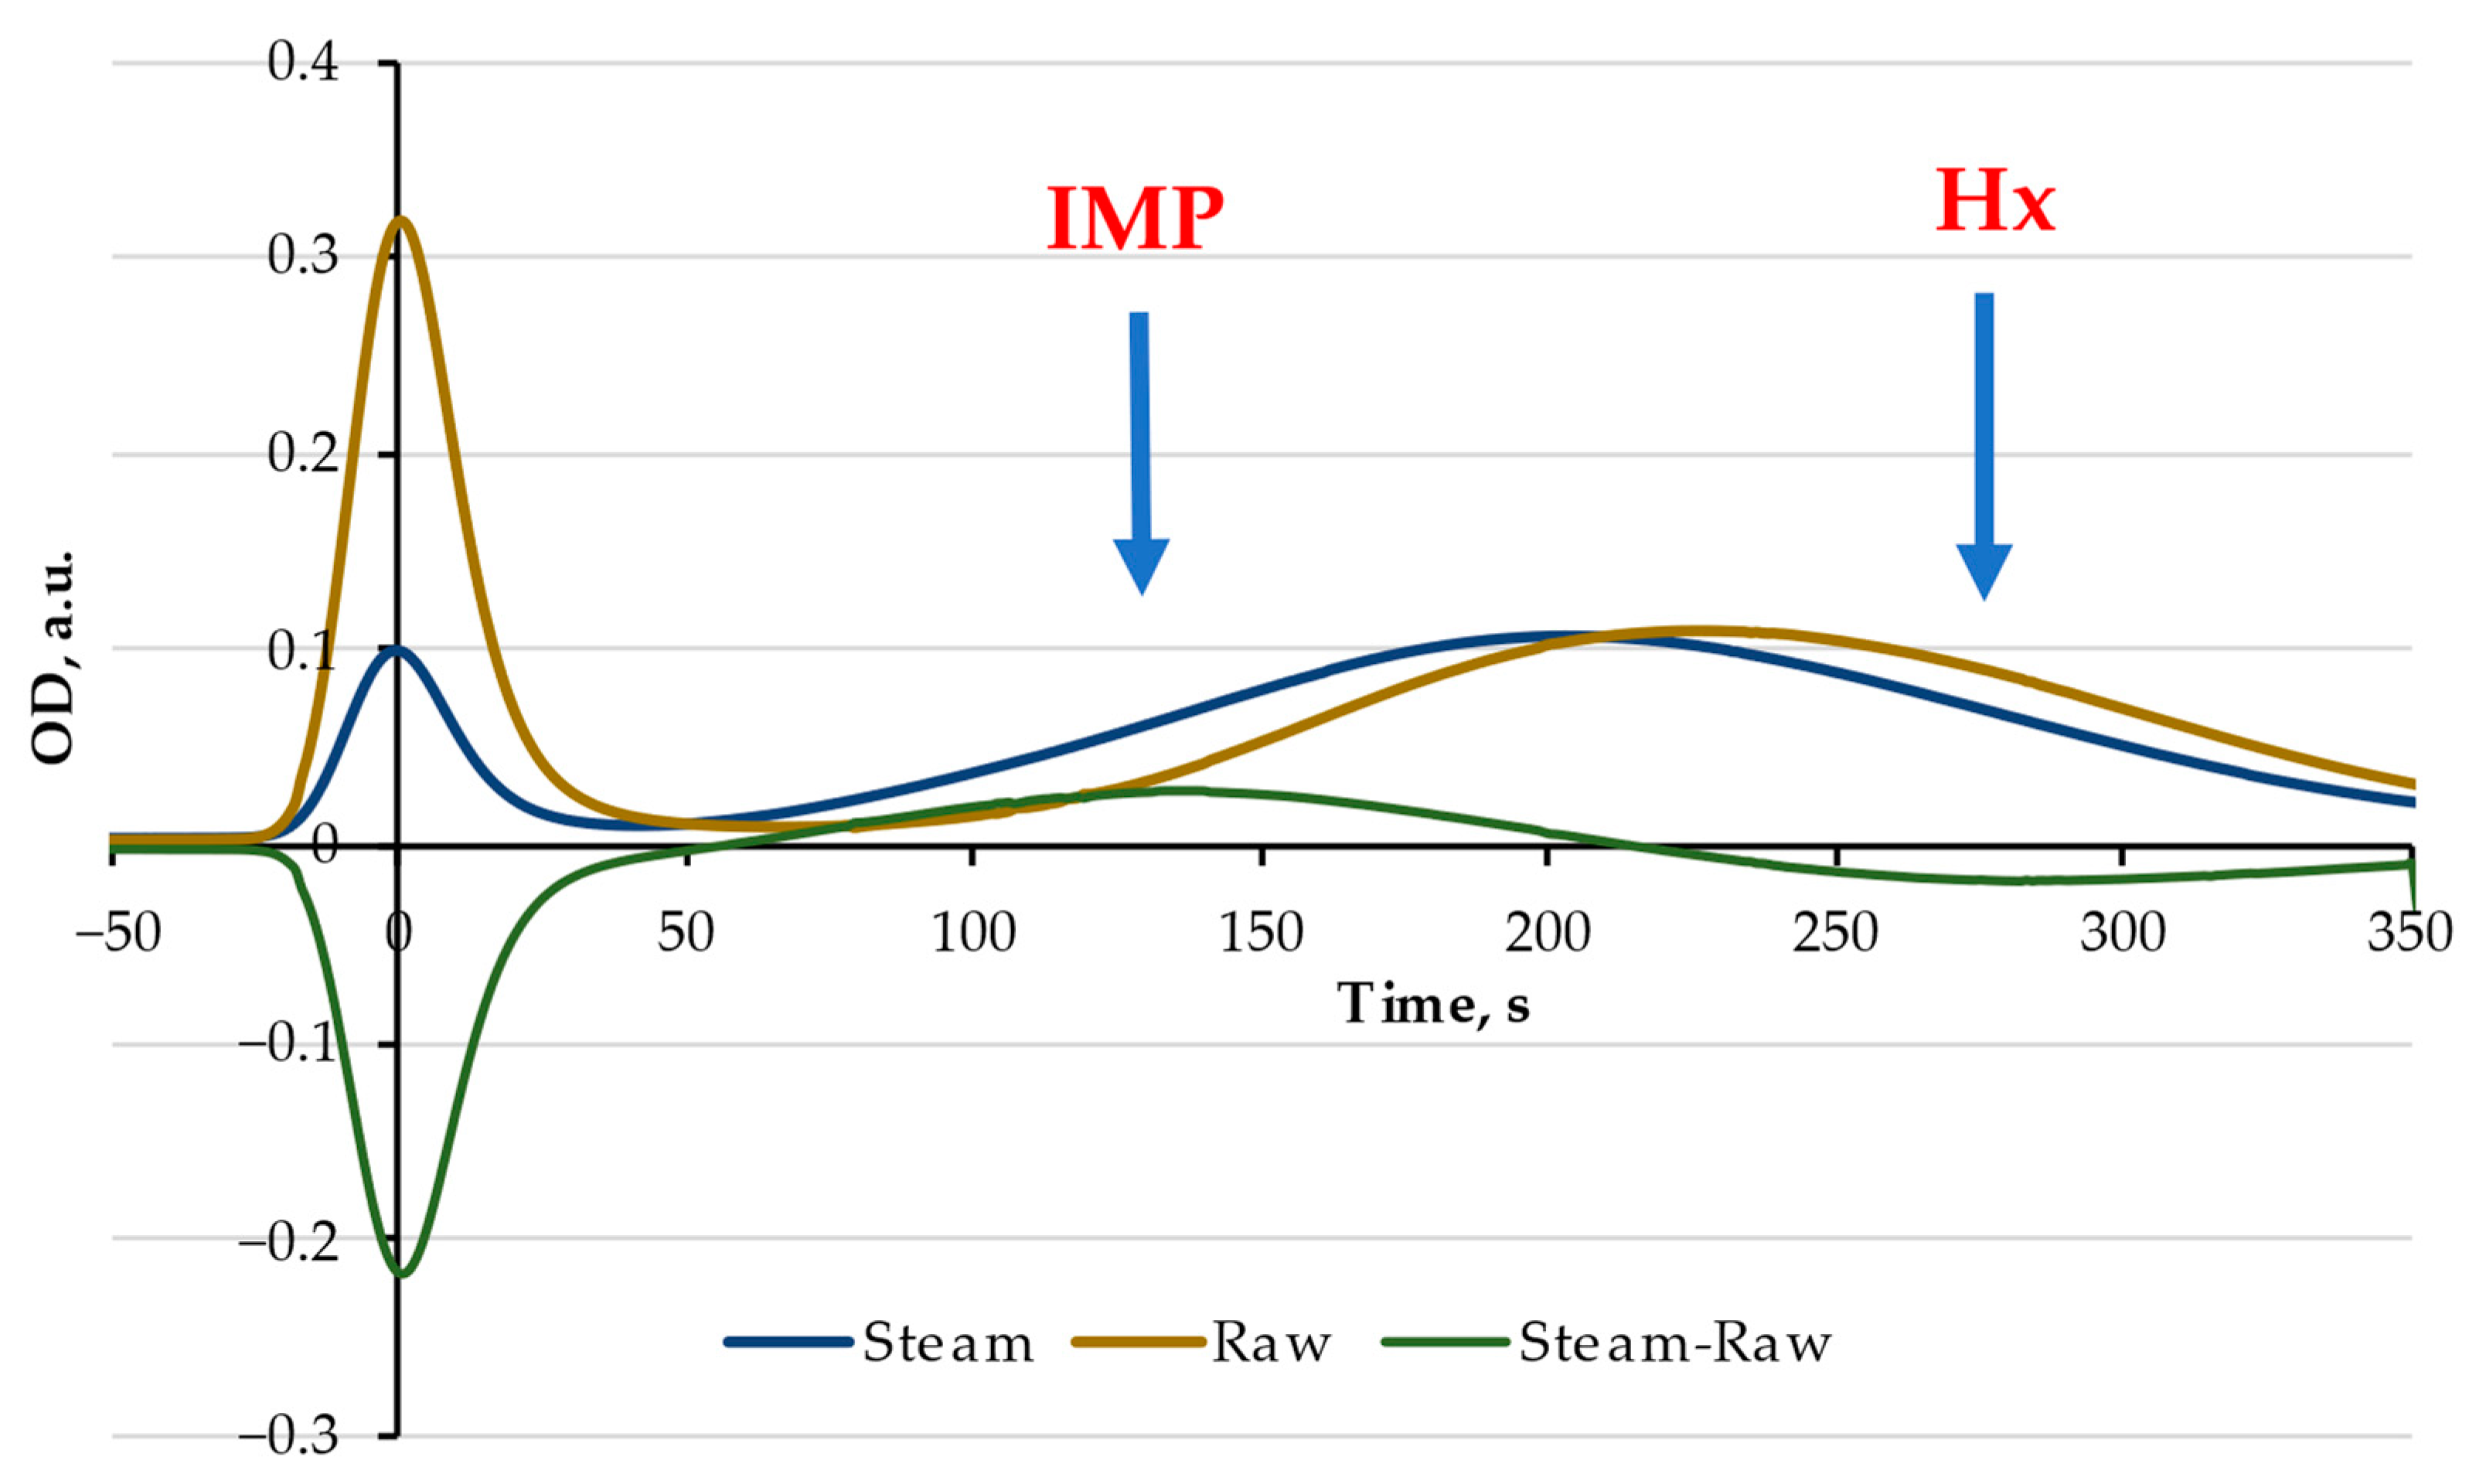
3.4. Effects of Heat Treatment and Putative Nucleotide Salvage

There is a number of evidences for a peculiar effect resulting in an increase in AMP and IMP content in animal meat after heat treatment (Nucleotide salvage) [54,55,56,57,58]. We had not found any published research data on a similar effect in fish meat and, hence, conducted a series of experiments with defrosted fish fillets (Alaska pollack, Hake, Norway haddock, Pangasius, Wolffish) from a local supermarket (Tartu, Estonia). All samples had a Time index about 200 s, corresponding to the Phase 3 of FAO UN Quality Score (see also Discussion) [52]. For heat treatment, the samples were placed in a microwave oven for 1–2 min at 400W or steam cooked at +100 °C for 15–60 min; fish fillets were cut into pieces of 5 × 5 × 2 mm.
For all fish samples, we observed the shift of the second metabolite peak (FPMLC fraction II) in the chromatograms towards lower retention times and a consequent decrease in the Time index, i.e., nucleotide relative content after thermal processing changed to become more to that of fresh fish. The shifts of the Time index ΔTime after 15–60 min of steam cooking at 100 °C are presented in Table 2.
The chromatograms of Alaska pollack before (raw) and after cooking (steam) at 100 °C for 60 min are shown in Figure 8, and the difference between the two chromatograms (raw-steam) is also presented. Two extrema (besides protein) are clearly observed for the difference curve (raw-steam): one maximum at 135 s, which probably corresponds to an increase in the IMP concentration after thermal treatment, and another minimum at 282 s, which could be related to a decrease in Hx concentration.
To verify this assumption, NMR spectra of two samples of raw and steam cooked Alaska Pollock samples, previously used for FPMLC testing, were measured. The measurements were carried out according to 2.6.2. The preliminary assignment of the main signals has been conducted in agreement with the data of [59,60,61], for strict identification spiking tricks with IMP and Inosine have been performed.
In fact, only Inosine and Hypoxanthine lines were detected in raw pollock meat (Figure 9a), but the presence of IMP was also observed in the cooked meat (Figure 9b). The singlet at 8.58 and the doublet near it at 6.15 ppm belong to IMP, as observed in the spectrum with added IMP. Moreover, after the addition of IMP, another line of IMP was revealed: this line overlaps very closely with the Inosine line at 8.24 ppm and remains overshadowed in the unspiked liquid. Thus, the formation of IMP (Figure 9c) in the course of the heating of this pollock fish has been registered. Such a manifestation of the possible nucleotide salvage or nucleotide synthesis in cooked fish (pollock) was observed, to the best of our knowledge, for the first time. Further experiments are under way to confirm this hypothesis. The FPMLC sensor is proved to be a very useful instrument in this work for the rapid pre-selection of samples for more precise but expensive and cumbersome evaluation methods as NMR, HPLC, MS, etc.

4. Discussion

The results obtained for in-house-validation by TVB-N and VFA standard methods show that the FPMLC sensor can be used equally successfully to evaluate the freshness of both fish and animal meat. This conclusion is not surprising, since in both cases, freshness in this study is determined by the formulas (2) and (3) based on the main metabolites of ATP as the variables. These metabolites are absolutely the same in fish and meat, which reflects the common features of the ATP post-mortem catabolism.
The classic freshness indices K, KI and some others have a certain drawback. Their limit value is 1 (or 100%) and approaches this limit slowly and asymptotically as the sample deteriorates. As a result, the difference between the index values for a product still acceptable for consumption and an irreversibly spoiled product can be as little as 10% or less. This situation means a low sensitivity and too late warning of imminent danger, for example, in the form of intense bacterial contamination.
The index H* = [Hx]/[IMP] proposed in this work takes into account only Inosine monophosphate IMP and Hypoxanthine Hx, but these metabolites are the most important determinants during the loss of freshness. There are no known examples of IMP content increasing with the aging of fish or meat; outside the first day, there is always a decrease in IMP. This means that H* can take values even as H* >> 1. A similar situation also occurred in this study when a rather early critical bacterial contamination (1.6 × 10⁸ CFU/g) took place on day 9 of the experiment with minced pork (Figure 7). This resulted in dramatic growth in the Time index from 172 to 257 sec in the interval of 9–11 days of storage, accompanied by a sharp increase in H* index from 0.44 to 0.91, reflecting the rapid deterioration of the freshness status.
Our proposal for the H* index builds on previous recommendations to improve the freshness index situation. In particular, in [62], the K* index was proposed, which differs from the K index in that it does not take into account inosine at all due to its change during the loss of freshness with an inconsistent trend—at first a slow rise in concentration followed by a slow decline. The authors of the work [62] came to the conclusion that the K* index can better predict the shelf life of refrigerated striped bass than the K or KI indices.
Since the early 1960s, the use of hypoxanthine [Hx] as an independent index of fish spoilage has been proposed, as it is the longest-lived metabolite with a constant upward trend over time [63,64], and it was also noted that hypoxanthine concentration [Hx] increased during storage almost linearly [65]. However, the growth rate during shelf-life was too low to be useful as an index of freshness. In this regard, the H* index does not suffer from the noted drawback, since at [IMP] → 0, which always happens during prolonged storage, the ratio [Hx]/[IMP] → ∞.
It can also be noted that the H* index has a strict linear relationship with Time readings of the FPMLC sensor in the most important and initial freshness region (Figure 5) and, thus, an important rule in instrumentation, i.e., linear response to a stimulus, is fulfilled. Of significant interest is the comparison of the technical parameters and capabilities of the device with the organoleptic characteristics of foods. A good pattern to achieve this goal is the Phases diagram of Quality score of the FAO of UN [52] (Figure 10). This diagram was elaborated on during the organoleptic examination of cod fishes cooked in steam. To the best of our knowledge, this is the most valuable scheme of the subject under consideration.
We have carried out a number of Time index measurements with fish and meat in exactly the same mode as the other experiments in this study but precisely knowing the day 0 or even the hour 0 (exact day and time of animal slaughter or fish harvest). For this purpose, the work has been conducted in a slaughterhouse with absolutely fresh pork and beef to obtain the corresponding values of Time for the Phase 1. Farmed trout and carp were used as fish samples. The obtained Time data is placed at the FAO diagram in a randomized mode, i.e., without indicating whether it was fish or animal meat (carp data are given only for the days 0 and 1). It can be observed that the series of Time points are fairly anticorrelated with the FAO curve, with a very high coefficient of r = −0.97.
The technical data obtained with the FPMLC sensor, compiled with the Phase diagram of UN FAO [52] and the experiences of ordinary food consumers, are presented in Table 3. The data therein cannot be used as an instruction or guidelines; they are only for orientation in the ocean of information about foods in the form of animal meat and fish as well. We hope that Table 3 together with the data in 3.4 encourage the researchers to look for phenomena occurring during the thermal treating of raw products in relation to the phenomenon of nucleotides salvage, which can enhance the usefulness of foods that stand near the end of shelf life. This, in turn could help consumers and retailers to reduce food waste and bring it down below the current level of 30%. The approach of this study and the FPMLC method and device can be of help in this work.
In addition to freshness control, the developed device and analytical technique are well in line with the modern attitude towards the nutritional nucleotides, which is also gaining interest as immunity boosters [66,67,68]. A perspective that in the near future there will be introduced a nutritive index of nucleotides [68] and a “green transition” to a healthy umamiization of foods achieved [12] makes the matter highly interesting. For this purpose, however, simple and reliable instruments for assessing the quality of foods and just the degree of their umamization should be available.

5. Concluding Remarks

It was demonstrated that sensing technology based on fast protein and metabolites liquid chromatography (FPLMC) provides rapid on-site assessment of animal meat and fish freshness with low-cost, affordable, multiple use, easily operated optical chemical sensors. In was demonstrated that direct readings of FPMLC sensor (the index Time, difference between the retention times of proteins and nutritional nucleotide and nucleoside pools, mainly hypoxanthine and inosine monophosphate), and the new freshness index H* = [Hx]/[IMP] strongly correlated with TVB-N (for fish) and VFA (for meat) content, which are considered reliable indicators of product spoilage. Moreover, it was demonstrated that the indices Time and H* more accurately reflect freshness deterioration at the early stages of product storage than conventional TVB-N and VFA, which are slightly sluggish and strongly react only at the late stages, when the sample is approaching close to spoilage, failing to detect the changes in muscle tissue during autolysis (Figure 6 and Figure 7). The developed approach is free of this drawback: the averaged data obtained with the FPMLC sensor are in good concordance with the Phases diagram of Quality score of the FAO of UN based on organoleptic examination and consumer properties of fish. In addition to the routine control of meat and fish quality, the relative content of dietary nucleotides and nucleosides determined with the FPMLC sensor, especially inosine monophosphate, is extremely important for product taste (umami taste) and nutritional value. In this context, a quite peculiar effect of nucleotide salvage has been observed in fish muscle tissue and validated by NMR spectroscopy.
It should be emphasized, that most, if not all, portable low-cost instruments for the evaluation of meat and fish freshness are of indicator-type disposable sensors envisaged mainly for distinguishing between the low and high bacterial contamination, while more sophisticated tools, e.g., multienzyme biosensors, electronic noses and tongues, or near-infrared (NIR) spectroscopic analytical systems are expensive, single-use (biosensors), sensitive to contaminated laboratory environment (electronic nose), or dependent on complex object-specific chemometrics algorithms (NIR). It is very difficult, if not impossible, to monitor with simple and affordable sensors the stages of autolysis, discriminate between the Phase 1 and Phase 2 (Figure 10) and predict the residual shelf life. This problem can be easily solved with the FPMLC sensor due to its high precision (the relative standard deviation of the main instrumental parameter Time is less than 5%).
In a comprehensive review [22], as many as 41 freshness evaluation methods, including the FPLC approach presented in the current article (based on a brief previous description in a conference paper [42]), were discussed. The authors points to the obvious fact that this method still needs universal acceptance and more research to be conducted, but at the same time, mention seven positive features compared to other techniques:
  • Quickest determination of fish freshness available until now,
  • Can be used in labs as well as in retail chains,
  • Environment friendly,
  • Low cost and reliable,
  • Less qualified staff can also work,
  • Non-destructive and less time consuming, and
  • Quickly determine shelf life of almost all varieties of fish.
The main point is that the FPMLC technique and sensor are oriented towards the future, towards the development and introduction into practice of the nutritive nucleotide index (NNI) [12,66]. Indeed, the Time values can be easily recalibrated into the values of NNI for raw or ready-to-eat foods. In any case, the FPMLC method invented and developed here would be in a more strict and direct functional connection with nucleotides’ presence in subjects than the methods based on the correlation between another parameters as it is, e.g., in the classical methods of TVB-N, TMA-N, VFA, etc. Moreover, the FPMLC sensors are potentially capable of the simultaneous qualitative determination of protein and nucleotides content provided a dual-wavelength UV detection unit is installed, and the development of such devices is underway.

Author Contributions

Conceptualization, A.K. (Artur Kuznetsov) and G.K.; methodology, A.K. (Artur Kuznetsov), T.P. and L.A.; funding acquisition, A.F., M.R., and S.H.; software, V.K.; validation, A.S., A.K. (Andrey Kozin) and L.T.; supervision, A.K. (Artur Kuznetsov) and M.R.; formal analysis, N.M.; investigation, A.S., N.K., L.R., D.A. and L.T.; resources, L.A. and A.F.; data curation, A.K. (Andrey Kozin) and M.R.; writing—original draft preparation, A.K. (Artur Kuznetsov), G.K. and T.P.; visualization, O.S. and A.K. (Andrey Kozin); writing—review and editing, N.M., S.H., O.S., T.P. and A.F.; project administration, A.F. and M.R. All authors have read and agreed to the published version of the manuscript.

Funding

This research was partially financially supported by the Estonian Research Council grant (PRG 1441) of the Estonian University of Life Sciences (A.S., L.R., D.A., T.P., M.R.) and by DFG (Deutsche Forschungsgemeinschaft), project number 315440263, project title: “Verhalten von Proteinen in mikrofluidischen Kanälen (Behavior of proteins in microfluidic channels)” (N.M., S.H.).

Institutional Review Board Statement

Not applicable.

Informed Consent Statement

Not applicable.

Data Availability Statement

Data available on request due to Ldiamon AS commercial secret.

Acknowledgments

The authors express their gratitude to the staff of National Centre for Laboratory Research and Risk Assessment (before 1 January 2023–Estonian Veterinary and Food Laboratory) for help and valuable comments and to Roman Korsakov for assistance in software development.

Conflicts of Interest

The authors declare no conflict of interest.

References

  1. Richey, J. FPLC: A comprehensive separation technique for biopolymers. Am. Lab. 1982, 14, 104–129. [Google Scholar]
  2. Tangvarasittichai, S.; Tangvarasittichai, O.; Jermnim, N. Comparison of fast protein liquid chromatography (FPLC) with HPLC, electrophoresis & microcolumn chromatography techniques for the diagnosis of beta-thalassaemia. Indian J. Med. Res. 2009, 129, 242–248. [Google Scholar] [PubMed]
  3. Verbeke, K.; Verbruggen, A. Usefulness of fast protein liquid chromatography as an alternative to high performance liquid chromatography of 99mTc-labelled human serum albumin preparations. J. Pharm. Biomed. Anal. 1996, 14, 1209–1213. [Google Scholar] [CrossRef]
  4. Madadlou, A.; O’Sullivan, S.; Sheehan, D. Fast Protein Liquid Chromatography. Methods Mol. Biol. 2017, 1485, 365–373. [Google Scholar] [CrossRef]
  5. Deori, S.; Hurri, E.; Karkehabadi, S.; Morrell, J.M. Fast protein liquid chromatography profiles of seminal plasma proteins in young bulls: A biomarker of sperm maturity? Livest. Sci. 2021, 250, 104600. [Google Scholar] [CrossRef]
  6. Sünter, A.; Frorip, A.; Korsakov, V.; Kurruk, R.; Kuznetsov, A.; Ots-Rosenberg, M. Optical method for screening and a new proteinuria focus group. J. Biomed. Photon. Eng. 2015, 1, 236–247. [Google Scholar] [CrossRef] [Green Version]
  7. Kuznetsov, A.; Frorip, A.; Sünter, A.; Korsakov, V.; Konoplev, G.; Stepanova, O.; Roschina, N.; Ovsyannikov, N.; Lialin, D.; Gerasimchuk, R.; et al. Optical Chemical Sensor Based on Fast-Protein Liquid Chromatography for Regular Peritoneal Protein Loss Assessment in End-Stage Renal Disease Patients on Continuous Ambulatory Peritoneal Dialysis. Chemosensors 2022, 10, 232. [Google Scholar] [CrossRef]
  8. Noonin, C.; Kapincharanon, C.; Sueksakit, K.; Kanlaya, R.; Thongboonkerd, V. Application of tandem fast protein liquid chromatography to purify intact native monomeric/aggregated Tamm-Horsfall protein from human urine and systematic comparisons with diatomaceous earth adsorption and salt precipitation: Yield, purity and time-consumption. Anal. Methods 2021, 13, 3359–3367. [Google Scholar] [CrossRef]
  9. Tsay, F.-R.; Haidar Ahmad, I.A.; Henderson, D.; Schiavone, N.; Liu, Z.; Makarov, A.A.; Mangion, I.; Regalado, E.L. Generic anion-exchange chromatography method for analytical and preparative separation of nucleotides in the development and manufacture of drug substances. J. Chromatogr. A 2019, 1587, 129–135. [Google Scholar] [CrossRef]
  10. Hong, H.; Regenstein, J.M.; Luo, Y. The importance of ATP-related compounds for the freshness and flavor of post-mortem fish and shellfish muscle: A review. Crit. Rev. Food Sci. Nutr. 2017, 57, 1787–1798. [Google Scholar] [CrossRef]
  11. Howgate, P. A review of the kinetics of degradation of inosine monophosphate in some species of fish during chilled storage. Int. J. Food Sci. Technol. 2006, 41, 341–353. [Google Scholar] [CrossRef]
  12. Mouritsen, O.G. Umamification of food facilitates the green transition. Soil Ecol. Lett. 2022, 5, 9. [Google Scholar] [CrossRef]
  13. Zhang, Z.; Sun, Y.; Sang, S.; Jia, L.; Ou, C. Emerging Approach for Fish Freshness Evaluation: Principle, Application and Challenges. Foods 2022, 11, 1897. [Google Scholar] [CrossRef] [PubMed]
  14. Saito, T.; Arai, K.-I.; Matsuyoshi, M. A New Method for Estimating the Freshness of Fish. Nippon Suisan Gakkaishi 1959, 24, 749–750. [Google Scholar] [CrossRef]
  15. García, M.R.; Ferez-Rubio, J.A.; Vilas, C. Assessment and Prediction of Fish Freshness Using Mathematical Modelling: A Review. Foods 2022, 11, 2312. [Google Scholar] [CrossRef] [PubMed]
  16. Fujita, T.; Hori, Y.; Otani, T.; Kunita, Y.; Sawa, S.; Sakai, S.; Tanaka, Y.; Takagahara, I.; Nakatani, Y. Applicability of the K0 Value as an Index of Freshness for Porcine and Chicken Muscles. Agric. Biol. Chem. 1988, 52, 107–112. [Google Scholar] [CrossRef] [Green Version]
  17. Batlle, N.; Aristoy, M.-C.; Toldrá, F. ATP Metabolites During Aging of Exudative and Nonexudative Pork Meats. J. Food Sci. 2001, 66, 68–71. [Google Scholar] [CrossRef]
  18. Nakatani, Y.; Fujita, T.; Sawa, S.; Otani, T.; Hori, Y.; Takagahara, I. Changes in ATP-Related Compounds of Beef and Rabbit Muscles and a New Index of Freshness of Muscle. Agric. Biol. Chem. 1986, 50, 1751–1856. [Google Scholar] [CrossRef]
  19. Nanda, P.K.; Bhattacharya, D.; Das, J.K.; Bandyopadhyay, S.; Ekhlas, D.; Lorenzo, J.M.; Dandapat, P.; Alessandroni, L.; Das, A.K.; Gagaoua, M. Emerging Role of Biosensors and Chemical Indicators to Monitor the Quality and Safety of Meat and Meat Products. Chemosensors 2022, 10, 322. [Google Scholar] [CrossRef]
  20. Bekhit, A.E.-D.A.; Holman, B.W.B.; Giteru, S.G.; Hopkins, D.L. Total volatile basic nitrogen (TVB-N) and its role in meat spoilage: A review. Trends Food Sci. Technol. 2021, 109, 280–302. [Google Scholar] [CrossRef]
  21. Bleicher, J.; Ebner, E.E.; Bak, K.H. Formation and Analysis of Volatile and Odor Compounds in Meat-A Review. Molecules 2022, 27, 6703. [Google Scholar] [CrossRef]
  22. Prabhakar, P.K.; Vatsa, S.; Srivastav, P.P.; Pathak, S.S. A comprehensive review on freshness of fish and assessment: Analytical methods and recent innovations. Food Res. Int. 2020, 133, 109157. [Google Scholar] [CrossRef]
  23. Franceschelli, L.; Berardinelli, A.; Dabbou, S.; Ragni, L.; Tartagni, M. Sensing Technology for Fish Freshness and Safety: A Review. Sensors 2021, 21, 1373. [Google Scholar] [CrossRef] [PubMed]
  24. Sveinsdottir, K.; Martinsdottir, E.; Hyldig, G.; Jorgensen, B.; Kristbergsson, K. Application of Quality Index Method (QIM) Scheme in Shelf-life Study of Farmed Atlantic Salmon (Salmo salar). J. Food Sci. 2002, 67, 1570–1579. [Google Scholar] [CrossRef]
  25. Bakhchova, L.; Jantaree, P.; Gupta, A.; Isermann, B.; Steinmann, U.; Naumann, M. On-a-Chip-Based Sensitive Detection of Drug-Induced Apoptosis in Polarized Gastric Epithelial Cells. ACS Biomater. Sci. Eng. 2021, 7, 5474–5483. [Google Scholar] [CrossRef] [PubMed]
  26. Wang, J.; Bei, J.; Guo, X.; Ding, Y.; Chen, T.; Lu, B.; Wang, Y.; Du, Y.; Yao, Y. Ultrasensitive photoelectrochemical immunosensor for carcinoembryonic antigen detection based on pillar5arene-functionalized Au nanoparticles and hollow PANI hybrid BiOBr heterojunction. Biosens. Bioelectron. 2022, 208, 114220. [Google Scholar] [CrossRef]
  27. Wang, J.; Zhou, L.; Bei, J.; Zhao, Q.; Li, X.; He, J.; Cai, Y.; Chen, T.; Du, Y.; Yao, Y. An enhanced photo-electrochemical sensor constructed from pillar 5arene functionalized Au NPs for ultrasensitive detection of caffeic acid. Talanta 2022, 243, 123322. [Google Scholar] [CrossRef]
  28. Xiong, X.; Tan, Y.; Mubango, E.; Shi, C.; Regenstein, J.M.; Yang, Q.; Hong, H.; Luo, Y. Rapid freshness and survival monitoring biosensors of fish: Progress, challenge, and future perspective. Trends Food Sci. Technol. 2022, 129, 61–73. [Google Scholar] [CrossRef]
  29. Wu, L.; Pu, H.; Sun, D.-W. Novel techniques for evaluating freshness quality attributes of fish: A review of recent developments. Trends Food Sci. Technol. 2019, 83, 259–273. [Google Scholar] [CrossRef]
  30. Nimbkar, S.; Auddy, M.; Manoj, I.; Shanmugasundaram, S. Novel Techniques for Quality Evaluation of Fish: A Review. Food Rev. Int. 2021, 1996, 1–24. [Google Scholar] [CrossRef]
  31. Mustafa, F.; Othman, A.; Andreescu, S. Cerium oxide-based hypoxanthine biosensor for Fish spoilage monitoring. Sens. Actuators B Chem. 2021, 332, 129435. [Google Scholar] [CrossRef]
  32. Wang, G.; Liu, J.; Yue, F.; Shen, Z.; Xu, D.; Fang, H.; Chen, W.; Wang, Z.; Li, P.; Guo, Y.; et al. Dual enzyme electrochemiluminescence sensor based on in situ synthesis of ZIF-67@AgNPs for the detection of IMP in fresh meat. LWT 2022, 165, 113658. [Google Scholar] [CrossRef]
  33. Ghosh, S.; Sarker, D.; Misra, T.N. Development of an amperometric enzyme electrode biosensor for fish freshness detection. Sens. Actuators B Chem. 1998, 53, 58–62. [Google Scholar] [CrossRef]
  34. Gil, L.; Barat, J.M.; Garcia-Breijo, E.; Ibañez, J.; Martínez-Máñez, R.; Soto, J.; Llobet, E.; Brezmes, J.; Aristoy, M.-C.; Toldrá, F. Fish freshness analysis using metallic potentiometric electrodes. Sens. Actuators B Chem. 2008, 131, 362–370. [Google Scholar] [CrossRef]
  35. Hu, S.; Liu, C.-C. Amperometric sensor for fish freshness based on immobilized multi-enzyme modified electrode. Electroanalysis 1997, 9, 1229–1233. [Google Scholar] [CrossRef]
  36. Itoh, D.; Sassa, F.; Nishi, T.; Kani, Y.; Murata, M.; Suzuki, H. Droplet-based microfluidic sensing system for rapid fish freshness determination. Sens. Actuators B Chem. 2012, 171–172, 619–626. [Google Scholar] [CrossRef]
  37. Postmortem ATP Catabolism in Fish Muscle. ATP Breakdown in Post Mortem Muscle. Available online: https://www.novocib.com/ATP_breakdown_salmon.html (accessed on 26 November 2022).
  38. Konoplev, G.; Agafonova, D.; Bakhchova, L.; Mukhin, N.; Kurachkina, M.; Schmidt, M.-P.; Verlov, N.; Sidorov, A.; Oseev, A.; Stepanova, O.; et al. Label-Free Physical Techniques and Methodologies for Proteins Detection in Microfluidic Biosensor Structures. Biomedicines 2022, 10, 207. [Google Scholar] [CrossRef]
  39. Wojnowski, M.; Issakov, V.; Knoblinger, G.; Pressel, K.; Sommer, G.; Weigel, R. High-Q embedded inductors in fan-out eWLB for 6 GHz CMOS VCO. In Proceedings of the 2011 IEEE 61st Electronic Components and Technology Conference (ECTC), Lake Buena Vista, FL, USA, 31 May–3 June 2011; pp. 1363–1370. [Google Scholar] [CrossRef]
  40. Issakov, V.; Wojnowski, M.; Thiede, A.; Weigel, R. Considerations on the de-embedding of differential devices using two-port techniques. Int. J. Microw. Wirel. Technol. 2010, 2, 349–357. [Google Scholar] [CrossRef]
  41. Zur Nedden, S.; Eason, R.; Doney, A.S.; Frenguelli, B.G. An ion-pair reversed-phase HPLC method for determination of fresh tissue adenine nucleotides avoiding freeze-thaw degradation of ATP. Anal. Biochem. 2009, 388, 108–114. [Google Scholar] [CrossRef]
  42. Kuznetsov, A.; Frorip, A.; Korsakov, R.; Korsakov, V.; Püssa, T.; Sünter, A.; Kasvand, N. New Freshness Index, Method and Device to Determine Freshness Status in Fish and Meat According to FAO Recommendations. Available online: https://www.researchgate.net/publication/321213587_New_freshness_index_method_and_device_to_determine_freshness_status_in_fish_and_meat_according_to_FAO_recommendations#fullTextFileContent (accessed on 11 January 2020).
  43. Püssa, T.; Frorip, A.; Kuznetsov, A.; Sünter, A.; Anton, D.; Raudsepp, P. New Freshness Index, Method and Device to Determine Freshness Status of Meat and Fish. Available online: https://www.researchgate.net/publication/326059014_NEW_FRESHNESS_INDEX_METHOD_AND_DEVICE_TO_DETERMINE_FRESHNESS_STATUS_OF_MEAT_AND_FISH (accessed on 11 January 2021).
  44. Walls, D.; Loughran, S.T. Protein Chromatography: Methods and Protocols, 2011th ed.; Humana Press: Totowa, NJ, USA, 2011; p. 681. ISBN 9781607619123. [Google Scholar]
  45. Determann, H. Gel Chromatography, Gel Filtration, Gel Permeation, Molecular Sieves: A Laboratory Hand Book, 2nd ed.; Springer: New York, NY, USA, 1969; p. 208. ISBN 978-3642950841. [Google Scholar]
  46. Kasvand, N.; Frorip, A.; Kuznetsov, A.; Püssa, T.; Rusalepp, L.; Sünter, A. A new approach for evaluation of meat freshness. In Proceedings of the 5th International Conference on Optical Characterization of Materials (OCM 2021), Karlsruhe, Germany, 17–18 March 2021; Beyerer, J., Längle, T., Eds.; KIT Scientific Publishing: Karlsruhe, Germany, 2021; pp. 21–32. [Google Scholar] [CrossRef]
  47. Ciampa, A.; Picone, G.; Laghi, L.; Nikzad, H.; Capozzi, F. Changes in the amino acid composition of Bogue (Boops boops) fish during storage at different temperatures by 1H-NMR spectroscopy. Nutrients 2012, 4, 542–553. [Google Scholar] [CrossRef]
  48. Abramova, L.S.; Kozin, A.V.; Shashkov, A.S. NMR—Spectroscopy technique for salmon fish species quality assessment. Food Syst. 2019, 2, 4–9. [Google Scholar] [CrossRef] [Green Version]
  49. Rodrigues, B.L.; Alvares, T.d.S.; Sampaio, G.S.L.; Cabral, C.C.; Araujo, J.V.A.; Franco, R.M.; Mano, S.B.; Conte Junior, C.A. Influence of vacuum and modified atmosphere packaging in combination with UV-C radiation on the shelf life of rainbow trout (Oncorhynchus mykiss) fillets. Food Control 2016, 60, 596–605. [Google Scholar] [CrossRef] [Green Version]
  50. Shen, S.; Jiang, Y.; Liu, X.; Luo, Y.; Gao, L. Quality assessment of rainbow trout (Oncorhynchus mykiss) fillets during super chilling and chilled storage. J. Food Sci. Technol. 2015, 52, 5204–5211. [Google Scholar] [CrossRef] [Green Version]
  51. Ježek, F.; Buchtová, H. The effect of vacuum packaging on physicochemical changes in rainbow trout (Oncorhynchus mykiss) during cold storage. Acta Vet. Brno 2014, 83, S51–S58. [Google Scholar] [CrossRef] [Green Version]
  52. Quality and Quality Changes in Fresh Fish. Postmortem Changes in Fish. Available online: https://www.fao.org/3/v7180e/V7180e06.htm#5.1%20Sensory%20changes (accessed on 26 November 2022).
  53. Guidelines for the Interpretation of Results of Microbiological Testing of Ready-to-Eat Foods Placed on the Market (Revision 4). Available online: https://www.fsai.ie/food_businesses/micro_criteria/guideline_micro_criteria.html (accessed on 15 November 2022).
  54. Arya, S.S.; Parihar, D.B.; Vijayaraghavan, P.K. Changes in free nucleotides, nucleosides and bases during preparation of pre-cooked dehdyrated minced meats. Nahrung 1979, 23, 495–499. [Google Scholar] [CrossRef]
  55. Rotola-Pukkila, M.K.; Pihlajaviita, S.T.; Kaimainen, M.T.; Hopia, A.I. Concentration of Umami Compounds in Pork Meat and Cooking Juice with Different Cooking Times and Temperatures. J. Food Sci. 2015, 80, C2711–C2716. [Google Scholar] [CrossRef] [PubMed]
  56. Madruga, M.S.; Elmore, J.S.; Oruna-Concha, M.J.; Balagiannis, D.; Mottram, D.S. Determination of some water-soluble aroma precursors in goat meat and their enrolment on flavour profile of goat meat. Food Chem. 2010, 123, 513–520. [Google Scholar] [CrossRef]
  57. Sasaki, K.; Motoyama, M.; Mitsumoto, M. Changes in the amounts of water-soluble umami-related substances in porcine longissimus and biceps femoris muscles during moist heat cooking. Meat Sci. 2007, 77, 167–172. [Google Scholar] [CrossRef]
  58. Cambero, M.I.; Pereira-Lima, C.I.; Ordoez, J.A.; Garca de Fernando, G.D. Beef broth flavour: Relation of components with the flavour developed at different cooking temperatures. J. Sci. Food Agric. 2000, 80, 1519–1528. [Google Scholar] [CrossRef]
  59. Belton, P.S.; Hills, B.P.; Webb, G.A. Advances in Magnetic Resonance in Food Science; Elsevier: Amsterdam, The Netherlands, 1999; ISBN 9781855737730. [Google Scholar]
  60. Lou, X.; Zhai, D.; Yang, H. Changes of metabolite profiles of fish models inoculated with Shewanella baltica during spoilage. Food Control 2021, 123, 107697. [Google Scholar] [CrossRef]
  61. Shumilina, E.; Ciampa, A.; Capozzi, F.; Rustad, T.; Dikiy, A. NMR approach for monitoring post-mortem changes in Atlantic salmon fillets stored at 0 and 4 °C. Food Chem. 2015, 184, 12–22. [Google Scholar] [CrossRef] [Green Version]
  62. Handumrongkul, C.; Silva, J.L. Aerobic Counts, Color and Adenine Nucleotide Changes in CO2 Packed Refrigerated Striped Bass Strips. J. Food Sci. 1994, 59, 67–69. [Google Scholar] [CrossRef]
  63. Jones, N.R.; Murray, J.; Livingston, E.I.; Murray, C.K. Rapid estimations of hypoxanthine concentrations as indices of the freshness of chill-stored fish. J. Sci. Food Agric. 1964, 15, 763–774. [Google Scholar] [CrossRef]
  64. Spinelli, J.; Eklund, M.; Miyauchi, D. Measurement of Hypoxanthine in Fish as a Method of Assessing Freshness. J. Food Sci. 1964, 29, 710–714. [Google Scholar] [CrossRef]
  65. Kyrana, V.R.; Lougovois, V.P.; Valsamis, D.S. Assessment of shelf-life of maricultured gilthead sea bream (Sparus aurata) stored in ice. Int. J. Food Sci. Technol. 1997, 32, 339–347. [Google Scholar] [CrossRef]
  66. Ding, T.; Song, G.; Liu, X.; Xu, M.; Li, Y. Nucleotides as optimal candidates for essential nutrients in living organisms: A review. J. Funct. Foods 2021, 82, 104498. [Google Scholar] [CrossRef]
  67. Carver, J.D. Dietary nucleotides: Effects on the immune and gastrointestinal systems. Acta Paediatr. 1999, 88, 83–88. [Google Scholar] [CrossRef]
  68. Hess, J.R.; Greenberg, N.A. The role of nucleotides in the immune and gastrointestinal systems: Potential clinical applications. Nutr. Clin. Pract. 2012, 27, 281–294. [Google Scholar] [CrossRef]
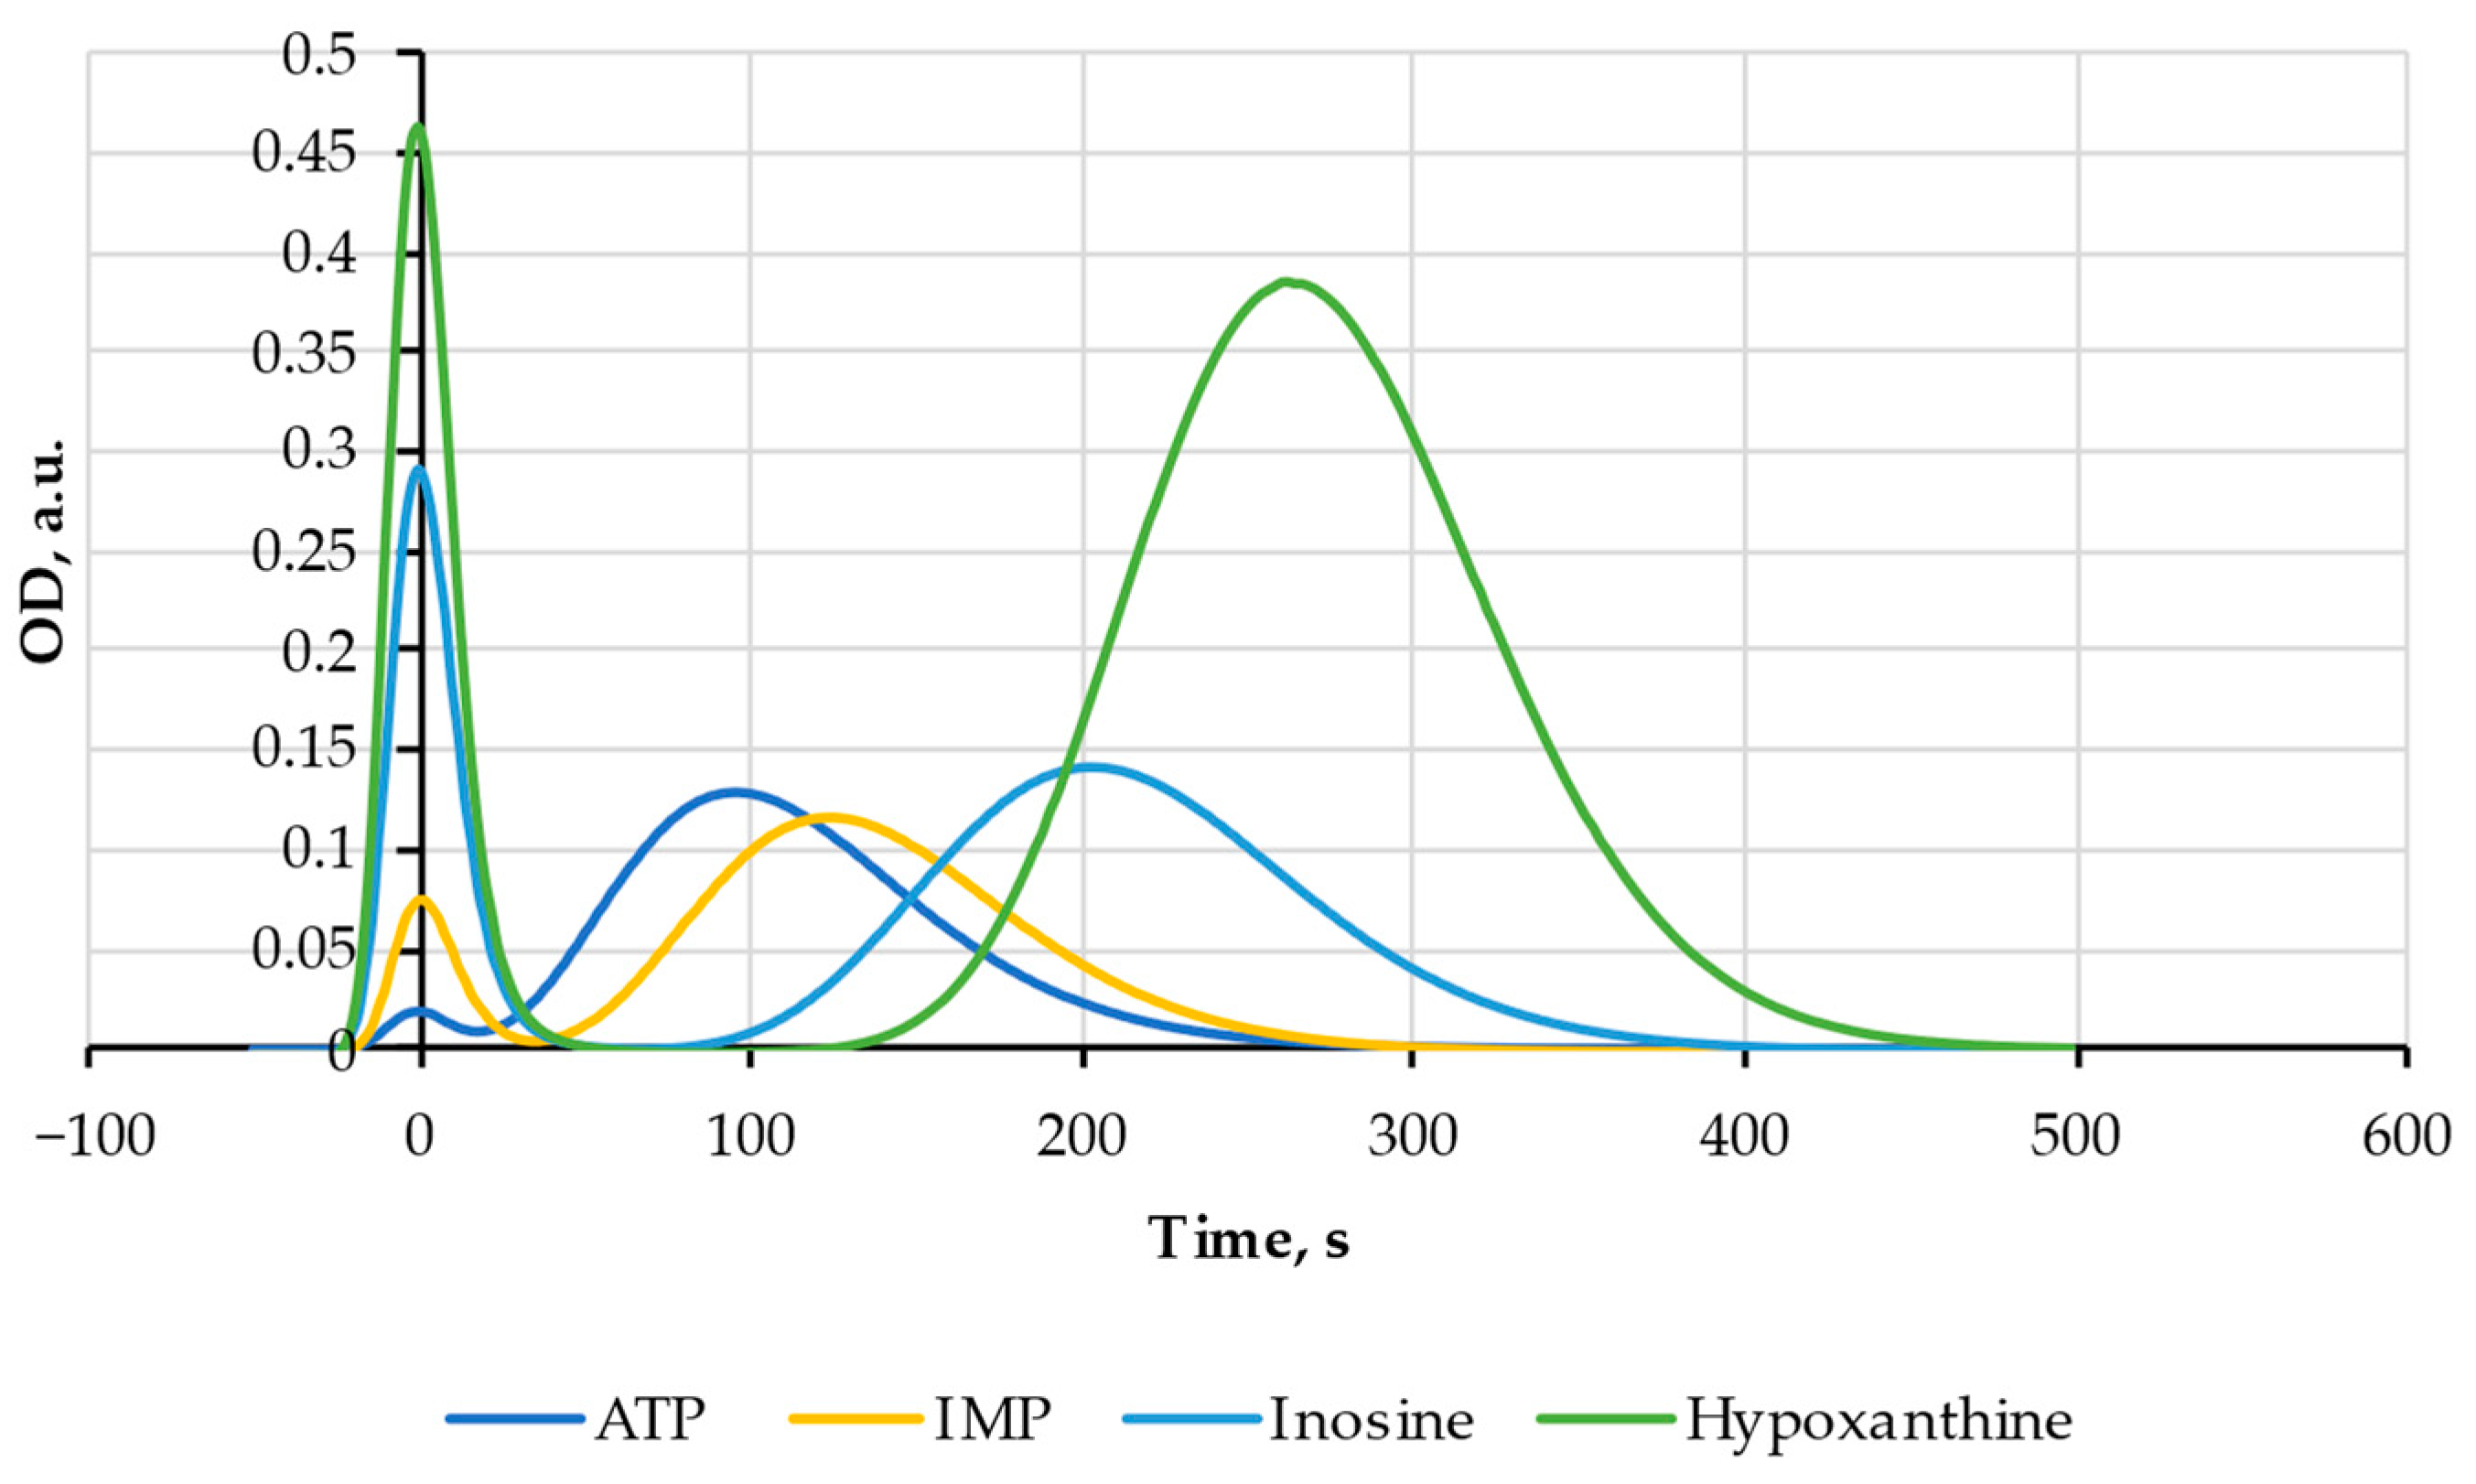
Figure 1. The general principles of the sensor operation: (a) Schematic diagram of the sensor; (b) ATP UV absorption and UV LED emission spectra (1–LabMate buffer reservoir (Code No. 18-3216-03) from GE Healthcare® Bio-Sciences AB (Uppsala, Sweden); 2–PD-10 column; 3–three-way valve; 4–service port; 5–UV LED; 6–flow cell; 7–flow rate regulator; 8–drain vessel; 9–photodetector; 10–electronic unit, 11–laptop PC).
Chemosensors 11 00069 g001
Figure 2. The photo of the sensor.
Chemosensors 11 00069 g002
Figure 3. Comparison of two FPMLC chromatograms obtained on days 1 and 9 of a horse meat sample storage.
Chemosensors 11 00069 g003
Figure 4. FPLMC sensor calibration with BSA and the nutritional nucleotides and nucleosides standards.
Chemosensors 11 00069 g004
Figure 5. Correlation between the index H* and the index Time for raw (a) and cooked (b) minced pork stored or previously stored aerobically.
Chemosensors 11 00069 g005
Figure 6. Averaged index Time obtained with FPMLC device and TVB-N content values for farmed trout during storage.
Chemosensors 11 00069 g006
Figure 7. Temporal change of the index Time obtained with FPMLC device and VFA content during storage of minced pork at +4 °C under aerobic conditions.
Chemosensors 11 00069 g007
Figure 8. Chromatograms of Alaska Pollock samples before (Raw) and after (Steam) cooking at 100 °C for 60 min, and difference of the two chromatograms (Steam–Raw).
Chemosensors 11 00069 g008
Figure 9. The low-field region of 1H NMR spectra of Alaska Pollock samples: (a) before thermal treatment, (b) after steam cooking at 100 °C for 60 min, and (c) after steam cooking with added IMP and Ino.
Chemosensors 11 00069 g009
Figure 10. Comparison of UN FAO Quality Score curve and mean values of Time obtained with a number of fish and meat samples stored aerobically at +2–4 °C. Phase 1: The fish is very fresh and has a sweet, algal, and delicate taste. The taste can be very slightly metallic; Phase 2: There is a loss of the characteristic odor and taste. The flesh becomes neutral but has no off-flavors. The texture is still pleasant; Phase 3: There is sign of spoilage and a range of volatile, unpleasant-smelling substances is produced, depending on the fish species and type of spoilage (aerobic or anaerobic); Phase 4: The fish can be characterized as spoiled and putrid [52].
Chemosensors 11 00069 g010
Table 1. Elution times of the main nutritional nucleotides and nucleosides.
SubstanceMolecular Weight, Da Elution Time, s
ATP50795
IMP348130
Ino268200
Hx136275
Table 2. Decrease in the Time index values for various fish species after 15–60 min of steam cooking at 100 °C.
Fish SpecieΔTime, s Note
Alaska pollack−21
Pangasius−17
Norway haddock−18Two peaks at 130 and 260 s emerged after treatment
Wolffish−37Unstable shifts of the broad band ±10 s
Hake−30
Table 3. Correlation between the consumer properties of meat and fish, Time and H* indices, and bacterial contamination CFU/g.
CFU/g
Unsterile Pork,
Trout
Initial
pH 5.5–5.8
Time, sIndex KIndex H*Characteristic and
Accordance
to FAO Phases
ObjectsSuits forSome Other
Characteristics
1<130 <0.3H* < 0.1Absolutely fresh
Phase 1
All rapidly frozen fish or meatMany purposes. Aging can be neededQuickly (in hours) ending condition
in fridge at +4 °C
3 × 10³ ÷ 104130÷1600.3 < K < 0.50.1 < H* < 0.2Fresh
Phase 2
High quality meat and fishHaute cuisine Rich in endogenous IMP; no need for artificial E630
≥104 ÷ 105160÷1900.5 < K < 0.750.2 < H* < 0.45Rather fresh
Status
“Use before”
The first half of
Phase 3
Stored or thawed meat and fishOrdinary
consumption
Often coincides with end of bacterial lag phase
≥105 ÷ 107 2190 ÷210K ≈ 0.8H* ≈ 0.5Start or middle point of exponential bacterial growth
Ending of Phase 3
Can be all kinds of samplesStandard
shelf-life end
May be in quickly changing
condition
≥107 ÷ 108210÷2400.8 < K < 0.950.8 < H*≈ 0.9Heavy contamination but may not be spoiled
irreversibly
Overlapping of
Phases 3 and 4
Often reduced-price foods or aged meat Intense temperature treatment neededBacterial stationary phase: oscillating contamination and crash
˃108˃240K ≈ 11 ≈ H*˃˃1Phase 4SpoiledRejectionSmell, bad
appearance
1 Not counted. 2 Contamination level 107 is often called “Borderline” (see, e.g., [53]).
Disclaimer/Publisher’s Note: The statements, opinions and data contained in all publications are solely those of the individual author(s) and contributor(s) and not of MDPI and/or the editor(s). MDPI and/or the editor(s) disclaim responsibility for any injury to people or property resulting from any ideas, methods, instructions or products referred to in the content.

