Article

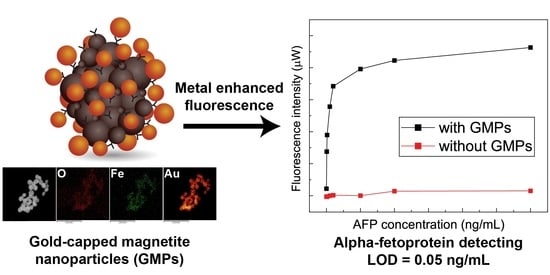
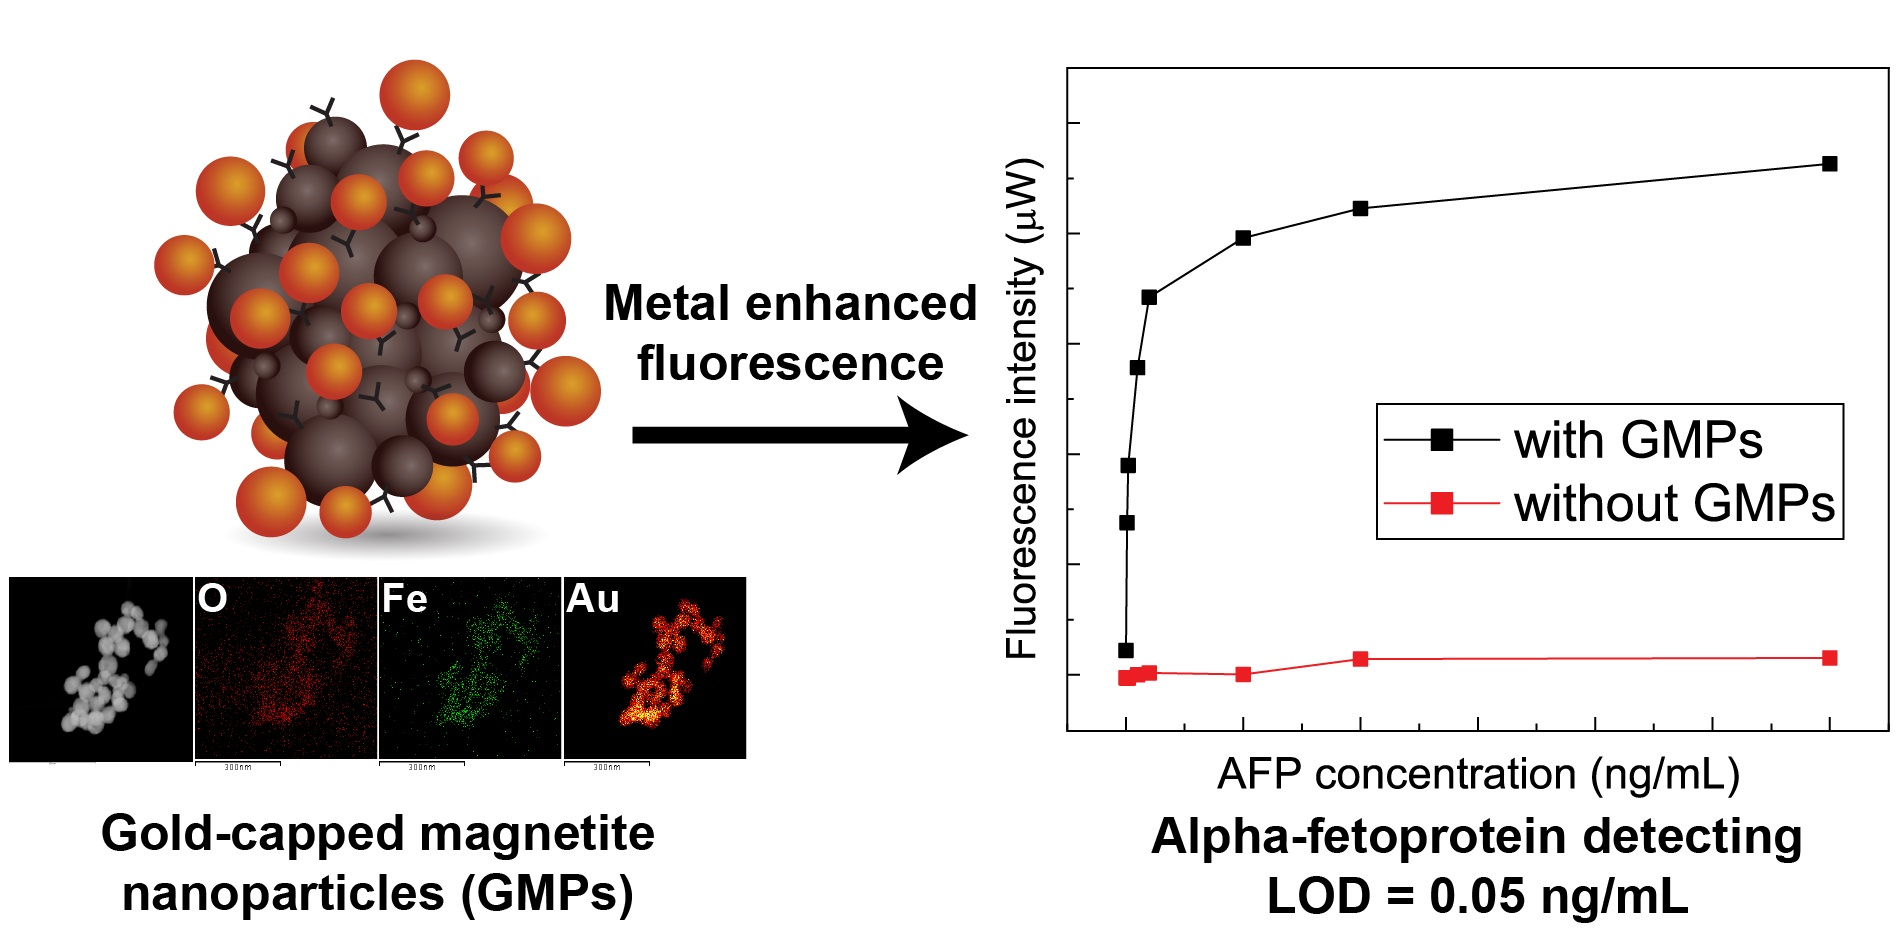
Metal-Enhanced Fluorescence for Alpha-Fetoprotein Detection and for SERS Using Hybrid Nanoparticles of Magnetic Cluster Core—Plasmonic Shell Composite

1
Faculty of Materials Science and Technology, University of Science, Ho Chi Minh City 700000, Vietnam
2
Vietnam National University, Ho Chi Minh City 700000, Vietnam
3
Department of Information Communication, Materials, and Chemistry Convergence Technology, Soongsil University, Seoul 06978, Republic of Korea
4
Institute of Materials Science, Vietnam Academy of Science and Technology, Hanoi 100000, Vietnam
*
Author to whom correspondence should be addressed.
These authors contributed equally to this work.
Chemosensors 2023, 11(1), 56; https://doi.org/10.3390/chemosensors11010056
Submission received: 20 November 2022 / Revised: 25 December 2022 / Accepted: 8 January 2023 / Published: 9 January 2023
(This article belongs to the Special Issue Novel Materials for Sensing, Imaging and Energy Conversion/Storage)

Abstract

:
We demonstrated that the hybrid core–shell nanostructure of Fe3O4 (core) and gold (shell) could be a good substrate candidate both for metal-enhanced fluorescence (MEF) and surface-enhanced Raman spectroscopy (SERS). The magnetic properties of the core material could provide functionalities such as the magnetically induced aggregation/distribution of nanostructures to increase the hot-spot density, while the nano-thickness gold shell allows for the plasmonic enhancement of both fluorescence and SERS. The gold-capped magnetic (Fe3O4) nanoparticles (GMPs) were facilely synthesized using a newly developed chemical method. The relative molar ratio of the constituent materials of the core–shell composite was optimized for tuning the plasmonic resonance wavelengths for MEF and SERS. We employed GMP-based MEF to detect alpha-fetoprotein (AFP), with concentrations ranging from 0.05 to 1000 ng/mL, and obtained a limit of detection (LOD) as low as 3.8 × 10⁻⁴ ng/mL. The signal enhancement factor (EF) in the GMP-based MEF was 1.5 at maximum. In addition, the GMPs were used in SERS to detect rhodamine B (RhB). Its LOD was 3.5 × 10⁻¹² M, and the EF was estimated to be about 2 × 10⁸. The hybrid core–shell nanoparticles could find potential applications in diagnostic assays based on MEF and SERS in various fields such as food verification, environmental testing/monitoring, and disease diagnosis.

Graphical Abstract

1. Introduction

Fluorescence spectroscopy is a promising tool for biomedical diagnosis applications due to advantages such as its high sensitivity, specificity, rapid detection, relative simplicity in operation, and emission wavelength tuneability, making it suitable for multichannel analysis [1,2,3]. However, a few drawbacks inherent to typical fluorophores, i.e., organic dyes, such as the limited quantum yield, photobleaching, and autofluorescence, remain challenges [4]. These problems would hinder the photostable operation and ultrasensitivity required for trustworthy biomedical diagnosis [5]. Metal-enhanced fluorescence (MEF) with metal nanostructures is one of the solutions to circumvent the limitations of fluorescent dyes [6]. Metal-nanostructure-supported plasmons can interact with proximal fluorophores, resulting in an increased quantum yield with improved photostability at an optimal 5–90 nm distance [7]. Plasmonic nanostructures that can support either surface plasmon polaritons or localized surface plasmon resonance (LSPR) have been gaining continuous attention from researchers to develop fluorescence-based sensor platforms with ultrahigh sensitivity and photostability. Monometallic nanostructures, such as those of Ag or Au, have been used to amplify fluorescence signals with reduced photobleaching. For instance, Xiaofan Ji and his associates used the Ag zigzag nanorod structures fabricated through oblique angle deposition to obtain a 28-fold enhancement of the fluorescence signal from Alexa 488 for detecting 0.01 pM DNA [8]. Camposeo and co-workers reported a maximum seven-fold enhancement of fluorescence using a Au nanocage in the near-infrared wavelengths [9]. Another fluorescent probe, such as a semiconductor (ZnSe) quantum dot, could also benefit from MEF upon its combining with gold nanoparticles (Au NPs) into a composite structure [10]. Kalar A. et al. reported the MEF of a 20-fold enhancement of fluorescence from rhodamine 800 using Ag core–SiO2 shell nanocomposites [11].
The use of Au nanostructures is beneficial for biomedical applications due to numerous merits, including biocompatibility, chemical stability, and characteristic plasmonic properties [12]. The Au surface can also enable the chemical binding of biological and drug molecules through the thiol (-SH) or amine (-NH2) groups [13].
Fe3O4 NPs are nanostructures that are widely used for hyperthermia therapy, photodynamic therapy, and targeted drug delivery due to the features of good dispersibility in liquid, low toxicity, biocompatibility, photocatalytic/photo-Fenton effects, and size-dependent tuneability from ferromagnetism to super-paramagnetism [14,15,16].
Combining Fe3O4 NPs and Au NPs into hybrid magnetic nanoclusters (HMNCs) has been used for MEF [17]. HMNCs consist of six to eight Au NPs attached to a silane-modified Fe3O4 NP. Fluorescein-isothiocyanate-tagged DNA-HMNCs conjugates are formed, and thus their fluorescence is controlled by DNA hybridization, which induces a change in the fluorophore–Au NP distance.
In this work, we fabricated a heterogeneous nanocomposite Fe3O4 core–Ag shell structure for MEF and SERS. These gold-capped magnetic (Fe3O4) nanoparticles (GMPs) could produce magnetically induced aggregates/distribution [18]. This resulted in an effectively increased density of hot-spots at nanogaps between two adjacent GMPs where analyte molecules were positioned for SERS [19,20,21,22]. Meanwhile, the Au shell supported plasmon excitations to support MEF and SERS. The core–shell ratio governed the LSPR wavelengths, determining the pump light wavelengths. These magnetic core–shell nanocomposites could be easily re-collected for recycling from a liquid medium using external magnets. In addition, the hybrid nanocomposite-bonded substrate could be reused after washing away alpha-fetoprotein (AFP).
We demonstrated that GMP-based SERS can detect RhB. Its LOD was 3.5 × 10⁻¹² M, and the EF was estimated to be about 2 × 10⁸, proving that the GMP-based substrate was a good candidate for SERS.
We also applied the GMPs to the MEF-based detection of AFP, which is the special plasma protein found in the human fetus and one of the widely used tumor markers for the clinical diagnosis of hepatocellular carcinoma and germ cell tumors. The AFP level in healthy human serum is 5–8 ng/mL, while that in the serum of most liver cancer patients rises to about 400 ng/mL [23,24]. Diverse technologies for AFP detection have been reported, including fluorescence spectroscopy, chemiluminescence, electrochemiluminescence, enzyme-linked immunosorbent assay, surface plasmon polaritons, electrochemical immunosensors, and photoelectrochemical sensing [25,26,27,28,29,30,31,32]. We, however, focused on MEF techniques with the GMPs for ultrahigh sensitivity with photostability using AFP concentrations ranging from 0.05 ng/mL to 1000 ng/mL in phosphate-buffered saline (PBS). We used a sandwich immunoassay with a fluorescent tag of Alexa Fluor-488 for the MEF and rhodamine B (RhB) for the SERS. We obtained a fluorescence enhancement of up to 1.5-fold, leading to an AFP limit of detection (LOD) of 3.8 × 10⁻⁴ ng/mL, with a coefficient of variation (CV) < 1%, demonstrating that the AFP assay has high sensitivity and good reproducibility.

2. Materials and Methods

2.1. The Materials and Reagents

Gold (III) chloride trihydrate (HAuCl4.3H2O, 99%), sodium citrate tribasic dihydrate (Na3Ctr, 99%), (3-Aminopropyl) triethoxysilane (APTES, 99%), ammonium hydroxide solution (NH4OH, 28.0–30.0% NH3 basic), and iron (II) chloride tetrahydrate (FeCl2.4H2O, 99.9%) were purchased from Sigma-Aldrich (St. Louis, MO, USA). Iron (III) chloride hexahydrate (FeCl3.6H2O, 99.9%) was purchased from Acros Organics (Geel, Belgium). Ethanol (EtOH, 99.5%) and methanol (MeOH, 99.5%) were provided by Fisher (Boston, MA, USA). Deionized (DI) water (via Thermo Scientific Easypure II (Uppsala, Sweden) used in this study was produced at the Center for Innovative Materials and Architectures (INOMAR), Vietnam National University, Ho Chi Minh City (VNUHCM). Polydimethylsiloxane (PDMS) was made using a SYLGARD™ 184 Silicone Elastomer kit, including a base and a curing agent purchased from Dow Corning Co (Midland, MI, USA). Purified human AFP was produced by Bio-Rad Laboratories (CA, USA). Bovine serum albumin (BSA) and phosphate-buffered saline (PBS)—a buffer solution—were purchased from Sigma-Aldrich (St. Louis, MO, USA). An anti-alpha Fetoprotein antibody (primary antibody) was purchased from Abcam corp (English), and a rabbit IgG (H+L) cross-adsorbed antibody (secondary antibody, A-11008) was provided by Thermo Fisher Scientific (Waltham, MA, USA). These biological agents were diluted in PBS and kept at the proper temperature, e.g., at −20 °C and 4 °C before and after dilution, respectively. The substrates were formed on microscope glass slides provided by ISOLAB Laborgeräte GmbH (Eschau, Germany) (chemical components by weight percent: SiO2 = 75; Na2O = 15; CaO + MgO + Al2O3 = 10).

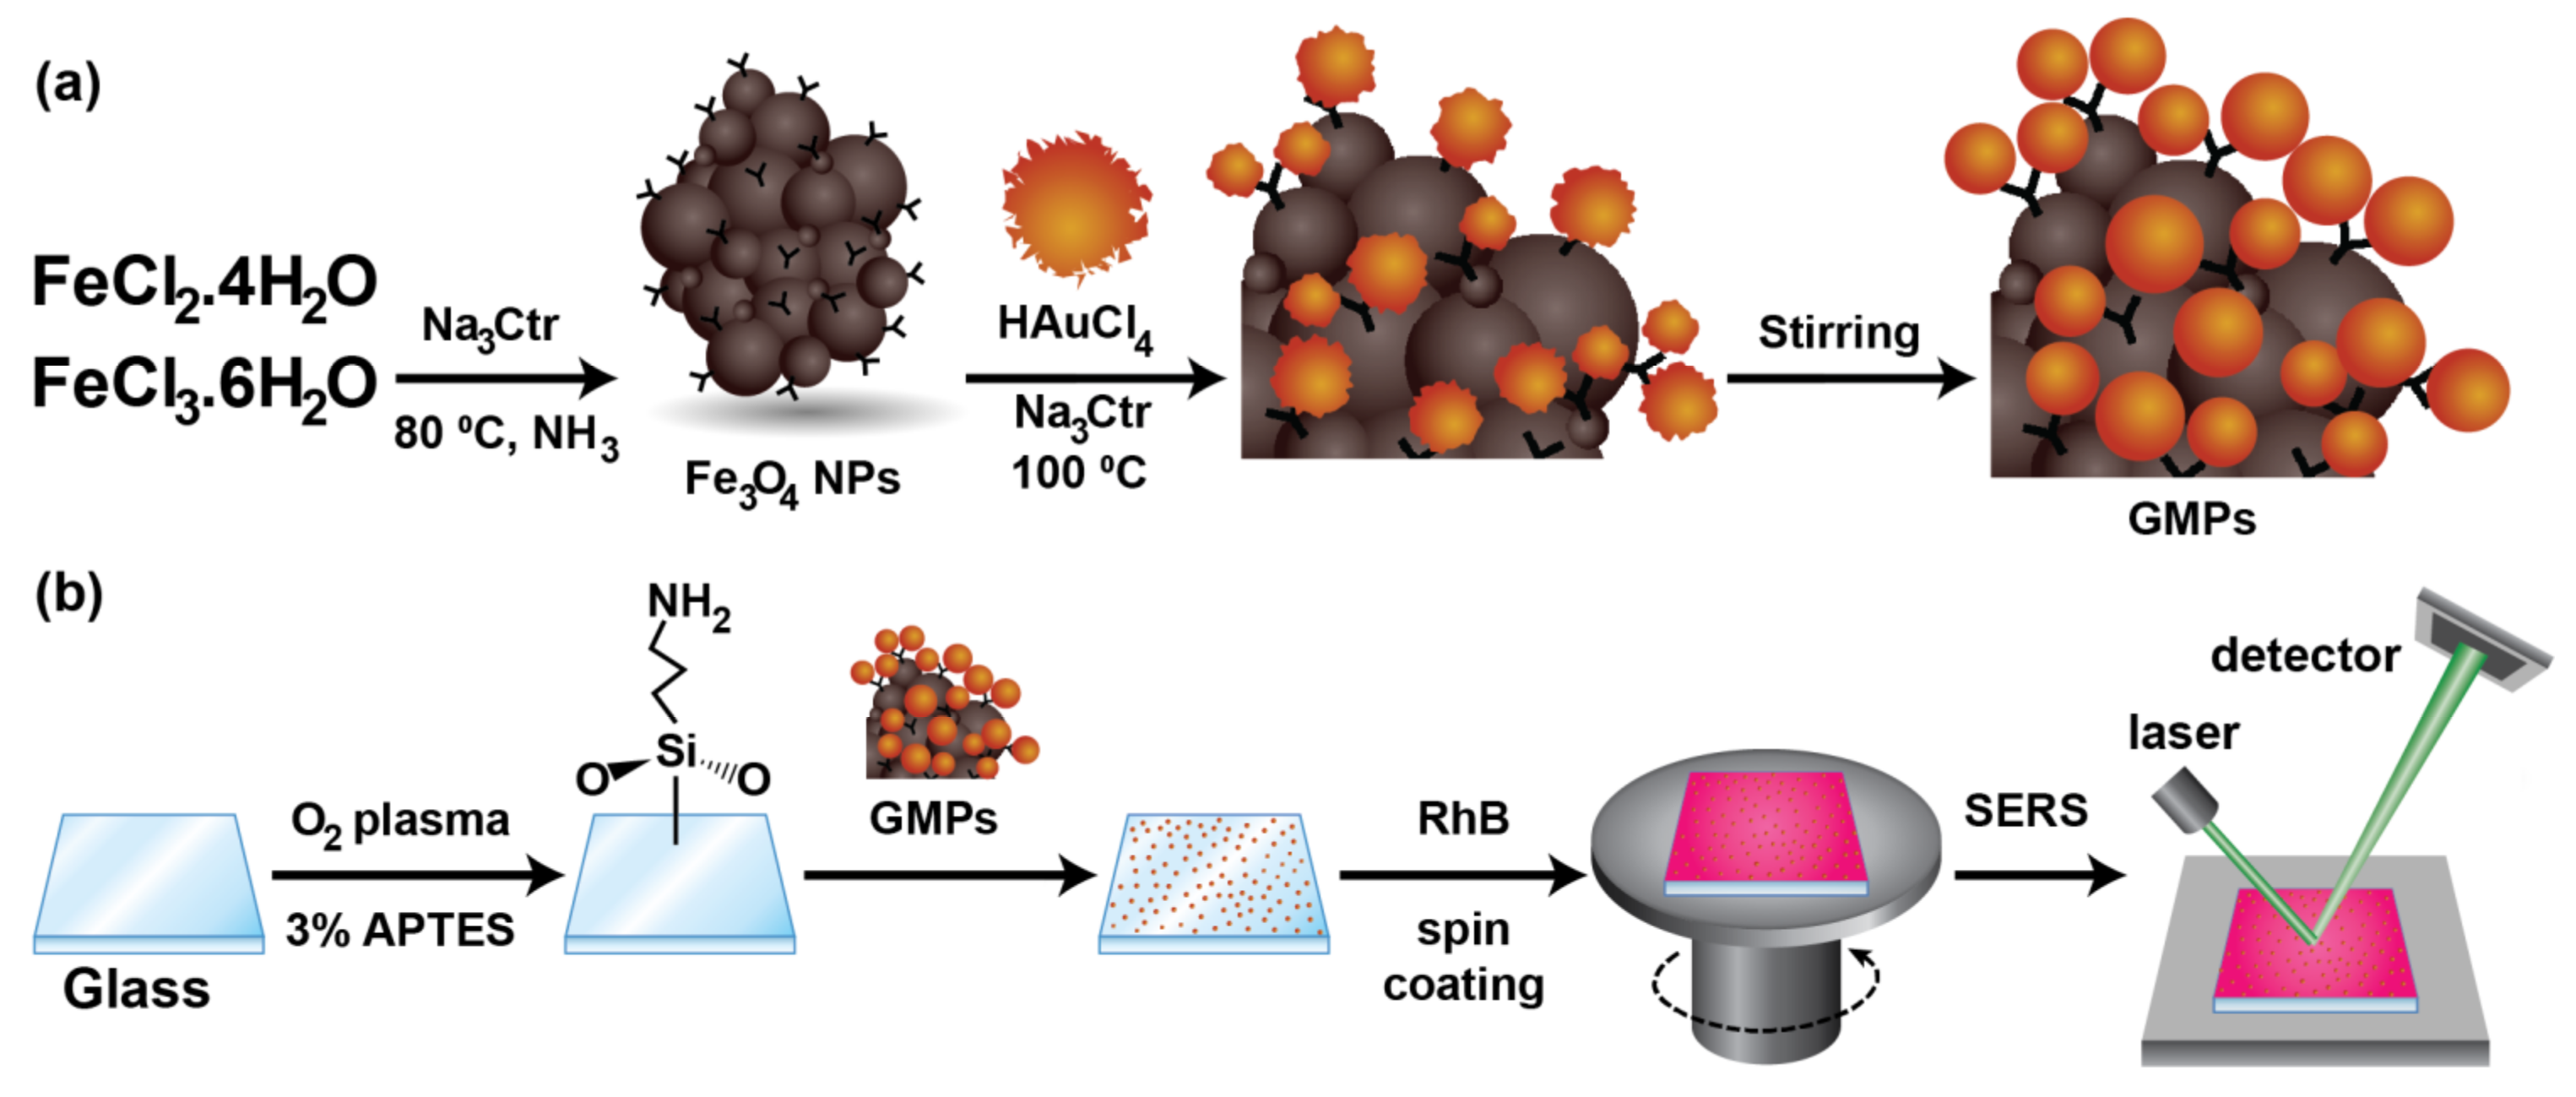
2.2. Synthesis of the Fe3O4 NPs and the Gold-Capped Fe3O4 Nanoparticles (GMPs)

2.2.1. Synthesis of the Fe3O4 NPs

The synthesis process was delineated as shown in Figure 1a. A mixture of FeCl2 and FeCl3 was dissolved in DI water at concentrations of 4.43 and 2.76 wt%/wt%, respectively. The solution was stirred and heated to 80 °C in a sonication bath. Then, 5 mL of a NH4OH solution (28.0–30.0% NH3 basic) was added to the round-bottom flask. Ten minutes later, 5 mL of a Na3Ctr 3 M solution was slowly added to the mixture and heated for another 30 min. The reactor was cooled to room temperature without sonication while mechanical stirring continued. The black precipitate, which was the magnetic nanoparticles (Fe3O4 NPs), was obtained using a permanent magnet while rinsing with water and ethanol several times. It was dried completely at 80 °C and dissolved in different concentrations, such as 10−4, 10−5, and 10−6 M, for further use.

2.2.2. Synthesis of the GMPs

First, 6.67 mL of 0.5 mM HAuCl4 was stirred and heated to 100 °C. A mixture of 5 mL of prepared Fe3O4 NP solution and 0.3 mL of 38.8 mM NaCtr was quickly added to the flask. After 15 min, heating was stopped, while mechanical stirring continued until the reactor was cooled to room temperature. The GMPs were obtained and stored in darkness at 4 °C. The molar ratios between the Fe3O4 NPs and Au NPs for the GMPs were 3:20, 3:200, and 3:2000.

2.3. Detection of Rhodamine B by Surface-Enhanced Raman Spectroscopy (SERS)

Clean glass substrates were modified in O2 plasma (by the CUTE plasma cleaner, Femto Science Inc., Gyeonggi, Korea) and 3% APTES in ethanol to form a rich amine-modified surface, as shown in Figure 1b. Immediately, these slides were immersed in the GMP solution for 16 h for the immobilization of GMPs to the surface due to electrostatic attraction while avoiding light at room temperature (27 °C) [33]. The RhB was then spin-coated for loops of 1 min at 500 rpm and 30 s at 1000 rpm, as illustrated in Figure 1b. For the SER measurement, we used a Raman microscope with a liquid-nitrogen-cooled CCD detector and its holographic notch filter (One Raman microscope, HORIBA XploRA, HORIBA Ltd. Japan). The excitation wavelength of light was 532 nm with a threshold power of 1 mW, illuminating a sample for 10 s, while data were collected for 60 s per detection pot.

2.4. Preparation of PDMS Chamber on the Glass Substrate

PDMS is known as a macromolecular organosilicon compound with inert and non-toxic properties. The SYLGARD™ 184 Silicone Elastomer kit contained two chemicals: a base (part A) and a curing agent (part B). They were mixed at a 10:1 mass ratio. After the blend was thoroughly mixed, air bubbles were removed from the mixture using a vacuum machine. Thereafter, it was heated to 70 °C into a solid and then shaped with a paper knife. To fabricate the reaction chamber, the PDMS pattern was bonded with the surface of another glass substrate using an oxygen plasma treatment [34]. The chamber defined the area wherein the chemical reaction associated with the GMPs and the immunoreaction took place.

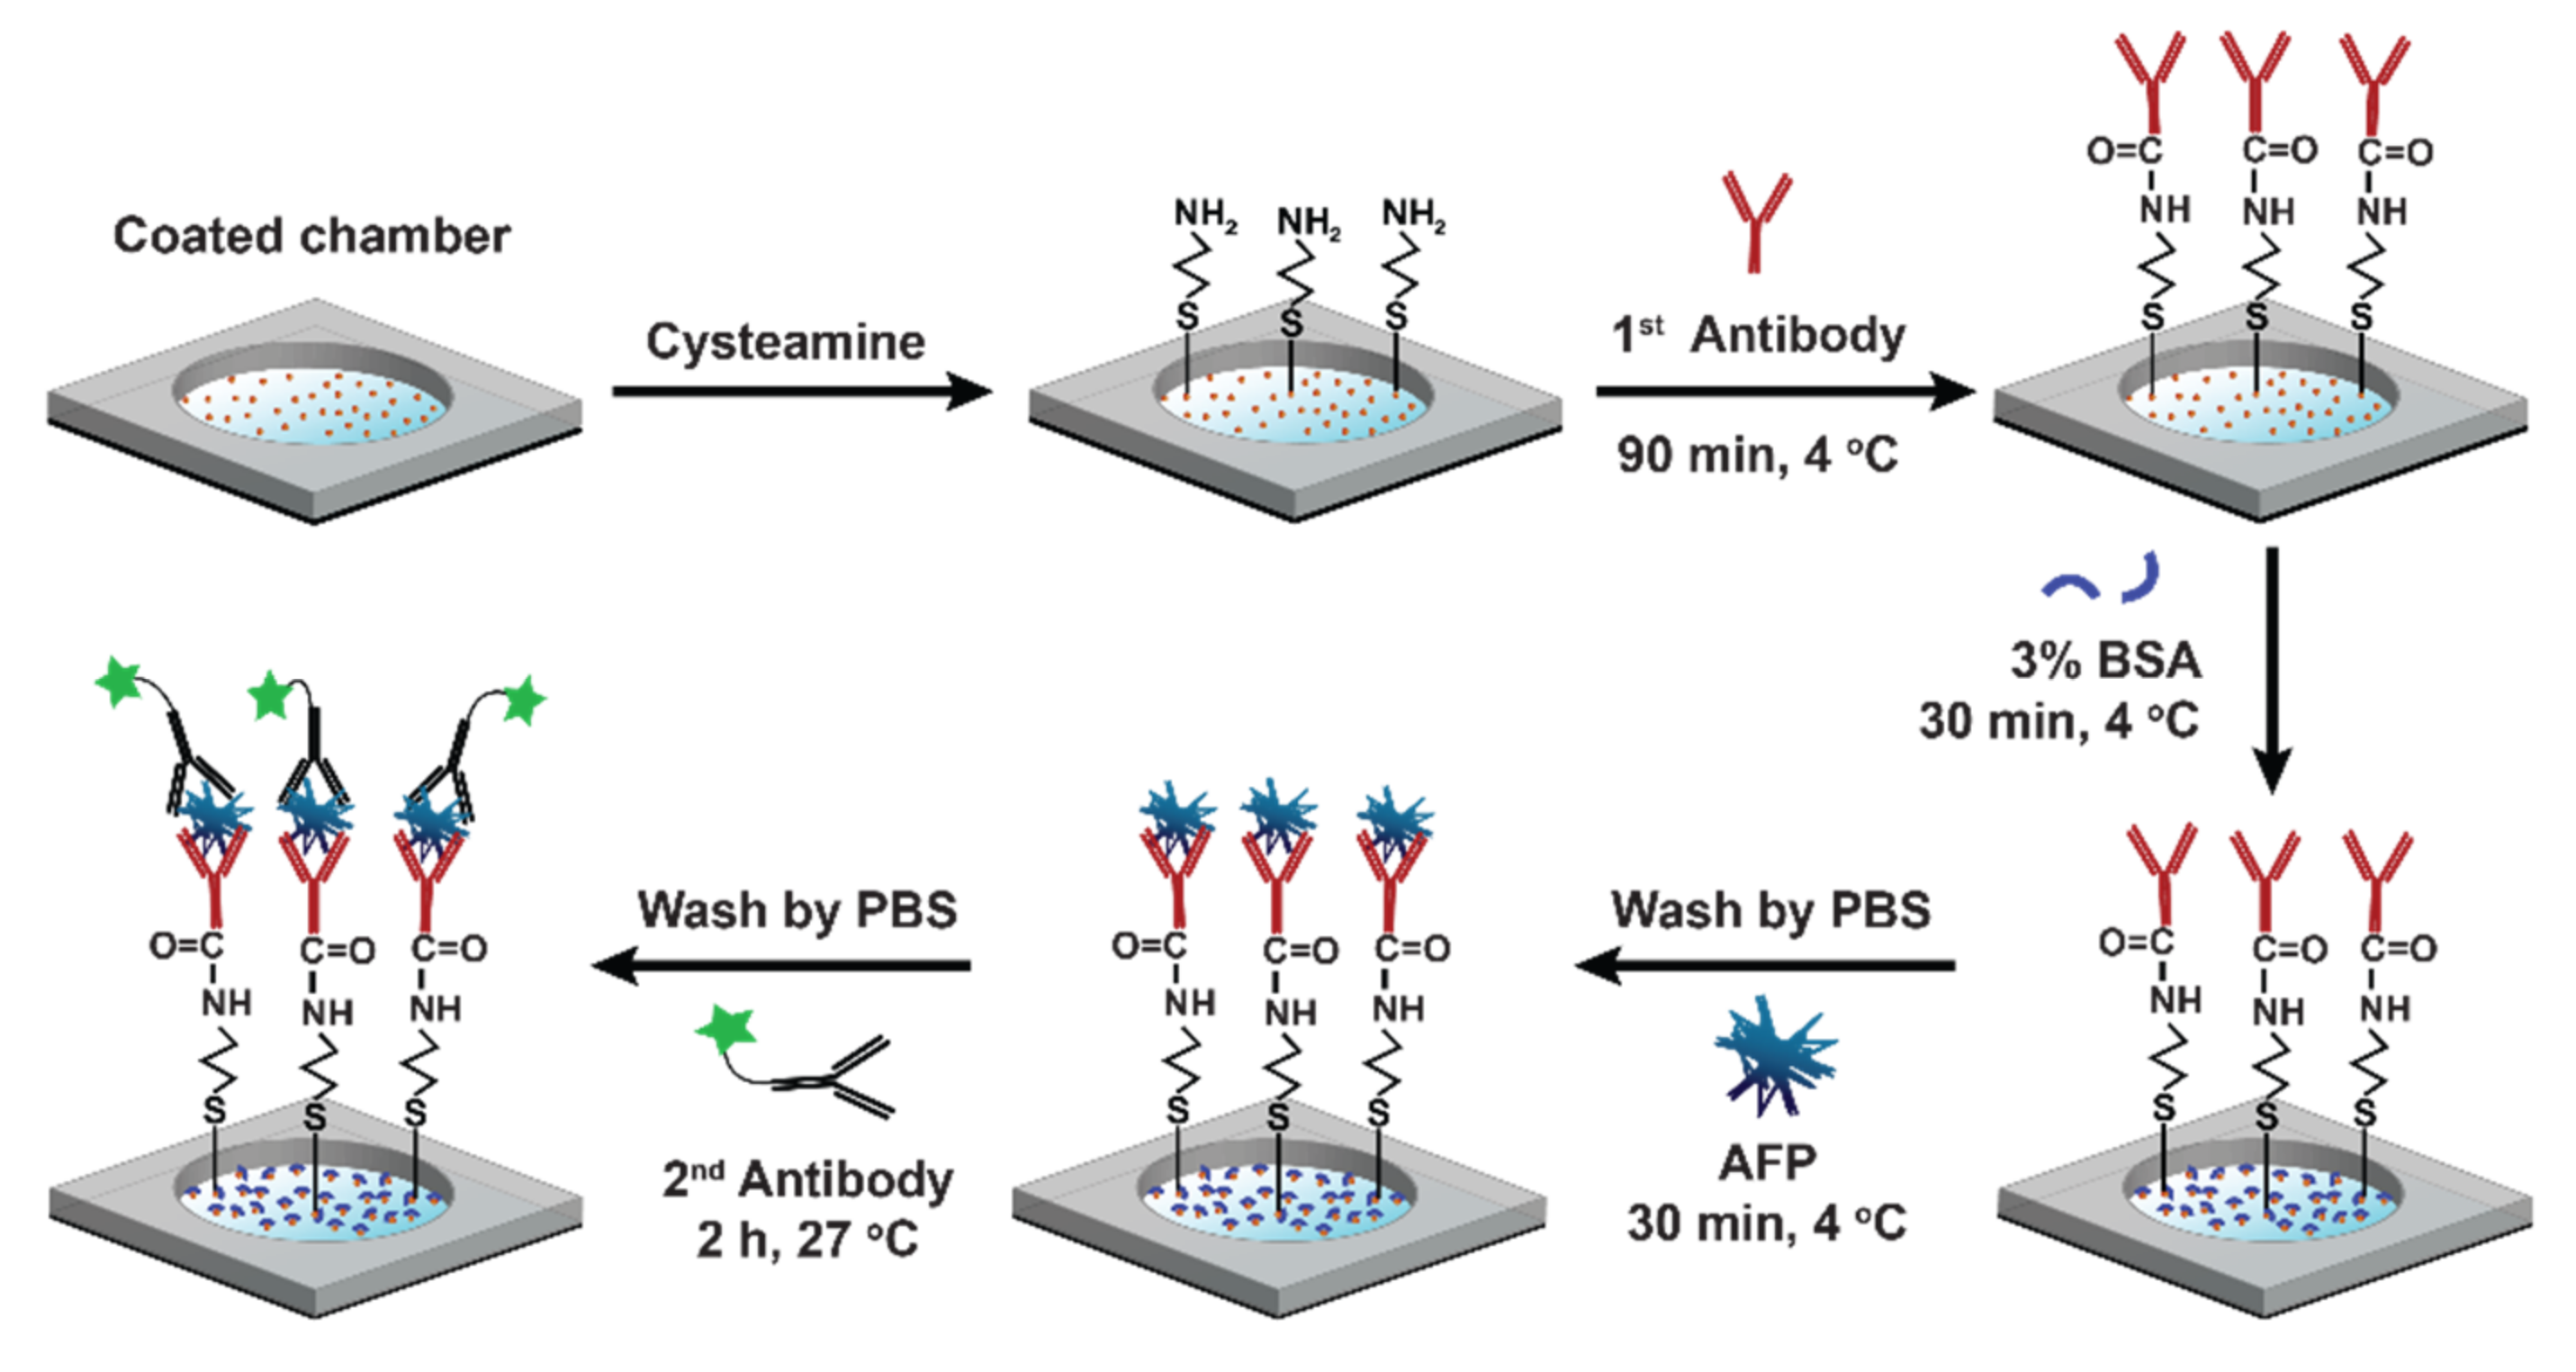
2.5. Detection of Alpha-Fetoprotein (AFP) by Transmission-Geometry-Based Setup for Fluorescence Enhancement Detection

An optical setup with a transmission geometry (T-mode) that was previously used was selected for fluorescence enhancement [35]. A light-emitting diode (LED) was used as a light source that was collimated using an aspheric cylindrical lens. The light was then passed through a spectral filter centered at 470 nm (M470L3-C1, Thorlabs) called an excitation filter (EXF), which only allowed light transmittance around the wavelength of 470 for exciting Alexa 488. An iris was placed before the sample surface to form a circular illumination area with a 1 cm diameter within the chamber.
For the MEF-based AFP detection, we immobilized the GMPs on the surface of the chamber bottom, as described above. A 10 mM cysteamine solution was added to the chamber, and it was subsequently kept at room temperature for 2 h to develop amine groups on the surfaces of the GMPs. Then, the primary antibodies (0.1 μg/mL, 100 μL) were incubated on the amine-modified surface for 90 min at 4 °C. The surface was washed with PBS to remove the unbound primary antibodies. Then, 100 μL of BSA solution (0.1 wt%) was added for 30 min to eliminate nonspecific binding sites. After additional PBS washing, 100 μL of AFP with varying concentrations was incubated on the surface of the chamber for 30 min. Finally, the secondary antibodies conjugated with Alexa 488 (100 μL, 2 μg/mL) were added to the chamber surface, keeping them for 1 h at 27 °C. The surface was washed again with PBS, making it ready for MEF measurement. A schematic of the AFP immunosensor fabrication is depicted in Figure 2.

3. Results and Discussion

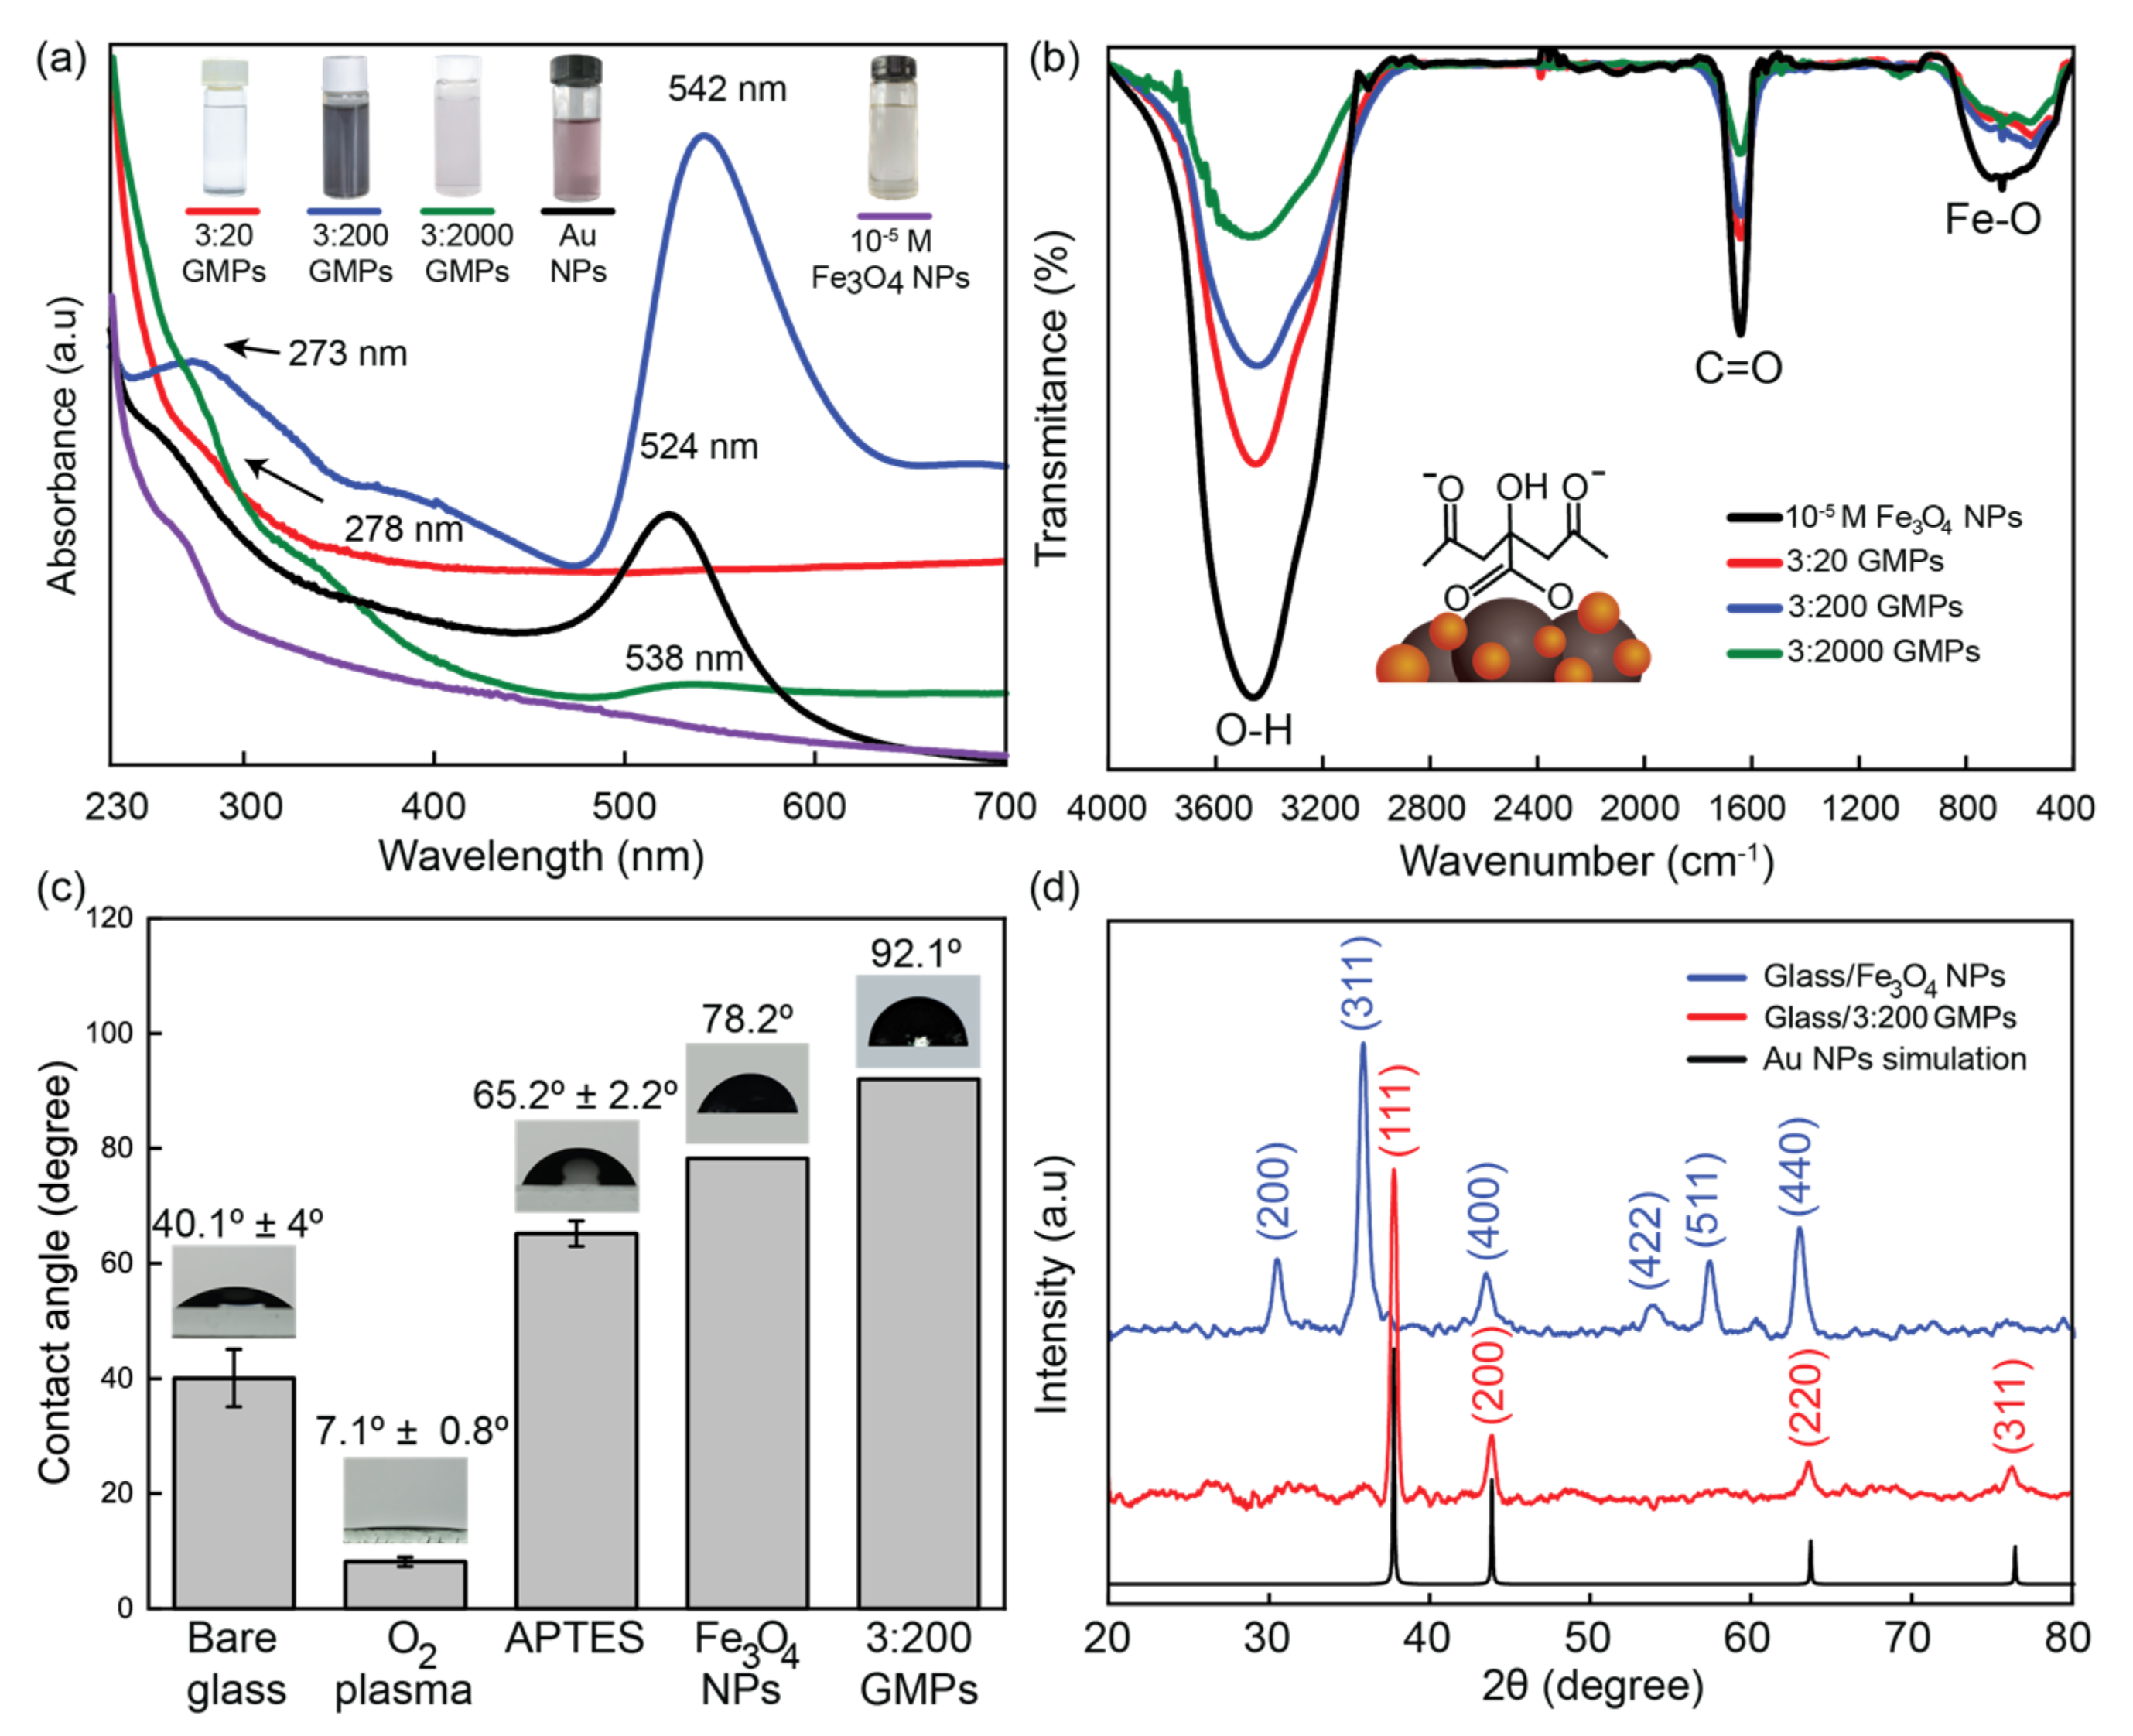
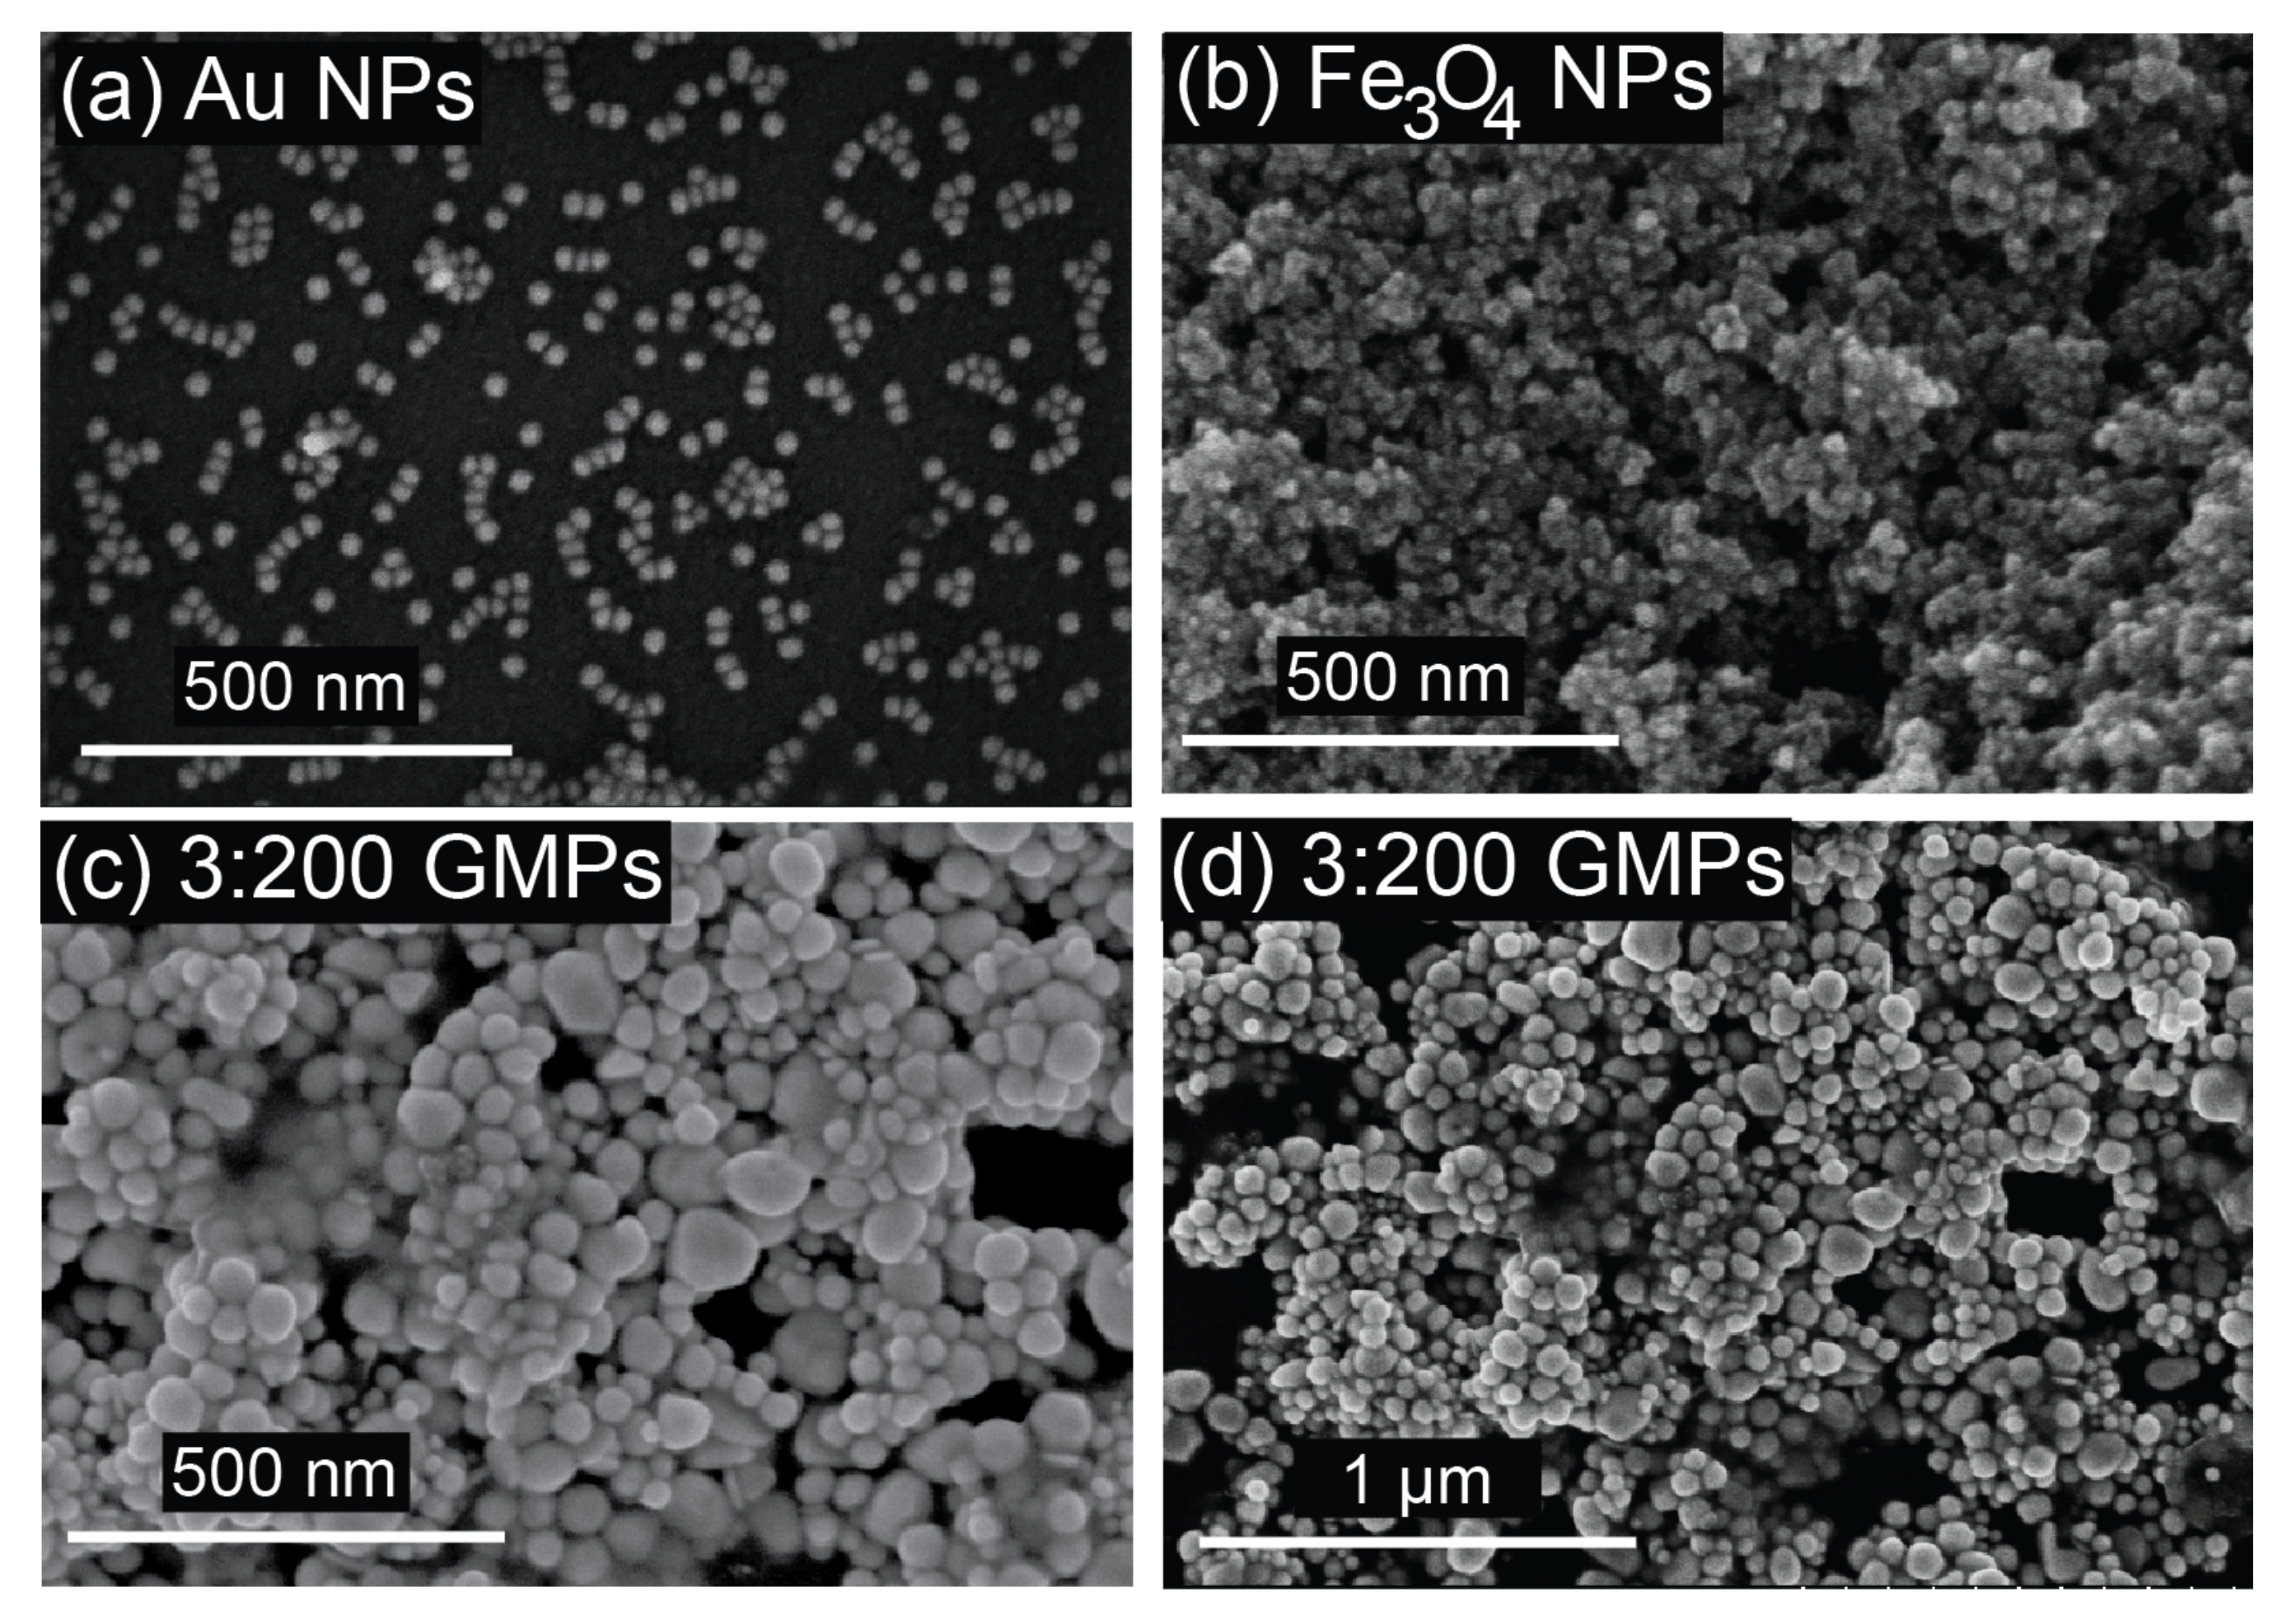
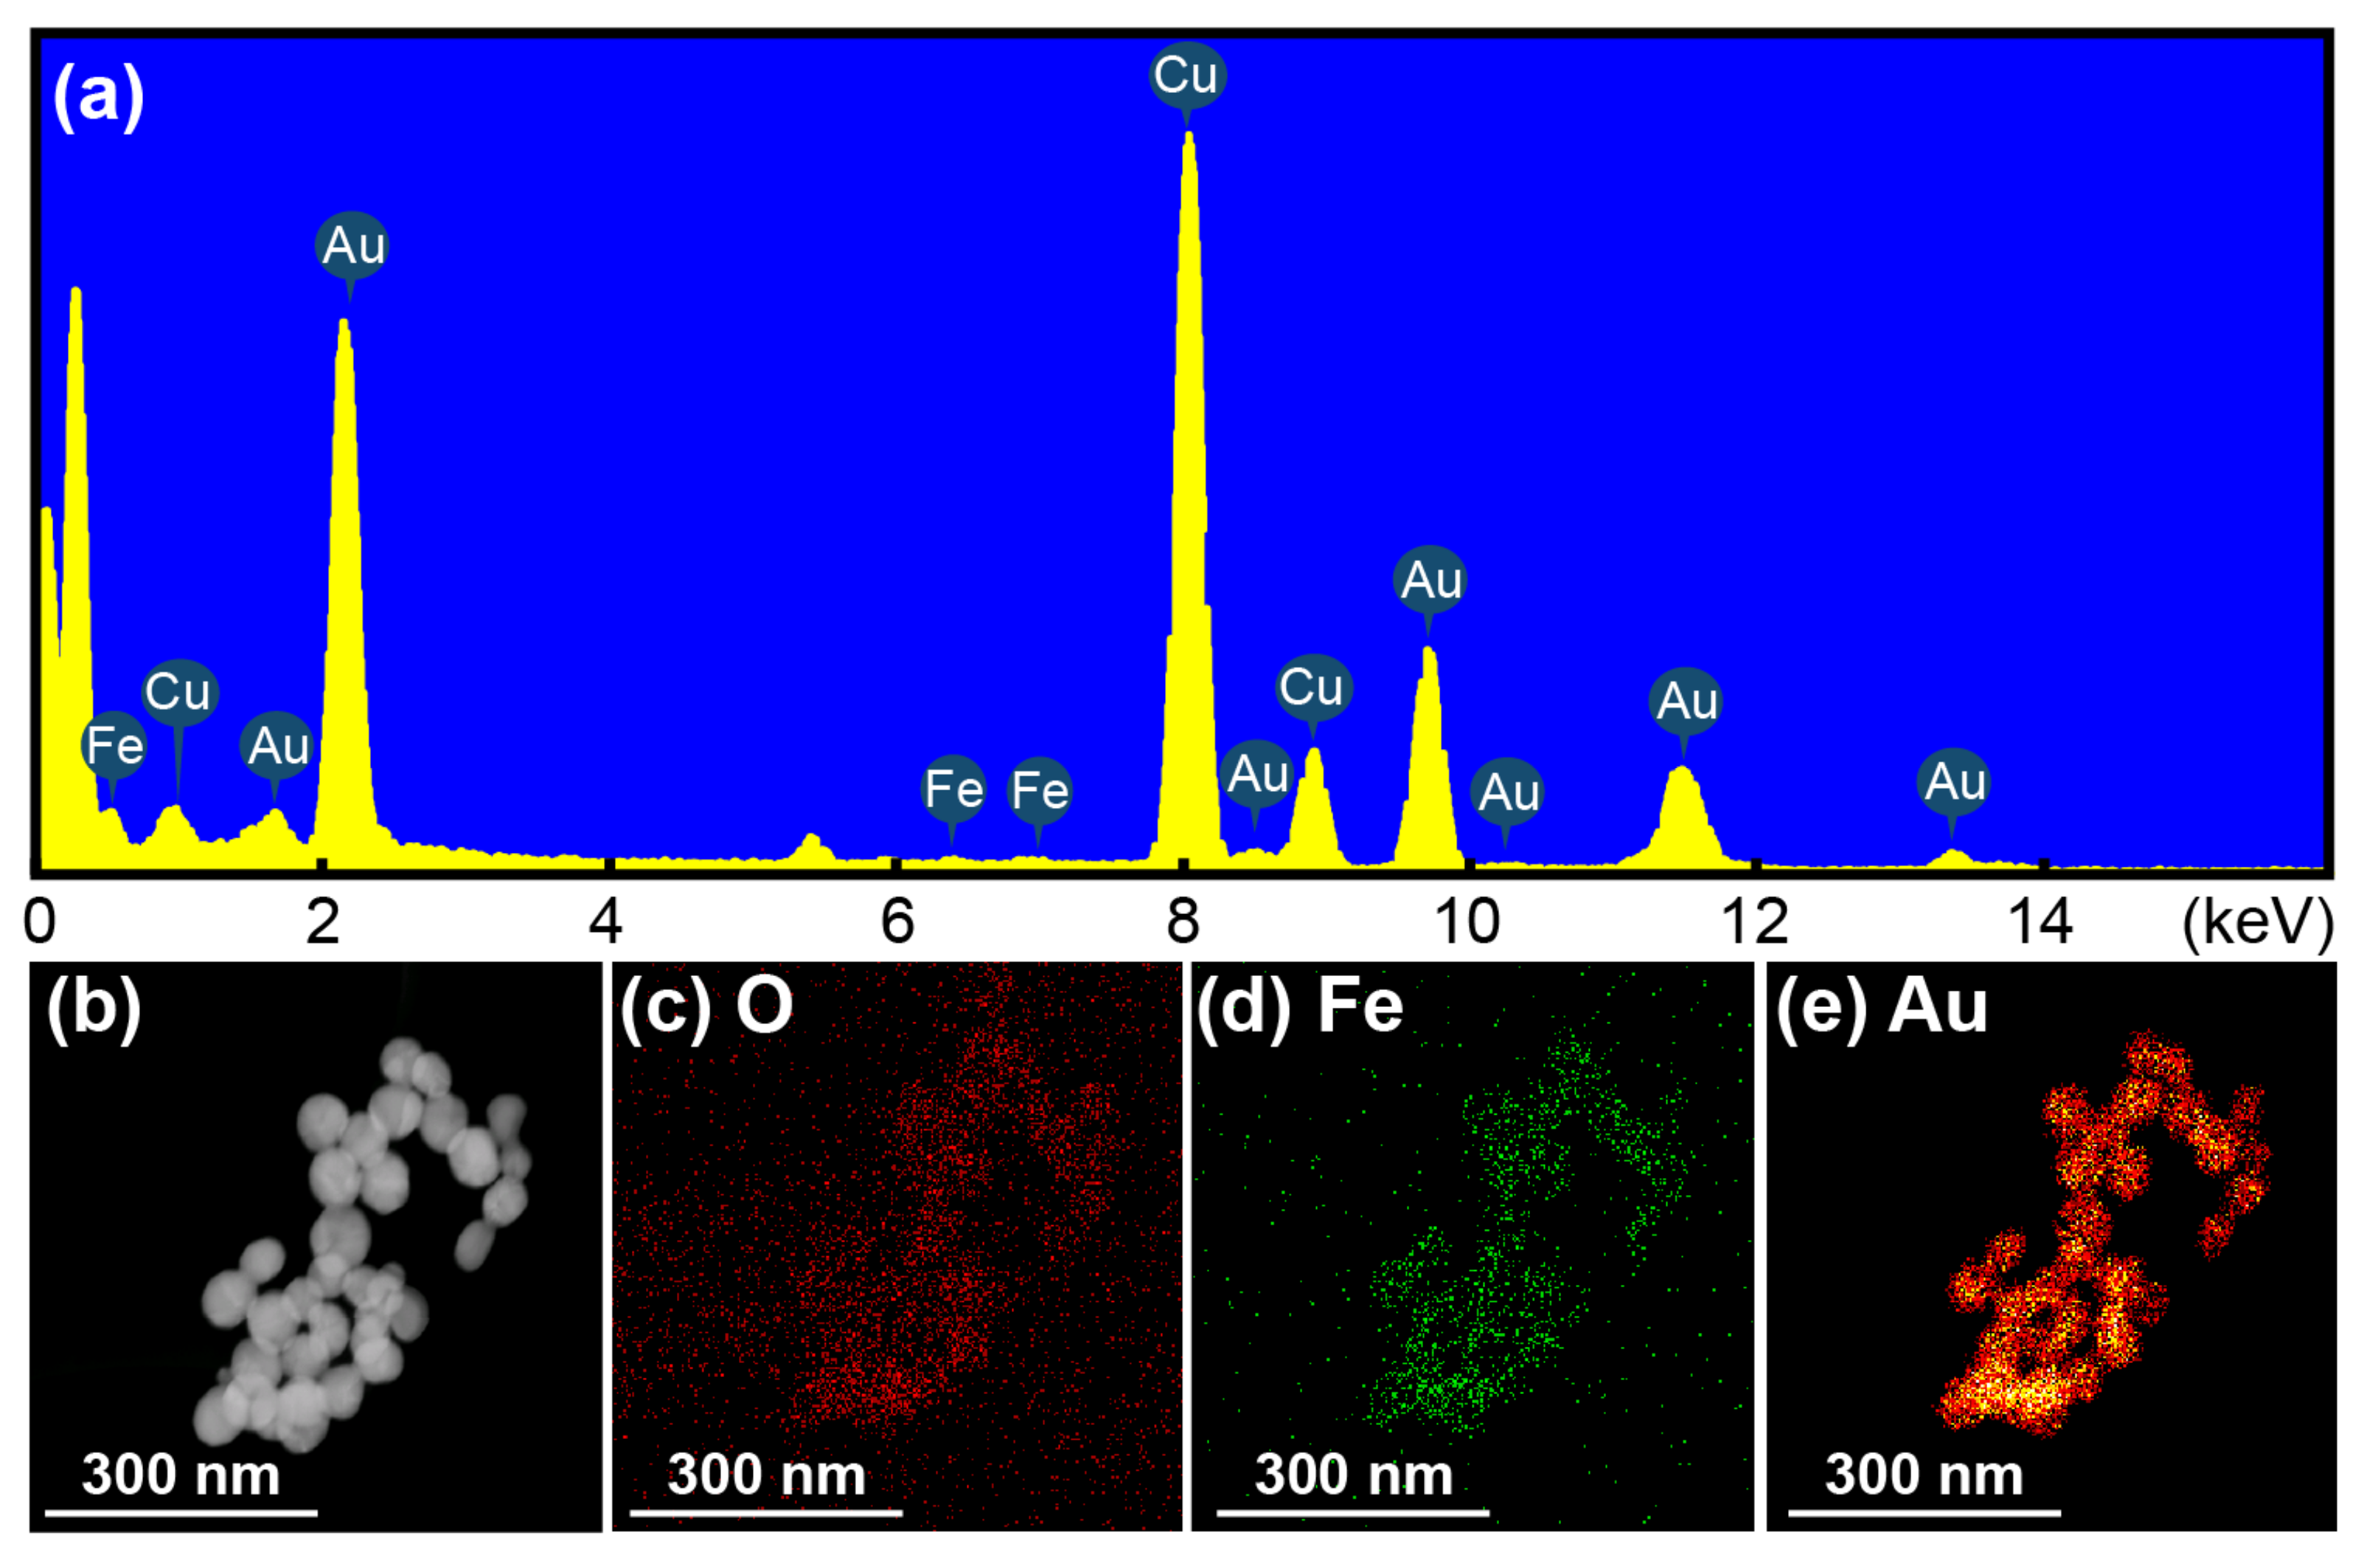
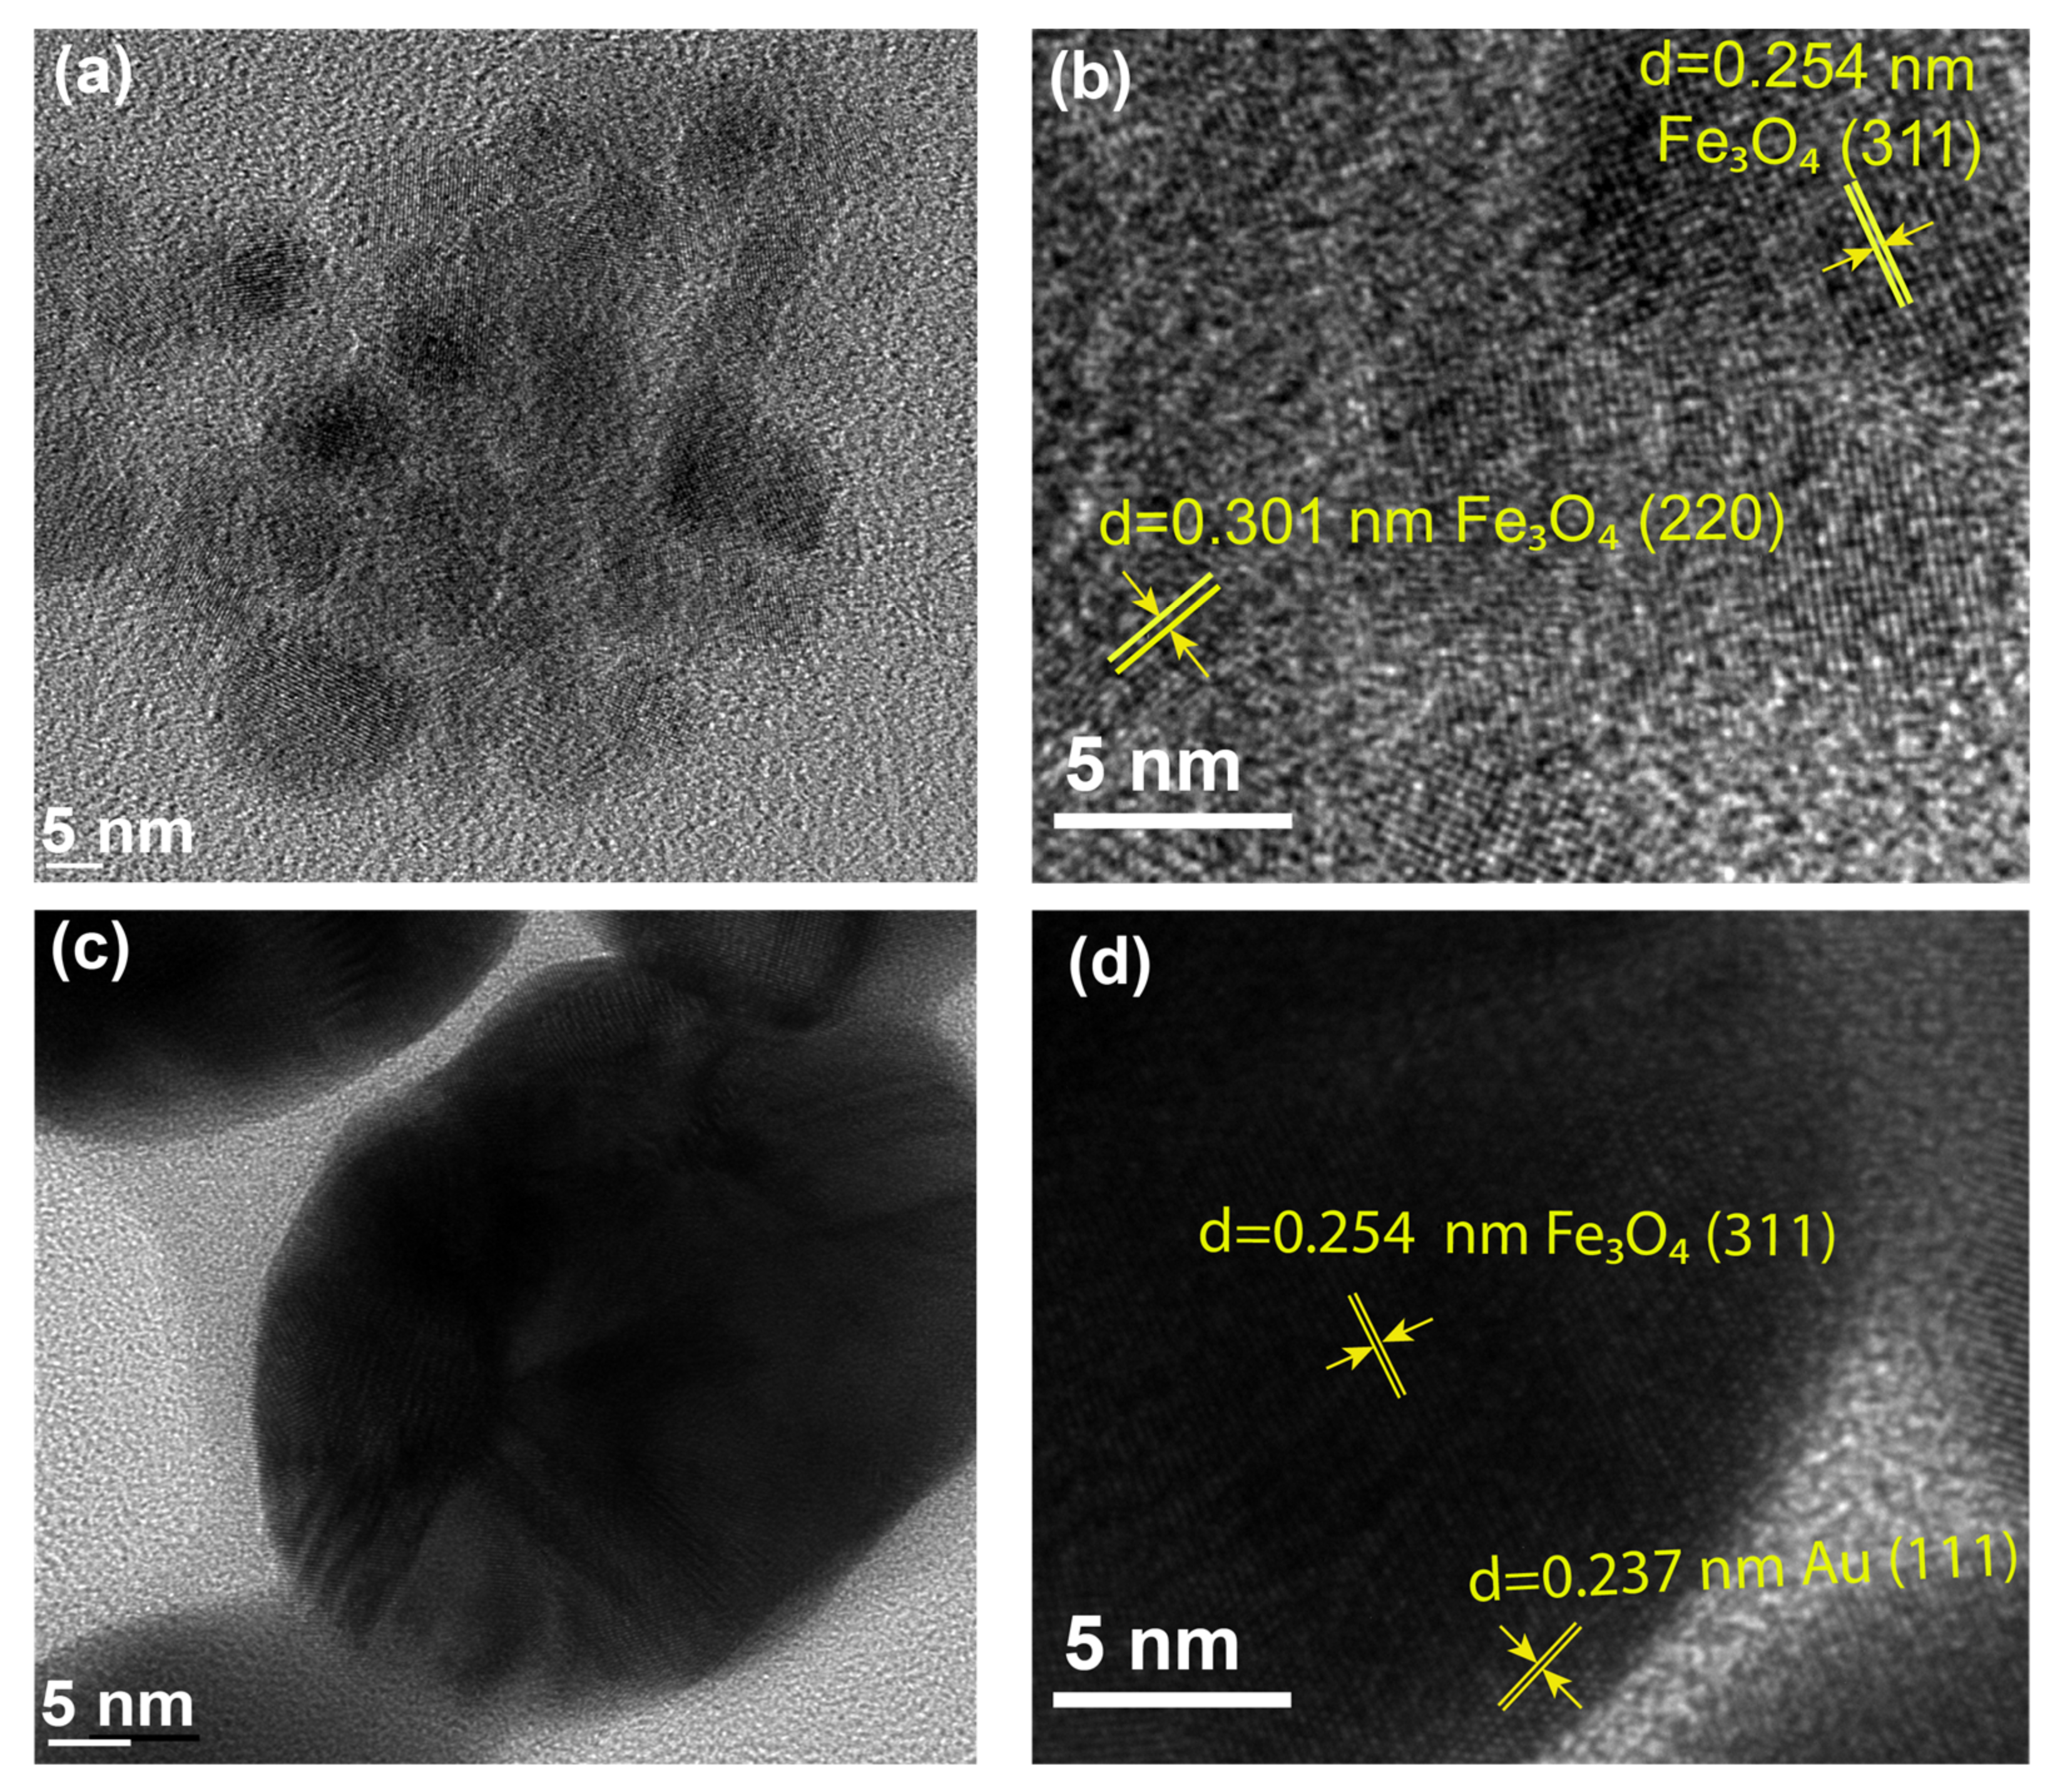
3.1. Characterization of Fe3O4 NPs and GMPs

Figure 3a shows the UV-Vis absorbance spectra of the GMPs, with a comparison with that of the Au NPs previously studied by our group [36]. One of the spectra of the three different GMPs (those fabricated with the 3:200 ratio) and the Au NPs produced broad LSPRs centered at 542 nm and 524 nm, respectively. This was because the relative ratio of the core (dielectric)–shell (metal) materials could determine the effectiveness of the LSPR [37,38,39,40]. The LSPR spectrum of the GMPs (3:200 ratio) was broad enough to cover the Raman excitation wavelength of 532 nm, supporting the amplification of the SERS signal. The small shoulder of the GMP spectrum (3:200 ratio) was seen at 273 nm due to the uncaptured Fe3O4 nanoparticles, which were close to the 278 nm peak observed from the spectrum of the 10−5 M Fe3O4 NP sample (Figure S1). This indicates that GMPs can be used as effective substrates for SERS [41,42].
Figure 3b shows the Fourier transform infrared (FTIR) spectra of the Fe3O4 NPs and the GMPs with varying the relative portion of Au NPs. The stretching of O-H accounted for the peak at around 3446 cm−1, while -COO covalent bonds accounted for the sharp peak at about 1635 cm−1 [43]. This shows the presence of the carboxyl group triple-faced in the citrate structure. This indicates that the fundamental surfactant, the citrate, was successfully attached to the Fe3O4 NPs, preventing the GMP conglomeration while affecting the Au NP size [44]. On the other hand, the 698 cm−1 band corresponded to the lattice Fe and O nodes bonding in its crystalline structure [45]. The result indicated that the reduced gold seeds were effectively entrapped by Fe3O4 NPs [46]. This showed that the capability of the carboxyl-rich surface to anchor Au NPs was not significantly different for the GMPs with various ratios.
The water contact angle (WCA) measurement was recorded by image-capturing the interface between DI water (10 μL drop) and the modified surface at each step. The angle was calculated via Young’s equation with ImageJ software [47]. Figure 3b shows the change in the wettability of the surface as a bare glass surface went through the sequential modification using O2 plasma, 3% APTES, and being immersed in Fe3O4 NPs or the GMP solution for 16 h. It was shown that the O2-plasma-treated surface featuring an angle of 7.1° was hydrophilic due to the generated hydroxyl groups, while the APTES-treated surface, with an angle of 65.2°, was hydrophobic, manifesting successful silanization with amino groups [48]. The immobilization of the Fe3O4 NPs or the GMP made the surface highly hydrophobic, as shown by the contact angles of 78.2° and 92.1°, respectively. This contact angle measurement also verified the successful step-by-step preparation of the specimen [49,50].
Figure 3d shows the measured X-ray diffraction (XRD) for the Fe3O4 NPs and the GMPs on a glass substrate and the simulated diffraction for the Au NPs. It is shown that the Fe3O4 NPs and GMPs had good crystallinity. For the Fe3O4 NPs, the peaks at 30.2°, 35.5°, 43.2°, 40.2°, 52.7°, and 62.9° corresponded to the (200), (311), (400), (511), and (440) planes of the face-centered cubic (FCC) crystal structure, respectively [51]. The peaks observed at the 2 θ of 37.7, 43.9, 63.6, and 76.2° could be matched to the (111), (200), (222), and (311) planes, respectively. This was in an agreement with the Au NP simulation with the 04–0784 in JCPDS data [52]. The absence of the Fe3O4 NPs diffraction peaks in the GMP XRD data is evidence that the magnetite surface was extremely covered with Au shells. According to Scherrer’s formula, the mean crystal size of the Fe3O4 NPs, which determines the width of (311) Bragg’s reflection, was estimated to be 29.4 nm, which can be viewed as the core size in the synthesized structure [53]. Similarly, we also calculated the size of the Au shell to be 36.8 nm from the most intense peak of the (111) plane. As a result, we could estimate the size of the composite core–shell, the GMP, to be about 80 nm in diameter.
Field-emission scanning electron microscopy (FESEM) was used to determine the morphology of the samples. Figure 4 shows FESEM images of the coated Au NPs, Fe3O4 NPs, and GMPs on glass substrates (nanoparticle coating by 16 h of immersion in the respective solutions). As shown in Figure 4a,b, the size of the Au NPs and the Fe3O4 NPs was about 30 nm, while the larger particles represented the assembly structure of GMPs (from 60 to 100 nm), as shown in Figure 4c,d. The magnetism of the Fe3O4 NPs could account for the aggregated nature of the nanoparticles. In addition, the particle size shown in Figure 4 was in an agreement with the crystalline size estimated by the XRD data. Various sizes of GMPs could be explained by the rapid change in the reducing process of the synthesis or by the aggregation of the GMPs [54]. The relatively uniform morphology of the GMPs could make them serve as a SERS substrate that produces stable and reproducible signals [55].
Figure 5a shows the energy-dispersive X-ray (EDX) spectra of the fabricated GMPs with EDX mapping of the O, Fe, and Au elements. The appearance of Cu was due to the use of the copper grid and the carbon-coated copper grid. It was also seen that the Au element was found in a much larger portion than the Fe element. The mass percentage of Fe was 1.45%, whereas the Au is 98.55%, indicating the constituent molar ratio is approximately 3:200. The absence of oxygen in the EDX spectra could be explained by the limited EDX resolution of 0.1 wt% of bulk material for a given oxygen portion less than 0.01 wt% [56].
Figure 5b shows an SEM image of the aggregated GMPs for which the elemental EDX mapping, as illustrated in Figure 5c–e, presents the distributions of O, Fe, and Au, respectively. The distributions of Fe and O were similar to each other, indicating the presence of Fe3O4. The Au NP distribution approximately followed that of Fe or O, but it covered more positions around the Fe and O. This verified the successful synthesis of the composite core–shell nanostructure of the GMPs, resulting from the growth of the Au NPs around the Fe3O4 NPs into Au shells.
High-resolution transmission electron microscopy (HRTEM) was performed to check the morphology and the element layer, as shown in Figure 6. Obviously, both the Au NPs and the GMPs were highly crystalline and were described as having sphere-like morphology. Figure 6a,b present the HRTEM images, illustrating the crystallinity of the Fe3O4 NPs. The d spacing of 0.254 nm and 0.301 nm corresponded to the (311) and (220) planes of the crystalline Fe3O4, respectively. These properties matched the FCC structure [57,58]. Figure 6c presents an HRTEM image of the GMPs, where the d spacing was estimated from a chosen GNP, as shown in Figure 6d. These HRTEM images of GMPs reveal their detailed structures with the crystalline deposition of Au elements on the surface of the Fe3O4. As seen in Figure 6d, the (311) plane of the highly crystalline Fe3O4 was observed with a d spacing of 0.254 nm. Another d spacing of 0.237 nm was measured in the shell layer, which was consistent with the d value of the Au (111) planes [59]. From the images, we could estimate the diameter of GNP (3:200 ratio) to be 80 nm, assuming an approximately spherical nanocomposite shape. The GNPs were assembled together due to their magnetic properties. The weak contrast of the images across the GMP boundaries may have been due to the surfactant-induced thin coating. The HRTEM results were in good agreement with the XRD characterization. Both results supported the successful fabrication of the GMP structure.

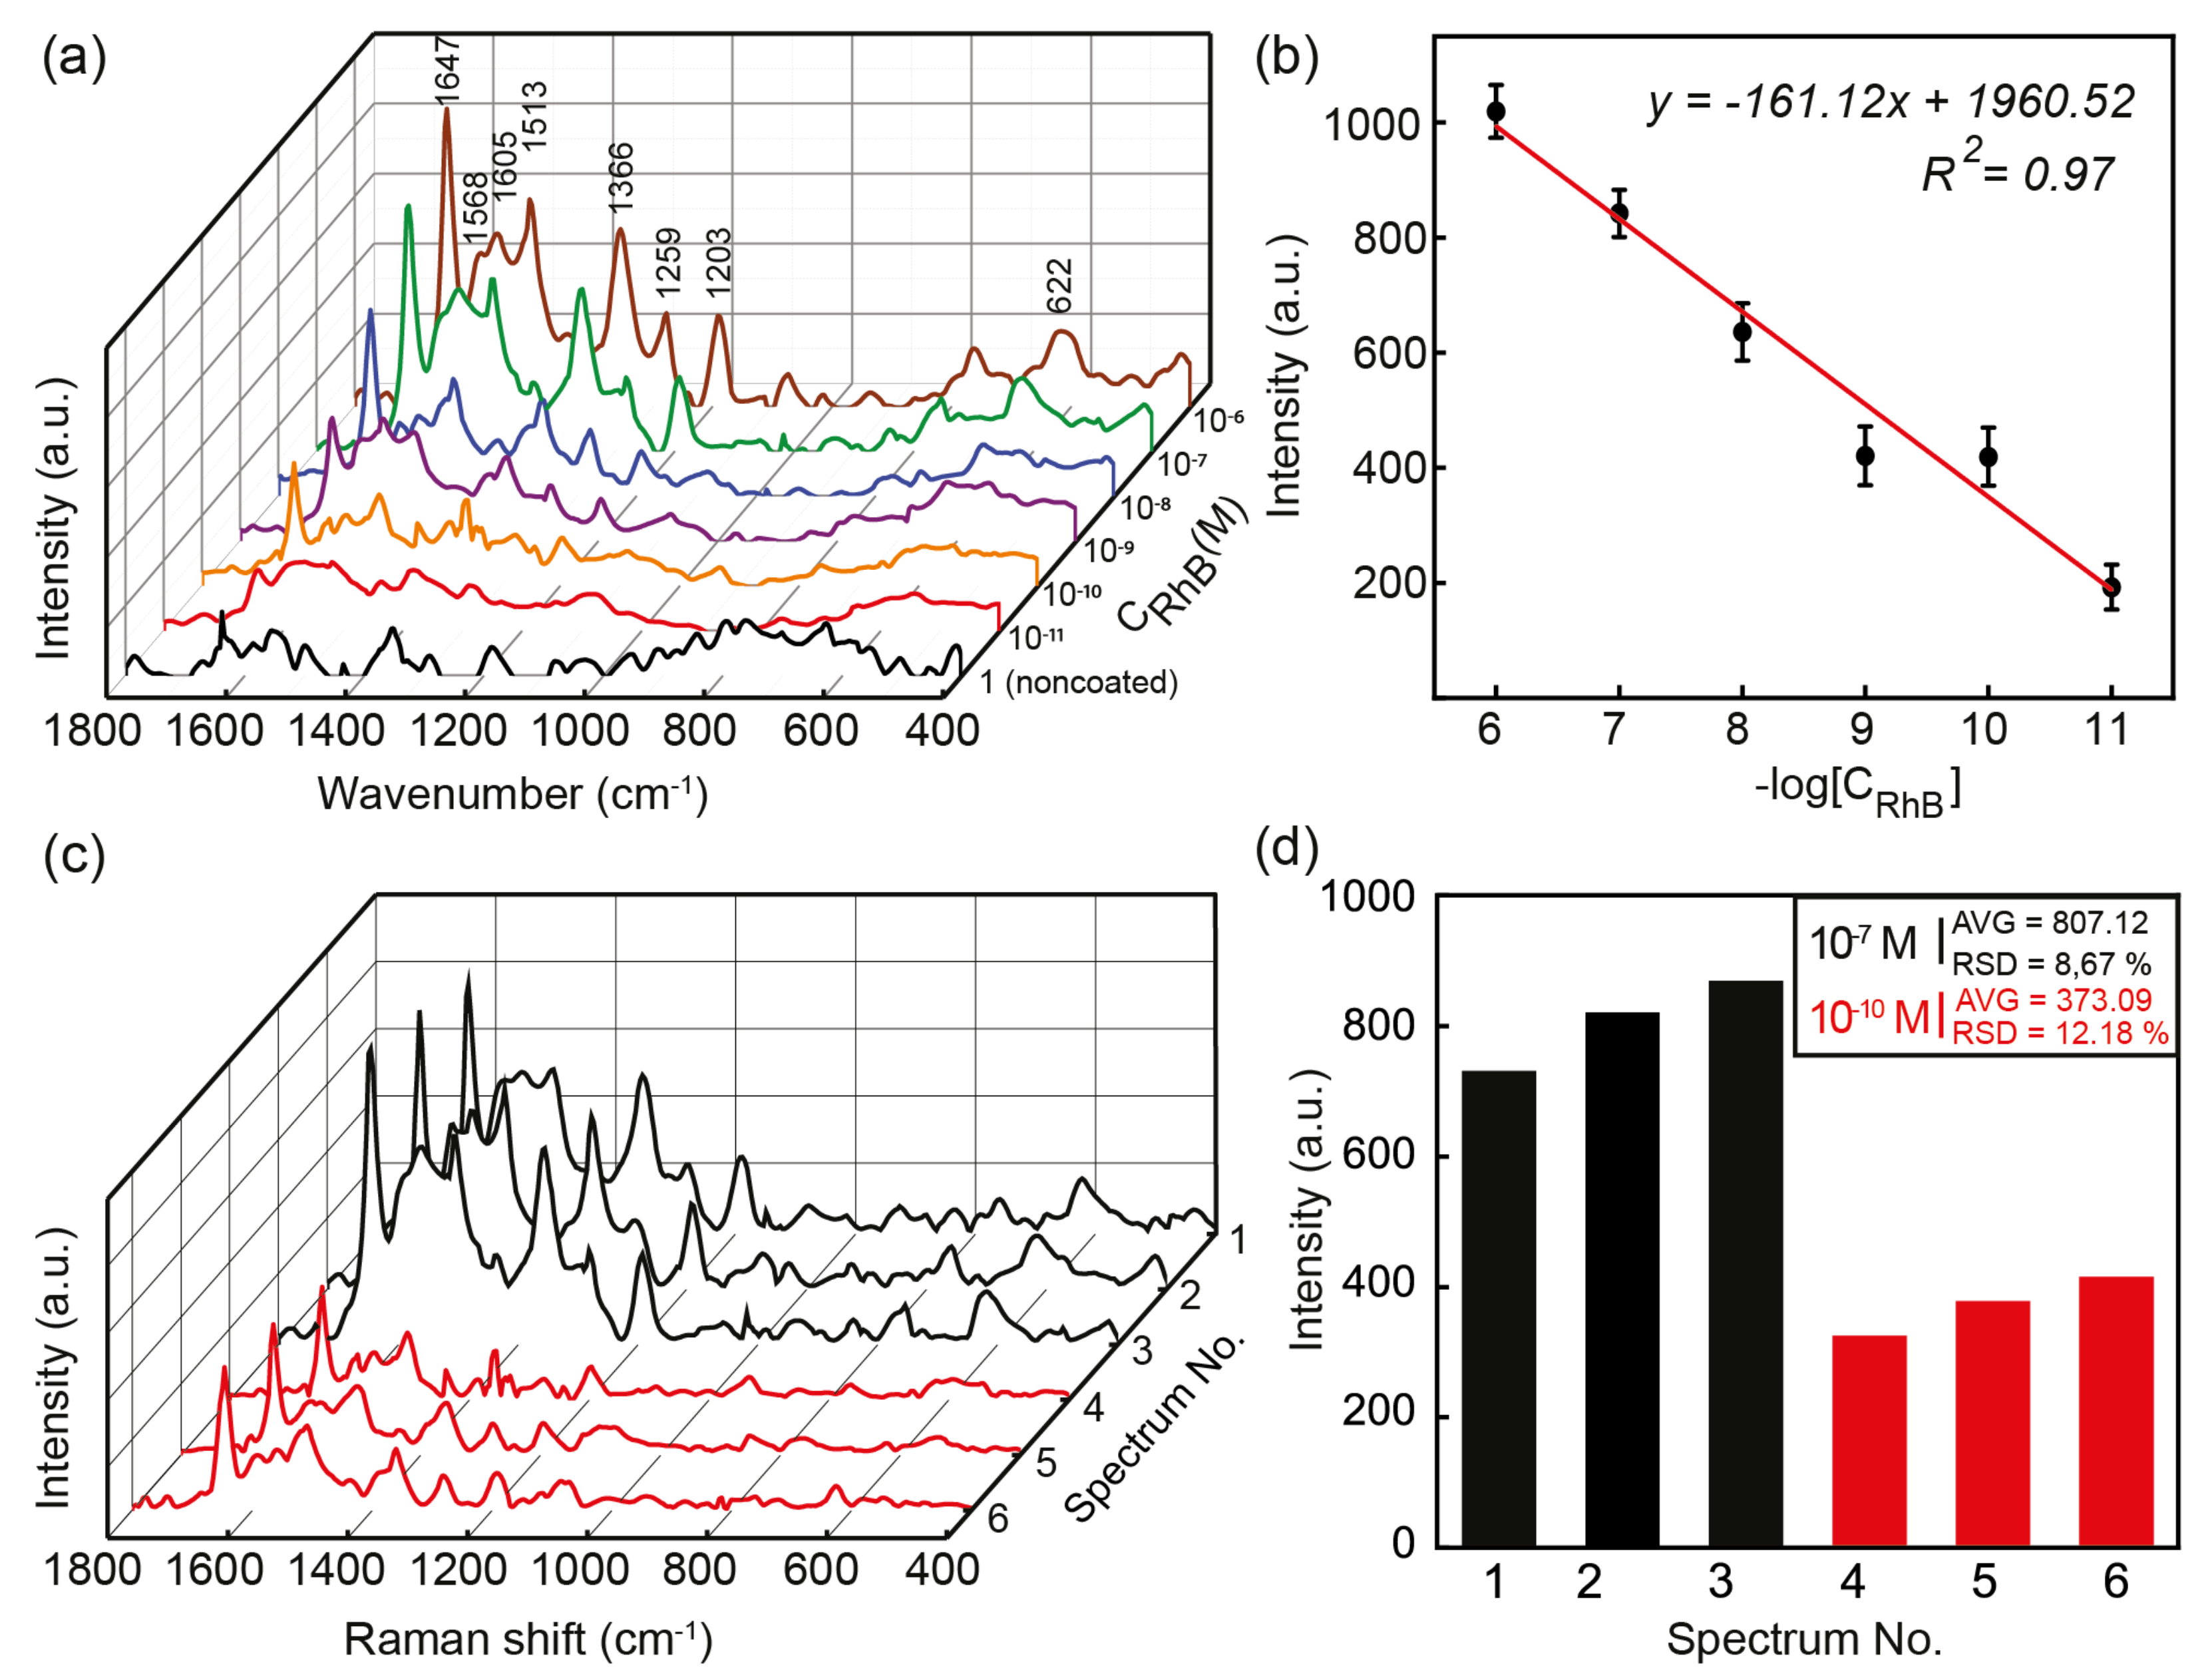
3.2. SERS-Based Detection of Rhodamine B (RhB)

Raman scattering spectroscopy enables us to determine the specific vibrational modes of the constituent molecules of a specimen. The inherent weakness of conventional Raman scattering signals can be eliminated by SERS that amplifies the Raman signal tremendously using enhanced local electric fields at the pump and scattering wavelengths, which are provided by the LSPR. In this case, the GMPs came into play to excite the LSPR for the SERS with the Raman-active medium of the RhB.
Figure 7a shows the intensity of the SERS, which increased as the RhB concentration increased. The peaks of RhB were recorded at 1647, 1605, 1568, 1513, 1366, 1259, 1203, and 622 cm−1 corresponding to the stretching vibrations listed in Table 1 [60,61,62].
The aromatic C-C vibration modes appeared at 1647, 1568, 1513, and 1366 cm−1, which were the dominant bonds in the RhB chemical structure. The 1647 cm−1 peak presented the greatest stretching vibration due to its major contribution to the RhB chemical construction. Other peaks at 1605, 1259, and 1203 cm−1 corresponded to the aromatic C=C, the bridge-band C-C, and the aromatic C-H, respectively. Moreover, the puckering of the xanthene ring produced a peak at 622 cm−1. The lowest concentration of RhB that was detectable by SERS with GMPs was 10−11 M. The Raman intensity at 1647 cm−1 showed a good linear relationship with the logarithm of the RhB concentrations from 10−6 to 10−11 M. Figure 7b shows the standard curve between the RhB concentration and the Raman signal intensity. The linear regression for the measurements was plotted with the equation y = 161.12 x + 1960.52 with R 2 = 0.97 .
The enhancement factor (EF) of SERS was estimated using Feynman’s formula, given by [63]:
EF = ( I SERS × N NRS ) / ( I NRS × N SERS )
More specifically, the intensity in SERS and normal Raman spectroscopy (ISERS and INRS) were obtained from the 1647 cm−1 signature peaks of the 10−11 M RhB solution and powder, respectively. On the other hand, the number of the Raman-active molecules used in the SERS and normal Raman spectroscopy (NSERS and NNRS) could be replaced by the molecule concentration since we used an equal volume in both SERS and normal Raman spectroscopy. An extraordinarily high EF of 2.1 × 10⁸ with a limit of detection (LOD) of 3.5 × 10⁻¹² M RhB was estimated. Table 2 presents a comparison of the SERS performance using various nanostructures in terms of the LOD and the EF for detecting RhB molecules. The GMP-aided SERS performance presented in this work was the most effective to date, showing the great potential of fabricated GMPs for SERS-based sensing and diagnosis.
The reproducibility and stability were also investigated by measuring the Raman spectra at different positions on the GMP-coated substrate at two RhB concentrations of 10−7 M and 10−10 M, as shown in Figure 7c. The average (AVG) values and relative standard deviation (RSD) values of the SERS signals were estimated at the 1647 cm−1 peak of the spectra, as shown in Figure 7d. In Figure 7c,d, Spectra 1, 2, and 3 were recorded at an RhB concentration of 10−7 M, while spectra 4,5, and 6 were recorded at 10−10 M.
Three randomly chosen positions on the SERS substrate gave an RSD of 8.67% at the RhB concentration of 10−7 M, while they gave an RSD of 12.18% at 10−9 M. These results verified the reasonable level of reproducibility of achieving highly amplified Raman signals using SERS technologies with the GMP-coated substrate [71].

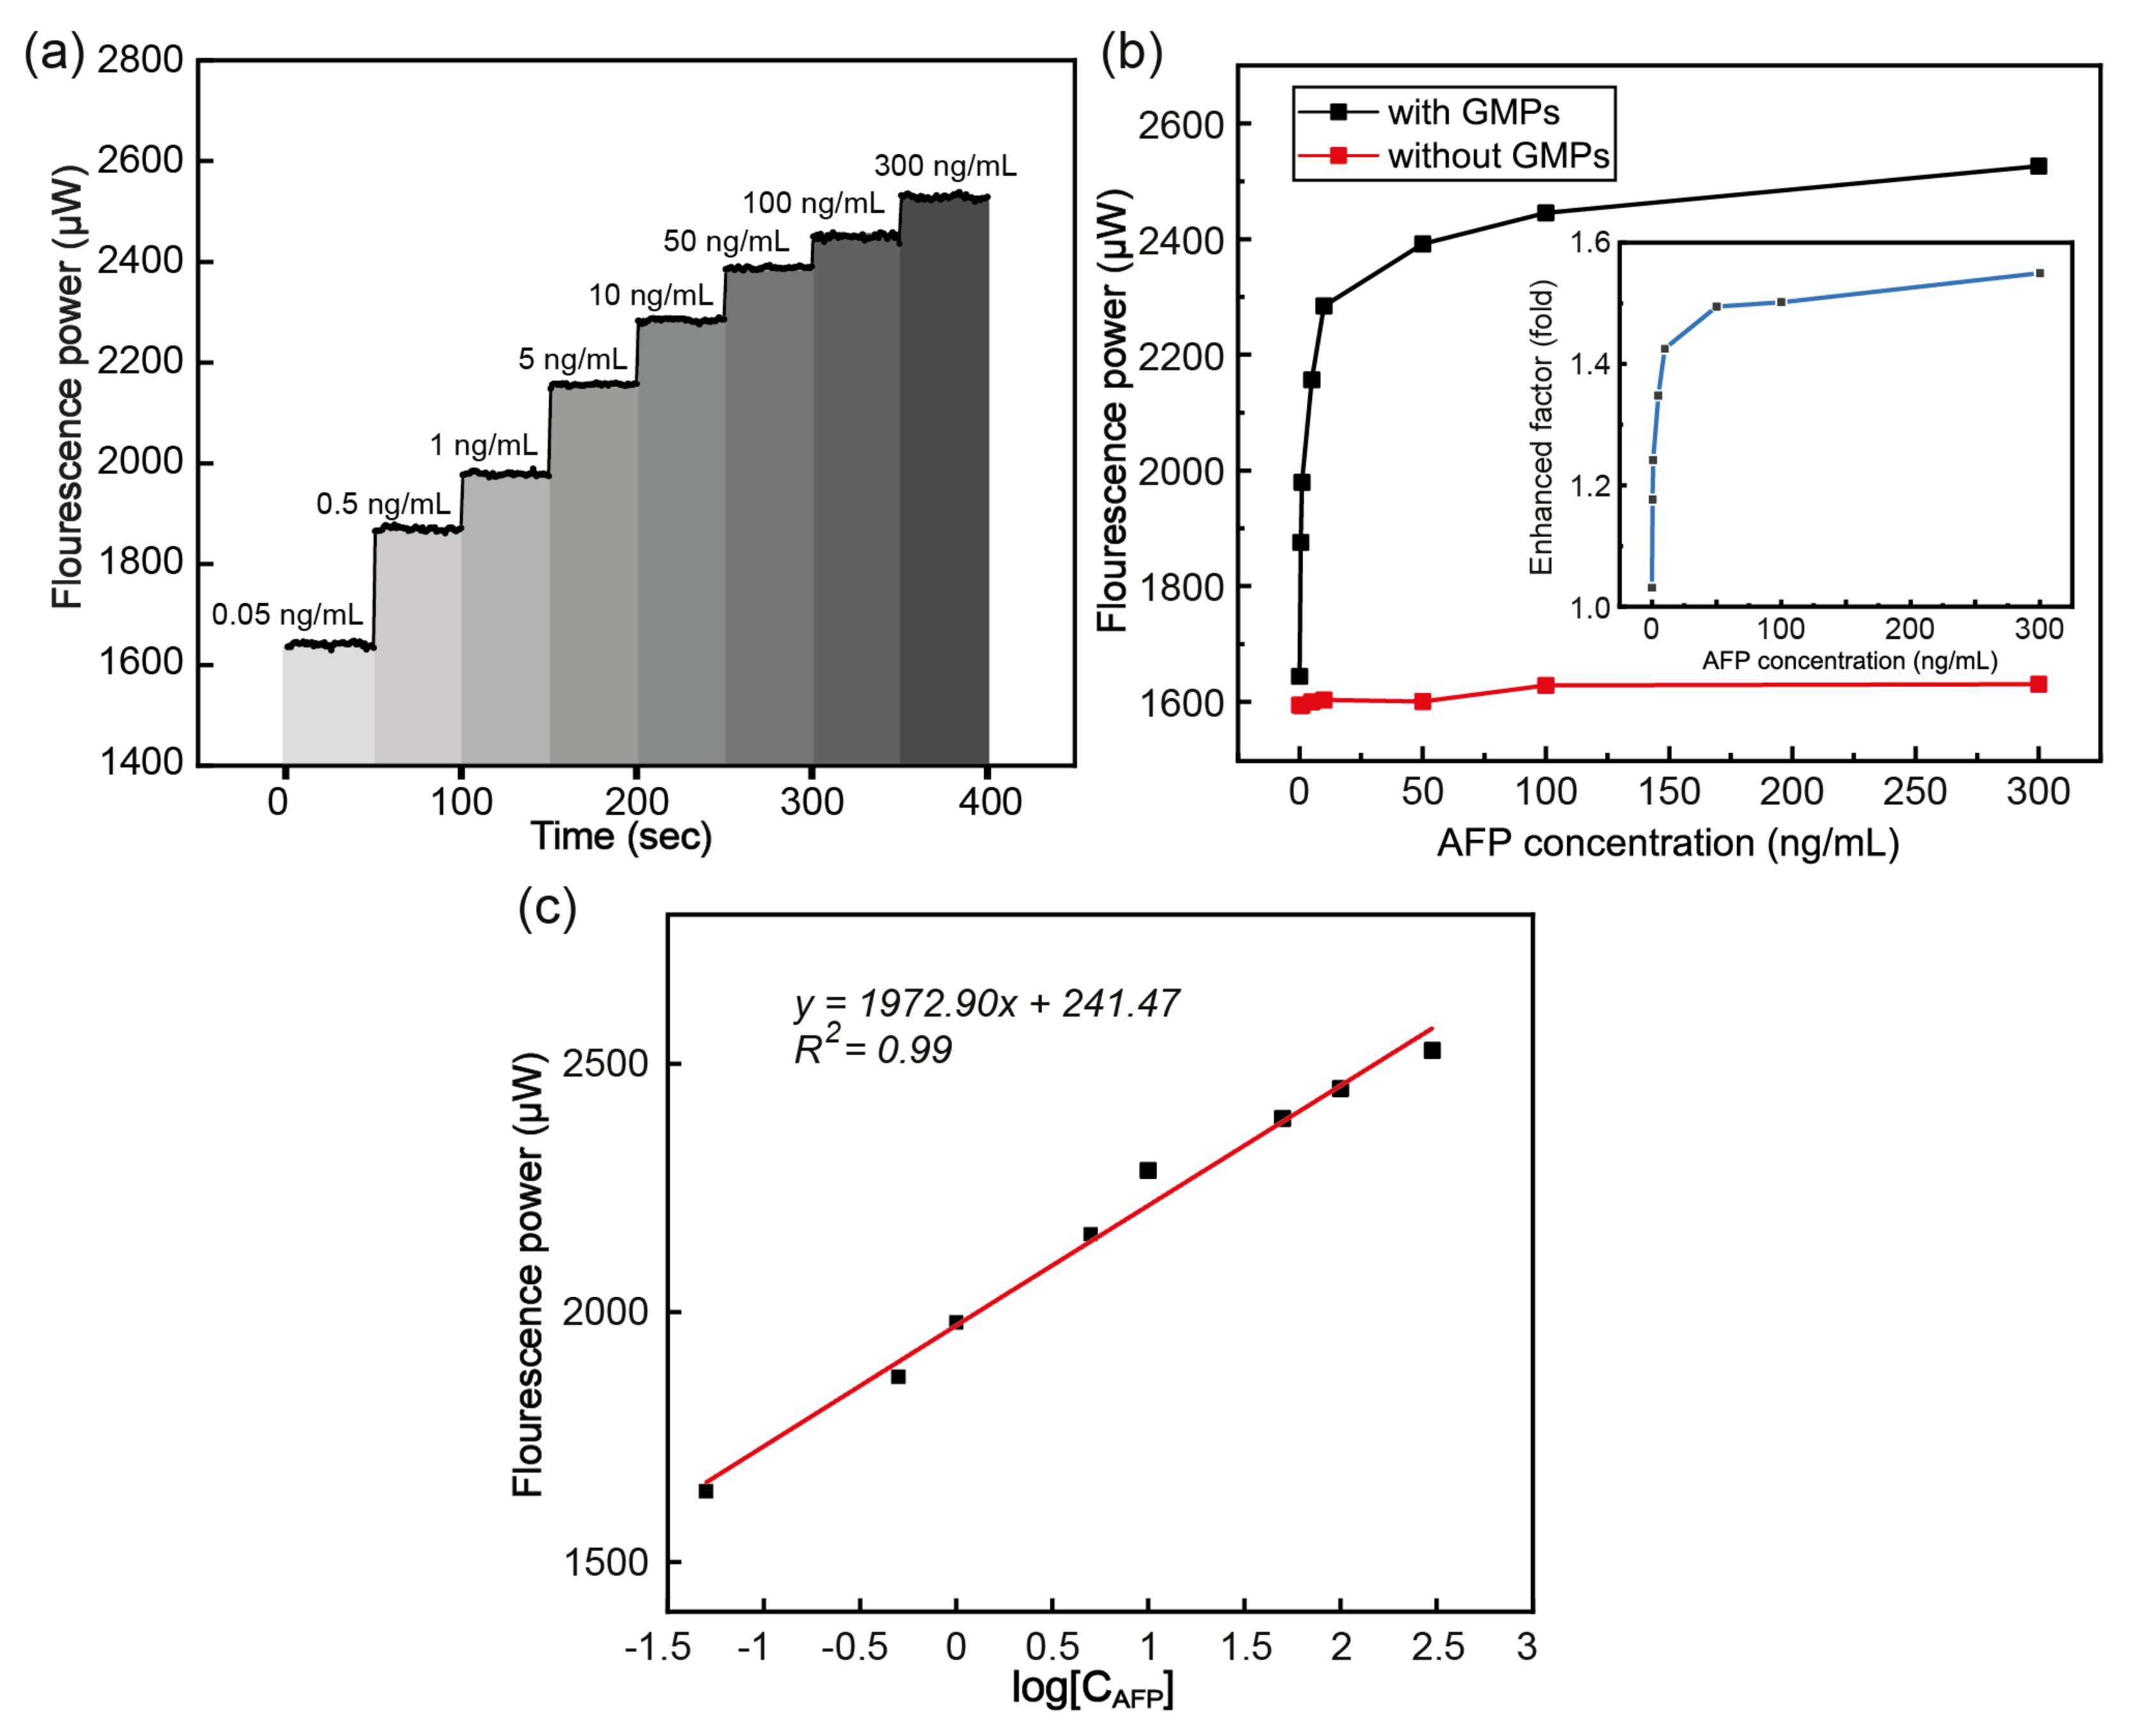
3.3. Metal-Enhanced Fluorescence (MEF)-Based Detection of Alpha-Fetoprotein (AFP)

A previously reported optical setup for fluorescence detection with the transmission mode (T-mode) was used to record the metal-enhanced fluorescence signals [35]. The MEF occurred due to the local field enhancement around the GMPs, as SERS required locally enhanced fields (Section 3.2). The Alexa-488 molecules, which were conjugated with the secondary antibodies in the sandwich assay for AFP, were in proximity to the surface of the GNPs, making the fluorescent probes interact with LSPR-enhanced local fields. This resulted in metal-enhanced fluorescence effects. Figure 8a exhibits the sequential increase in the fluorescence power as the AFP concentration increased. We used eight concentrations of AFP in the range of 0.05 to 300 ng/mL. The fluorescence signals collected for 50 s were averaged at each AFP concentration. This measurement was repeated at each AFP concentration at least three times to obtain the CV. The CV was estimated to be <1%, revealing the high reproducibility of the quantitative sensing of the AFP.
As illustrated in Figure 8b, the GNP-induced fluorescence enhancement was clearly manifested by comparing two fluorescence signals obtained using sensing chambers with (black) and without (red) the GMP coating on their bottom surface. As the AFP concentration increased, the MEF rapidly increased before saturation above 50 ng/mL. The inset (blue line) shows the estimated EF which was up to 1.5-fold owing to the MEF effects over the cases using standard substrate chambers. Notably, a good linear relation between the fluorescence power and a logarithm of the AFP concentration was obtained in the range of 0.05 to 300 ng/mL for the GMP-based MEF. The linear regression was y = 1972.90 x + 241.47 with an R2 of 0.99, as shown in Figure 8c. The LOD was 3.8 × 10⁻⁴ ng/mL, which was much smaller than those previously reported in the literature for AFP assays (Table 3). This high sensitivity for the AFP assay could be attributed to two factors. First, the Au shell of the GMPs, which supported the somewhat-broad LSPR centered at 542 nm, was in proximity to the Alexa 488 molecules with excitation/emission wavelengths of 496 and 519 nm, respectively. This condition could have amplified the fluorescence by so-called MEF [7]. Second, the magnetically induced GNP aggregation could have served to create hot spots where extremely intense local fields were generated. This would also be beneficial for fluorescence enhancement based on MEF [72].

4. Conclusions

In summary, a novel hybrid nanocomposite consisting of an Fe3O4 NP cluster core and a Au NP shell was synthesized and characterized for its application in MEF and SERS-based sensing. We optimized the molar ratio of the core and the shell materials to 3:200, forming GNPs with diameters of about 80 nm. The GMPs at the 3:200 ratio showed an LSPR wavelength at 542 nm. The use of the GNPs for MEF for AFP detection produced the maximum EF of 1.5 with an LOD of 3.8 × 10⁻⁴ ng/mL, showing very high sensitivity for AFP sensing. This feature would enable the GMP-based MEF to be applied in the early diagnosis of liver cancer.
Moreover, it was demonstrated that the GMP-based substrate could serve as an effective SERS substrate to detect a toxic pigment, rhodamine B. The LOD for RhB detection was 3.5 × 10⁻¹² M, revealing a high sensitivity compared to other studies for RhB sensing.
MEF and SERS based on GMPs could pave the way towards the development of biosensors and chemical sensors that are low-cost, readily fabricated, and consume restricted amounts of analytes.

Supplementary Materials

The following supporting information can be downloaded at https://www.mdpi.com/article/10.3390/chemosensors11010056/s1, Figure S1: The UV-Vis spectra of 10−5 M Fe3O4 NPs and GMPs with different ingredient ratios in the wavelength range from 230 to 400 nm.

Author Contributions

L.G.P. and P.Q.T.D.: conceptualization, methodology, writing—original draft preparation, data curation, and formal analysis; H.K.T.T., S.-W.J. and D.H.M.: data curation and formal analysis; T.N.B. and V.Q.D.: data curation, formal analysis, and visualization; T.T.T.V.: formal analysis; N.H.T.T.: supervision, funding acquisition, investigation, methodology, writing—reviewing and editing, and funding acquisition. All authors have read and agreed to the published version of the manuscript.

Funding

This research received no external funding.

Institutional Review Board Statement

Not applicable.

Informed Consent Statement

Not applicable.

Data Availability Statement

Not applicable.

Acknowledgments

This research was funded by Vietnam National University Ho Chi Minh City (VNU-HCM) under grant number DS2022-18-01. We would like to gratefully acknowledge the Center for Innovative Materials and Architectures (Laboratory for Optics and Sensing) at Vietnam National University in Ho Chi Minh City.

Conflicts of Interest

The authors declare no conflict of interest.

References

  1. Hacia, J.G.; Brody, L.C.; Chee, M.S.; Fodor, S.P.; Collins, F.S. Detection of Heterozygous Mutations in BRCA1 Using High Density Oligonucleotide Arrays and Two-Colour Fluorescence Analysis. Nat. Genet. 1996, 14, 441–447. [Google Scholar] [CrossRef] [PubMed]
  2. Ai, H.; Hazelwood, K.L.; Davidson, M.W.; Campbell, R.E. Fluorescent Protein FRET Pairs for Ratiometric Imaging of Dual Biosensors. Nat. Methods 2008, 5, 401–403. [Google Scholar] [CrossRef] [PubMed]
  3. Nguyen-Ngoc, H.; Tran-Minh, C. Fluorescent Biosensor Using Whole Cells in an Inorganic Translucent Matrix. Anal. Chim. Acta 2007, 583, 161–165. [Google Scholar] [CrossRef] [Green Version]
  4. Jeong, Y.; Kook, Y.-M.; Lee, K.; Koh, W.-G. Metal Enhanced Fluorescence (MEF) for Biosensors: General Approaches and a Review of Recent Developments. Biosens. Bioelectron. 2018, 111, 102–116. [Google Scholar] [CrossRef] [PubMed]
  5. Fili, N.; Toseland, C. Fluorescence and Labelling: How to Choose and What to Do. EXS 2014, 105, 1–24. [Google Scholar]
  6. Badshah, M.A.; Koh, N.Y.; Zia, A.W.; Abbas, N.; Zahra, Z.; Saleem, M.W. Recent Developments in Plasmonic Nanostructures for Metal Enhanced Fluorescence-Based Biosensing. Nanomaterials 2020, 10, 1749. [Google Scholar] [CrossRef]
  7. Geddes, C.D.; Lakowicz, J.R. Editorial: Metal-Enhanced Fluorescence. J. Fluoresc. 2002, 12, 121–129. [Google Scholar] [CrossRef]
  8. Ji, X.; Xiao, C.; Lau, W.-F.; Li, J.; Fu, J. Metal Enhanced Fluorescence Improved Protein and DNA Detection by Zigzag Ag Nanorod Arrays. Biosens. Bioelectron. 2016, 82, 240–247. [Google Scholar] [CrossRef]
  9. Camposeo, A.; Persano, L.; Manco, R.; Wang, Y.; Del Carro, P.; Zhang, C.; Li, Z.-Y.; Pisignano, D.; Xia, Y. Metal-Enhanced Near-Infrared Fluorescence by Micropatterned Gold Nanocages. ACS Nano 2015, 9, 10047–10054. [Google Scholar] [CrossRef] [Green Version]
  10. Bai, Z.; Chang, M.; Peng, M.; Liu, P.; Lu, A.; Zhang, Z.; Qin, S. Controlling Fluorescence of a Nano-Al2O3 Film Enabled by CdSe Quantum Dots on CdSe/Al2O3 Heterojunctions. J. Lumin. 2019, 215, 116614. [Google Scholar] [CrossRef]
  11. Aslan, K.; Wu, M.; Lakowicz, J.R.; Geddes, C.D. Fluorescent Core−Shell Ag@SiO2 Nanocomposites for Metal-Enhanced Fluorescence and Single Nanoparticle Sensing Platforms. J. Am. Chem. Soc. 2007, 129, 1524–1525. [Google Scholar] [CrossRef] [PubMed]
  12. Shukla, R.; Bansal, V.; Chaudhary, M.; Basu, A.; Bhonde, R.R.; Sastry, M. Biocompatibility of Gold Nanoparticles and Their Endocytotic Fate Inside the Cellular Compartment: A Microscopic Overview. Langmuir 2005, 21, 10644–10654. [Google Scholar] [CrossRef] [PubMed]
  13. Zhou, Y.; Wang, C.Y.; Zhu, Y.R.; Chen, Z.Y. A Novel Ultraviolet Irradiation Technique for Shape-Controlled Synthesis of Gold Nanoparticles at Room Temperature. Chem. Mater. 1999, 11, 2310–2312. [Google Scholar] [CrossRef]
  14. Rajkumar, S.; Prabaharan, M. Chapter 29—Theranostic Application of Fe3O4–Au Hybrid Nanoparticles. In Noble Metal-Metal Oxide Hybrid Nanoparticles; Mohapatra, S., Nguyen, T.A., Nguyen-Tri, P., Eds.; Woodhead Publishing: Sawston, UK, 2019; Volume 29, pp. 607–623. [Google Scholar]
  15. Ghazanfari, M.R.; Kashefi, M.; Shams, S.F.; Jaafari, M.R. Perspective of Fe3O4 Nanoparticles Role in Biomedical Applications. Biochem. Res. Int. 2016, 2016, 7840161. [Google Scholar] [CrossRef] [Green Version]
  16. Ruales-Lonfat, C.; Barona, J.F.; Sienkiewicz, A.; Bensimon, M.; Vélez-Colmenares, J.; Benítez, N.; Pulgarín, C. Iron Oxides Semiconductors Are Efficients for Solar Water Disinfection: A Comparison with Photo-Fenton Processes at Neutral PH. Appl. Catal. B Environ. 2015, 166–167, 497–508. [Google Scholar] [CrossRef]
  17. Gu, X.; Wu, Y.; Zhang, L.; Liu, Y.; Li, Y.; Yan, Y.; Wu, D. Hybrid Magnetic Nanoparticle/Nanogold Clusters and Their Distance-Dependent Metal-Enhanced Fluorescence Effect via DNA Hybridization. Nanoscale 2014, 6, 8681–8693. [Google Scholar] [CrossRef]
  18. Wheeler, D.; Adams, S.; López Luke, T.; Torres-Castro, A.; Zhang, J. Magnetic Fe3O4-Au Core-Shell Nanostructures for Surface Enhanced Raman Scattering. Ann. Phys. 2012, 524, 670–679. [Google Scholar] [CrossRef]
  19. Wang, C.; Li, P.; Wang, J.; Rong, Z.; Pang, Y.; Xu, J.; Dong, P.; Xiao, R.; Wang, S. Polyethylenimine-Interlayered Core–shell–satellite 3D Magnetic Microspheres as Versatile SERS Substrates. Nanoscale 2015, 7, 18694–18707. [Google Scholar] [CrossRef]
  20. Sciacca, B.; Monro, T.M. Dip Biosensor Based on Localized Surface Plasmon Resonance at the Tip of an Optical Fiber. Langmuir 2014, 30, 946–954. [Google Scholar] [CrossRef]
  21. Shen, J.; Zhou, Y.; Huang, J.; Zhu, Y.; Zhu, J.; Yang, X.; Chen, W.; Yao, Y.; Qian, S.; Jiang, H.; et al. In-Situ SERS Monitoring of Reaction Catalyzed by Multifunctional Fe3O4@TiO2@Ag-Au Microspheres. Appl. Catal. B Environ. 2017, 205, 11–18. [Google Scholar] [CrossRef]
  22. Song, D.; Yang, R.; Fang, S.; Liu, Y.; Long, F.; Zhu, A. SERS Based Aptasensor for Ochratoxin A by Combining Fe3O4@Au Magnetic Nanoparticles and Au-DTNB@Ag Nanoprobes with Multiple Signal Enhancement. Microchim. Acta 2018, 185, 491. [Google Scholar] [CrossRef] [PubMed]
  23. Kal-Koshvandi, A.T. Recent Advances in Optical Biosensors for the Detection of Cancer Biomarker α-Fetoprotein (AFP). TrAC Trends Anal. Chem. 2020, 128, 115920. [Google Scholar] [CrossRef]
  24. Yuan, Y.; Li, S.; Xue, Y.; Liang, J.; Cui, L.; Li, Q.; Zhou, S.; Huang, Y.; Li, G.; Zhao, Y. A Fe3O4@Au-Basedpseudo-Homogeneous Electrochemical Immunosensor for AFP Measurement Using AFP Antibody-GNPs-HRP as Detection Probe. Anal. Biochem. 2017, 534, 56–63. [Google Scholar] [CrossRef] [PubMed]
  25. Fang, X.; Li, X.Q.; Wang, H.; Wu, X.M.; Wang, G.L. Tuning Surface States to Achieve the Modulated Fluorescence of Carbon Dots for Probing the Activity of Alkaline Phosphatase and Immunoassay of A-Fetoprotein. Sens. Actuators B Chem. 2018, 257, 620–628. [Google Scholar] [CrossRef]
  26. Fan, F.; Shen, H.; Zhang, G.; Jiang, X.; Kang, X. Chemiluminescence Immunoassay Based on Microfluidic Chips for α-Fetoprotein. Clin. Chim. Acta 2014, 431, 113–117. [Google Scholar] [CrossRef]
  27. Zheng, X.; Hua, X.; Qiao, X.; Xia, F.; Tian, D.; Zhou, C. Simple and Signal-off Electrochemiluminescence Immunosensor for Alpha Fetoprotein Based on Gold Nanoparticle-Modified Graphite-like Carbon Nitride Nanosheet Nanohybrids. RSC Adv. 2016, 6, 21308–21316. [Google Scholar] [CrossRef]
  28. Preechakasedkit, P.; Siangproh, W.; Khongchareonporn, N.; Ngamrojanavanich, N.; Chailapakul, O. Development of an Automated Wax-Printed Paper-Based Lateral Flow Device for Alpha-Fetoprotein Enzyme-Linked Immunosorbent Assay. Biosens. Bioelectron. 2018, 102, 27–32. [Google Scholar] [CrossRef]
  29. Wangkam, T.; Boonperm, K.; Khomkrachang, P.; Srikhirin, T.; Praphanphoj, V.; Sutapan, B.; Somboonkaew, A.; Amarit, R. Hepatocellular Carcinoma Biomarker Detection by Surface Plasmon Resonance Sensor. Adv. Mater. Res. 2015, 1131, 84–87. [Google Scholar] [CrossRef]
  30. Yang, S.; Zhang, F.; Wang, Z.; Liang, Q. A Graphene Oxide-Based Label-Free Electrochemical Aptasensor for the Detection of Alpha-Fetoprotein. Biosens. Bioelectron. 2018, 112, 186–192. [Google Scholar] [CrossRef]
  31. Niu, Y.; Yang, T.; Ma, S.; Peng, F.; Yi, M.; Wan, M.; Mao, C.; Shen, J. Label-Free Immunosensor Based on Hyperbranched Polyester for Specific Detection of α-Fetoprotein. Biosens. Bioelectron. 2017, 92, 1–7. [Google Scholar] [CrossRef]
  32. Chen, X.; Xu, W.; Jiang, Y.; Pan, G.; Zhou, D.; Zhu, J.; Wang, H.; Chen, C.; Li, D.; Song, H. A Novel Upconversion Luminescence Derived Photoelectrochemical Immunoassay: Ultrasensitive Detection to Alpha-Fetoprotein. Nanoscale 2017, 9, 16357–16364. [Google Scholar] [CrossRef] [PubMed]
  33. Do, P.Q.T.; Huong, V.T.; Phuong, N.T.T.; Nguyen, T.H.; Ta, H.K.T.; Ju, H.; Phan, T.B.; Phung, V.D.; Trinh, K.T.L.; Tran, N.H.T. The Highly Sensitive Determination of Serotonin by Using Gold Nanoparticles (Au NPs) with a Localized Surface Plasmon Resonance (LSPR) Absorption Wavelength in the Visible Region. RSC Adv. 2020, 10, 30858–30869. [Google Scholar] [CrossRef] [PubMed]
  34. Huong, V.T.; Van Tran, V.; Lee, N.Y.; Van Hoang, D.; Loan Trinh, K.T.; Phan, T.B.; Thi Tran, N.H. Bimetallic Thin-Film Combination of Surface Plasmon Resonance-Based Optical Fiber Cladding with the Polarizing Homodyne Balanced Detection Method and Biomedical Assay Application. Langmuir 2020, 36, 9967–9976. [Google Scholar] [CrossRef]
  35. Tran, N.H.T.; Trinh, K.T.L.; Lee, J.H.; Yoon, W.J.; Ju, H. Reproducible Enhancement of Fluorescence by Bimetal Mediated Surface Plasmon Coupled Emission for Highly Sensitive Quantitative Diagnosis of Double-Stranded DNA. Small 2018, 14, 1801385–1801395. [Google Scholar] [CrossRef]
  36. Fornasiero, D.; Grieser, F. Analysis of the Visible Absorption and SERS Excitation Spectra of Silver Sols. J. Chem. Phys. 1987, 87, 3213–3217. [Google Scholar] [CrossRef]
  37. Halas, N. Playing with Plasmons: Tuning the Optical Resonant Properties of Metallic Nanoshells. MRS Bull. 2005, 30, 362–367. [Google Scholar] [CrossRef]
  38. Nordlander, P.J. Plasmon Hybridization in Metallic Nanostructures. Nano Lett. 2004, 4, 2209–2213. [Google Scholar] [CrossRef]
  39. Schick, I.; Gehrig, D.; Montigny, M.; Balke, B.; Panthöfer, M.; Henkel, A.; Laquai, F.; Tremel, W. Effect of Charge Transfer in Magnetic-Plasmonic Au@MOx (M = Mn, Fe) Heterodimers on the Kinetics of Nanocrystal Formation. Chem. Mater. 2015, 27, 4877–4884. [Google Scholar] [CrossRef]
  40. Homola, J. On the Sensitivity of Surface Plasmon Resonance Sensors with Spectral Interrogation. Sens. Actuators B Chem. 1997, 41, 207–211. [Google Scholar] [CrossRef]
  41. Liu, Y.; Kou, Q.; Wang, D.; Chen, L.; Sun, Y.; Lu, Z.; Zhang, Y.; Wang, Y.; Yang, J.; Xing, S.G. Rational Synthesis and Tailored Optical and Magnetic Characteristics of Fe3O4–Au Composite Nanoparticles. J. Mater. Sci. 2017, 52, 10163–10174. [Google Scholar] [CrossRef]
  42. Zhu, N.; Ji, H.; Yu, P.; Niu, J.; Farooq, M.U.; Akram, M.W.; Udego, I.O.; Li, H.; Niu, X. Surface Modification of Magnetic Iron Oxide Nanoparticles. Nanomaterials 2018, 8, 810. [Google Scholar] [CrossRef] [PubMed]
  43. Ibrahim, M.; Nada, A.; Kamal, D.E. Density Functional Theory and FTIR Spectroscopic Study of Carboxyl Group. Indian J. Pure Appl. Phys. 2005, 34, 911–917. [Google Scholar]
  44. Ji, X.; Song, X.; Li, J.; Bai, Y.; Yang, W.; Peng, X. Size Control of Gold Nanocrystals in Citrate Reduction:  The Third Role of Citrate. J. Am. Chem. Soc. 2007, 129, 13939–13948. [Google Scholar] [CrossRef] [PubMed]
  45. Yang, K.; Peng, H.; Wen, Y.; Li, N. Re-Examination of Characteristic FTIR Spectrum of Secondary Layer in Bilayer Oleic Acid-Coated Fe3O4 Nanoparticles. Appl. Surf. Sci. 2010, 256, 3093–3097. [Google Scholar] [CrossRef]
  46. Ghosh, D.; Chattopadhyay, N. Gold Nanoparticles: Acceptors for Efficient Energy Transfer from the Photoexcited Fluorophores. Opt. Photonics J. 2013, 3, 18–26. [Google Scholar] [CrossRef] [Green Version]
  47. Kwok, D.Y.; Neumann, A.W. Contact Angle Measurement and Contact Angle Interpretation. Adv. Colloid Interface Sci. 1999, 81, 167–249. [Google Scholar] [CrossRef]
  48. Ben Haddada, M.; Blanchard, J.; Casale, S.; Krafft, J.-M.; Vallée, A.; Méthivier, C.; Boujday, S. Optimizing the Immobilization of Gold Nanoparticles on Functionalized Silicon Surfaces: Amine- vs. Thiol-Terminated Silane. Gold Bull. 2013, 46, 335–341. [Google Scholar] [CrossRef] [Green Version]
  49. Ding, D.; Yan, X.; Zhang, X.; He, Q.; Qiu, B.; Jiang, D.; Wei, H.; Guo, J.; Umar, A.; Sun, L.; et al. Preparation and Enhanced Properties of Fe3O4 Nanoparticles Reinforced Polyimide Nanocomposites. Superlattices Microstruct. 2015, 85, 305–320. [Google Scholar] [CrossRef] [Green Version]
  50. Smith, T. The Hydrophilic Nature of a Clean Gold Surface. J. Colloid Interface Sci. 1980, 75, 51–55. [Google Scholar] [CrossRef]
  51. Ruíz-Baltazar, A.; Esparza, R.; Rosas, G.; Perez-Campos, R. Effect of the Surfactant on the Growth and Oxidation of Iron Nanoparticles. J. Nanomater. 2015, 2015, 240948. [Google Scholar] [CrossRef]
  52. Krishnamurthy, S.; Esterle, A.; Sharma, N.C.; Sahi, S. V Yucca-Derived Synthesis of Gold Nanomaterial and Their Catalytic Potential. Nanoscale Res. Lett. 2014, 9, 627. [Google Scholar] [CrossRef] [Green Version]
  53. Holzwarth, U.; Gibson, N. The Scherrer Equation versus the “Debye-Scherrer Equation”. Nat. Nanotechnol. 2011, 6, 534. [Google Scholar] [CrossRef]
  54. Mahadevan, S.; Chauhan, A.P.S. Investigation of Synthesized Nanosized Copper by Polyol Technique with Graphite Powder. Adv. Powder Technol. 2016, 27, 1852–1856. [Google Scholar] [CrossRef]
  55. Ko, H.; Singamaneni, S.; Tsukruk, V. V Nanostructured Surfaces and Assemblies as SERS Media. Small 2008, 4, 1576–1599. [Google Scholar] [CrossRef]
  56. Nasrazadani, S.; Hassani, S. Modern Analytical Techniques in Failure Analysis of Aerospace, Chemical, and Oil and Gas Industries. In Handbook of Materials Failure Analysis with Case Studies from the Oil and Gas Industry; Elsevier: Amsterdam, The Netherlands, 2016; Volume 2, pp. 39–54. [Google Scholar]
  57. Dabiri, M.; Lehi, N.; Movahed, S. Fe3O4@RGO@Au@C Composite with Magnetic Core and Au Enwrapped in Double-Shelled Carbon: An Excellent Catalyst in the Reduction of Nitroarenes and Suzuki–Miyaura Cross-Coupling. Catal. Lett. 2016, 146, 1647–1686. [Google Scholar] [CrossRef]
  58. Zeng, Y.; Hao, R.; Xing, B.; Hou, Y.; Xu, Z. One-Pot Synthesis of Fe3O4 Nanoprisms with Controlled Electrochemical Properties. Chem. Commun. 2010, 46, 3920–3922. [Google Scholar] [CrossRef]
  59. Singh, S.; Pasricha, R.; Bhatta, U.M.; Satyam, P.V.; Sastry, M.; Prasad, B.L. V Effect of Halogen Addition to Monolayer Protected Gold Nanoparticles. J. Mater. Chem. 2007, 17, 1614–1619. [Google Scholar] [CrossRef]
  60. Liu, X.; Shao, Y.; Tang, Y.; Yao, K. Highly Uniform and Reproducible Surface Enhanced Raman Scattering on Air-Stable Metallic Glassy Nanowire Array. Sci. Rep. 2014, 4, 5835. [Google Scholar] [CrossRef] [Green Version]
  61. Lin, S.; Hasi, W.-L.-J.; Lin, X.; Han, S.; Lou, X.-T.; Yang, F.; Lin, D.-Y.; Lu, Z.-W. Rapid and Sensitive SERS Method for Determination of Rhodamine B in Chili Powder with Paper-Based Substrates. Anal. Methods 2015, 7, 5289–5294. [Google Scholar] [CrossRef]
  62. Fang, C.; Agarwal, A.; Buddharaju, K.; Khalid, N.; Shaik, S.; Widjaja, E.; Garland, M.; Balasubramanian, N.; Kwong, D.-L. DNA Detection Using Nanostructured SERS Substrates with Rhodamine B as Raman Label. Biosens. Bioelectron. 2008, 24, 216–221. [Google Scholar] [CrossRef]
  63. Leech, J.W. The Feynman Lectures on Physics; Addison-Wesley Pub. Co., Ltd.: Boston, MA, USA, 1966; Volume 17, ISBN 9780465024148. [Google Scholar]
  64. Ma, Y.; Yang, L.; Yang, Y.; Peng, Y.; Wei, Y.; Huang, Z. Multifunctional Ag-Decorated g-C3N4 Nanosheets as Recyclable SERS Substrates for CV and RhB Detection. RSC Adv. 2018, 8, 22095–22102. [Google Scholar] [CrossRef] [Green Version]
  65. Chook, S.W.; Chia, C.H.; Chan, C.H.; Chin, S.X.; Zakaria, S.; Sajab, M.S.; Huang, N.M. A Porous Aerogel Nanocomposite of Silver Nanoparticles-Functionalized Cellulose Nanofibrils for SERS Detection and Catalytic Degradation of Rhodamine B. RSC Adv. 2015, 5, 88915–88920. [Google Scholar] [CrossRef]
  66. Yang, C.; Qing, C.; Wang, Q.; Zhang, X.; Lou, J.; Liu, Y. Synthesis of the Hybrid CdS/Au Flower-like Nanomaterials and Their SERS Application. Sens. Actuators B Chem. 2020, 304, 127218. [Google Scholar] [CrossRef]
  67. Ran, Y.; Strobbia, P.; Cupil-Garcia, V.; Vo-Dinh, T. Fiber-Optrode SERS Probes Using Plasmonic Silver-Coated Gold Nanostars. Sens. Actuators B Chem. 2019, 287, 95–101. [Google Scholar] [CrossRef]
  68. Zhao, D.; Lin, K.; Wang, L.; Qiu, Z.; Zhao, X.; Du, K.; Han, L.; Tian, F.; Chang, Y. A Physical Approach for the Estimation of the SERS Enhancement Factor through the Enrichment and Separation of Target Molecules Using Magnetic Adsorbents. RSC Adv. 2020, 10, 20028–20037. [Google Scholar] [CrossRef]
  69. Li, C.; Chen, M. Active Site-Dominated Electromagnetic Enhancement of Surface-Enhanced Raman Spectroscopy (SERS) on a Cu Triangle Plate. RSC Adv. 2020, 10, 42030–42037. [Google Scholar] [CrossRef]
  70. Wang, X.; Li, J.; Shen, Y.; Xie, A. An Assembled Ordered W18O49 Nanowire Film with High SERS Sensitivity and Stability for the Detection of RB. Appl. Surf. Sci. 2020, 504, 144073. [Google Scholar] [CrossRef]
  71. Natan, M.J. Concluding Remarks Surface Enhanced Raman Scattering. Faraday Discuss. 2006, 132, 321–328. [Google Scholar] [CrossRef]
  72. Wang, Y.; Zu, X.; Yi, G.; Luo, H.; Huang, H. Gap-Plasmon of Fe3O4@Ag Core-Shell Nanostructures for Highly Enhanced Fluorescence Detection of Rhodamine B. J. Wuhan Univ. Technol. Sci. Ed. 2017, 32, 264–271. [Google Scholar] [CrossRef]
  73. Toda, M.; Arima, Y.; Takiguchi, H.; Iwata, H. Surface Plasmon Field-Enhanced Fluorescence Spectroscopy Apparatus with a Convergent Optical System for Point-of-Care Testing. Anal. Biochem. 2014, 467, 47–53. [Google Scholar] [CrossRef] [Green Version]
  74. Lu, C.; Wei, D.; Li, G. A Fluorescence Turn-on Biosensor Based on Gold Nanoclusters and Aptamer for Alpha Fetoprotein Detection. IOP Conf. Ser. Earth Environ. Sci. 2019, 218, 12106. [Google Scholar] [CrossRef]
  75. Xu, S.; Feng, X.; Gao, T.; Liu, G.; Mao, Y.; Lin, J.; Yu, X.; Luo, X. Aptamer Induced Multicoloured Au NCs-MoS2 “Switch on” Fluorescence Resonance Energy Transfer Biosensor for Dual Color Simultaneous Detection of Multiple Tumor Markers by Single Wavelength Excitation. Anal. Chim. Acta 2017, 983, 173–180. [Google Scholar] [CrossRef] [PubMed]
  76. Li, G.; Zeng, J.; Liu, H.; Ding, P.; Liang, J.; Nie, X.; Zhou, Z. A Fluorometric Aptamer Nanoprobe for Alpha-Fetoprotein by Exploiting the FRET between 5-Carboxyfluorescein and Palladium Nanoparticles. Microchim. Acta 2019, 186, 314. [Google Scholar] [CrossRef] [PubMed]
  77. Bao, B.; Su, P.; Zhu, J.; Chen, J.; Xu, Y.; Gu, B.; Liu, Y.; Wang, L. Rapid Aptasensor Capable of Simply Detect Tumor Markers Based on Conjugated Polyelectrolytes. Talanta 2018, 190, 204–209. [Google Scholar] [CrossRef]
Figure 1. (a) A schematic of the synthesis of Fe3O4 NPs and GMPs. (b) The procedures for SERS substrate preparation and measurement.
Chemosensors 11 00056 g001
Figure 2. A schematic representation of the AFP immunosensor based on MEF with GMPs.
Chemosensors 11 00056 g002
Figure 3. (a) The UV-Vis spectra of 10−5 M Fe3O4 NPs and GMPs with various ingredient ratios compared to Au NPs, (Adapted with permission from Ref. [33]. Copyright 2020, RSC). (b) The FTIR spectra of 10−5 M Fe3O4 NPs and GMPs with different ingredient ratios. (c) The water contact angle, with images of the interface between a water drop and the modified surface at each step. (d) The XRD pattern of the Fe3O4 NPs and the 3:200 GMPs on glass compared to the Au NP simulation (JCPDS file: 04-0784).
Chemosensors 11 00056 g003
Figure 4. FESEM images of (a) Fe3O4 NPs, (b) Au NPs, and 3:200 GMPs, with scale bars indicating (c) 500 nm and (d) 1 µm.
Chemosensors 11 00056 g004
Figure 5. (a) EDX spectra of 3:200 GMPs, (b) SEM image of 3:200 GMPs, and its EDX elemental mapping of (c) O, (d) Fe, and (e) Au.
Chemosensors 11 00056 g005
Figure 6. HRTEM image of the Fe3O4 NPs (a) with the determined d spacing (b). HRTEM image of the 3:200 GMPs (c) with the determined d spacing, and (d) 3:200 GMPs respectively selected from parts (a,c) with scale bar at 5 nm. All images have 5 nm scale bars.
Chemosensors 11 00056 g006
Figure 7. (a) The SERS spectra of RhB at various concentrations. (b) The standard curve between the SERS intensity of the 1647 cm−1 peak and the various concentrations of RhB. (c) The SERS spectra of the 10−7 M and 10−10 M RhB at different positions on the GMP-coated substrates. (d) The intensities at the 1647 cm−1 peak of different spectrums, with their AVG and RSD values.
Chemosensors 11 00056 g007
Figure 8. (a) The fluorescence power measurement while increasing the AFP concentration (0.05–300 ng/mL) over time. (b) The fluorescence signals obtained with the chamber surface, where the GMPs were coated (black) or not (red), and their corresponding EF values (blue). (c) The linear fitting of the fluorescence power versus the logarithm of the AFP concentration in the range of 0.05–300 ng/mL.
Chemosensors 11 00056 g008
Table 1. The SERS assignment of rhodamine B. (Adapted with permission from Ref. [60]. Copyright 2014, nature publishing group).
Wavelength (cm−1)1647160515681513136612951203622
Assignment𝞶Aromatic C-C𝞶Aromatic C=C𝟂Aromatic C-C𝟂Aromatic C-C𝞶Aromatic C-C𝞶Bridge-band C-C𝟂Aromatic C-HXanthene ring puckering
Table 2. The other results of RhB detection using SERS.
SERS SubstratesLOD (M)EF (Fold)Ref.
GMPs3.5 × 10−122.1 × 10⁸This work
Ag-decorated g-C3N4 nanosheets10−5-*[64]
CNF-Ag NPs5 × 10−7-*[65]
CdS/Au flower-like10−8-*[66]
Ag-coated Au nanostars10−8-*[67]
Fe3O4@1G NPs with one graphene layer-*1.64 × 10⁵[68]
Cu triangle plate etched by H2O2/HCl-*4.5 × 106[69]
W18O49 nanowire film-*4.38 × 10⁵[70]
* No data available.
Table 3. Other works in AFP detection based on MEF.
SubstratesLOD
(ng/mL)
Ref
GMPs3.8 × 10−4This work
Gold-coated glass0.68[73]
Gold nanoclusters6.631[74]
Au NCs-MoS20.16[75]
Pd NPs1.38[76]
Polyfluorene-based cationic conjugated polyelectrolytes1.76[77]
Disclaimer/Publisher’s Note: The statements, opinions and data contained in all publications are solely those of the individual author(s) and contributor(s) and not of MDPI and/or the editor(s). MDPI and/or the editor(s) disclaim responsibility for any injury to people or property resulting from any ideas, methods, instructions or products referred to in the content.

