Article

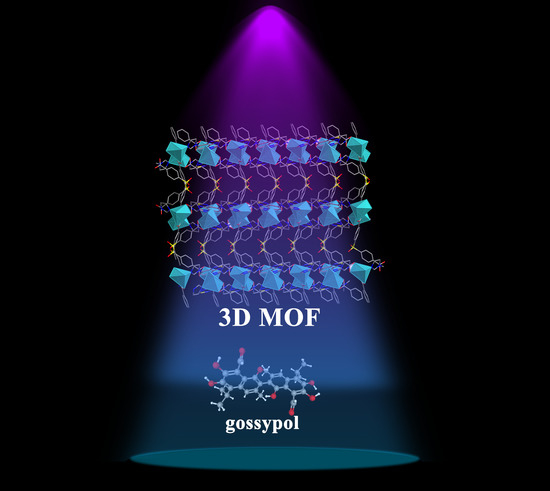
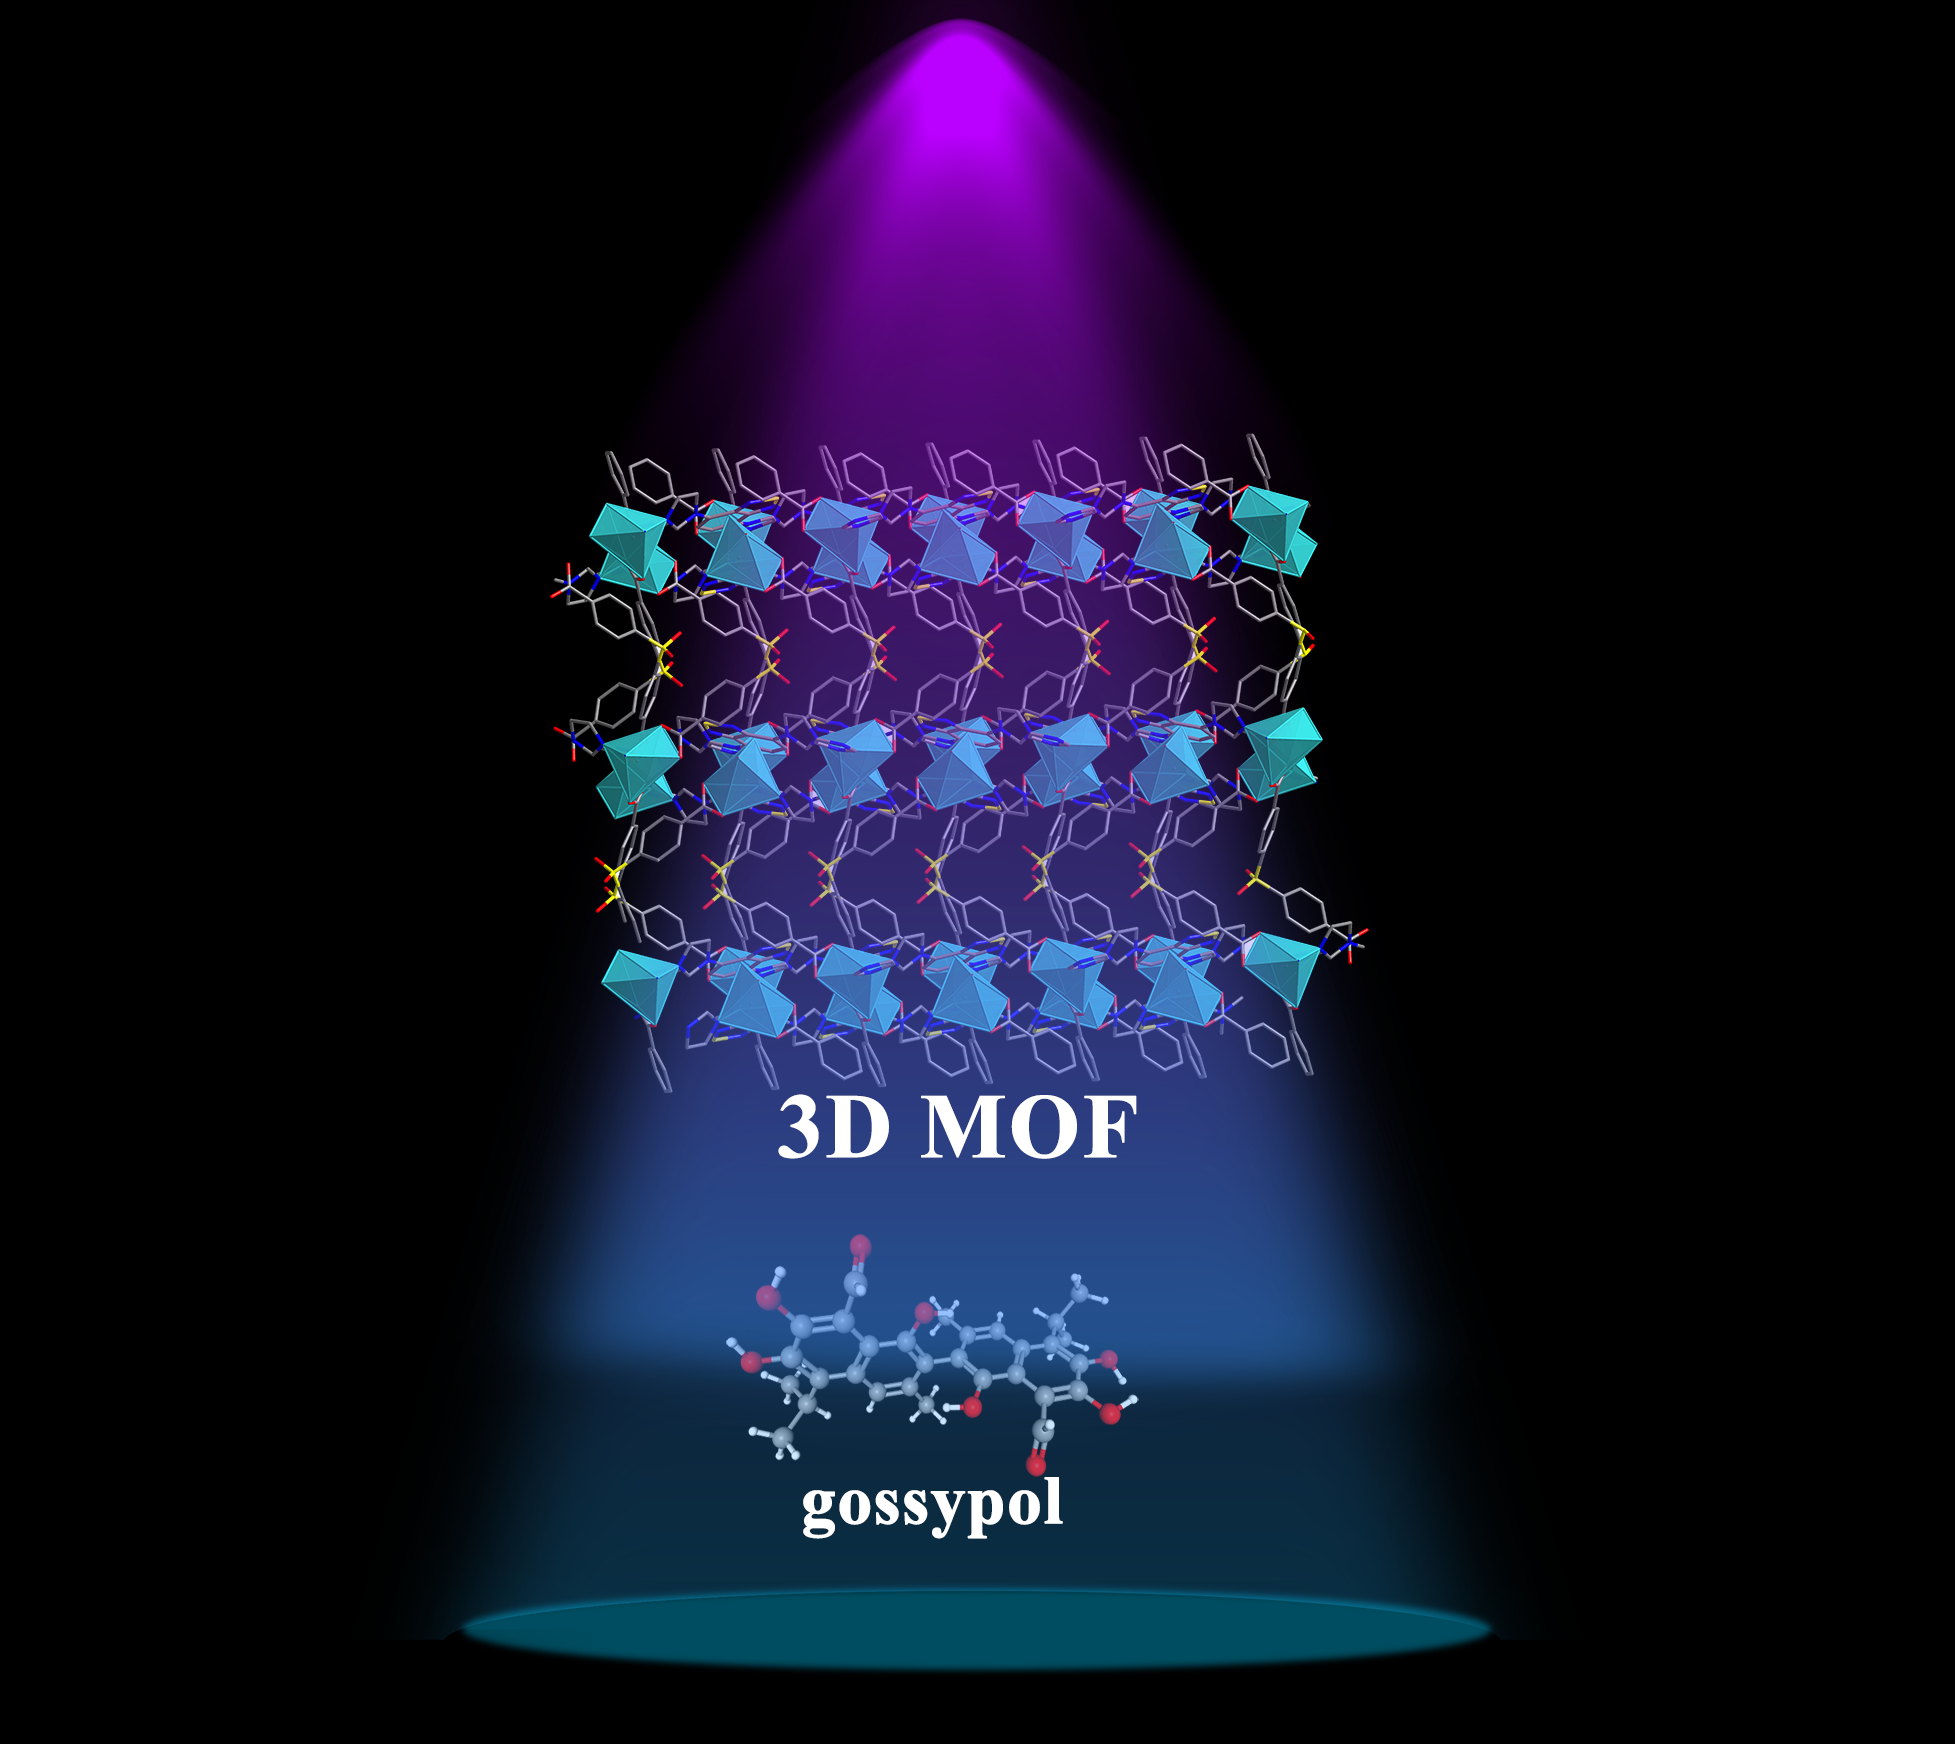
Luminescent Metal-Organic Framework with 2,1,3-Benzothiadiazole Units for Highly Sensitive Gossypol Sensing

1
Nikolaev Institute of Inorganic Chemistry, Siberian Branch of the Russian Academy of Sciences, 3 Lavrentiev Avenue, Novosibirsk 630090, Russia
2
Department of Natural Sciences, Novosibirsk State University, 2 Pirogov Str., Novosibirsk 630090, Russia
*
Author to whom correspondence should be addressed.
Chemosensors 2023, 11(1), 52; https://doi.org/10.3390/chemosensors11010052
Submission received: 30 November 2022 / Revised: 30 December 2022 / Accepted: 4 January 2023 / Published: 7 January 2023

Abstract

:
A new metal–organic framework based on cadmium(II) cations, di(p-carboxyphenyl)sulphone and 4,7-di(imidazol-1-yl)-2,1,3-benzothiadiazole was prepared, and its crystal structure was determined using single-crystal XRD analysis. MOF demonstrated bright luminescence with a maximum near 500 nm and quantum yield reaching 20%. In addition, this MOF demonstrated sensing properties towards antibiotics and a toxic natural polyphenol gossypol through effective luminescence quenching in an ethanol suspension. The determined detection limit for gossypol was among the lowest reported so far (0.65 µM), and did not significantly change in the interference experiments with cottonseed oil as background, indicating the possibility of using this MOF as a sensor for the detection and determination of gossypol in real-life samples.

Graphical Abstract

1. Introduction

Gossypol (GSP, Scheme 1) is a naturally occurring polyphenol found in cottonseeds. The high toxicity of gossypol renders cottonseeds unfit for human consumption or as animal feed for non-ruminants [1]. When cottonseeds are used in the diets of ruminant animals, gossypol can be found in derived animal products such as milk or meat [2]. Furthermore, the presence of gossypol causes great concern for the safe consumption of cottonseed oil [3]. This is a major problem for countries with large-scale cotton production, as cottonseed oil is often used as a cooking oil. Gossypol is highly toxic to humans, with exposure effects including hepatotoxicity, infertility and immunotoxicity [4]. Therefore, along with the need for additional refinement of cottonseed-derived products, development of reliable and sensitive methods for the detection of gossypol in various media is of great importance. Several methods for gossypol detection and quantification are currently employed, the most widely used being high-performance liquid chromatography (HPLC) paired with UV detection [5]. Other methods include infrared spectroscopy [6], piezoelectric imprinting [7], near-infrared spectroscopy [8] and luminescent sensing [9]. Luminescent sensing is one of the most promising methods, as it is express, robust and potentially highly selective, whilst providing a possibility for “field operation” detection without the need for complex and expensive machinery.
In the past decade, luminescent metal–organic frameworks (LMOFs) have gained significant attention as luminescent sensors due to their unique properties, such as emission tunability, high permanent porosity and the possibility of designing LMOFs for the selective detection of a specific analyte [10,11,12,13,14,15,16,17].
In this work, we present the synthesis and sensing properties of a new LMOF based on cadmium(II), di(p-carboxyphenyl)sulphone (H2dcdps) and 4,7-di(imidazol-1-yl)-2,1,3-benzothiadiazole (im2btd), the latter being the origin of the highly emissive properties of this LMOF.

2. Materials and Methods

2.1. Starting Materials and Synthetic Procedures

Im2btd ligand was obtained according to the previously reported procedure [18]. Other chemicals of at least analytical grade were purchased from commercial sources and used without additional purification.

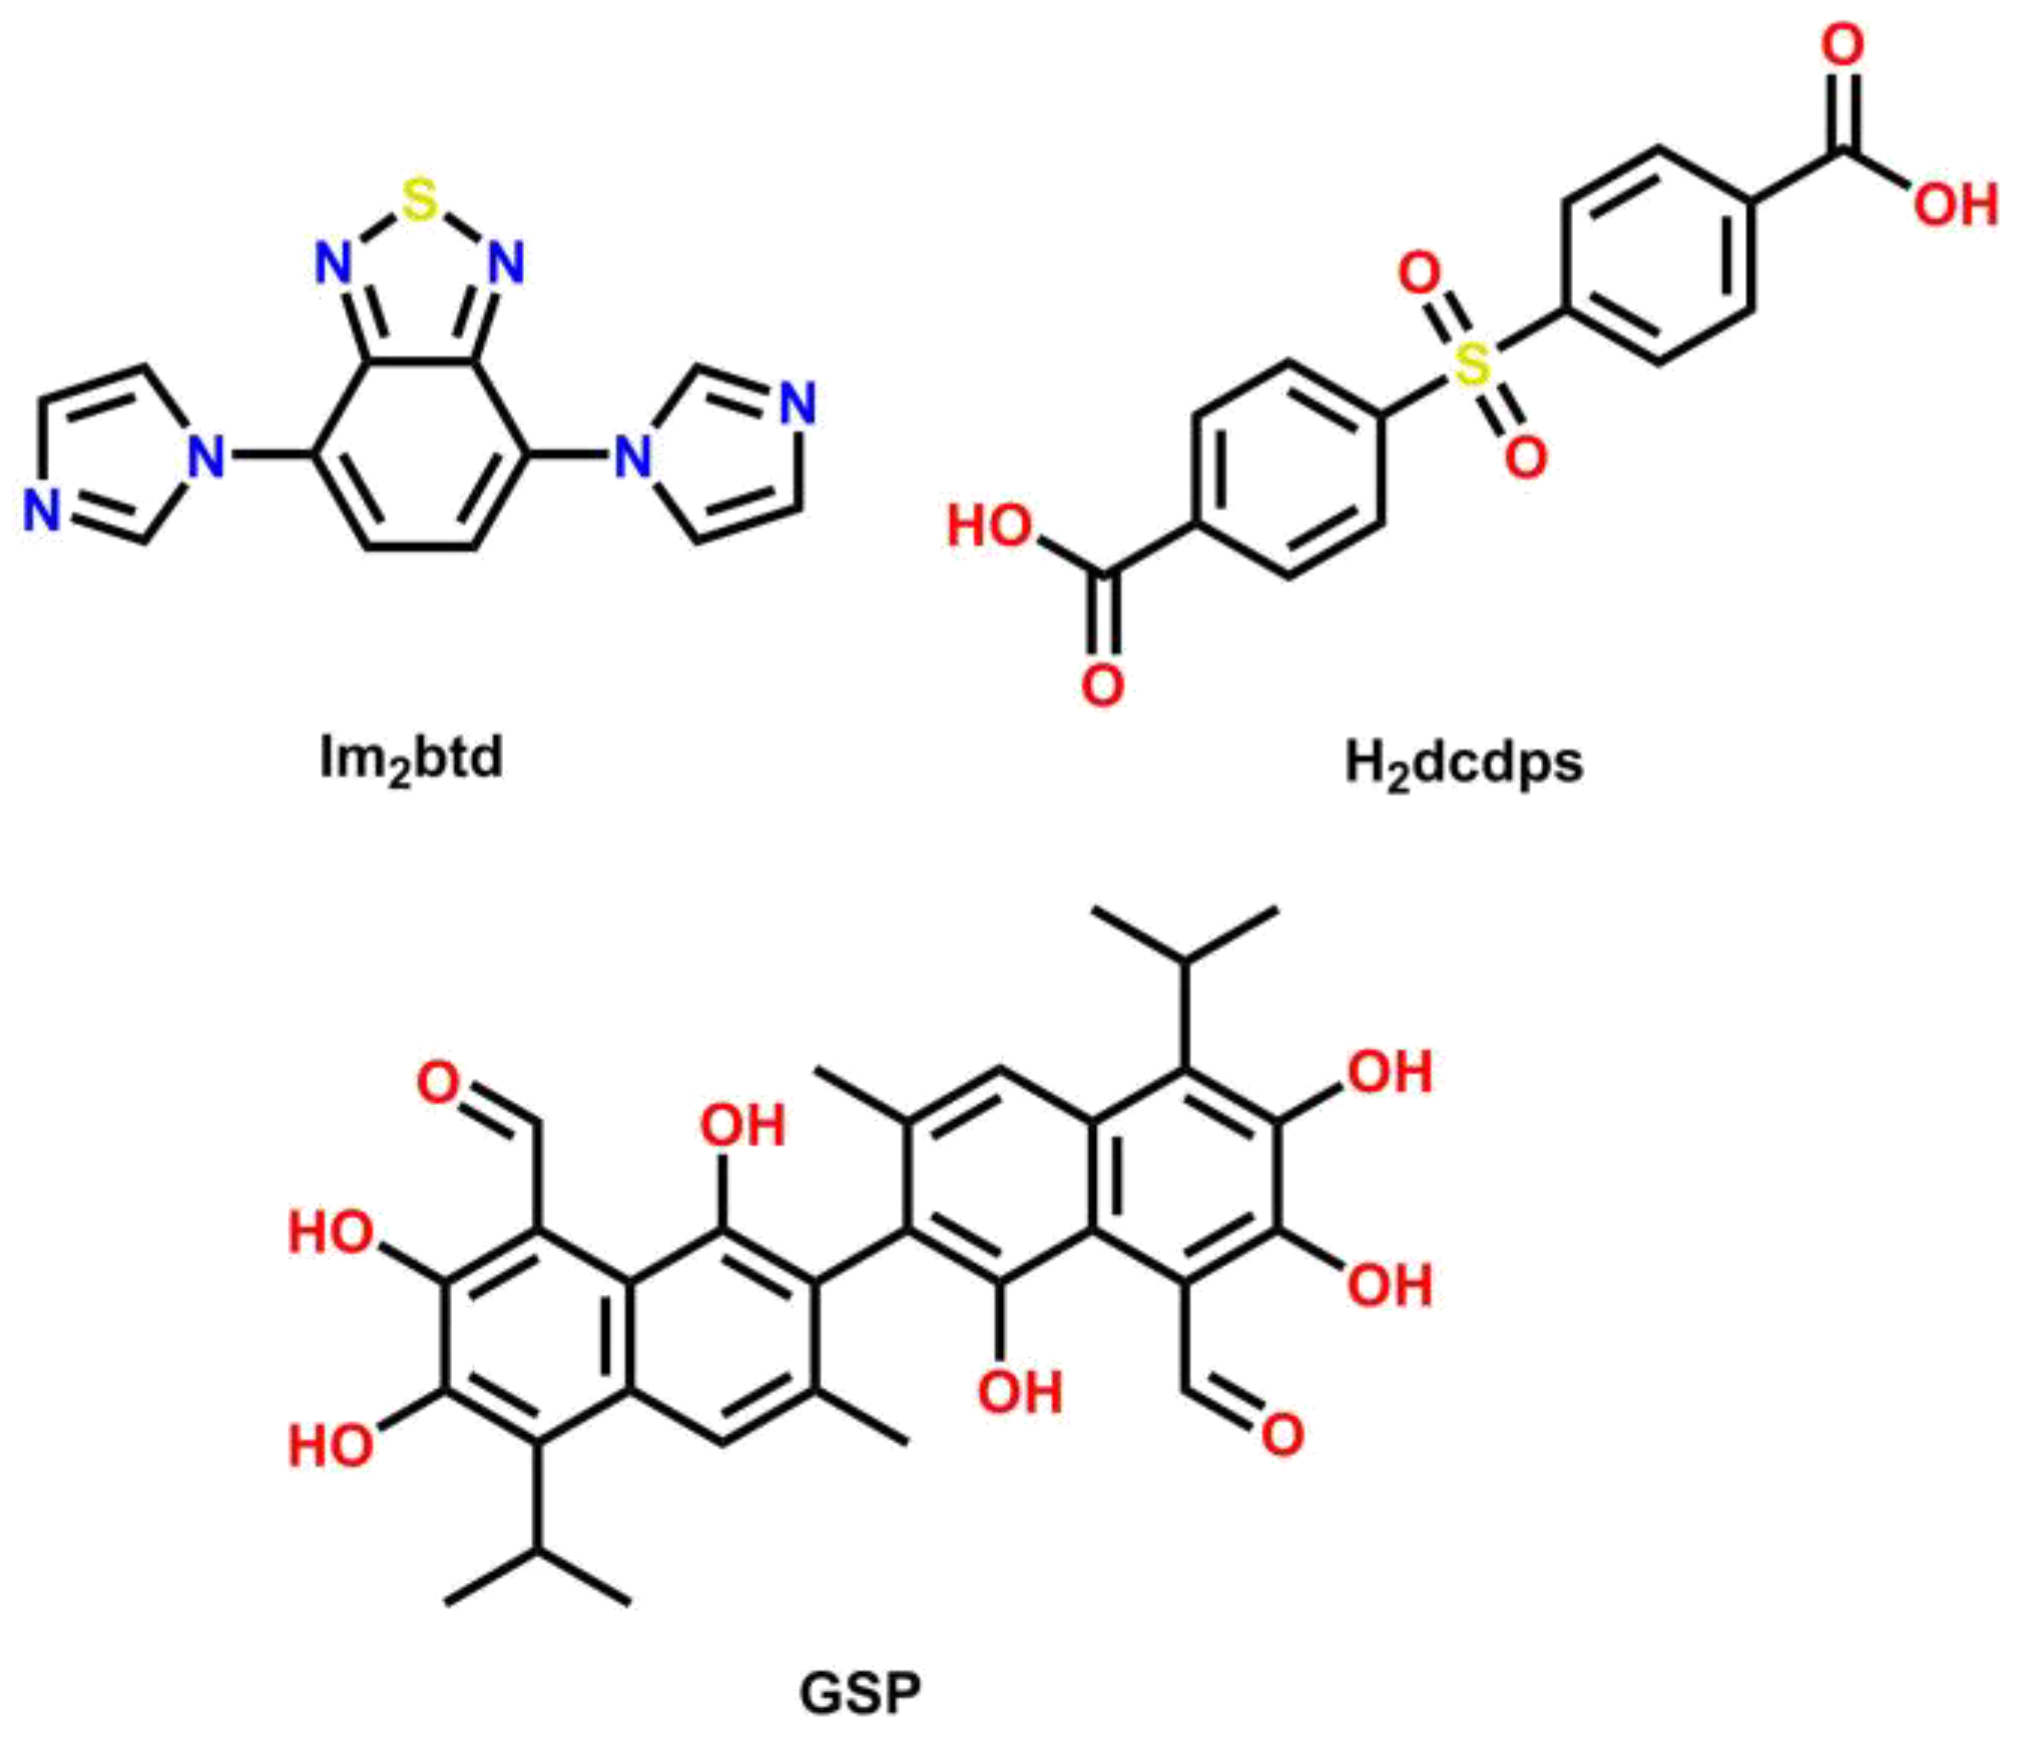
Synthesis of {[Cd(dcdps)(im2btd)]∙DMA}n (MOF 1)

A mixture of 50 mg (0.185 mmol) of im2btd, 57 mg (0.185 mmol) of H2dcdps, and 57 mg (0.185 mmol) of cadmium nitrate tetrahydrate were dissolved in 10 mL of DMA:H2O:EtOH (4:2:1) mixed solvent with sonication and heated at 100 °C for 48 h in a screw-capped glass vial. Transparent bright orange block crystals were filtered out, subsequently washed with fresh DMA and ethanol and dried in air to produce a yield of 81%. Elemental analysis C30H27CdN7O7S2; Calc.: C 46.55; H 3.52; N 12.67; S 8.28. Found: C 46.9; H 3.6; N 12.8; S 8.7. FT-IR (cm−1): 3419 (m), 3182 (m), 3142 (s), 1649 (s), 1591 (s), 1546 (s), 1519 (s), 1408 (s), 1321 (s), 1251 (m), 1161 (s), 1082 (s), 856 (m), 748 (s), 624 (s).

2.2. Physical Methods of Analysis

Elemental analysis was carried out on an automatic Vario MICRO Cube Analyzer (Elementar Analysensysteme GmbH, Langenselbold, Germany). The FT-IR spectra were recorded from 4000 cm−1 to 400 cm−1 on a Bruker Scimitar FTS 2000 spectrometer (Bruker Corporation, Billerica, MA, USA) in KBr pellets. Thermogravimetric analysis was performed on a NETZSCH TG 209 F1 Iris Thermo Microbalance (Erich NETZSCH GmbH & Co. Holding KG, Selb, Germany) in a helium atmosphere from 30 to 800 °C at a 10 °C/min heating rate. The UV-Vis absorption spectra were recorded in ethanol solutions (C 10−6 M, 10−8 M) on an SF-2000 spectrophotometer (LOMO Microsystems, Saint Petersburg, Russia). Powder X-ray diffraction (PXRD) was measured on a Bruker D8 ADVANCE diffractometer, equipped with the linear detector LYNXEYE XE-T (Bruker Corporation, Billerica, MA, USA), Cu-Kα radiation, λ = 1.5418 Å, 2θ range 3–40°, step 0.03°, with data collection for 0.5 s at each point. The samples were ground in an agate mortar with heptane and applied to the polished surface of a quartz cuvette to form a uniform layer of approximately 100 µm thickness after the evaporation of heptane.

2.2.1. Luminescence Measurements

Luminescence spectra were recorded using a HORIBA Fluorolog 3 spectrofluorimeter (HORIBA Jobin Yvon SAS, Edison, NJ, USA), using a 450 W ozone-free xenon lamp as an excitation source and a PC177CE-010 module with R2658 photomultiplier for the detection of the emitted photons. Absolute quantum yields were measured using an integrating sphere. The powdered samples were placed between two non-fluorescent quartz plates, and the spectra of ethanol suspensions were reordered in 1 cm quartz cuvettes.

2.2.2. Luminescence Sensing Experiments

Ethanol suspensions of MOF 1 were prepared according to the following procedure: 20 mg of MOF 1 were ground in an agate mortar and sonicated in 20 mL of ethanol for 30 min. Then, 500 μL of the resulting suspension was taken and diluted to 2 mL with ethanol. For the screening tests, 0.1 mM solutions of metal ions (as nitrates) and 0.01 mM solutions of antibiotics and toxic organic substances were used.
For fluorometric titration experiments, 2 mL of MOF 1 blank suspension was placed in a 1 cm quartz cuvette, and 0.1 mM gossypol acetate solution in ethanol was added in 10 μL increments. The emission spectrum was recorded after each addition at 310 nm excitation wavelength.
The limits of detection (LOD) were calculated as 3σ/Ksv, where σ is the standard deviation of five replicated luminescence intensities measured for blank suspensions and Ksv is the slope obtained from the linear fit of relative intensity quenching-concentration dependence [19].
A range of antibiotics and harmful organic substances were tested in this study: AMC = amoxicillin, MNA = metronidazole, GSP = gossypol, NFC = norfloxacin, NFT = nitrofurantoin, NFZ nitrofurazone, PCB = pentachlorobenzene, RMC = roxithromycin, SDZ = sulfadiazine and TAC = thiamphenicol.
The interference of the cottonseed oil in the fluorometric titration experiment was evaluated by adding 10 μL of refined cottonseed cooking oil as the background to the suspension of MOF 1 prepared as described above. The mixture was stirred until the oil had dissolved and the fluorometric titration was carried out in the same concentration range and increment as described for the blank suspension of MOF 1.

2.3. Single Crystal X-ray Analysis

Single crystal X-ray diffraction analysis was carried out on an automated Agilent Xcalibur diffractometer; the diffraction data was processed using CrysAlisPro package [20]. The crystal structure was solved by direct method using SHELXT [21], and refined by the full-matrix least-squares method using SHELXL [22].
The Platon SQUEEZE algorithm was used to remove the electron density associated with the disordered DMA molecules [23].

Crystal Data for MOF 1

C26H16CdN6O6S2 (M = 684.97 g/mol): monoclinic, space group C2/c, a = 23.6070(7) Å, b = 11.3468(2) Å, c = 26.3689(8) Å, β= 116.055(4)°, V = 6345.5(4) Å3, Z = 8, T = 142(3) K, μ(MoKα) = 0.12 mm−1, Dcalc = 1.434 g/cm3, 49511 reflections measured, 7697 unique (Rint = 0.024, Rsigma = 0.022). The final R1 [I > 2σ(I)] 0.022, goodness of fit S 1.027, wR2 (all data) 0.0568.

2.4. Computational Chemistry Details

The calculations were performed using Gaussian 09 package [24]. The geometry of gossypol was fully optimized using a B3LYP [25,26,27,28] 6–311+G(2d,p) [29,30,31,32] level of theory together with Grimme’s D3 empirical dispersion correction [33]. Vibrational analysis was carried out to confirm the correspondence of the optimized structure to a minimum on the potential energy surface. The coordinates of the MOF 1 model were taken from the X-ray crystal structure and included the complete coordination sphere of cadmium (II) cation with two Im2btd neutral ligands and two dcdps2− anions (Figure S1). The terminal carboxylate groups of dcdps2− anions were balanced with lithium cations to obtain a neutral model. For the MOF model, ground state single point calculations were carried out at the same level of theory as indicated above, only LANL2DZ [34,35] pseudopotential was used for Cd atoms.

3. Results and Discussion

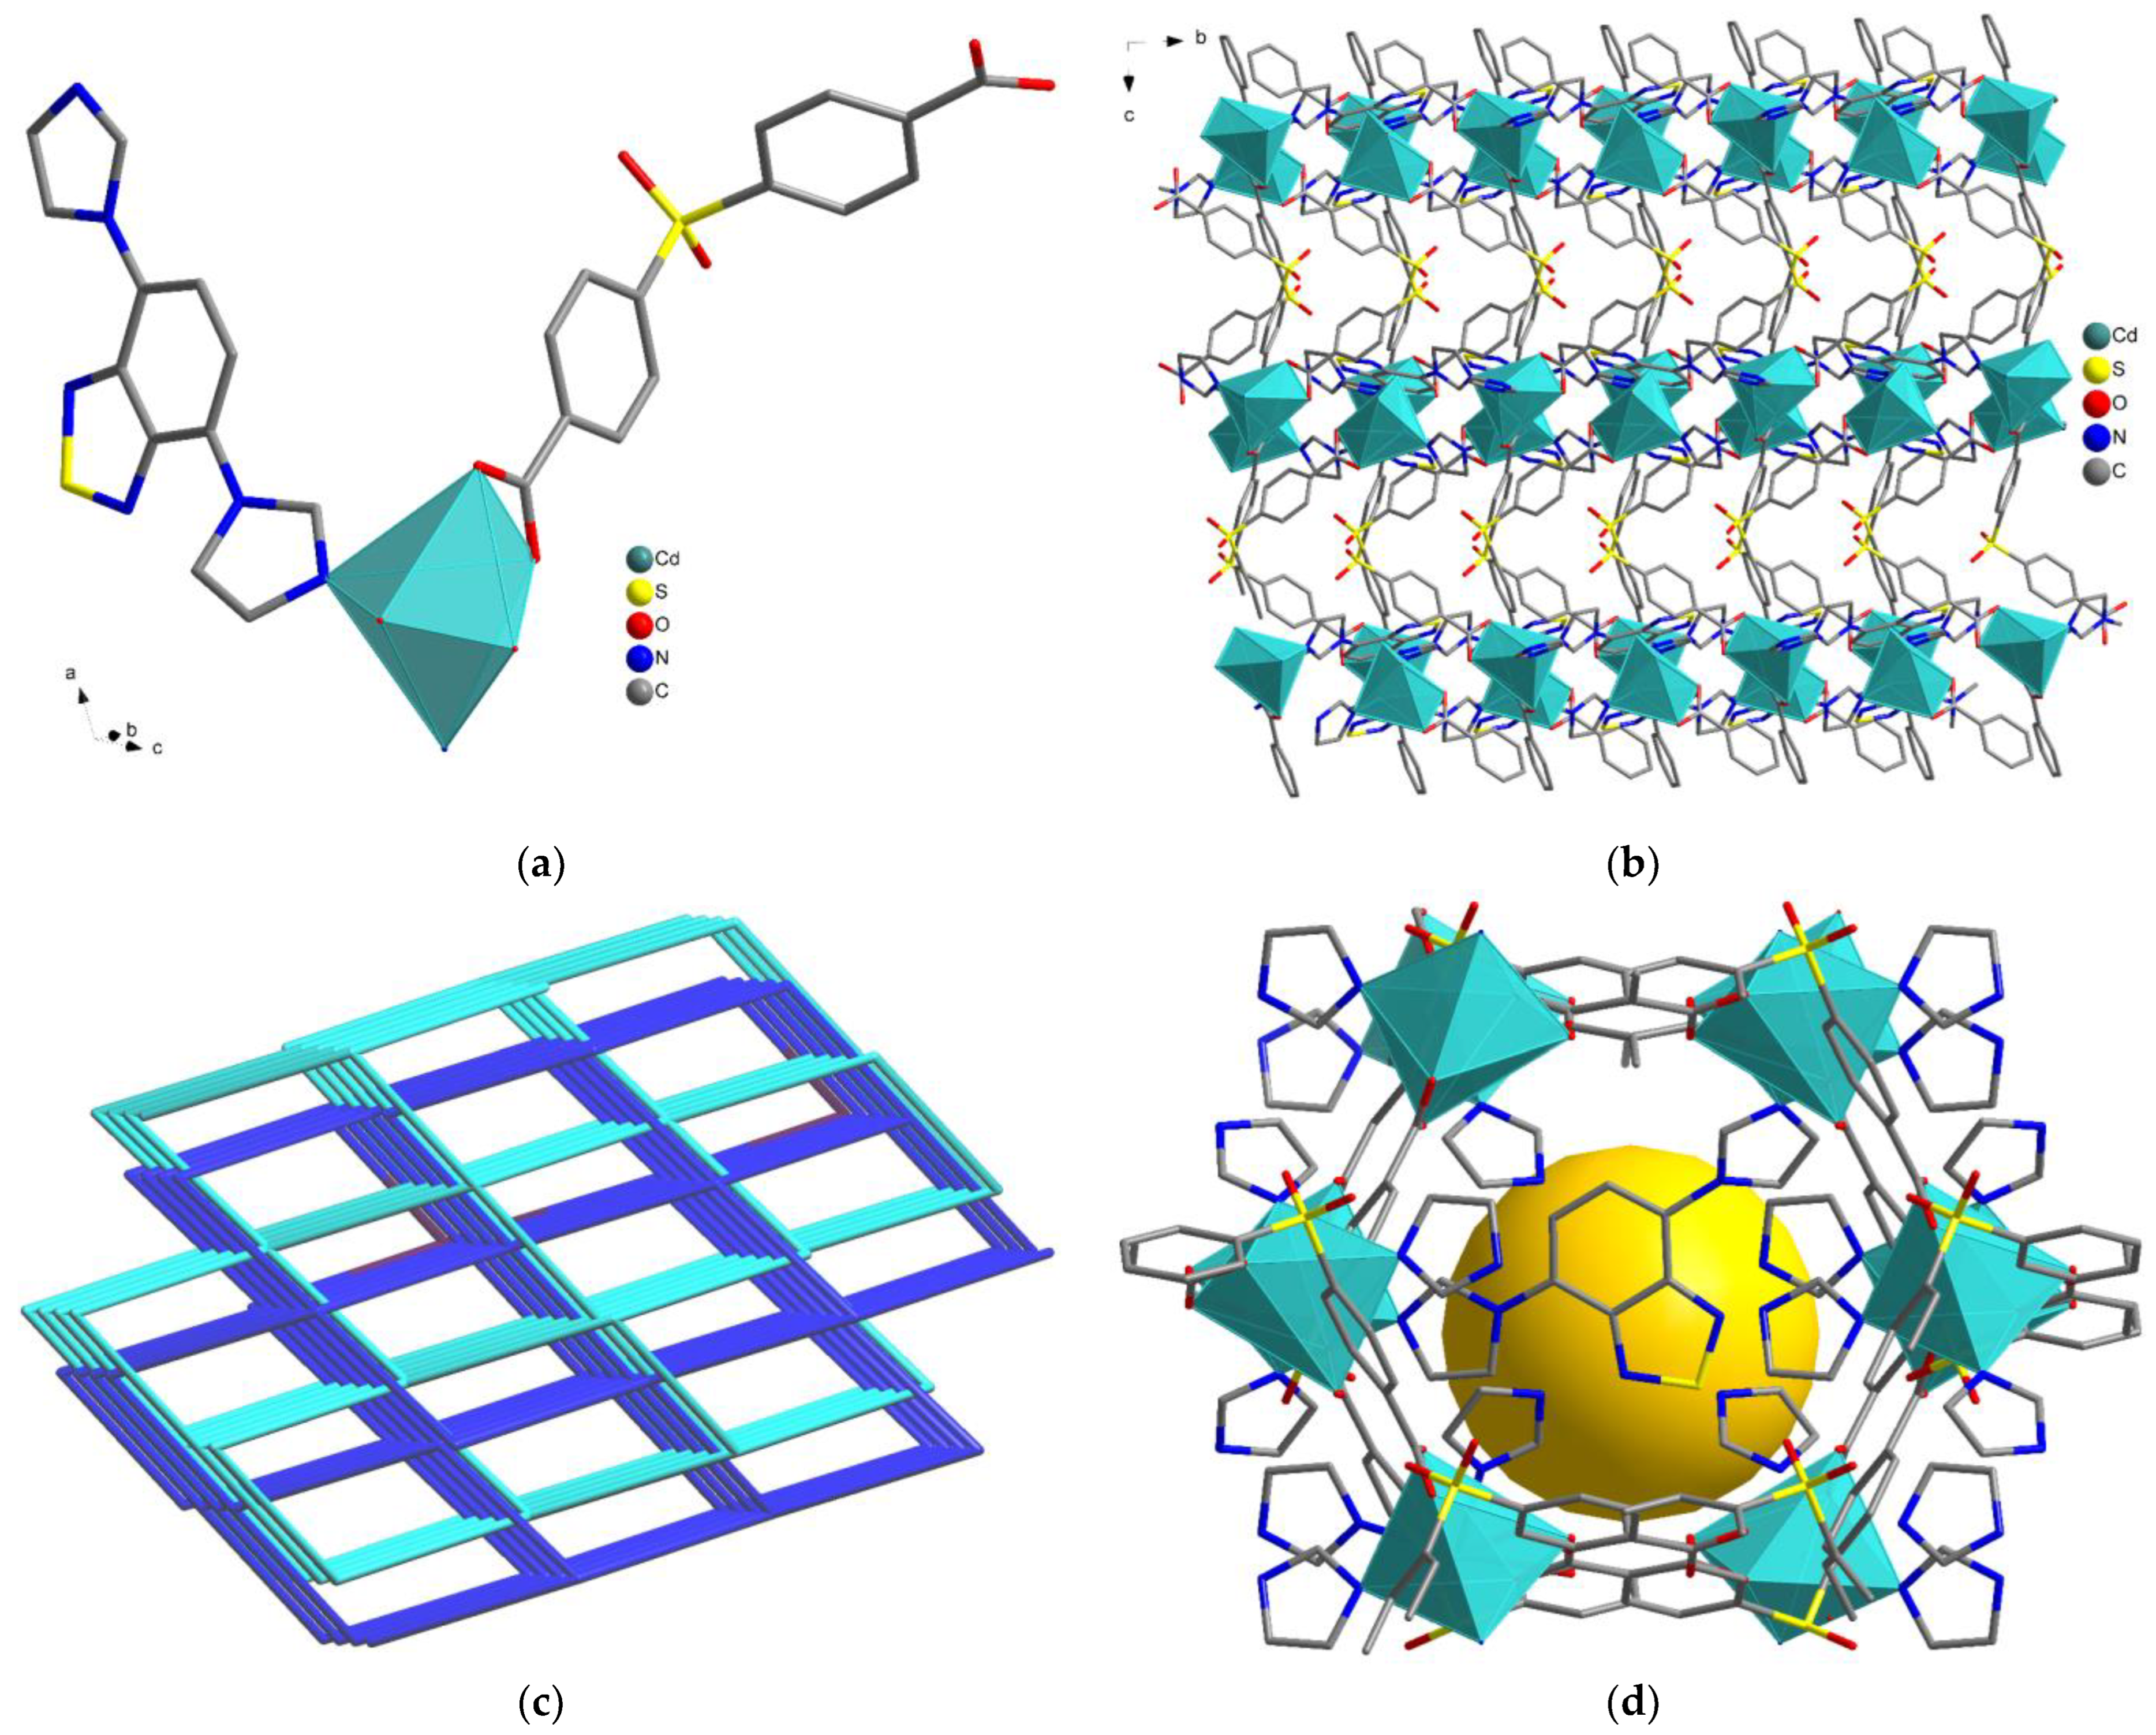
3.1. Synthesis and Crystal Structures of MOF

Single crystals of MOF 1 were prepared by the reaction of equimolar amounts of cadmium(II) nitrate tetrahydrate, di(p-carboxyphenyl)sulphone (H2dcdps) and 4,7-di(imidazol-1-yl)-2,1,3-benzothiadiazole (im2btd) in the mixture of solvents DMA:H2O:EtOH (4:2:1) under solvothermal conditions.
MOF 1 crystallizes in a monoclinic crystal system, C2/c centrosymmetric space group. The asymmetric unit contains one Cd2+ cation in a significantly distorted octahedral coordination environment. Each cadmium cation coordinates two dcdps2− ligands and two im2btd ligands (Figure 1a), which join them into two independent interpenetrated 3D nets (Figure 1b) of cds topological type [36], net point symbol 65∙8 (Figure 1c). As a result of interpenetration, large cylindrical cavities are formed in the structure of MOF 1, which in the as-synthesized compound are occupied by the disordered DMA molecules (disordered over four positions with equal site occupancy factors of 0.25). The electron density corresponding to DMA molecules was removed from the final refinement with the aid of the Platon SQUEEZE algorithm. The total electron count removed was 384 per unit cell, which corresponds to one DMA molecule per formula unit. Im2btd ligands serve as “caps” preventing access to the cavity, while the phenyl rings of dcdps2- ligands form the walls of the cavity (Figure 1d).

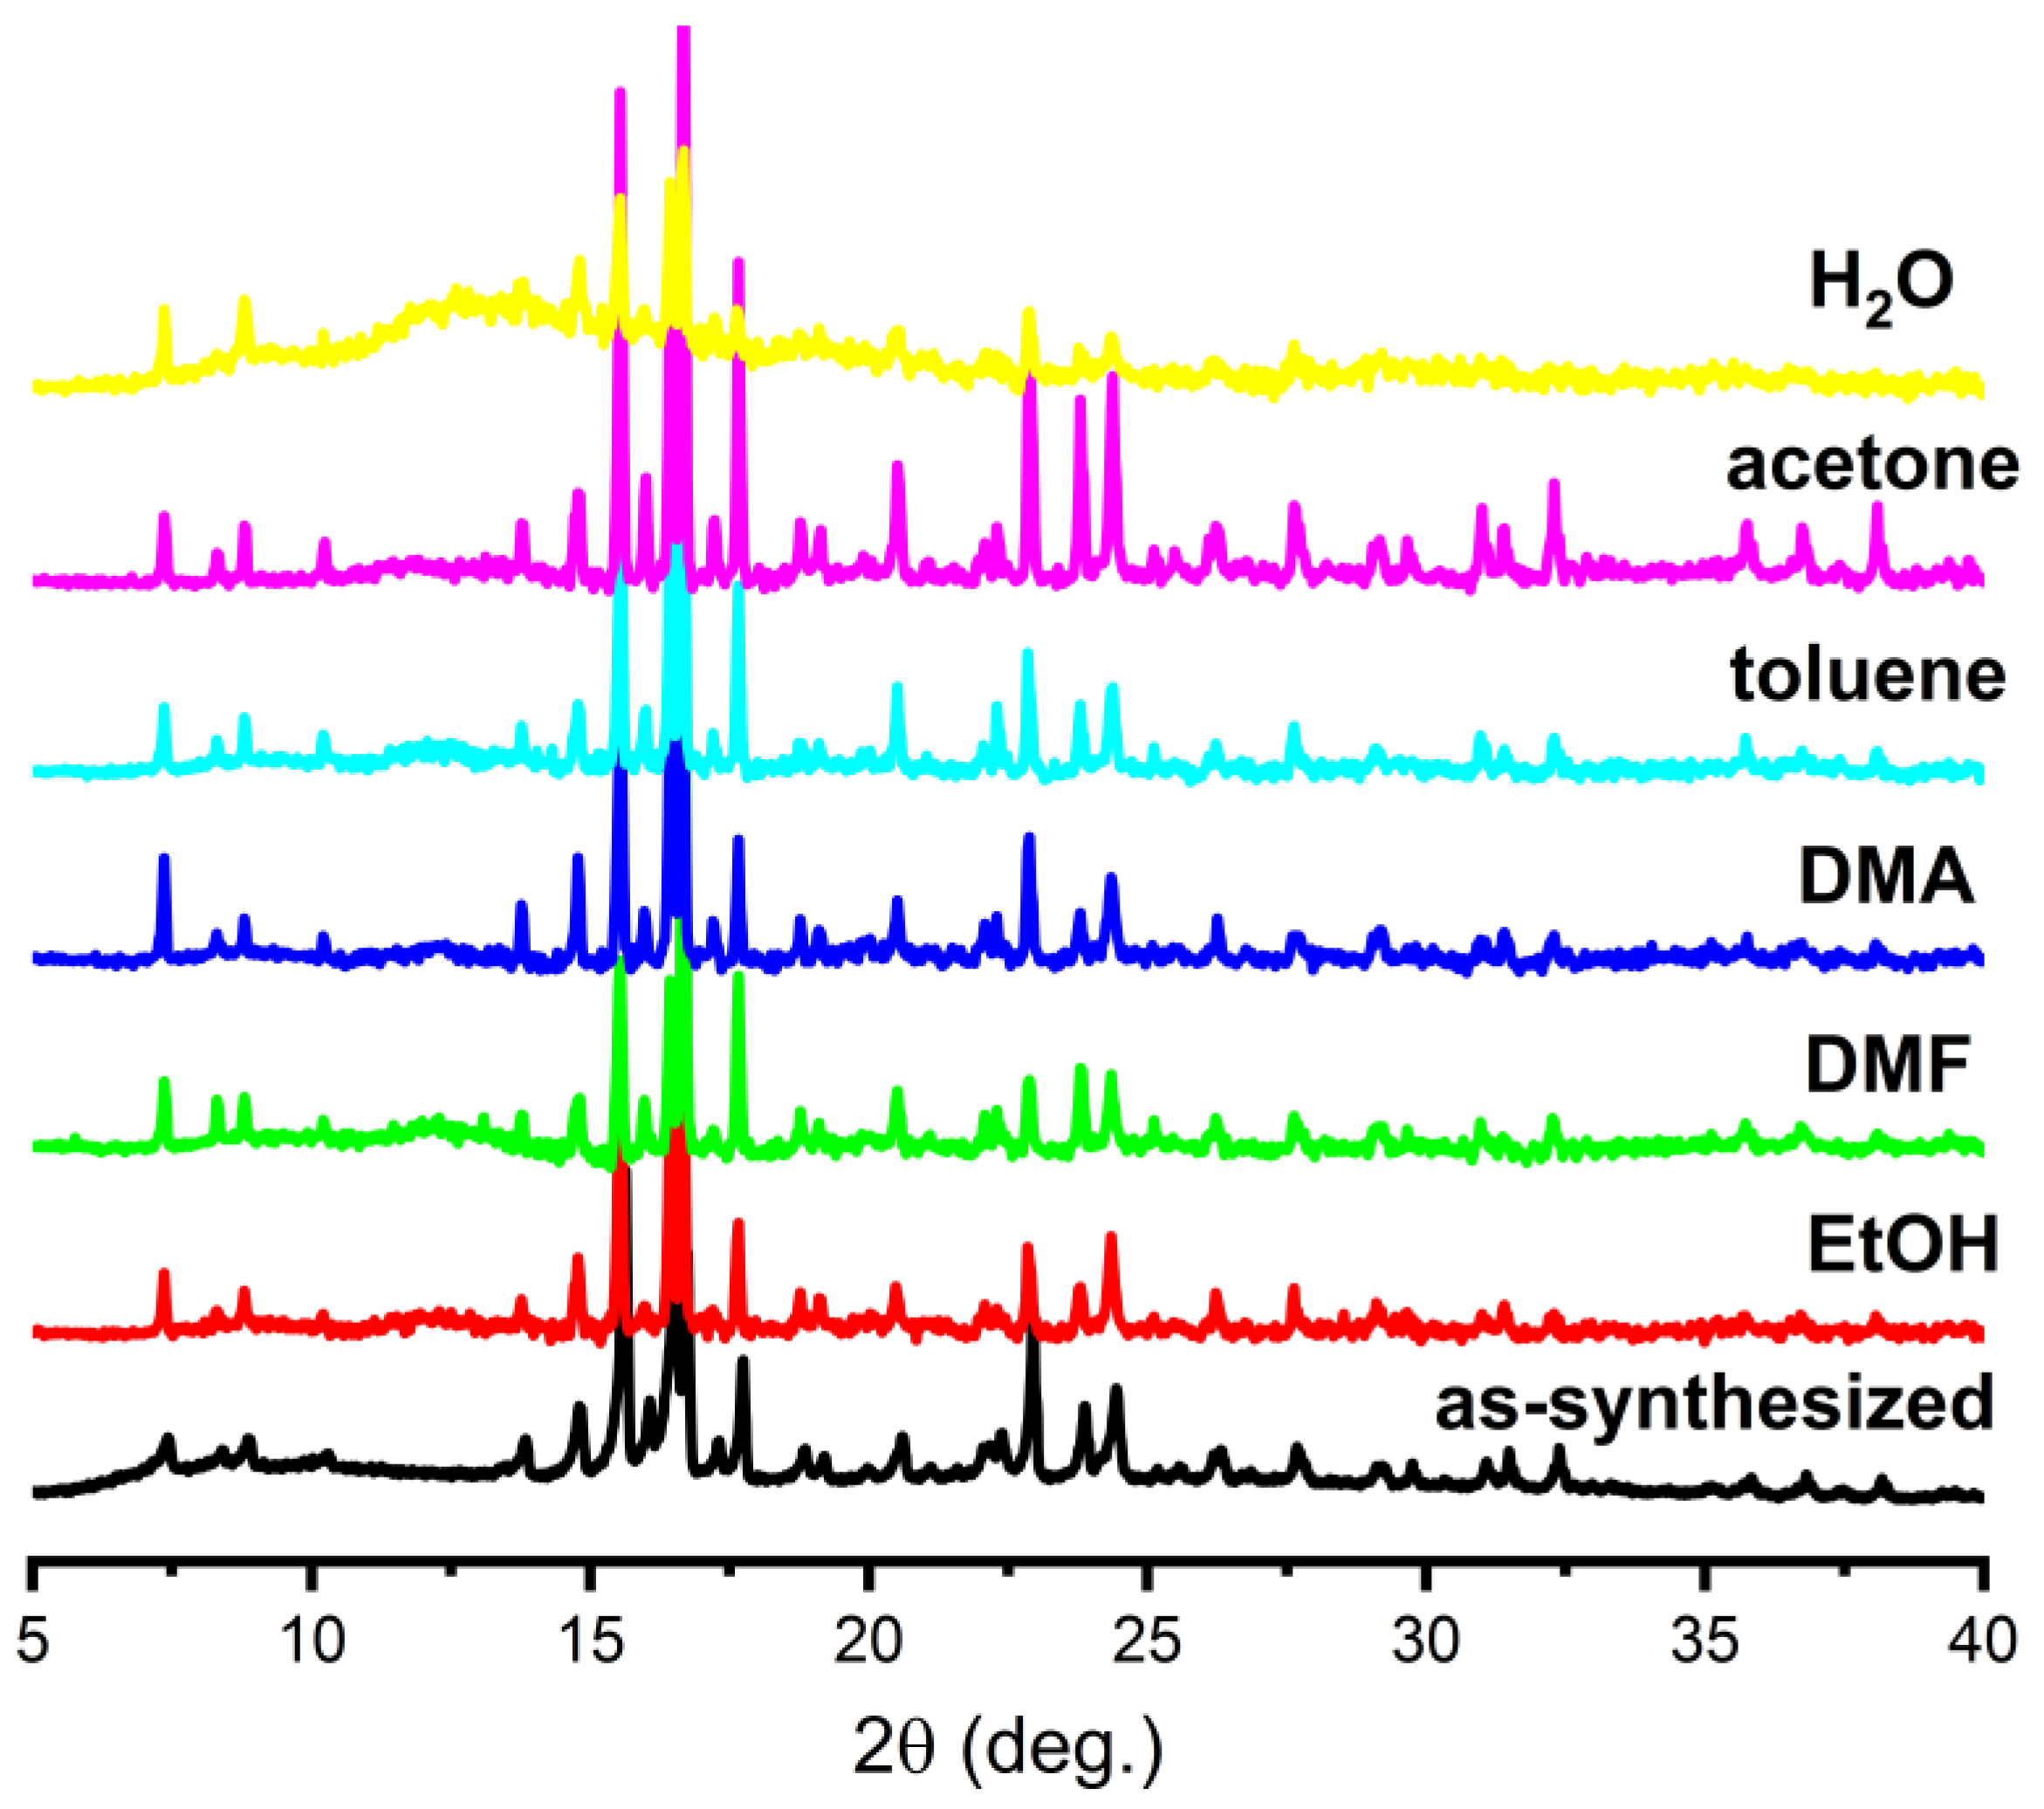
3.2. PXRD Analysis and Thermal Behaviour

To confirm the phase purity of the bulk product as well as its stability in different solvents, a PXRD technique was employed. It was found that the bulk powder of MOF 1 did not contain any impurity phases (Figure S2) and was stable in common organic solvents (Figure 2). After prolonged soaking (24 h) in distilled water, framework degradation was observed. The chemical composition of MOF 1 determined for the X-ray diffraction data corresponds well to the results of elemental (CHNS) analysis. The FT-IR spectrum of MOF 1 contains the characteristic bands of both organic ligands in accordance with its composition (Figure S3).
Thermogravimetric analysis was used to estimate the thermal stability of MOF 1 and the possibility of its activation for gas adsorption studies.
For MOF 1, no significant mass loss was observed up to 300 °C, in accordance with the presence of only closed cavities in its structure. Solvent loss (Δm 17%) occurred in a narrow temperature range of 300–310 °C (Figure S4). A plateau was observed on the TG curve of MOF 1 in the range of 310–370 °C, after which a quick framework degradation took place. Despite the presence of a plateau on the TG curve, all attempts at MOF 1 activation have failed, as heating the framework to the required temperature in vacuo results in the sublimation of the im2btd ligand from the MOF structure.

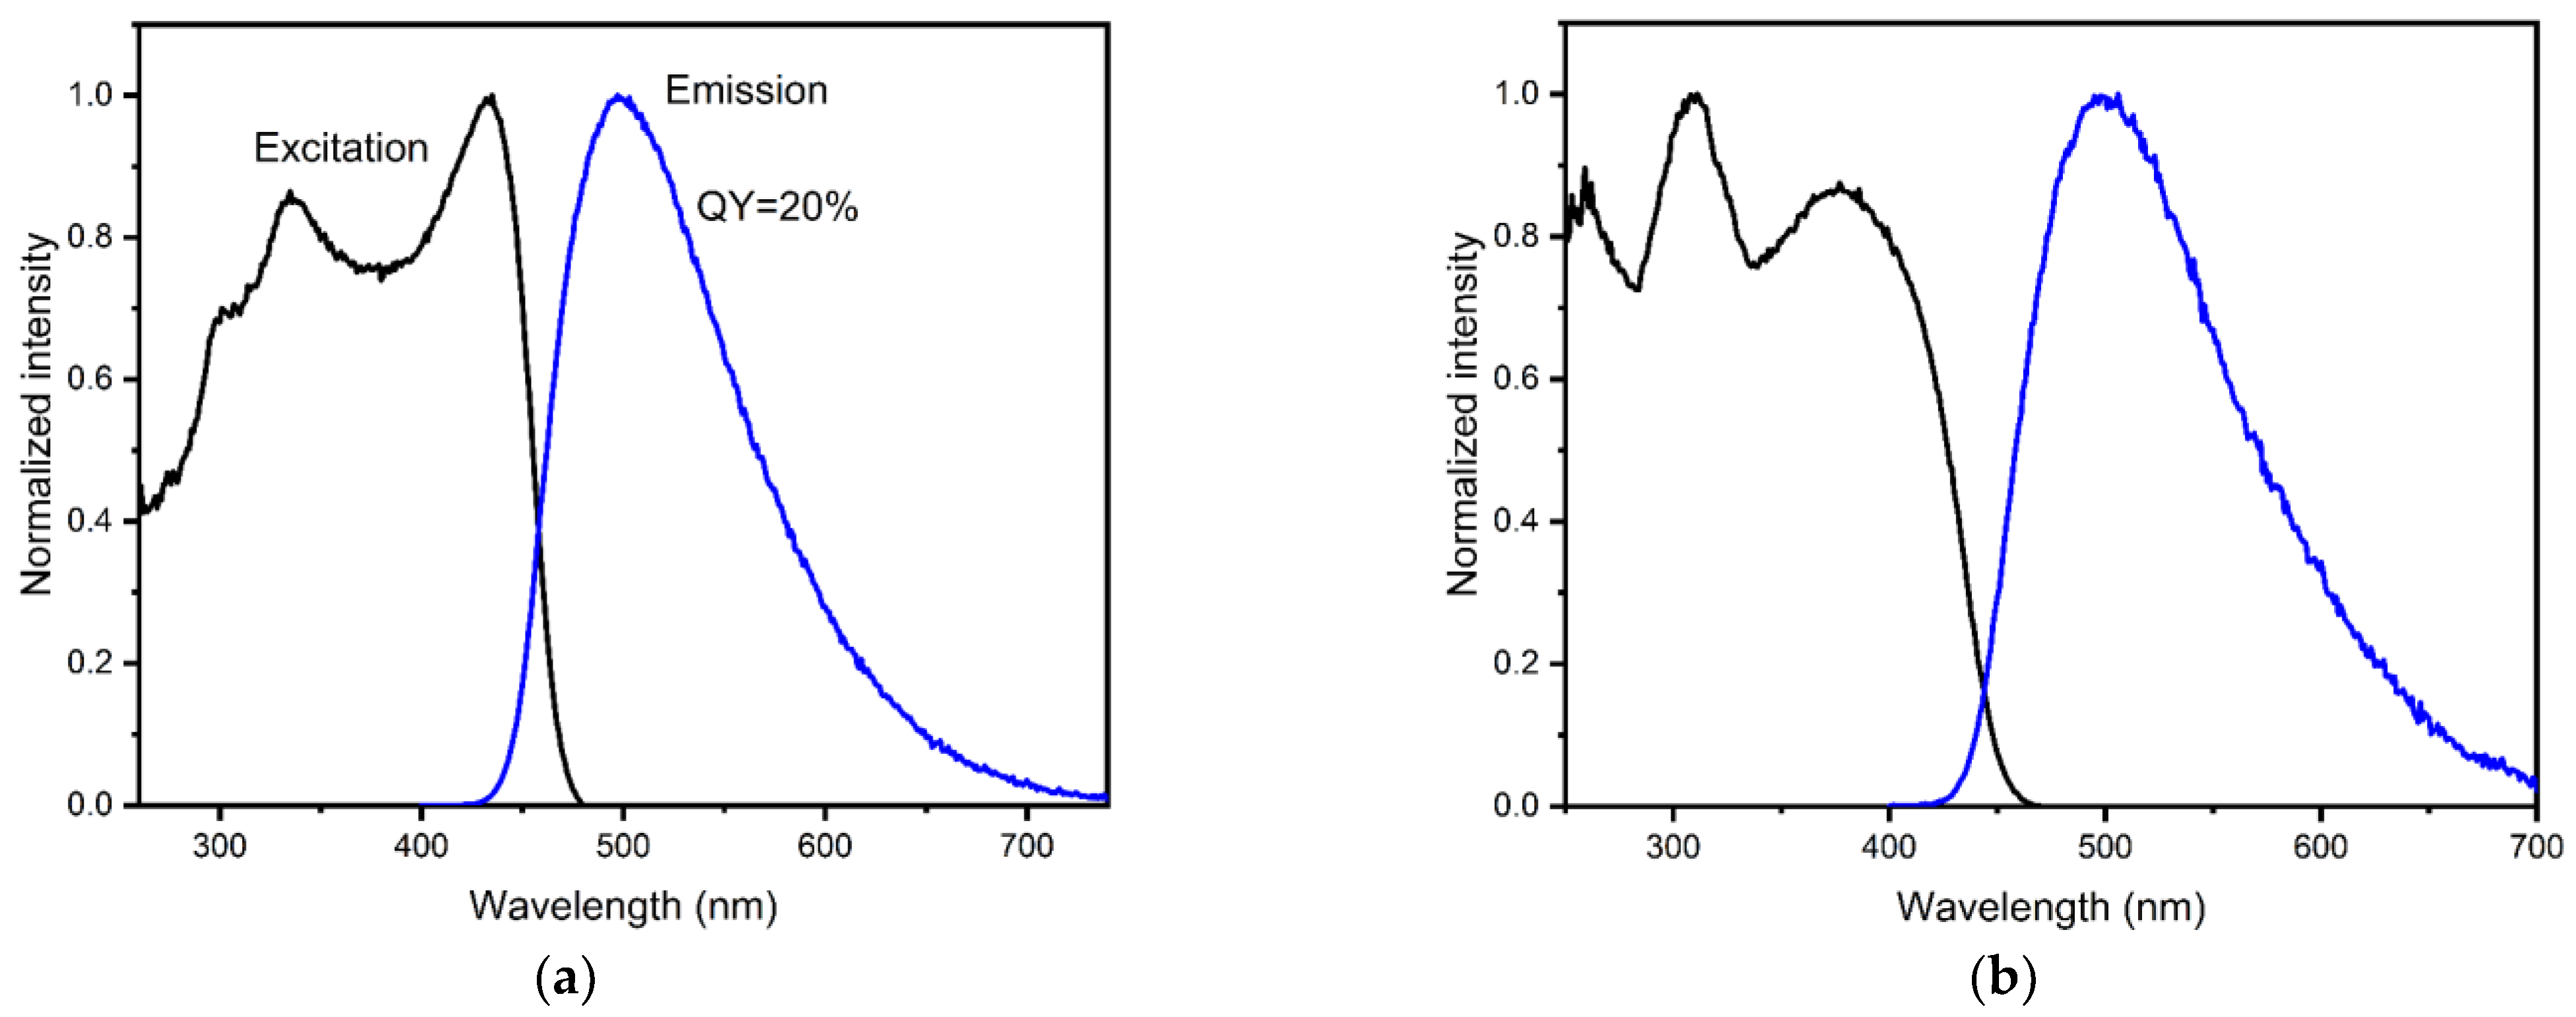
3.3. Luminescent Properties of MOFs

The photoluminescence of MOF 1 was studied both in the solid state and in ethanol suspensions (Figure 3). The luminescence quantum yield of MOF 1 in a solid state was 20%; this is comparable to other LMOFs with 2,1,3-benzothiadiazole units (Table 1), and its emission maximum both in the solid state and in suspension (λmax = 500 nm) exhibited a 38 nm hypsochromic shift compared with that of the free ligand im2btd (λmax = 538 nm) (Figure S5).
Investigation of the stability of MOF 1 upon soaking in different solvents revealed that it was stable in common organic solvents but degraded in water (vide supra). Out of the tested solvents, ethanol was chosen as a dispersion medium for luminescent sensing studies as an inexpensive and an environmentally neutral option.

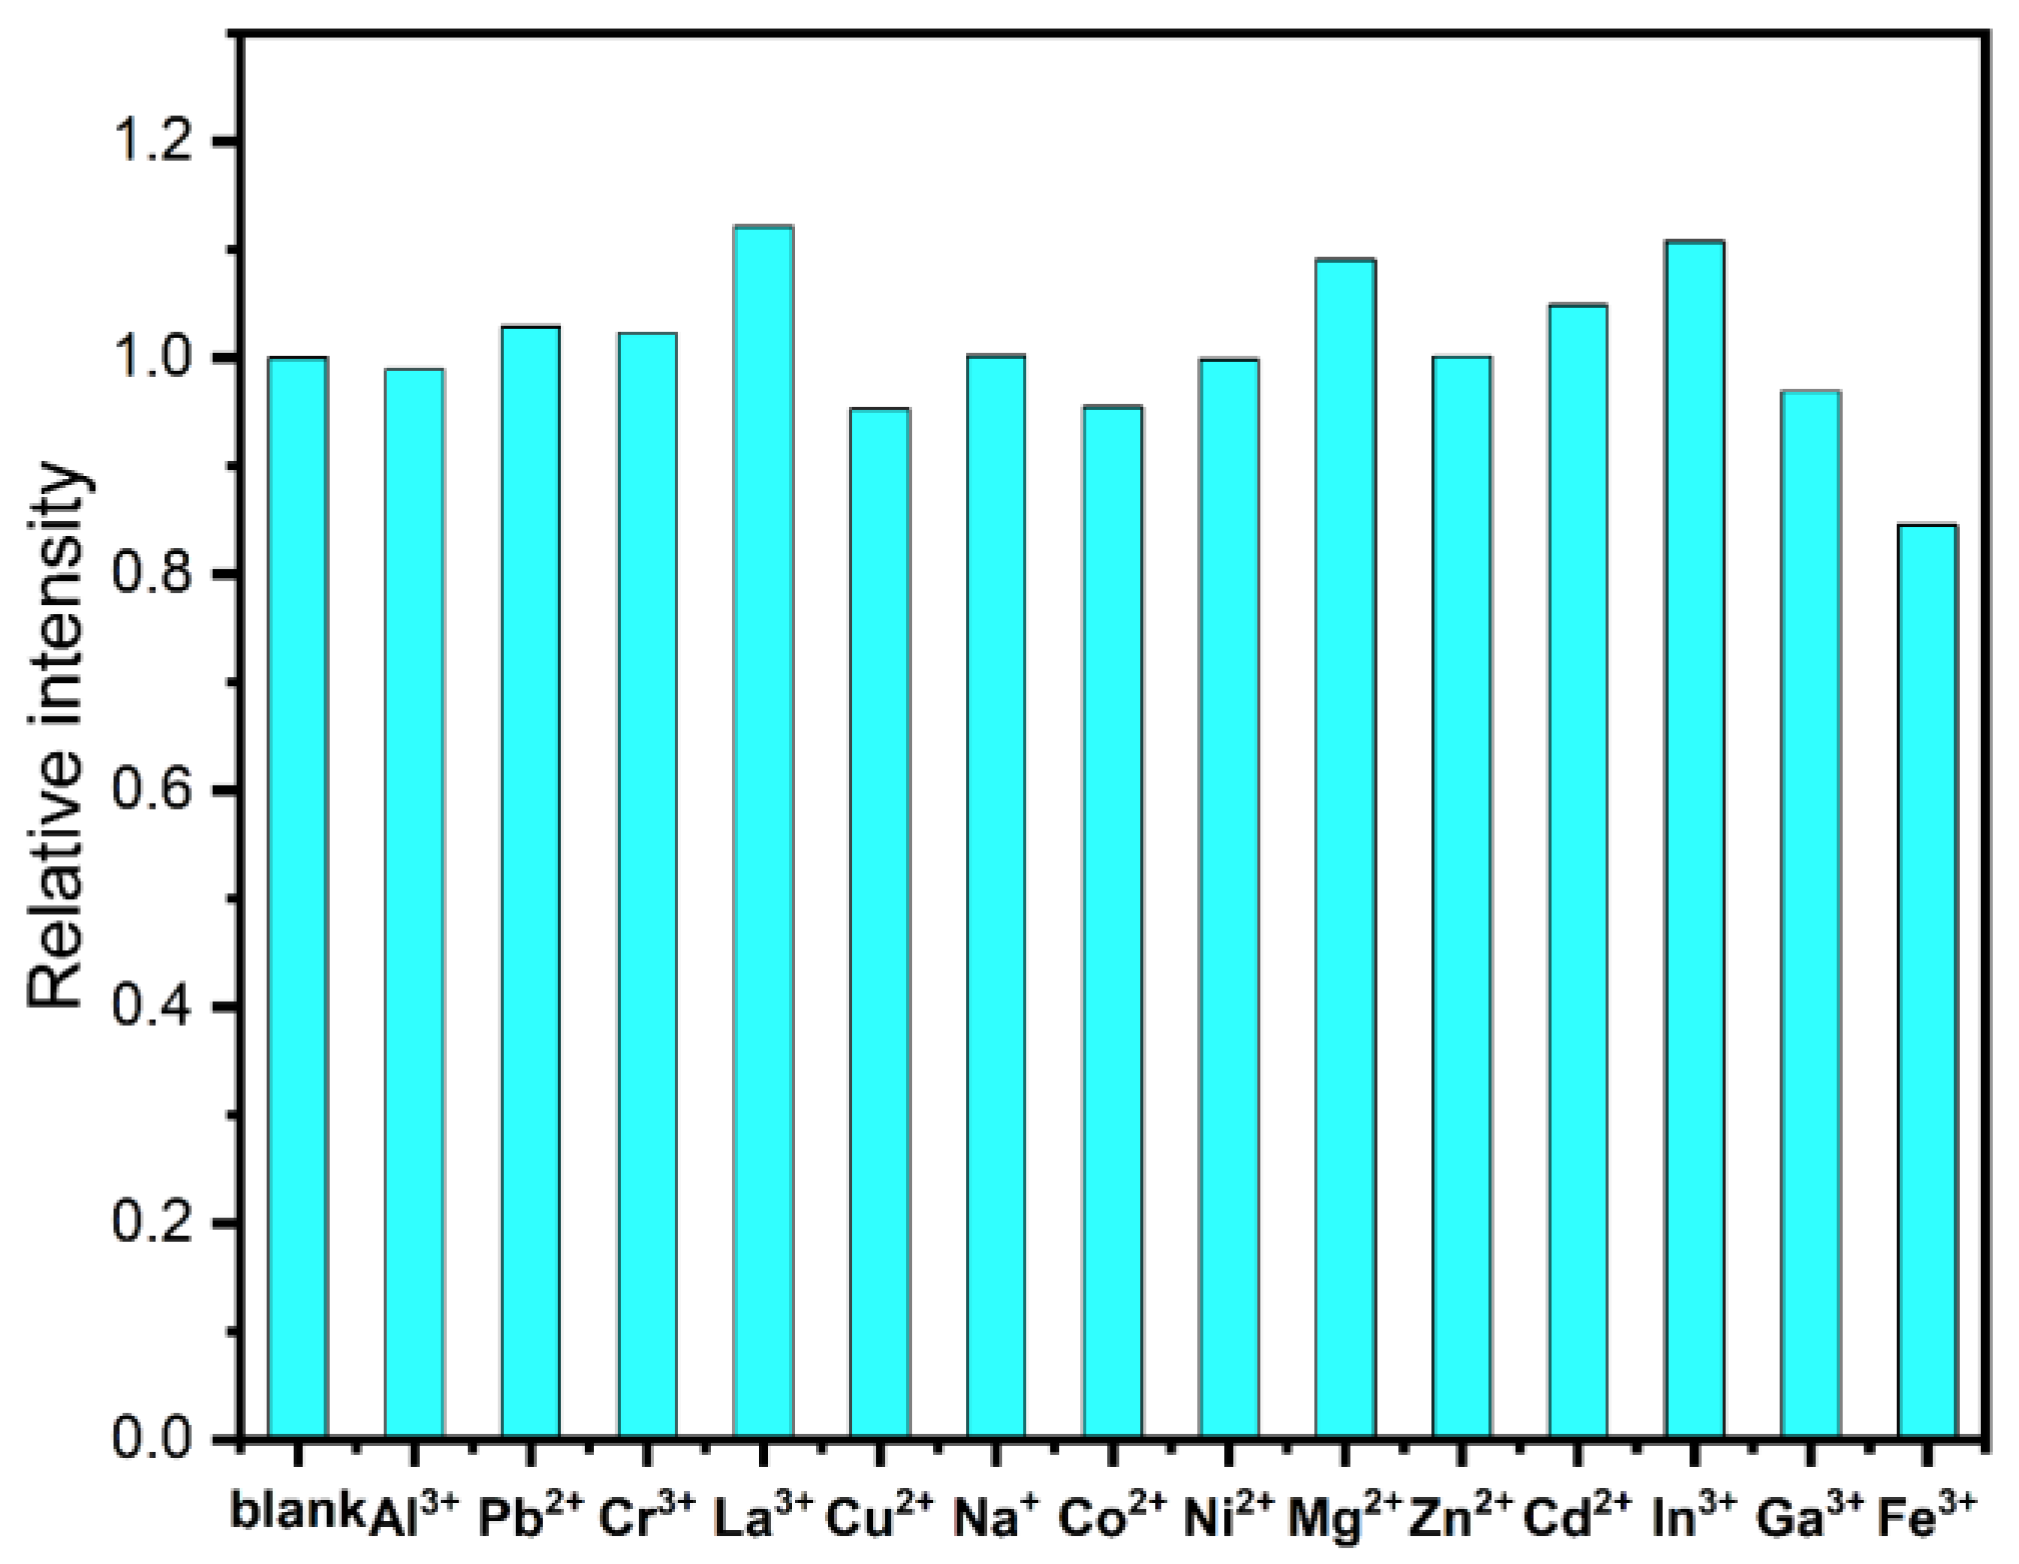
3.3.1. Metal Ion Detection

The possibility of detecting metal ions with coordination polymers containing the 2,1,3-benzothiadiazole fragment was discussed in several recent papers [18,42,43,44,45,46,47]. To test the sensing ability of MOF 1, its photoluminescence spectra in ethanol suspension were recorded in the presence of different metal cations as 0.1 mM nitrate solutions in ethanol. The luminescence intensity was practically independent from the presence of most metal cations except Fe3+ (Figure 4). The addition of Fe3+ resulted in only a slight luminescence-quenching effect, which is unusual as most MOFs containing 2,1,3-benzothiadiazole units reported to date have demonstrated significant dependence of their luminescence on the presence of trivalent metal ions, especially Fe3+ [44,47]. The lack of luminescent response to metal cations may be attributed to the absence of open positions in the structure of MOF 1 preventing the penetration of the cations into them and preventing their interaction with MOF.

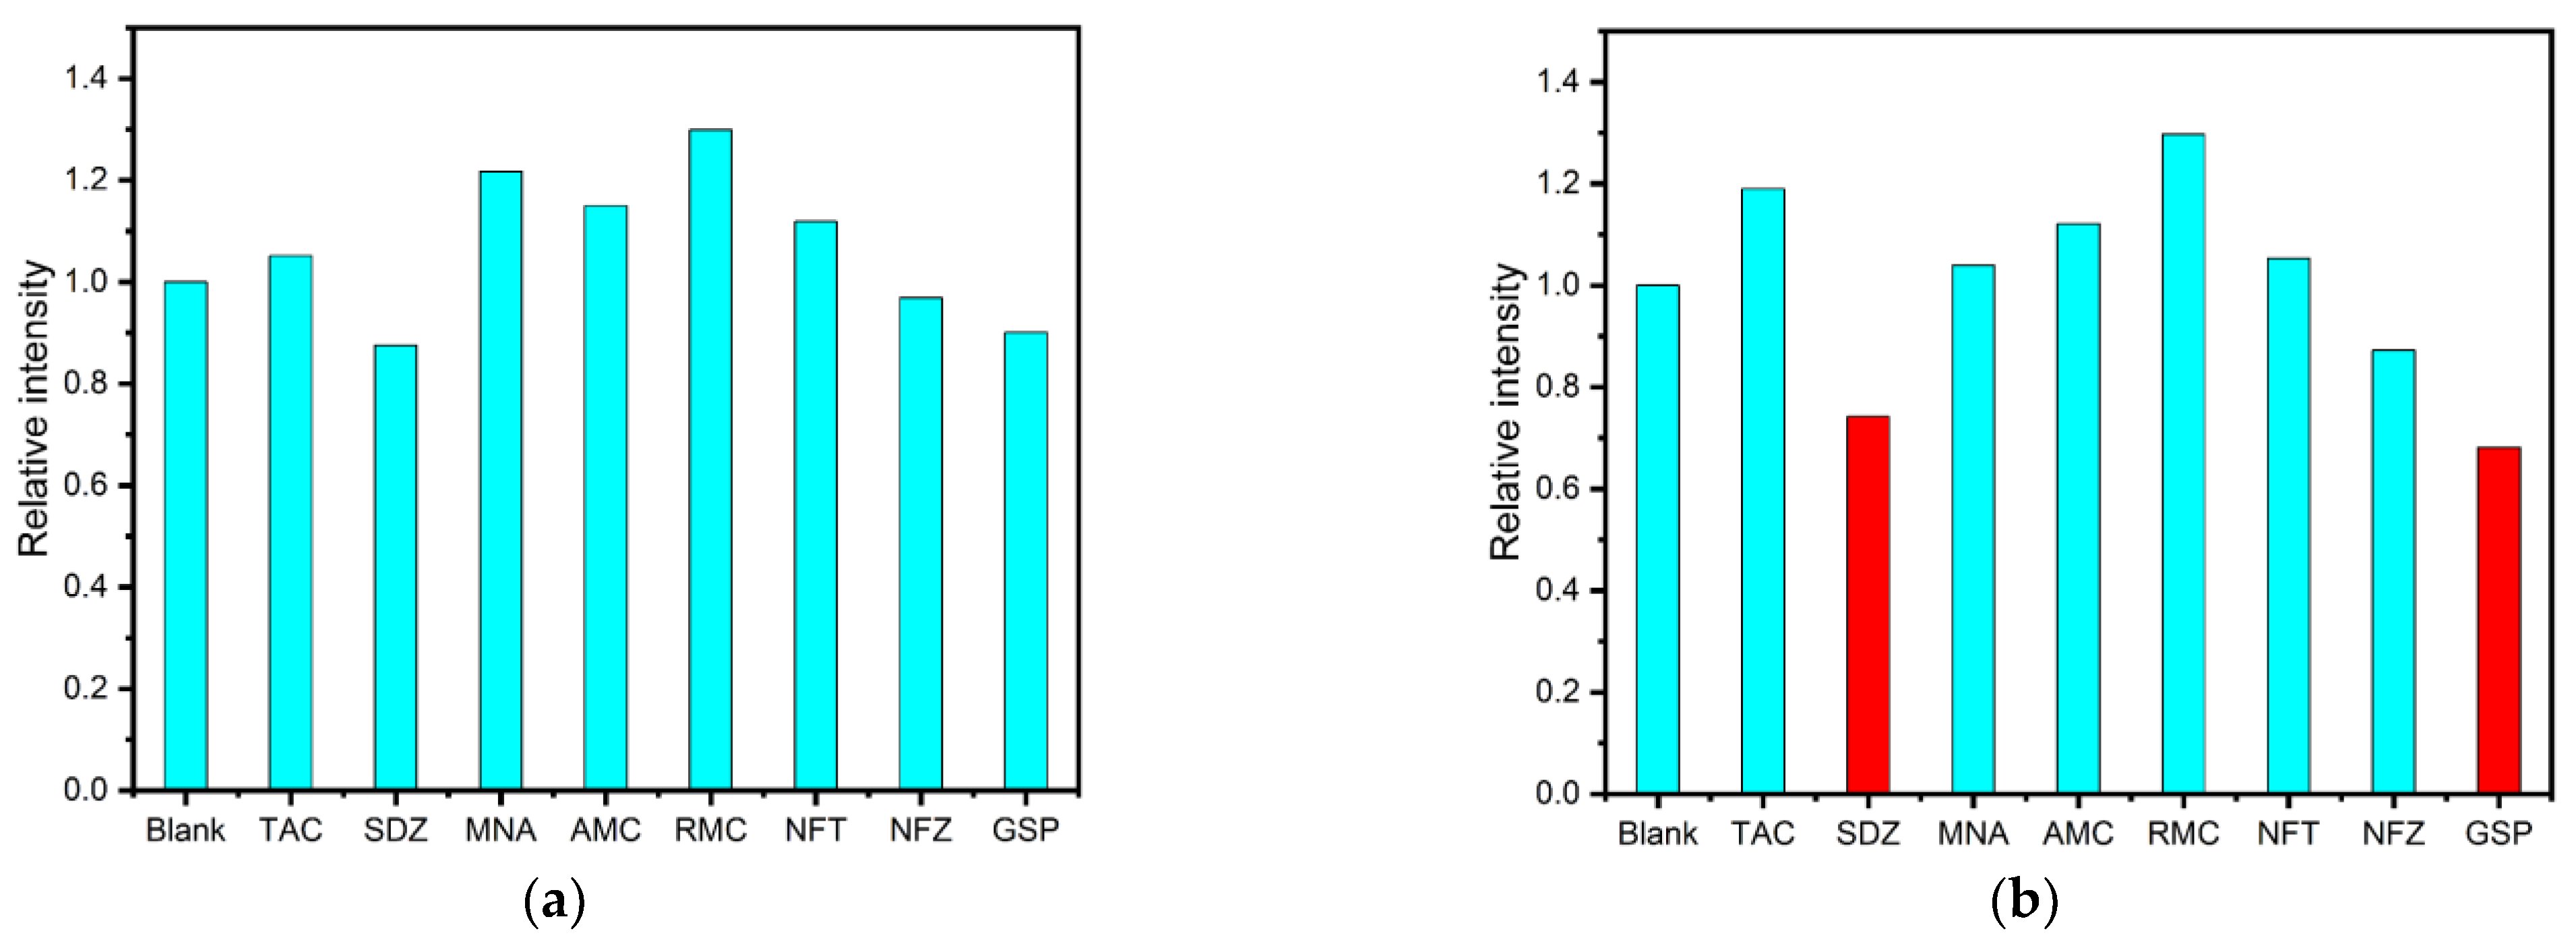
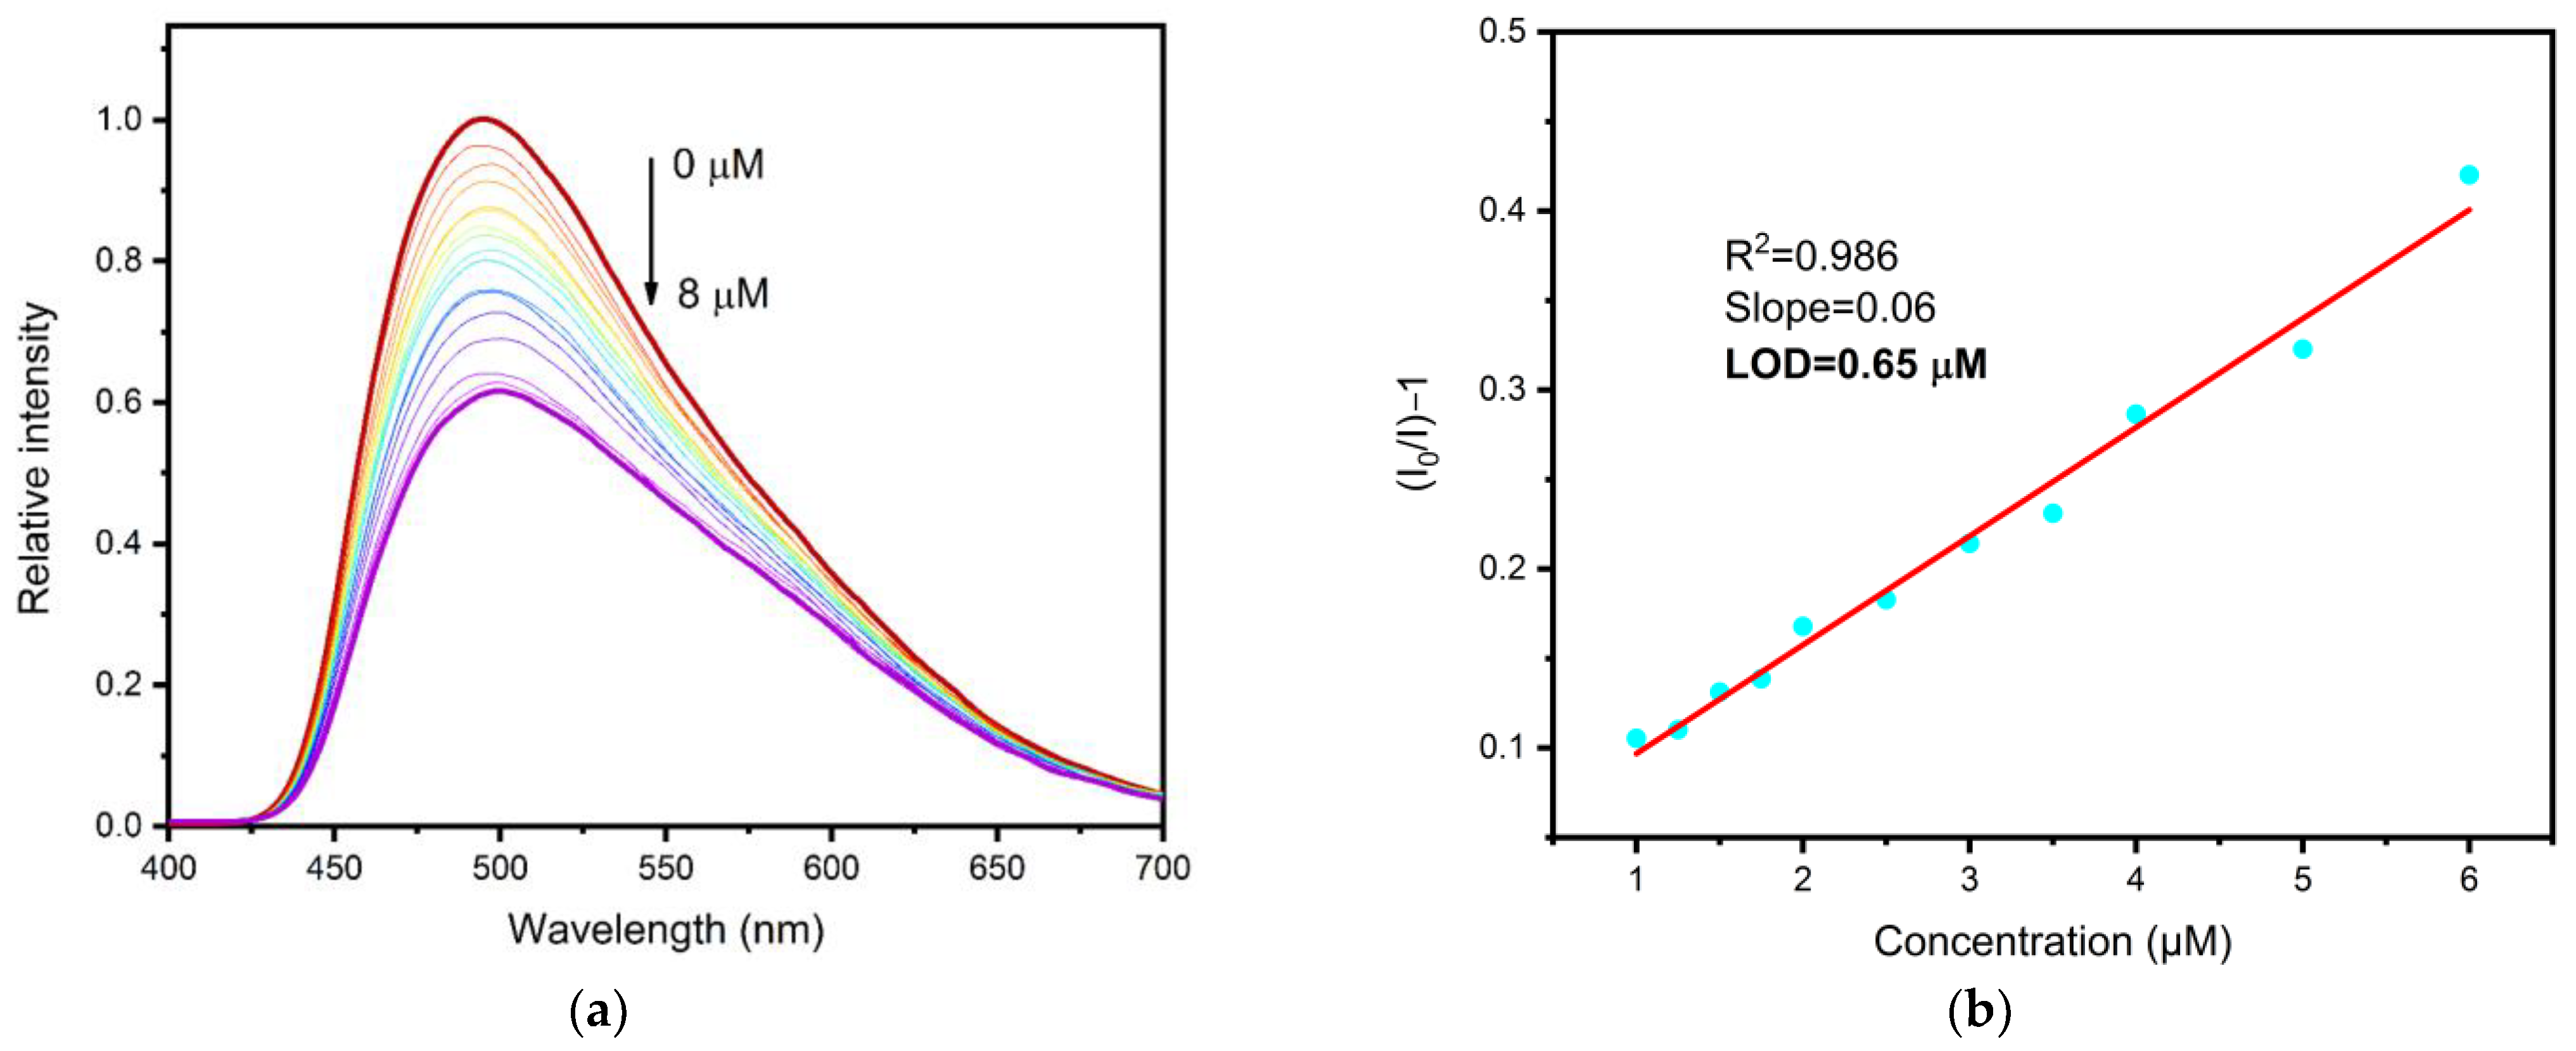
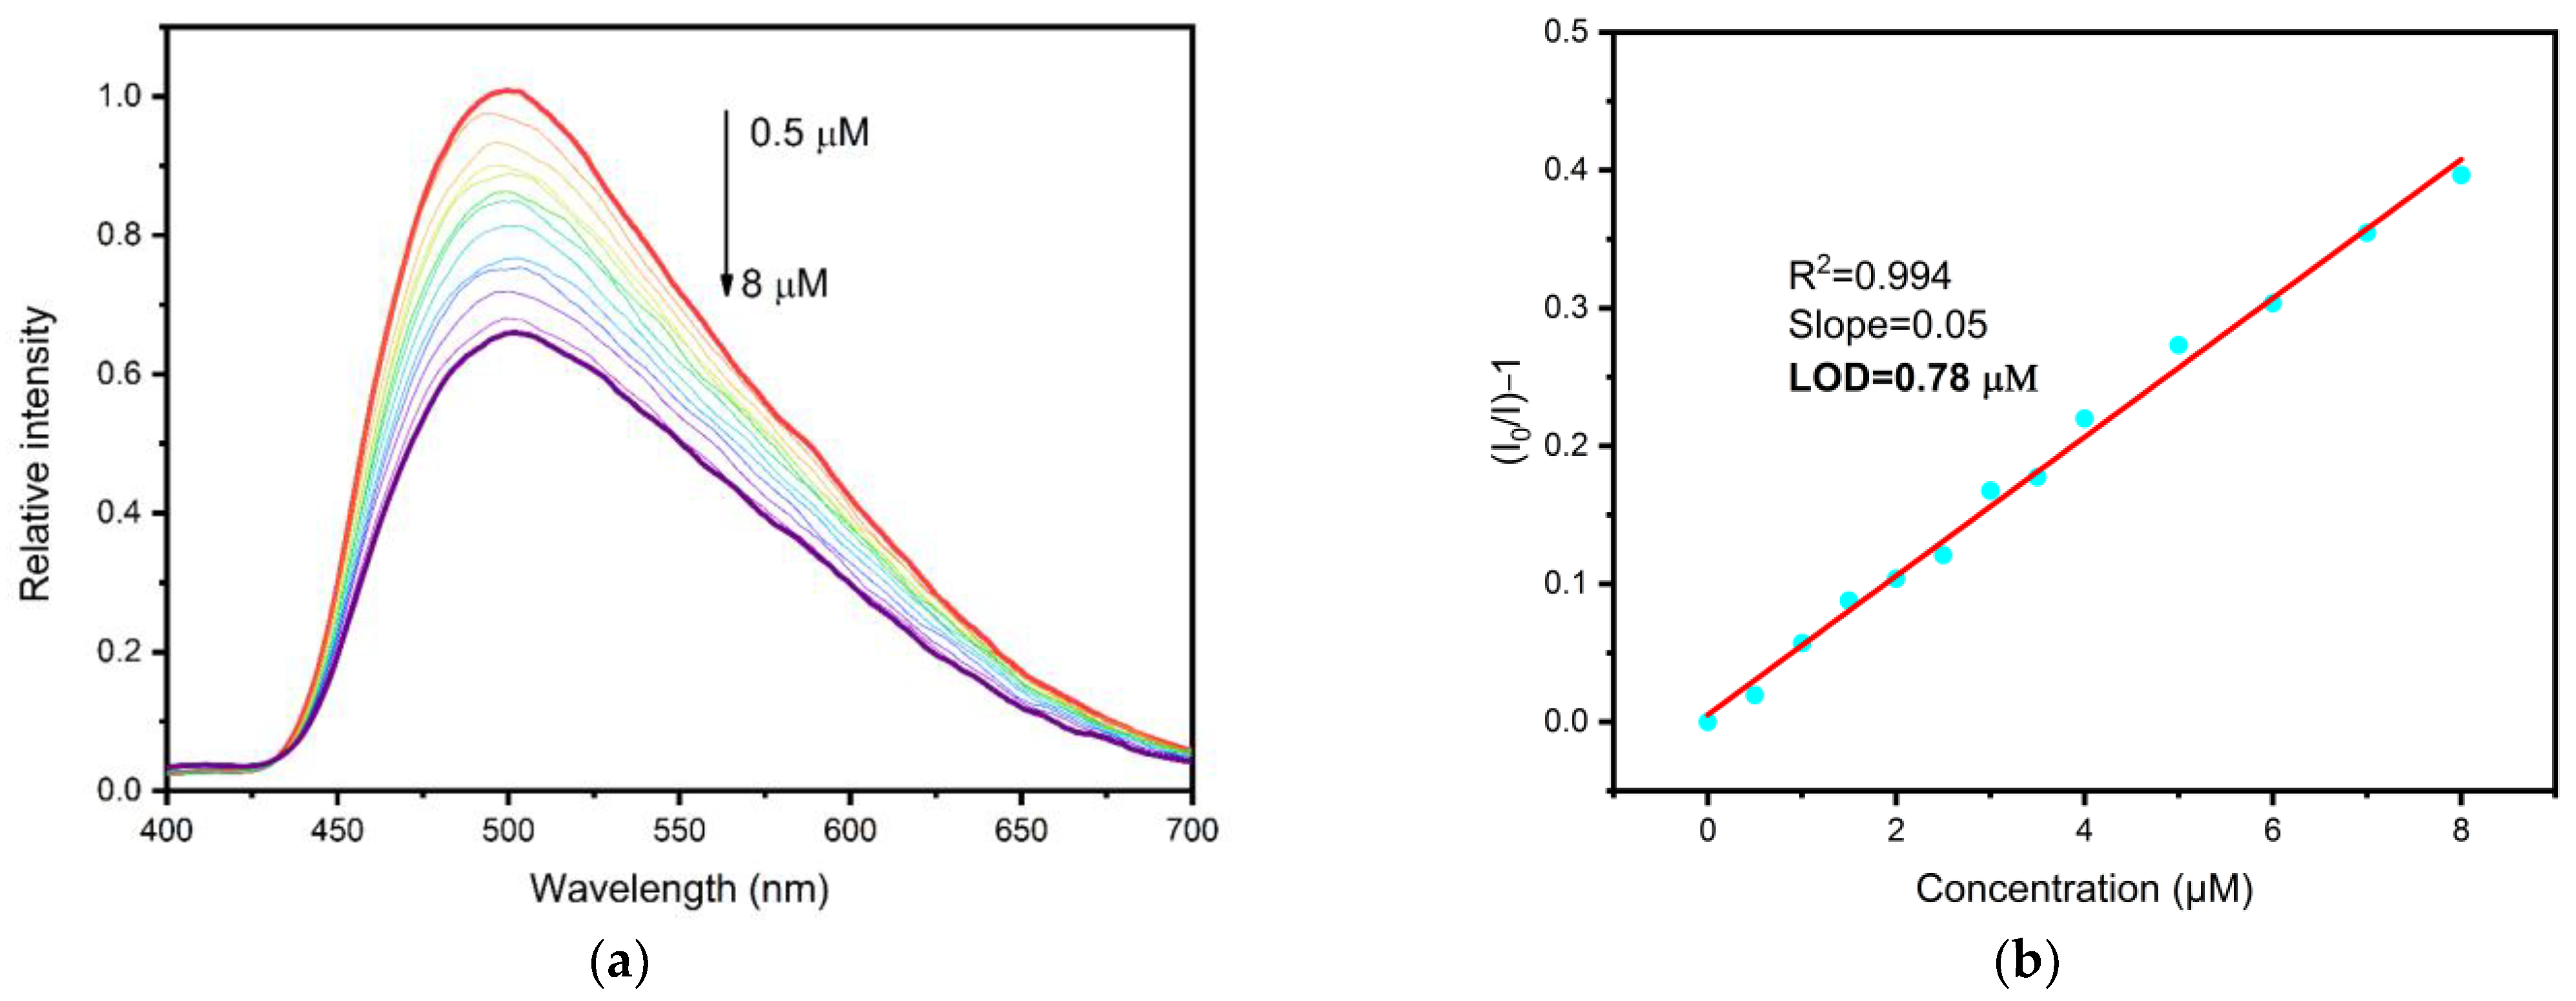
3.3.2. Gossypol and Antibiotic Detection

Gossypol (GSP) and antibiotics of several groups, nitrofurans, fluoroquinolones, macrolides, β−lactams, nitroimidazoles, sulfonamides (AMC, MNA, GSP, NFC, NFT, NFZ, PCB, RMC, SDZ, TAC) were added to the ethanol suspensions of MOF 1 to create 10 µM concentrations. Two excitation wavelengths (380 nm and 310 nm) were used to measure the luminescent response of MOF 1 towards the listed analytes. It was found that changing the excitation wavelength allows the tuning of the selectivity of the luminescent response. Thus, at 380 nm excitation, some emission quenching was observed in the presence of the GSP and SDZ (gossypol and sulfadiazine, respectively, Figure 5a), while at 310 nm excitation, the quenching by GSP was much more pronounced (Figure 5b). Luminescence intensity dropped to 0.7, relative to the initial suspension with a 10 µM gossypol concentration.
Fluorometric titration revealed that the degree of emission quenching is concentration dependent (Figure 6a), and that quenching can be reliably measured even in a low concentration range of 0.5 µM to 8 µM in which the dependence is linear (Figure 6b). The Stern–Volmer constant KSV determined from the linear regression approximation is 6.08 × 10⁴ M−1, and the LOD is estimated to be as low as 0.64 µM. It should be noted that only several MOF with sensory properties towards gossypol are reported in the literature, and to the best of our knowledge, the LOD found is among the lowest reported so far (Table 2).
In order to explore the possibility of using MOF 1 for gossypol detection in the cottonseed oil, the fluorometric titration was repeated as described above, only a fixed amount of refined cottonseed oil was added to the solution as the background. This approach allows the estimation of the interference of multiple oil components, such as saturated and unsaturated triglycerides, tocopherols, tocotrienols, triterpene alcohols and phospholipids, on the detection of gossypol in one experiment. The results show that addition of the cottonseed oil to the suspension of MOF 1 leads to a slight emission quenching (Figure S6); however, the concentration dependence of the quenching degree remained linear and essentially followed the same equation, and the LOD was 0.78 μM (Figure 7). Therefore, linear calibration plots may be obtained even in the presence of cottonseed oil, and are suitable for the determination of GSP in real-life samples.
One of the important advantages that MOFs present over soluble sensing reagents is their ability to be regenerated and used multiple times. The reversibility of luminescence quenching of MOF 1 was explored in the sensing of gossypol. As one can see from Figures S7 and S8, MOF 1 retains crystallinity and can be recycled with only negligible loss by centrifuging the suspension and washing the powder with pure ethanol.

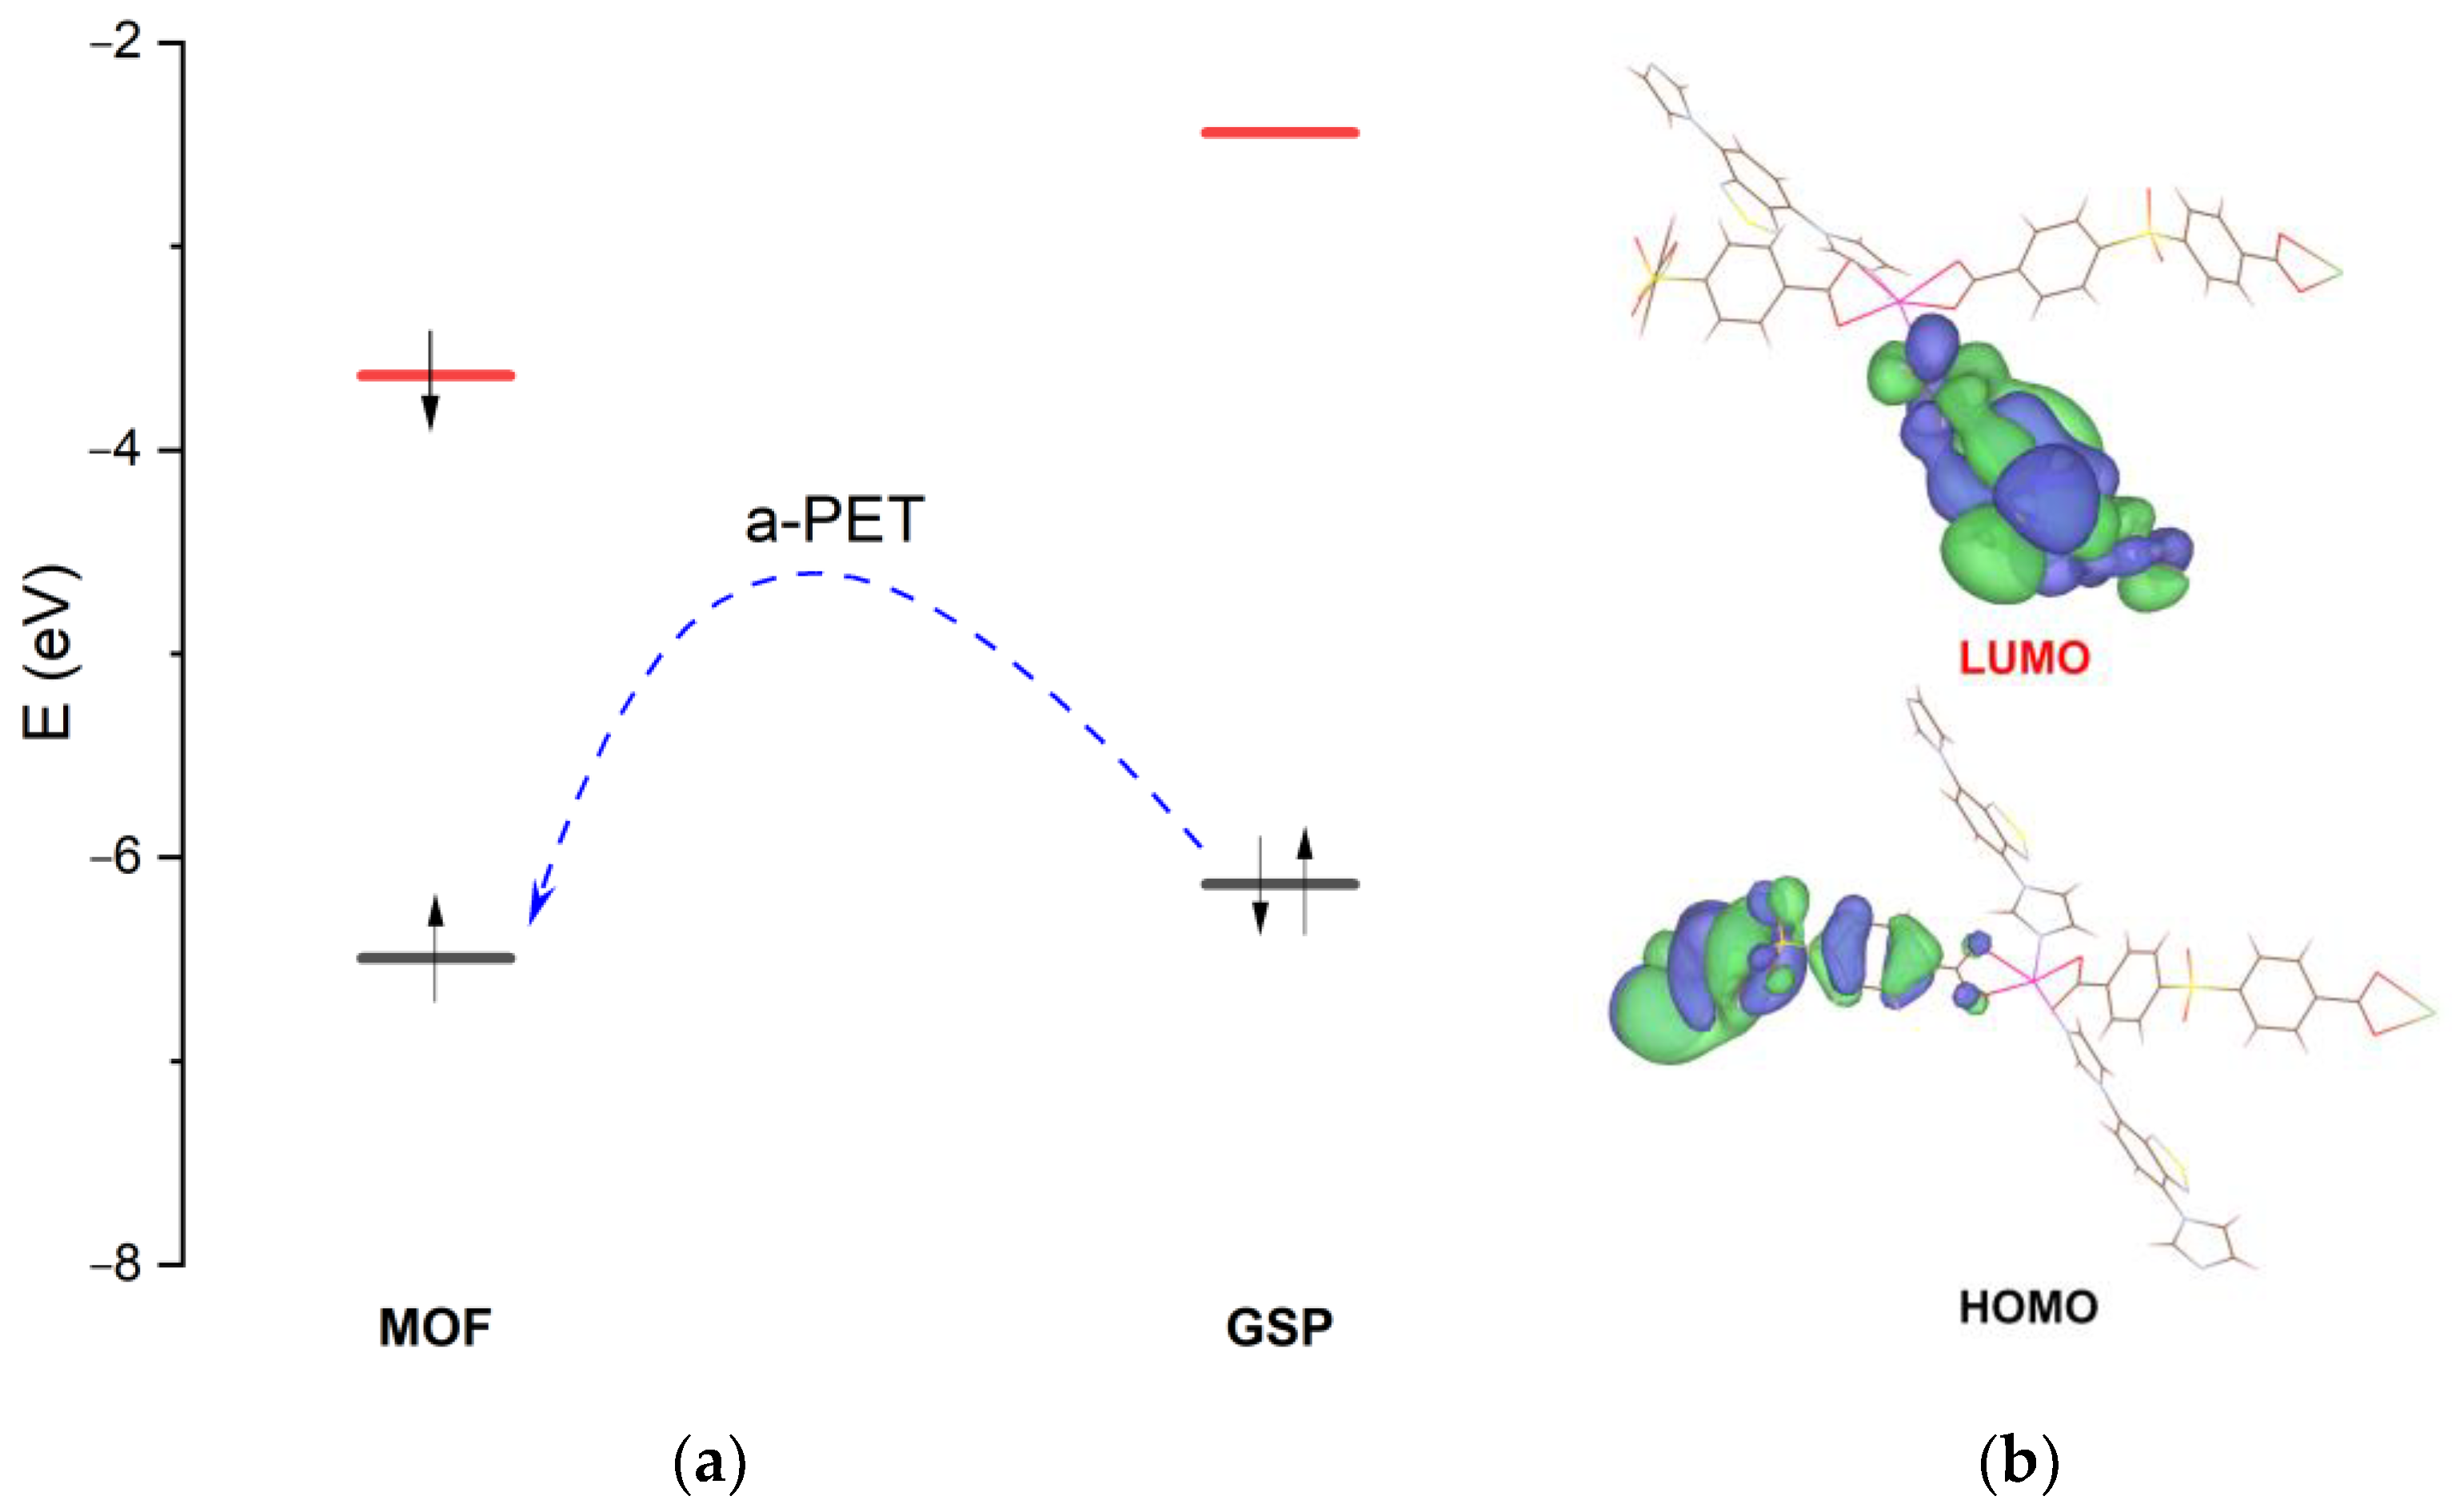
3.4. Luminescene Quenching Mechanism

There are several possible reasons for the luminescence quenching upon the addition of gossypol: the inner-filter effect (IEF), collisional quenching, structural changes and binding-related phenomena, including energy transfer and ground-state complex formation between the analyte and fluorophore [50].
The structural changes were ruled out by PXRD experiments. The ground sample of MOF 1 was soaked in gossypol ethanolic solution overnight, filtered and subjected to PXRD analysis. The PXRD patterns of as-synthesized and gossypol soaked samples matched perfectly (Figure S9), and a wholly diffraction pattern profile fitting indicates no significant changes in unit cell parameters (Figure S10).
Collisional quenching can also be disregarded by calculating the quenching constant from the Stern–Volmer equation (the Stern–Volmer constant is the slope of the line on the relative intensity–concentration graph [51]). Photoluminescence lifetimes were determined from emission decay curves, which were best approximated by biexponential equations. The luminescence lifetimes were 320 ns and 4.1 µs for solid state measurement (Figure S11), and 27 ns and 109 ns for the blank suspension of MOF 1 (Figure S12). These lifetimes did not change significantly in the presence of gossypol in the suspension (32 ns and 128 ns, Figure S13), suggesting a static quenching mechanism [52]. The value of the quenching constant was calculated as Kq = KSV/τ [50], where τ, the luminescence lifetime for the MOF 1 suspension in the presence of gossypol, 2.2 × 10¹² M−1·s−1, exceeded the maximum possible value for the collisional quenching process to be effective (2 × 10¹⁰ M−1·s−1 [51]).
To account for the possible inner-filter effect (IEF), it is necessary to know the absorbance of the analyte. The UV-Vis spectra of gossypol solution in ethanol at different concentrations were recorded. As evidenced in Figure S14, the absorbance of gossypol at 290 nm and 10−6 M concentration is about 0.02, while the emission quenching, even at a lower concentration (~10−7), is too high to be attributed solely to the gossypol absorbance. In addition, a gossypol titration experiment with monitoring of the UV-Vis absorption spectrum was performed. No significant change in the absorbance of the MOF 1 suspension in the presence of increasing gossypol concentrations was observed near 310 nm (Figure S15), which is used as an excitation wavelength in the fluorometric titration. Therefore, the IEF is present, but plays only a minor role in the luminescence quenching.
The formation of strong ground-state complexes may be ruled out on the basis of the ease with which the luminescence intensity can be restored by simple rinsing with ethanol. Förster resonance energy transfer (FRET) is not likely, as there is no overlap between the absorption band of gossypol (Figure S12) and the emission band of MOF 1 (Figure 3b).
The possibility of electron transfer was evaluated on the basis of DFT calculations. The frontier molecular orbital energies of gossypol and the MOF 1 model fragment were calculated and compared. The HOMO energy levels of gossypol and MOF are very close to each other, while the LUMO levels differ significantly (Figure 8); thus, photo-induced electron transfer (a-PET) is possible and should be considered the main quenching mechanism.

4. Conclusions

In summary, a new cadmium(II)-based MOF containing a 4,7-di(imidazol-1-yl)-2,1,3-benzothiadiazole fluofophoric ligand was prepared and characterized by conventional methods. This MOF demonstrated a luminescence-quenching response towards gossypol in ethanol suspension, with the limit of detection in a submicromolar region (0.64 µM). An interference test confirmed the possibility of using this MOF as a sensor for detection and determination of gossypol in real-life samples of cottonseed oil. A photoinduced electron transfer (a-PET) luminescence-quenching mechanism was proposed on the basis of DFT calculations.

Supplementary Materials

The following supporting information can be downloaded at: https://www.mdpi.com/article/10.3390/chemosensors11010052/s1, Figure S1. Model of MOF 1 fragment used for DFT calculations; Figure S2. Calculated and experimental PXRD patterns of as-synthesized MOF 1; Figure S3. FT-IR spectrum of MOF 1; Figure S4. TGA curve of MOF 1; Figure S5. Solid-state photoluminescence spectra of im2btd; Figure S6. Luminescence spectra of ethanol suspension of MOF 1 with and without cottonseed oil; Figure S7. Recycling experiment of gossypol detection with MOF 1. Relative integral intensities are shown. The relative quenching values (I0 − I)/I are 0.14 (cycle 1), 0.14 (cycle 2) and 0.12 (cycle 3); Figure S8. Calculated and experimental PXRD patterns for MOF 1 after the sensing experiment; Figure S9. PXRD pattern of GSP-soaked MOF 1 and calculated pattern from SCXRD data; Figure S10. Le-Bail fitting of GSP-soaked MOF 1; Figure S11. Photoluminescence decay curve for solid-state MOF 1; Figure S12. Photoluminescence decay curve for MOF 1 blank ethanol suspension; Figure S13. Photoluminescence decay curve for MOF 1 ethanol suspension in the presence of gossypol (C = 0.01 mM); Figure S14. UV-Vis spectra of gossypol solutions in 10−6 and 10−8 M ethanol solutions; Figure S15. UV-Vis spectra of MOF 1 ethanol suspension upon addition of different concentrations of gossypol.

Author Contributions

Conceptualization, D.I.P. and A.S.P.; investigation, D.I.P., X.Y. and A.A.R.; writing—original draft preparation, D.I.P.; writing—review and editing, A.S.P.; visualization, D.I.P. and X.Y.; supervision, V.P.F.; project administration, V.P.F.; funding acquisition, V.P.F. All authors have read and agreed to the published version of the manuscript.

Funding

This work was supported by the Ministry of Science and Higher Education of the Russian Federation (Agreement No. 075-15-2022-263). The experiments were performed using large-scale research facilities “EXAFS spectroscopy beamline”.

Institutional Review Board Statement

Not applicable.

Informed Consent Statement

Not applicable.

Data Availability Statement

Experimental data associated with this research are available from the authors. Crystallographic data for MOF 1 were deposited at the Cambridge Crystallographic Data Centre, CCDC No. 2222657 and may be obtained free of charge from the Cambridge Crystallographic Data Centre, 12 Union Road, Cambridge CB2 1EZ, UK (Fax: +44-1223-336-033; e-mail: [email protected]).

Acknowledgments

The Siberian Branch of the Russian Academy of Sciences (SB RAS) Siberian Supercomputer Centre is gratefully acknowledged for providing supercomputer facilities.

Conflicts of Interest

The authors declare no conflict of interest.

References

  1. Rathore, K.S.; Pandeya, D.; Campbell, L.A.M.; Wedegaertner, T.C.; Puckhaber, L.; Stipanovic, R.D.; Thenell, J.S.; Hague, S.; Hake, K. Ultra-low gossypol cottonseed: Selective gene silencing opens up a vast resource of plant-based protein to improve human nutrition. CRC Crit. Rev. Plant Sci. 2020, 39, 1–29. [Google Scholar] [CrossRef] [Green Version]
  2. Kumar, M.; Tomar, M.; Punia, S.; Grasso, S.; Arrutia, F.; Choudhary, J.; Singh, S.; Verma, P.; Mahapatra, A.; Patil, S.; et al. Cottonseed: A sustainable contributor to global protein requirements. Trends Food Sci. Technol. 2021, 111, 100–113. [Google Scholar] [CrossRef]
  3. Soares Neto, C.B.; Conceição, A.A.; Gomes, T.G.; de Aquino Ribeiro, J.A.; Campanha, R.B.; Barroso, P.A.V.; Machado, A.E.V.; Mendonça, S.; De Siqueira, F.G.; Miller, R.N.G. A comparison of physical, chemical, biological and combined treatments for detoxification of free gossypol in crushed whole cottonseed. Waste Biomass Valoriz. 2021, 12, 3965–3975. [Google Scholar] [CrossRef]
  4. Gadelha, I.C.N.; Fonseca, N.B.S.; Oloris, S.C.S.; Melo, M.M.; Soto-Blanco, B. Gossypol toxicity from cottonseed products. Sci. World J. 2014, 2014, 231635. [Google Scholar] [CrossRef] [PubMed] [Green Version]
  5. Abou-Donia, S.A.; Lasker, J.M.; Abou-Donia, M.B. High-performance liquid chromatographic analysis of gossypol. J. Chromatogr. A 1981, 206, 606–610. [Google Scholar] [CrossRef]
  6. Mirghani, M.E.S.; Che Man, Y.B. A new method for determining gossypol in cottonseed oil by FTIR spectroscopy. JAOCS J. Am. Oil Chem. Soc. 2003, 80, 625–628. [Google Scholar] [CrossRef]
  7. Zhao, C.; Wu, D. Rapid detection assay for the molecular imprinting of gossypol using a two-layer PMAA/SiO2 bulk structure with a piezoelectric imprinting sensor. Sens. Actuators B Chem. 2013, 181, 104–113. [Google Scholar] [CrossRef]
  8. Li, C.; Zhao, T.; Li, C.; Mei, L.; Yu, E.; Dong, Y.; Chen, J.; Zhu, S. Determination of gossypol content in cottonseeds by near infrared spectroscopy based on Monte Carlo uninformative variable elimination and nonlinear calibration methods. Food Chem. 2017, 221, 990–996. [Google Scholar] [CrossRef]
  9. Luo, T.Y.; Das, P.; White, D.L.; Liu, C.; Star, A.; Rosi, N.L. Luminescence “turn-on” detection of gossypol using Ln3+-based metal-organic frameworks and Ln3+ salts. J. Am. Chem. Soc. 2020, 142, 2897–2904. [Google Scholar] [CrossRef]
  10. SK, M.; Biswas, S. A thiadiazole-functionalized Zr(IV)-based metal-organic framework as highly fluorescent probe for the selective detection of picric acid. Cryst. Eng. Comm. 2016, 18, 3104–3113. [Google Scholar] [CrossRef]
  11. Jana, A.K.; Natarajan, S. Fluorescent metal-organic frameworks for selective sensing of toxic cations (Tl3+, Hg2+) and highly oxidizing anions ((CrO4)2−, (Cr2O7)2−, (MnO4)). Chempluschem 2017, 82, 1153–1163. [Google Scholar] [CrossRef]
  12. Mallick, A.; El-Zohry, A.M.; Shekhah, O.; Yin, J.; Jia, J.; Aggarwal, H.; Emwas, A.-H.; Mohammed, O.F.; Eddaoudi, M. Unprecedented ultralow detection limit of amines using a thiadiazole-functionalized Zr(IV)-based metal–organic framework. J. Am. Chem. Soc. 2019, 141, 7245–7249. [Google Scholar] [CrossRef] [PubMed] [Green Version]
  13. Pavlov, D.I.; Sukhikh, T.S.; Ryadun, A.A.; Matveevskaya, V.V.; Kovalenko, K.A.; Benassi, E.; Fedin, V.P.; Potapov, A.S.A. Luminescent 2,1,3-benzoxadiazole-decorated zirconium-organic framework as an exceptionally sensitive turn-on sensor for ammonia and aliphatic amines in water. J. Mater. Chem. C 2022, 10, 5567–5575. [Google Scholar] [CrossRef]
  14. Fan, W.; Cheng, Y.; Zhao, H.; Yang, S.; Wang, L.; Zheng, L.; Cao, Q.; Fan, W.; Cheng, Y.; Zhao, H.; et al. A turn-on NIR fluorescence sensor for gossypol based on Yb-based metal-organic framework. Talanta 2022, 238, 123030. [Google Scholar] [CrossRef] [PubMed]
  15. Zongsu, H.; Kunyu, W.; Yinlin, C.; Jiangnan, L.; Teat, S.J.; Sihai, Y.; Wei, S.; Peng, C. A multicenter metal–organic framework for quantitative detection of multicomponent organic mixtures. CCS Chem. 2022, 4, 3238–3245. [Google Scholar]
  16. Jia, Z.; Han, Z.; Wang, K.; Zhou, T.; Min, H.; Sun, T.; Liao, Y.; Wang, L.; Cheng, P.; Shi, W. An efficient, multiplexed strategy for instant detection of bacterial biomarker by a lanthanide–organic material. Inorg. Chem. 2022, 61, 14313–14321. [Google Scholar] [CrossRef]
  17. Kuznetsova, A.; Matveevskaya, V.; Pavlov, D.; Yakunenkov, A.; Potapov, A. Coordination polymers based on highly emissive ligands: Synthesis and functional properties. Materials 2020, 13, 2699. [Google Scholar] [CrossRef]
  18. Tian, X.M.; Yao, S.L.; Qiu, C.Q.; Zheng, T.F.; Chen, Y.Q.; Huang, H.; Chen, J.L.; Liu, S.J.; Wen, H.R. Turn-on luminescent sensor toward Fe3+, Cr3+, and Al3+ based on a Co(II) metal-organic framework with open functional sites. Inorg. Chem. 2020, 59, 2803–2810. [Google Scholar] [CrossRef]
  19. Committee, A.M. Recommendations for the definition, estimation and use of the detection limit. Analyst 1987, 112, 199–204. [Google Scholar]
  20. CrysAlisPro; Version 1.171.38.46; Rigaku Oxford Diffraction: The Woodlands, TX, USA, 2015.
  21. Sheldrick, G.M. SHELXT-Integrated space-group and crystal-structure determination. Acta Crystallogr. Sect. A 2015, 71, 3–8. [Google Scholar] [CrossRef] [Green Version]
  22. Sheldrick, G.M. Crystal structure refinement with SHELXL. Acta Crystallogr. Sect. C 2015, 71, 3–8. [Google Scholar] [CrossRef] [PubMed] [Green Version]
  23. Spek, A.L. Platon squeeze: A tool for the calculation of the disordered solvent contribution to the calculated structure factors. Acta Crystallogr. Sect. C 2015, 71, 9–18. [Google Scholar] [CrossRef] [PubMed]
  24. Frisch, M.J.; Trucks, G.W.; Schlegel, H.B.; Scuseria, G.E.; Robb, M.A.; Cheeseman, J.R.; Scalmani, G.; Barone, V.; Mennucci, B.; Petersson, G.A.; et al. Gaussian 09, Rev. D.01; Gaussian, Inc.: Wallingford, CT, USA, 2013. [Google Scholar]
  25. Becke, A.D. Density-functional exchange-energy approximation with correct asymptotic behavior. Phys. Rev. A 1988, 38, 3098–3100. [Google Scholar] [CrossRef] [PubMed]
  26. Lee, C.; Yang, W.; Parr, R.G. Development of the Colle-Salvetti correlation-energy formula into a functional of the electron density. Phys. Rev. B 1988, 37, 785–789. [Google Scholar] [CrossRef] [PubMed] [Green Version]
  27. Vosko, S.H.; Wilk, L.; Nusair, M. Accurate spin-dependent electron liquid correlation energies for local spin density calculations: A critical analysis. Can. J. Phys. 1980, 58, 1200–1211. [Google Scholar] [CrossRef] [Green Version]
  28. Stephens, P.J.; Devlin, F.J.; Chabalowski, C.F.; Frisch, M.J. Ab initio calculation of vibrational absorption and circular dichroism spectra using density functional force fields. J. Phys. Chem. 1994, 98, 11623–11627. [Google Scholar] [CrossRef]
  29. McLean, A.D.; Chandler, G.S. Contracted Gaussian basis sets for molecular calculations. I. Second row atoms, Z = 11–18. J. Chem. Phys. 1980, 72, 5639–5648. [Google Scholar] [CrossRef]
  30. Krishnan, R.; Binkley, J.S.; Seeger, R.; Pople, J.A. Self-consistent molecular orbital methods. XX. A basis set for correlated wave functions. J. Chem. Phys. 1980, 72, 650–654. [Google Scholar] [CrossRef]
  31. Clark, T.; Chandrasekhar, J.; Spitznagel, G.W.; Schleyer, P.V.R. Efficient diffuse function-augmented basis sets for anion calculations. III. The 3-21+G basis set for first-row elements, Li–F. J. Comput. Chem. 1983, 4, 294–301. [Google Scholar] [CrossRef]
  32. Frisch, M.J.; Pople, J.A.; Binkley, J.S. Self-consistent molecular orbital methods 25. Supplementary functions for Gaussian basis sets. J. Chem. Phys. 1984, 80, 3265–3269. [Google Scholar] [CrossRef]
  33. Grimme, S.; Ehrlich, S.; Goerigk, L. Effect of the damping function in dispersion corrected density functional theory. J. Comput. Chem. 2011, 32, 1456–1465. [Google Scholar] [CrossRef] [PubMed]
  34. Hay, P.J.; Wadt, W.R. Ab initio effective core potentials for molecular calculations. Potentials for K to Au including the outermost core orbitals. J. Chem. Phys. 1985, 82, 299–310. [Google Scholar] [CrossRef]
  35. Hay, P.J.; Wadt, W.R. Ab initio effective core potentials for molecular calculations. Potentials for the transition metal atoms Sc to Hg. J. Chem. Phys. 1985, 82, 270–283. [Google Scholar] [CrossRef]
  36. Barthel, S.; Alexandrov, E.V.; Proserpio, D.M.; Smit, B. Distinguishing metal–organic frameworks. Cryst. Growth Des. 2018, 18, 1738–1747. [Google Scholar] [CrossRef] [PubMed] [Green Version]
  37. Pavlov, D.I.; Ryadun, A.A.; Potapov, A.S. A Zn(II)-based sql type 2D coordination polymer as a highly sensitive and selective turn-on fluorescent probe for Al3+. Molecules 2021, 26, 7392. [Google Scholar] [CrossRef] [PubMed]
  38. Ren, D.; Xia, H.-L.; Zhou, K.; Wu, S.; Liu, X.-Y.; Wang, X.; Li, J. Tuning and directing energy transfer in the whole visible spectrum through linker installation in metal–organic frameworks. Angew. Chem. Int. Ed. 2021, 60, 25048–25054. [Google Scholar] [CrossRef]
  39. Hu, X.-T.; Yin, Z.; Luo, X.-P.; Shen, C.-H.; Zeng, M.-H. Acid and alkalinity stable pillared-layer and fluorescent zinc(II) metal–organic framework for selective sensing of Fe3+ ions in aqueous solution. Inorg. Chem. Commun. 2021, 129, 108664. [Google Scholar] [CrossRef]
  40. Zhao, D.; Yue, D.; Jiang, K.; Cui, Y.; Zhang, Q.; Yang, Y.; Qian, G. Ratiometric dual-emitting MOF⊃dye thermometers with a tunable operating range and sensitivity. J. Mater. Chem. C 2017, 5, 1607–1613. [Google Scholar] [CrossRef]
  41. Jin, J.K.; Wu, K.; Liu, X.Y.; Huang, G.Q.; Huang, Y.L.; Luo, D.; Xie, M.; Zhao, Y.; Lu, W.; Zhou, X.P.; et al. Building a pyrazole–benzothiadiazole–pyrazole photosensitizer into metal–organic frameworks for photocatalytic aerobic oxidation. J. Am. Chem. Soc. 2021, 143, 21340–21349. [Google Scholar] [CrossRef]
  42. Chai, B.-L.; Yao, S.-L.; Xie, X.; Xu, H.; Zheng, T.-F.; Li, J.-Y.; Chen, J.-L.; Liu, S.-J.; Wen, H.-R. Luminescent metal–organic framework-based fluorescence turn-on and red-shift sensor toward Al3+ and Ga3+: Experimental study and DFT calculation. Cryst. Growth Des. 2022, 22, 277–284. [Google Scholar] [CrossRef]
  43. Li, Y.; Chai, B.-L.; Xu, H.; Zheng, T.-F.; Chen, J.-L.; Liu, S.-J.; Wen, H.-R. Temperature- and solvent-induced reversible single-crystal-to-single-crystal transformations of TbIII-based MOFs with excellent stabilities and fluorescence sensing properties toward drug molecules. Inorg. Chem. Front. 2022, 9, 1504–1513. [Google Scholar] [CrossRef]
  44. Yao, S.L.; Xiong, Y.C.; Tian, X.M.; Liu, S.J.; Xu, H.; Zheng, T.F.; Chen, J.L.; Wen, H.R. A multifunctional benzothiadiazole-based fluorescence sensor for Al3+, Cr3+ and Fe3+. CrystEngComm 2021, 23, 1898–1905. [Google Scholar] [CrossRef]
  45. Li, L.Q.; Yao, S.L.; Tian, X.M.; Zheng, T.F.; Li, J.Y.; Liu, S.J.; Chen, J.L.; Yu, M.H.; Wen, H.R. A fluorescence red-shift and turn-on sensor for acetylacetone derived from ZnII-based metal-organic framework with new topology. CrystEngComm 2021, 23, 2532–2537. [Google Scholar] [CrossRef]
  46. Li, J.; Yao, S.-L.; Zheng, T.-F.; Xu, H.; Li, J.-Y.; Peng, Y.; Chen, J.-L.; Liu, S.-J.; Wen, H.-R. Turn-on and blue-shift fluorescence sensor toward l-histidine based on stable CdII metal-organic framework with tetranuclear cluster units. Dalton Trans. 2022, 51, 5983–5988. [Google Scholar] [CrossRef]
  47. He, Q.Q.; Yao, S.L.; Zheng, T.F.; Xu, H.; Liu, S.J.; Chen, J.L.; Li, N.; Wen, H.R. A multi-responsive luminescent sensor based on a stable Eu(iii) metal-organic framework for sensing Fe3+, MnO4, and Cr2O72− in aqueous solutions. CrystEngComm 2022, 24, 1041–1048. [Google Scholar] [CrossRef]
  48. Wang, Y.-M.; Liu, C.; Zhi, H.; Zhang, X.; Xu, Y.; Wang, Y.; Yang, R.; Yin, X.-B. Thiadiazole-functionalized metal-organic frameworks multifunction-architectonics for dual-target sensing of ethylamine and gossypol. Chem. Eng. J. 2022, 441, 136049. [Google Scholar] [CrossRef]
  49. Jiang, X.; Zhang, J.; Fan, R.; Zhou, X.; Zhu, K.; Yang, Y. Multiple interpenetrating metal-organic frameworks with channel-size-dependent behavior for selective gossypol detection and perovskite quantum dot encapsulation. ACS Appl. Mater. Interfaces 2022, 14, 49945–49956. [Google Scholar] [CrossRef]
  50. Van De Weert, M.; Stella, L. Fluorescence quenching and ligand binding: A critical discussion of a popular methodology. J. Mol. Struct. 2011, 998, 144–150. [Google Scholar] [CrossRef]
  51. Keizer, J. Nonlinear fluorescence quenching and the origin of positive curvature in Stern-Volmer plots. J. Am. Chem. Soc. 1983, 105, 1494–1498. [Google Scholar] [CrossRef]
  52. Santra, A.; Francis, M.; Parshamoni, S.; Konar, S. Nanoporous Cu(I) metal–organic framework: Selective adsorption of benzene and luminescence sensing of nitroaromatics. ChemistrySelect 2017, 2, 3200–3206. [Google Scholar] [CrossRef]
Scheme 1. Structure of gossypol (GSP) and the organic ligands used in the study.
Chemosensors 11 00052 sch001
Figure 1. Crystal structure of MOF 1: (a) The content of the asymmetric unit showing the Cd2+ coordination polyhedron. H-atoms and disordered solvent molecules are omitted; (b) View of the 3D framework along the a axis; (c) Topological representation with interpenetration; (d) Representation of a single cavity in the structure; the yellow sphere represents the solvent-accessible volume. Three out of four im2btd ligands were omitted for clarity.
Chemosensors 11 00052 g001
Figure 2. PXRD patterns of MOF 1 upon soaking in different solvents for 24 h at room temperature.
Chemosensors 11 00052 g002
Figure 3. Excitation and emission photoluminescence spectra of MOF 1: (a) in the solid state; (b) in ethanol suspension.
Chemosensors 11 00052 g003
Figure 4. Luminescence intensity of MOF 1 suspension upon addition of different metal cations (C = 0.1 mM).
Chemosensors 11 00052 g004
Figure 5. Luminescence intensity of MOF 1 suspension upon addition of different antibiotics and gossypol: (a) at 380 nm excitation; (b) at 310 nm excitation.
Chemosensors 11 00052 g005
Figure 6. Fluorometric titration of gossypol: (a) emission spectra of MOF 1 ethanol suspension at 310 nm excitation and different amounts of gossypol added; (b) Linear approximation of luminescence quenching for LOD calculation. The relative luminescence quenching values were calculated from the integral intensities.
Chemosensors 11 00052 g006
Figure 7. Fluorometric titration of gossypol: (a) Emission spectra of MOF 1 ethanol suspension at 310 nm excitation, with different amounts of gossypol added and the cottonseed oil as background; (b) Linear approximation of luminescence quenching for LOD calculation. The relative luminescence quenching values were calculated from the integral intensities.
Chemosensors 11 00052 g007
Figure 8. Frontier molecular orbitals of gossypol and MOF model from DFT calculations (B3LYP 6-311+G(2d,p)): (a) Energy diagram showing HOMO (black) and LUMO (red) energy levels; (b) HOMO and LUMO isosurfaces (at 0.005 e/Bohr3) for the MOF 1 model fragment.
Chemosensors 11 00052 g008
Table 1. Photoluminescence quantum yields of LMOFs containing 2,1,3-benzothiadiazole unit.
LMOFQuantum Yield (%)Reference
{[Zn(tr2btd)(bpdc)]·DMF}n24[37]
HIAM-400144[38]
[Zn2(trz)2(btdb)]·4DMF44[39]
[Zn2(C22O10N2SH8)(H2O)2]·5DMF·10H2O6[40]
[Zn(PBT)]·solvents (JNU-204)9[41]
Table 2. Detection limits for other reported gossypol-sensitive MOFs.
MOFLOD, μMResponseReference
Yb-NH2-TPDC48Turn-on[9]
Eu-TTPDC4.32Turn-off[48]
QBA-Yb1.25Turn-on[14]
In-pdda-10.0489Turn-off[49]
In-pdda-20.0286Turn-off[49]
[Cd(dcdps)(im2btd)]0.64Turn-offThis work
Disclaimer/Publisher’s Note: The statements, opinions and data contained in all publications are solely those of the individual author(s) and contributor(s) and not of MDPI and/or the editor(s). MDPI and/or the editor(s) disclaim responsibility for any injury to people or property resulting from any ideas, methods, instructions or products referred to in the content.

