Abstract
Heptamethine cyanine dyes were synthesized in good yields by the reaction between quaternary indoles and a pentamethinic salt, under mild reaction conditions minimizing photooxidation. These compounds were used as precursors to prepare meso-substituted derivatives. The cyanine dye precursors presented UV-Vis absorption, related to fully allowed electronic transitions and fluorescence emission in the NIR region, without any evidence of aggregation in both ground and excited states. The substitution at the meso position showed a fundamental role in their photophysics, with the main absorption in the green-orange region related to the monomeric species. Moreover, the excited state photophysics presented emission profiles dependent on the excitation wavelengths, complicating the correlation of spectroscopy and structure. Density Functional Theory and OO-SCS-MP2 calculations under different solvation conditions revealed the heavy impact of conjugation effects on ground and excited states’ geometries and electronic configurations of these compounds. Finally, the observed photophysical features of the meso-substituted heptamethine cyanine dyes were successfully used to explore their application as fluorescent probes in biological media, allowing stable staining in live and fixed cells.
1. Introduction
Cyanines are a subclass of heterocyclic compounds ascribed as polymethine dyes presenting, in general, two heterocyclic moieties in their chemical structure where the bridges between them are π-conjugated systems. These compounds can be differentiated by the number of sp2 carbons in the molecule central portion and the nature of the heterocyclic groups present in the peripheral molecular structure [1,2,3,4]. These structural changes allow large absorption intensities and spectral emissions ranging from ultraviolet to near-infrared regions [5,6,7,8]. Moreover, heptamethine cyanine dyes may be substituted at the meso position by reaction with nucleophilic compounds, such as amines, thiols, and aromatic or aliphatic alcohols [9,10,11,12]. In this regard, molecules presenting halogen atoms at the meso position provide a reactive site for this substitution in most cases, through a unimolecular radical nucleophilic substitution (SRN1) mechanism, a substitution reaction in which a certain substituent on an aromatic compound is replaced by a nucleophile through an intermediary free radical species [13]. Additionally, cyanine dyes can be reactive to the environment, showing potential biomedical [14] and sensing applications [15,16], whereas the solvatochromic ones have been emerging mainly for analytical purposes [17]. Based on their electronic properties [18], they have been used as polarity sensors in several studies related to halochromism [19], to study micro-heterogeneity in solution [20] and solvent mixtures [21]. In addition, heptamethine cyanine dyes have attracted attention for utilization in both imaging and therapy in cancer cells, mainly due to their low toxicity, accumulation capability, low autofluorescence, and superior signal-to-noise ratios [22,23,24]. A recent study showed that cyanine dyes efficiently labeled cancer cells and spontaneous tumors in transgenic mice, indicating their potential application to detect cancer metastasis and cancer cells in blood with a high degree of sensitivity [25].
Herein, we present the synthesis and photophysical characterization of new pyrrolidine-substituted heptamethine dyes, where the presence of the non-bonding electrons may be useful for different conjugation pathways where ICT may be present, and its preliminary investigation as fluorescent probes in biological media for cell staining.
2. Materials and Methods
2.1. Materials
2,3,3-Trimethylindolenine (CAS 1640-39-7), 1-iodomethane (CAS 74-88-4), 1-iodobutane (CAS 542-69-8), phosphorus(V) oxychloride (CAS 10025-87-3), 4-ethyl cyclohexanone (CAS 5441-51-0), triethylamine (CAS 121-44-8), hydrochloric acid (37%) (CAS 7647-01-0), aniline (CAS 62-53-3), and pyrrolidine (CAS 123-75-1) were purchased from Sigma-Aldrich (San Luis, MI, USA), and used as received. The syntheses were monitored by thin-layer chromatography using silica gel 60GF254 Merck (Darmstadt, Germany). The solvents acetonitrile (CAS 75-05-8), ethyl acetate (CAS 141-78-6), ethanol (CAS 67-63-0), toluene (CAS 108-88-3), dichloromethane (CAS 75-09-2), methanol (CAS 67-56-1), and hexane (CAS 110-54-3) were purchased from Honeywell (Charlotte, NC, USA), and used as received or purified according to the literature.
2.2. Characterization
Infrared absorption spectra were obtained on a Shimadzu-IR PRESTIGE-21 spectrometer on a KBr disc or operating on attenuated reflectance (ATR) mode, with a resolution of 4.0 cm−1and 20 scans in the 4000–750 cm−1 range. Melting points were determined on a Fisatom 430D apparatus and are uncorrected. 1H and 13C NMR spectra were achieved on a Varian Inova operating at 300 or 400 MHz for 1H and 75 or 100 MHz for 13C, respectively, using deuterated solvents (DMSO-d6 or CDCl3). The chemical shifts (δ) are recorded in ppm and coupling constants (J) in Hz. 1H NMR data have their data expressed as multiplicity (s, singlet; ls, large singlet; d, doublet; t, triplet; q, quintuplet; m, multiplet), coupling constant, and relative number of hydrogens. High-resolution mass spectra (HRMS-ESI) were recorded with electrospray ionization in the positive mode using a Bruker Impact II. The operating conditions were 4.5 kV for capillary voltage, and 33V and 2.5 V for sample and extraction cone voltage, respectively. Nitrogen was used as desolvation gas (N2) to a temperature of 200 °C. Sodium formate was used for calibration. The original spectra from the spectroscopic characterization can be found as (Supplementary material Figures S1–S20). Spectroscopic grade solvents (Aldrich) were used for absorption in the Vis-NIR and fluorescence emission spectroscopies. All experiments were carried out at ambient room temperature (25 °C) using solutions of concentrations between 10−5 and 10−6 M. The measurements were performed using 10 × 10 mm path-length quartz cuvettes. Absorption spectroscopic measurements in the Vis-NIR region were obtained on a Shimadzu UV-2450 spectrometer. Fluorescence emission measurements were obtained on a Shimadzu RF-5301PC spectrofluorometer. The relative fluorescence quantum yields (ΦFL) of the meso-substituted cyanines 8a-b were obtained using cresyl violet in MeOH (ΦFL = 0.54) as a standard [26].
2.3. Synthesis
2.3.1. Indoles 3a-b
To the reaction flask containing acetonitrile (10 mL), previously saturated for 15 min with nitrogen (N2), the 2,3,3-trimethylindolenine 1 (1.9 mmol, 0.302 g) and the respective 1-iodoalkane (2a or 2b) (9.9 mmol, 1.4 g for 2a or 1.8 g for 2b) were added under stirring. The reaction system was heated under reflux and nitrogen atmosphere for 6 h. After this period, the mixture was poured into 50 mL of ethyl acetate under stirring and heated for 30 min, after which time the supernatant was removed. This process was repeated 3 times. The obtained solids were filtered and dried at room temperature (25 °C). Indole 3a: Pale yellow solid. Melting point: 240–242 °C. Yield: 72% (411 mg). 1H NMR (DMSO-d6, 300 MHz): δ (ppm) 7.91 (m, 1H); 7.82 (m, 1H); 7.60 (m, 2H); 3.97 (s, 3H); 2.78 (s, 3H); 1.52 (s, 6H). 13C NMR (DMSO-d6, 75 MHz): δ (ppm) 196.4; 142.5; 142.0; 129.7; 129.2; 123.7; 115.6; 54.4; 35.3; 22.1; 14.9. Indole 3b: Pale yellow solid. Melting point: (217–219 °C) [27]. Yield: 70% (456 mg). 1H NMR (CDCl3, 400 MHz): δ (ppm) 7.64 (m, 1H); 7.61 (m, 3H); 4.67 (t, 2H, J = 7.5 Hz); 3.13 (s, 3H); 1.96 (m, 2H); 1.67 (s, 6H); 1.53 (m, 2H); 1.01 (t, 3H, J = 6.0 Hz). 13C APT NMR (DMSO-d6, 75 MHz): δ (ppm) 195.5; 141.5; 140.7; 130.0; 129.4; 123.4; 115.3; 54.6; 49.7; 29.8; 23.1; 20.0; 17.0; 13.6.
2.3.2. Pentamethine Salt 5 [28]
In an ice bath, phosphorus(V) oxychloride (22 mmol, 2.05 mL) was added dropwise in dimethylformamide (3 mL) and kept under stirring for 30 min. After this period, 4-ethyl cyclohexanone 4 (9.6 mmol, 1.35 mL) was added, and the temperature was increased up to reflux for 2 h. Then, the reaction was brought to room temperature (25 °C), an aniline/ethanol solution (6 mL) (1:1 v/v) was added, and the reaction was kept under stirring at room temperature for an additional 1 h. After this time, the reaction crude was poured into ice-cold H2O and 20 mL of hydrochloric acid (37%) (10:1 v/v). The reaction was allowed to stand at room temperature for 12 h. Then, the solid was filtered, washed with H2O, and recrystallized with toluene. The obtained solid was filtered, dried, and used for the next step without further purification. Pentamethine salt 5: Violet solid. Melting point: (219–222 °C). Yield: 58% (2.15 g). FTIR (KBr, cm−1): 3608, 3521, 3442, 3302, 2953, 2871, 1607, 1565, 1472. 1H NMR (DMSO-d6, 300 MHz): δ (ppm) 11.37 (ls, 2H); 8.51 (s, 2H); 7.60 (m, 4H); 7.44 (m, 4H); 7.25 (m, 2H); 3.07 (m, 2H); 2.18 (m, 2H); 1.65 (m, 1H); 1.47 (m, 2H, J = 7.2 Hz); 1.05 (t, 3H, J = 7.5 Hz).
2.3.3. Heptamethine Cyanine Dyes 6a-b
In a round bottom amber flask containing acetonitrile (20 mL), previously dried and saturated for 15 min with nitrogen (N2), the previously prepared pentamethine salt 5 (0.5 mmol, 0.193 g) was added under stirring and heated up to reflux temperature. In a second flask, acetonitrile (5 mL), triethylamine (1.5 mmol, 0.210 mL), and the respective indole (3a or 3b) (1.5 mmol, 0.261 g for 3a or 0.282 g for 3b) were added and allowed to stir at room temperature (25 °C) for 5 min. After this time, the second flask solution was poured into the first one and then the reaction was allowed to stir at reflux temperature under a nitrogen atmosphere for a further 6 h. The reaction was checked for completion by TLC (dichloromethane/methanol 9:1, v/v). Finally, acetonitrile was evaporated on a rotatory evaporator and 2 mL of methanol was added to the reaction crude. Then, the reaction crude was poured into a solution of 100 mL of ethyl acetate/hexane (1:1 v/v) and placed in an ultrasonic bath for 30 min. After 12 h of solid decantation, the solid was filtered. This process was repeated 4 times. The final solids (6a-b) were filtered and dried. Heptamethine cyanine dye 6a: Green solid. Melting point: (222–223 °C). Yield: 62% (190 mg). FTIR (KBr, cm−1): 3603, 3521, 3326, 2962, 1651, 1551, 1365. 1H NMR (CDCl3, 300 MHz): δ (ppm) 8.34 (d, 2H, J = 12.0 Hz); 7.38 (m, 4H); 7.22 (m, 4H); 6.15 (d, 2H, J = 12.0 Hz); 3.73 (s, 6H); 2.88 (m, 2H); 2.24 (m, 2H); 1.71 (s, 12H); 1.57 (m, 2H); 1.05 (t, 3H, J = 7.5 Hz). 13C NMR (CDCl3, 75 MHz): δ (ppm) 172.9; 150.7; 144.5; 142.7; 140.8; 128.8; 127.0; 125.3; 122.1; 110.9; 101.3; 49.2; 33.6; 32.6; 28.2; 28.0; 11.8. Heptamethine cyanine dye 6b: Green solid. Melting point: 227–228 °C. Yield: 60% (210 mg). FTIR (KBr, cm−1): 3517, 3330, 2957, 2862, 1665, 1556, 1514, 1428. 1H NMR (CDCl3, 400 MHz): δ (ppm) 8.36 (d, 2H, J = 16.0 Hz); 7.41 (m, 4H); 7.29 (m, 2H); 7.21 (m, 2H); 6.20 (d, 2H, J = 12.0 Hz); 4.21 (t, 2H, J = 8.0 Hz); 2.90 (m, 2H); 2.27 (m, 2H); 1.74 (s, 12H); 1.68 (m, 1H); 1.61 (m, 2H); 1.51 (q, 2H; J = 8.0 Hz); 1.04 (m, 9H). 13C NMR (CDCl3, 100 MHz): δ (ppm) 172.4; 150.4; 144.4; 142.1; 141.0; 128.8; 126.5; 125.4; 122.3; 111.0; 101.1; 49.4; 44.8; 33.6; 32.0; 29.4; 28.1; 20.3; 13.8; 11.7.
2.3.4. Meso-Substituted Heptamethine Cyanine Dyes 8a-b
In a round bottom amber flask containing acetonitrile (2 mL), previously dried and saturated for 15 min with nitrogen (N2), the respective cyanine 6a (7.80 × 10⁻² mmol, 0.05 g) or 6b (7.80 × 10⁻² mmol, 0.05 g) was added under stirring. To this solution, pyrrolidine 7 (24.4 mmol, 1.5 mL) was added. The reaction was allowed to stir at reflux temperature under a nitrogen atmosphere for a further 30 min. The reaction was followed by thin-layer chromatography (TLC) using dichloromethane/ethyl acetate/methanol (45:45:10 v/v/v) as eluent. After completion of the reaction, the mixture was evaporated to dryness. The resulting crude residue was purified by column chromatography over silica gel and using the same mixture used for TLC as eluent to afford the derivatives 8a-b. Meso-substituted heptamethine cyanine dye 8a: violet solid. Melting point: 95–98 °C. Yield: 78% (39 mg). FTIR (KBr, cm−1): 3387, 2955, 2917, 2854, 1538, 1305, 1187, 794. 1H NMR (DMSO-d6, 300 MHz): δ (ppm) 7.39 (d, 2H, J = 6.0 Hz); 7.25 (t, 2H, J = 9.0 Hz); 7.16 (d, 2H, J = 12.0 Hz); 7.03 (d, 2H, J = 6.0 Hz); 6.97 (t, 2H, J = 9.0 Hz); 5.44 (d, 2H, J = 6.0 Hz); 4.04 (m, 4H); 3.33 (s, 6H); 2.80 (d, 2H, J = 15.0 Hz); 2.17 (m); 2.0 (m, 4H); 1.57 (s, 6H); 1.54 (s, 6H); 1.46 (m, 2H); 1.02 (t, 3H, J = 9.0 Hz). 13C NMR (DMSO-d6, 75 MHz): δ (ppm) 173.5; 164.3; 144.4; 139.5; 133.9; 128.4; 122.3; 121.6; 121,1; 108.3; 92.2; 55.5; 46.6; 34.2; 29.6; 28.6; 28.2; 24.2; 12.2. HRMS (ESI-qTOF) m/z: [M + H]+ calculated for C38H48N3: 546.3841; found 546.3843. Meso-substituted heptamethine cyanine dye 8b: violet solid. Melting point: 114–115 °C. Yield: 75% (38 mg). FTIR (KBr, cm−1): 3401, 2952, 2918, 2861, 1541, 1187, 1102, 739. 1H NMR (DMSO-d6, 400 MHz): δ (ppm) 7.36 (d, 2H, J = 8.0 Hz), 7.21 (m), 7.13 (d, 2H, J = 12.0 Hz), 6.99 (d, 2H, J = 8.0 Hz), 6.94 (t, 2H, J = 4.0 Hz), 5.46 (d, 2H, J = 12.0 Hz), 4.02 (m, 4H), 3.82 (m), 2.75 (d, 2H, J = 16.0 Hz), 2.14 (m), 1.98 (m, 4H), 1.62 (m, 5H), 1.54 (s, 6H), 1.50 (s, 6H), 1.42 (m, 2H), 1.35 (m, 4H), 0.97 (t, 3H, J = 8.0 Hz), 0.92 (t, 6H, J = 8.0 Hz). 13C NMR (DMSO-d6, 100 MHz): δ (ppm) 172.9; 162.9; 143.4; 139.1; 133.5; 127.9; 121.9; 121.1; 120.4; 107.9; 91.7; 55.1; 46.2; 33.7; 33.5; 29.2; 27.9; 27.6; 23.7; 19.6; 13.7; 11.6. HRMS (ESI-qTOF) m/z: [M+H]+ calculated for C44H60N3: 630.4771; found 630.4782.
2.4. Theoretical Calculations
All DFT and ab initio calculations were performed using the ORCA v5.0.2 quantum chemistry package [29]. Initial geometries for heptamethine cyanine dyes 6a and 8a were obtained after conformational sampling using the CREST software [30]. This procedure was, in turn, based on energies obtained by the accurate semi-empirical method GFN2-xTB [31]. The lowest conformers were subsequently optimized to the ground (GS) and first excited states (ES) using Density Functional Theory via the B97-3c scheme [32], which is a revamped version of Becke’s B97 GGA functional [33], with a slightly modified version of the triple-ζ Def2-TZVP basis set [34] and including the D3 dispersion correction [35] and a Short-Range Basis (SRB) correction [36]. We used an improved version of the Conductor-like Continuum Polarization Model called LR-CPCM to simulate solvent relaxation during geometric optimizations to the ground and excited states [37]. A better description of charge transfers and energy gaps was achieved on a higher OO-SCS-MP2/Def2-TZVP computational level as properties dependent on virtual orbitals are not always correctly described by the DFT method [38]. All calculations were set to tight convergence criteria of 1.0E-08 a.u with isosurfaces using ρ = 0.05 e/Å3 and 3D molecular representations using the CPK color scheme.
2.5. Cellular Stain
The glioblastoma multiform T89G cells were acquired by American Type Culture Collection® (ATCC). The cells were grown in Dulbecco’s modified Eagle’s medium (Gibco™ DMEM, Life Technology, Grand Island, NY, USA) supplemented with 10% heat-inactivated fetal bovine serum (Gibco™ FBS, Life Technology, Grand Island, NY, USA), 100 units·mL−1of penicillin, and 100 g·mL−1of streptomycin at 37 °C in a humidified atmosphere with 5% CO2. To investigate the fluorescence stain capacity of the studied heptamethine cyanine dyes, cells grown on 96-well plates were fixed in paraformaldehyde (4%), washed with PBS, and permeabilized in Triton X-100 (0.01%). The stock solutions of the cyanine dyes were solubilized in ethanol at 5 μM. All solutions were vortexed for 1 min and sonicated for 30 min. The cells were then washed with PBS and incubated with the cyanine dyes chosen as the model, in stock solutions concentrations (30 min, 37 °C). Nuclei were contrasted with Hoechst (4 μg·mL−1 for 10 min). Finally, the cells were imaged in INCell analyzer 2200 (GE Healthcare Life Sciences, Piscataway, NJ, USA) after 30 min and 24 h of staining. To investigate the fluorescence stain capacity in non-fixed samples, cells grown on 96-well plates were washed with PBS and incubated with the studied cyanine dyes in stock solution concentrations (30 min, 37 °C). Nuclei were contrasted with Hoechst (4 μg·mL−1 for 10 min). Finally, the cells were imaged in an INCell analyzer 2200 (GE Healthcare Life Sciences, Piscataway, NJ, USA). To verify if there was a loss of confluence after treatment with cyanine dye 8a, T98G cells were grown in a 96-well plate and incubated with increasing concentrations of the compound (0.005–5μM) and, after 30 min, photos were acquired with an increase of 5x in an inverted optical microscope (TCM400, Labo America, Fremont, CA, USA).
3. Results and Discussion
3.1. Synthesis
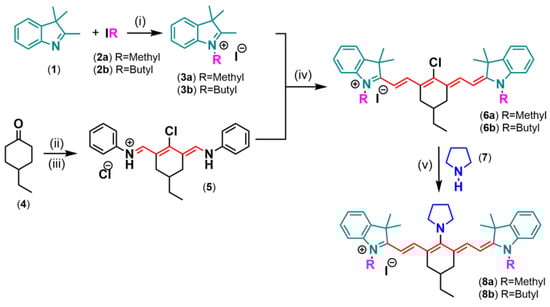
The heptamethine cyanine dyes 6a-b were prepared as presented in Scheme 1. The quaternary indoles 3a-b were synthesized in previously dried, and N2-saturated acetonitrile using an excess of the respective alkyl halides 2a-b [39]. It is worth mentioning that in this reaction, the protection from light and the N2 atmosphere played an important role in this reaction [40]. The heptamethine cyanine dyes 6a-b were synthesized by the reaction between the quaternary indoles 3a-b and the pentamethine salt 5 [41,42,43]. The reaction was performed protected from light in amber round bottom flasks to minimize their photooxidation [43]. HPLC-grade solvents were previously saturated with N2 for at least 20 min, and the reaction took place under an N2 atmosphere during the heating step. These procedures allowed for obtaining the reaction crude presenting only the characteristics of the desired products, suggesting the importance of reducing the photooxidation process during the reaction. It is important to note that the order of substrate addition played a fundamental role in cyanine synthesis. Using the following sequence: pentamethine salt 5, indole 3a-b, and triethylamine, the reaction medium, which is predominantly red due to the high molar absorptivity of the pentamethine salt, turns yellow, and the conversion of reagents is affected after 24 h of reaction. To prove that the yellow color arises from the deprotonated compound 5, triethylamine was added dropwise into an acetonitrile solution of 5. The observed behavior was similar to that expected, where the reaction media became yellow. This result indicates that the pentamethine salt presents higher reactivity in the protonated specie as the literature reports reaction yields between 32 and 45% using pyridine as the solvent [44]. Finally, the meso-substituted heptamethine cyanine dyes 8a-b were prepared as also presented in Scheme 1. In this reaction, an SRN1 mechanism is believed to be present in the presence of aprotic polar solvents, such as dimethylformamide, dimethylsulfoxide, and acetonitrile [13].
Scheme 1.
Synthesis of heptamethine cyanine dyes 6a-b and the respective meso-substituted derivatives 8a-b: (i) acetonitrile, N2, reflux, 6 h; (ii) POCl3/dimethylformamide, reflux 2 h; (iii) aniline/ethanol, 1h, H2O/HCl, r.t. 15 h; (iv) acetonitrile, triethylamine, reflux, 6 h; (v) acetonitrile, N2, reflux, 30 min.
3.2. Photophysical Characterization
The photophysical study in solution was performed using organic solvents with different dielectric constants (ethyl acetate, dichloromethane, methanol, and acetonitrile). The relevant data from the steady-state ground and excited states characterization are summarized in Table 1. Figure 1 presents the UV-Vis absorption and fluorescence emission spectra of the heptamethine cyanine dye 6a, which was chosen as a representative structure of the synthesized cyanine precursor. It is worth mentioning that the cyanine dye 6b presented absorption and emission curves with similar shapes and absorption maxima locations (Figure S21).

Table 1.
Photophysical data of heptamethine cyanine dyes 6a-b in solution, where λabs and λem are the absorption and emission maxima (nm), respectively; ε is the molar extinction coefficient (M−1·cm−1); fe is the calculated oscillator strength; is the calculated radiative rate constant (×108 s−1); τ0 is the calculated pure radiative lifetime (ns); ΔλST is the Stokes shift (nm/cm−1); Eg is the optical bandgap (eV).
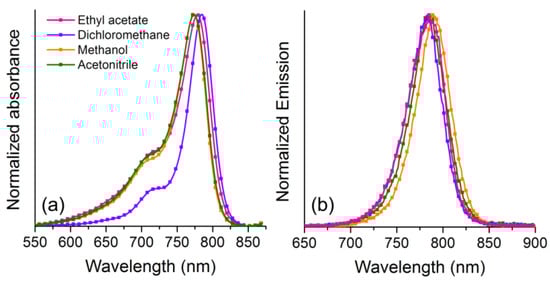
Figure 1.
(a) UV-Vis absorption and (b) steady-state fluorescence emission spectra in solution of different organic solvents (~10−6 M) of the heptamethine cyanine dye 6a.
The heptamethine cyanine dye 6a presents absorption maxima in the NIR region, between 774 and 789 nm, depending on the solvent polarity with no clear tendency on the environment polarity. It could be observed that the cyanine dyes presented an absorption maxima variation (Δλabs) of 14 nm/229 cm−1 (6a) and 9 nm/146 cm−1 nm (6b), which can be related to cyanine-type electronic transitions, as already observed in similar compounds [9]. In this evaluation, methanol was excluded due to its specific interactions with the compounds. In addition, the UV-Vis spectra plotted in epsilon value showed similar intensities (Figure S22), which exclude a possible ion-pairing effect that may occur in the less polar environment, especially considering an iodine counterion [45]. The photophysical investigation in the ground state also allowed for obtaining the experimental extinction coefficient (ε) and, from the Strickler–Berg relations (Equations (1) and (2)), the theoretical rate constant for emission (k) and the respective oscillator strengths (fe) [46]:
For an electronic transition, the respective oscillator strength can be obtained from Equation (1), which relates the area under the absorption curve from a plot of the molar absorptivity coefficient ε (M−1·cm−1) against wavenumber (cm−1). The same integral, applying Equation (2), allows the obtention of the theoretical rate constant for emission (k) (Equation (2), where the definition of ν is the wavenumber (energy in 1/λ units) of the absorption band maximum). In addition, from the k, the pure radiative lifetime τ0 can be obtained, defined as 1/k [47]. The high molar absorptivity coefficient values (ε~105 cm−1·M−1), as well as the respective calculated radiative rate constants (k), indicate, for all studied compounds, spin- and symmetry-allowed electronic transitions, which could be related to 1π–π* transitions (Table 1). It could also be observed in methanol that these cyanines presented an increase in the molar absorptivity coefficient value, increasing the alkyl chain of the indolic ring, as already reported in the literature [41]. The observed electronic transitions are associated with a small optical bandgap between the HOMO and LUMO orbitals (~1.5 eV) as already reported for different chromophores absorbing in the NIR region [48,49]. Moreover, such transitions are related to non-aggregated species, so-called monomeric ones [50]. In this sense, it is worth mentioning that the studied heptamethine cyanine dyes presented shoulder-like blue-shifted absorption, located around 720 nm, which is usually reported in the literature as an electronic transition related to the formation of H-type aggregates [51,52]. To clarify this topic, fluorescence emission spectra of these compounds were acquired at different concentrations and excitation wavelengths, including 720 nm. In addition, their respective excitation spectra were also obtained (Figures S23–S27). These results indicate that the observed blue-shifted bands are probably related to vibronic structure. In addition, an almost constant radiative lifetime τ0 suggests that after the radiation absorption, the heptamethine cyanine dyes populate the same excited state. Figure 1b depicts the fluorescence emission spectra, obtained by exciting the compounds at the absorption maxima (Table 1). In general, these compounds present a relatively sharp emission between 700 and 850 nm, with a small Stokes shift (up to 12 nm/197 cm−1), which is characteristic for this class of molecules, showing almost absent differences between the electronic structure of the ground and excited states.
The photophysical study in solution was also performed for the meso-substituted heptamethine cyanine dyes 8a-b. The relevant data from the steady-state ground and excited states characterization are summarized in Table 2. The fluorescence emission spectra were obtained by exciting the compounds at the absorption located between 559 and 611 nm (Table 2). Figure 2 shows the absorption of cyanine dye 8a (Figure 2a) and 8b (Figure 2b), as well as a concentration study of compound 8b in acetonitrile.
Table 2.
Photophysical data of heptamethine cyanine dyes 8a-b in solution, where λabs is the absorption maximum (nm), ε is the molar extinction coefficient (M−1·cm−1), fe is the calculated oscillator strength, k is the calculated radiative rate constant (×108 s−1), and τ0 is the calculated pure radiative lifetime (ns).
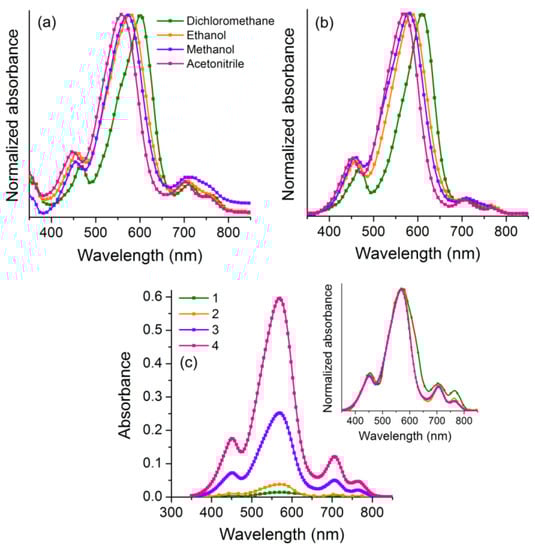
Figure 2.
Normalized UV-Vis absorption spectra of heptamethine cyanine dyes (a) 8a and (b) 8b in a solution of different organic solvents (~10−6 M) and (c) cyanine dye 8b in acetonitrile at different concentrations (1:5.0 × 10⁻⁷ M, 2:1.0 × 10⁻⁶ M, 3:5.0 × 10⁻⁶ M, and 4:5.0 × 10⁻⁵ M). The inset shows the respective normalized UV-Vis spectra. (DCM = dichloromethane).
It can be observed that both cyanines present absorption in the visible region, with any significant dependence on the alkyl chain. In addition, the main absorption bands shift to lower wavelengths (559–611 nm) if compared to the cyanine precursors 6a-b (~780 nm), as well as present a more significant solvatochromism (43 nm for 8a and 41 nm for 8b). Although it does not present a clear tendency, this latter seems to present a negative solvatochromic effect, indicating a higher dipole moment in the ground state. All these features indicate a loss of cyanine character, allowed by the substitution at the meso position of the cyanine [10]. In this case, the change of the chlorine atom by pyrrolidine seems to increase the electron-donating ability of the central substituent, allowing a progressive localization of the positive charge on the central carbon atom of the polymethine chain. Thus, the charge delocalization on the π-conjugated structure is reduced, and the cyanine character is lost. Instead, a bis-dipole structure is reached, described as a central cationic acceptor bearing two electron-donating moieties [53]. In addition, by applying the Strickler–Berg relations, the main electronic transitions could be related to fully allowed transitions, related to π–π* (Table 2). It is worth mentioning that these derivatives presented additional absorption bands located around 450 nm, as already observed in the literature for similar compounds [11]. As already discussed for precursors 6a-b, it is believed that these bands arise from the monomeric species, being related to vibronic structures of the cyanines and not from H-aggregates, as usually reported in the literature [54]. Finally, an additional red-shifted absorption band located around 700 nm was already observed [11], which is absent in the cyanine precursors. The correlation between J-aggregates and this absorption band located at longer wavelengths was discarded as it is well-known that these aggregates present quite particular features. The absorption maxima shift to longer wavelengths (~100 nm) with a dramatic sharpening in width (10–20 nm) [55], and a strong increase in the molar absorbance in comparison with isolated monomers [56]. These aggregates are concentration-dependent, a behavior that was not observed in the studied cyanine dye 8b in acetonitrile (Figure 2c). For the concentration study, similar results were found in dichloromethane, 1,4-dioxane, and ethanol (Figures S28 and S29). Additional experiments were also performed as already discussed in the literature to induce the aggregation in these compounds [57], without any clear indication of its formation (Figures S31 and S32), which corroborates with the affirmation that all observed absorption bands are related to their monomeric species. Although the excited state investigation concerning heptamethinecyanines is less studied if compared to the UV-Vis data, probably due to its particular photophysics, some studies can be found and are related to the presence of monomeric species in solution or even aggregates [58]. In this way, aiming to bring some light to this discussion and based on the ground state results obtained in this investigation, the steady-state fluorescence emission was performed with cyanine dyes 8a-b. In this sense, PL spectra were obtained at different excitation wavelengths (Figure 3a,b). The relevant data from this investigation are summarized in Table 3. It is worth mentioning that the emission spectra of cyanine dye 8a presented the same emission profile (Figures S33 and S34). It can be observed that cyanine dye 8b after excitation between 581 and 611 nm presents in all studied solvents a dual fluorescence emission located around 650 and 750 nm. The main emission in dichloromethane and polar protic media is located at higher energies, and in acetonitrile, the emission band is located at longer wavelengths (Figure 3a). However, under excitation between 708 and 715 nm, the main fluorescence emission can be observed located around 725 nm (Figure 3b). Based on the ground and excited state photophysics, the observed emission profiles seem not to be related to aggregation in solution [58]. In addition, relatively large Stokes shift values (3329–4868 cm−1) could be calculated for the synthesized compounds under excitation between 581 and 611 nm, as shown in Table 3. Usually, this parameter is polarity dependent, as observed in this study, where more polar solvents presented higher Stokes shift values. This behavior indicates that different electronic structures are present between the ground and the excited states, as reported in the literature for similar compounds [18]. Thus, it is believed that the observed dual fluorescence emission with a large Stokes shift may be evidence of intramolecular charge transfer (ICT) between electron donor and acceptor groups present in the molecular structure [18]. In this way, as observed in Figure 3a, the emission profiles can be related to both locally excited (blue-shifted, Stokes shift ~1500 cm−1) and charge transfer (red-shifted, Stokes shift ~4000 cm−1) species. The fluorescence quantum yield values were measured from emission curves obtained using the absorption maxima as excitation wavelengths, and the values are in agreement with the literature [11].
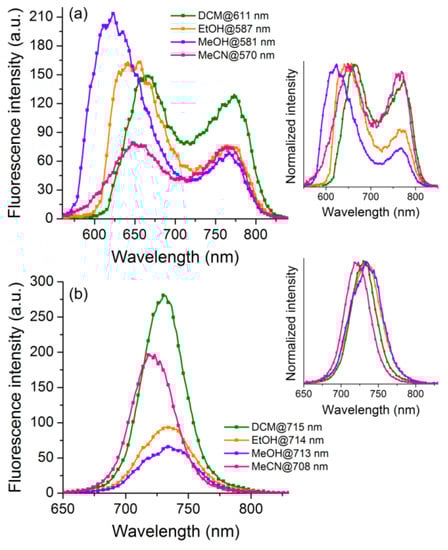
Figure 3.
Steady-state fluorescence emission spectra of heptamethine cyanine dye 8b in a solution of different organic solvents (~10−6 M) at excitation wavelength between (a) 581 and 611 nm (Table 2) and (b) 708 and 715 nm (Table S2). The inset shows the respective normalized spectra. (DCM = dichloromethane, MeCN = acetonitrile and MeOH = methanol).
Table 3.
Excited-state photophysical data of meso-substituted heptamethine cyanine dyes 8a-b in solution, where λem is the emission maximum (nm) at different excitation wavelengths (λexc in nm), ΔλST is the Stokes shift (cm−1), and ΦFL is the fluorescence quantum yield.
On the other hand, due to the single fluorescence emission with a small Stokes shift (~500 cm−1), the observed emission in Figure 3b seems to arise from a locally excited specie. To better understand the observed photophysics, the difference in the dipole moments between the excited and ground states was obtained for cyanine dye 8b by applying the simplified Lippert–Mataga correlation presented in Equation (3) [59], where h is Planck’s constant, c is the speed of light, a is the Onsager cavity radius, and μg and μe are the dipole moments of the solute in the ground and excited states, respectively. In this plot, a linear relation of the absorbance or fluorescence maxima versus the solvent polarity function can be related to the internal charge transfer character [60,61]. The relevant data from this investigation are summarized in Table S1. Macroscopically, Equation (3) relates solvatochromic shifts from the Stokes shift versus the orientation polarization function (Δf). This latter is given by Equation (4) [47], where ε and n are the dielectric constant and the refractive index, respectively, for a mixture of solvents (Equations (5) and (6)) [62]. In this mixture, fA and fB are the volumetric fractions of the two solvents.
Figure 4 presents the Lippert–Mataga relationship between the absorption or emission maxima, as well as the Stokes shift. It is worth mentioning that this investigation was focused on the locally excited and intramolecular charge transfer emissions (see Figure 3a). The linear relationship between the absorption maxima with increasing solvent polarity (Figure 4a) and the upward curvature indicates that cyanine dye 8b seems to be significantly destabilized in a more polar environment [63]. Taking the two emission bands into account (Figure 4b), a similar feature can be observed, once again with a positive slope with the solvent polarity function Δf. These results indicate that despite quaternary nitrogen in the indolic moiety, this compound seems to present low polarity in both ground and excited states. This latter can be related to a very effective delocalization of the positive charge into the cyanine skeleton. Surprisingly, the emission bands also seem to be equally affected by the solvent polarity (Figure 4c). Excitation spectra obtained from the fluorescence emission presented in Figure 3 indicate a quite similar absorption profile to those observed in the UV-Vis spectra (Figures S35–S40). Moreover, using 650 nm and 750 nm as the observation wavelengths, it can be observed that the higher intensities are located around 600 nm, as expected. In contrast, the excitation spectra from Figure 4b present a magnification of the signal located around 700 nm, if compared to the UV-Vis (Figure 2b). This behavior was also expected, indicating that the main fluorescence emission observed at 725 nm is really due to the species with absorption around 700 nm, which is different from the species absorbing between 581 and 611 nm.
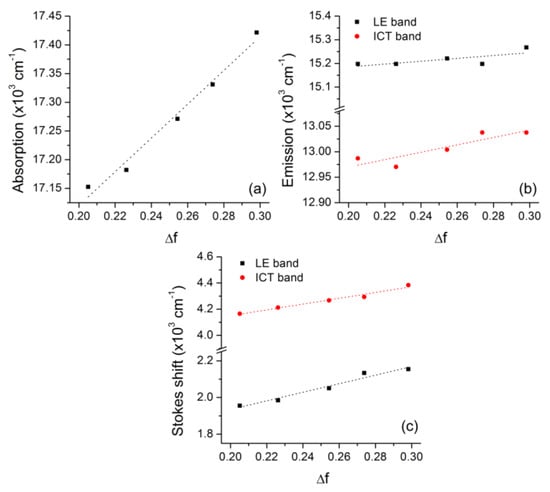
Figure 4.
Solvent effect on the spectral position of the (a) absorption, (b) fluorescence emission maxima at LE and ICT bands, and respective (c) Stokes shift for cyanine dye 8b in different acetonitrile/1,4-dioxane mixtures.
3.3. Theoretical Calculations
Cyanine dyes 6a and 8a, chosen as models for the theoretical investigation, have a large chemical space composed, respectively, of 201 and 33 unique conformers. Structure 6a has the lowest conformer appearing at 38.6% of the Boltzmann population separated from the second lowest conformer (8.0% of the Boltzmann population) by 0.010 kcal·mol−1. Similarly, the Boltzmann distributions indicate that the most stable conformer for cyanine 8a corresponds to 36.13% of the population, separated from the second lowest conformer (1.9% of the Boltzmann population) by 0.047 kcal·mol−1 (Figure 5).
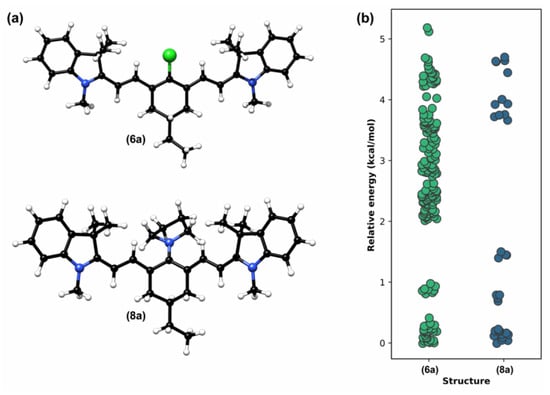
Figure 5.
(a) Lowest and more stable conformers for cyanine dyes 6a and 8a, and (b) relative energy distribution of every unique conformer on its respective chemical space.
The selected lower conformers underwent geometric optimizations to the ground and first excited states using Density Functional Theory on the B97-3c scheme. All optimizations accounted for relaxed solvation effects and the ground states are confirmed to be true energy minima by the absence of imaginary vibrational modes. The final ground state geometries showed small distortions due to solvent effects. Cyanine dye 6a showed small distortions after optimizations with acetonitrile, dichloromethane, and methanol with an average RMSD of 0.007Å. Similarly, cyanine 8a after being optimized under acetonitrile, dichloromethane, ethyl acetate, and methanol differs by an average RMSD of only 0.23 Å from each other. As expected, differences between ground and first excited state geometries are small (Figure S41), as electronic absorption occurs extremely fast [62]. As can be seen in Figures S42 and S43, the change in the solvation environment also has just a small effect on the HOMO-LUMO gap described by Density Functional Theory, leading to variations in the order of milihartrees. An additional investigation based on the CHarges from Electrostatic Potentials using a Grid-based method (CHELPG) [64] showed, also, that the solvation environment itself has little to no impact on atomic charge distribution. A standard deviation (σ) of 0.001 charge units for 6a and 0.003 charge units for cyanine dye 8a was obtained after comparing the implicit solvation models by Density Functional Theory, as can be seen in data available in Tables S2 and S3. After confirming that solvation effects have only small impacts on geometric and electronic configurations, our analysis of ground and excited state geometries was based on a higher computational level based on Orbital-Optimized, Spin-Component Scaled Second Order Many-Body Perturbation Theory (OO-SCS-MP2) to avoid restrictions imposed by the Koopmans theorem on Density Functional Theory [65,66]. The HOMO-LUMO gap observed for cyanine dye 8a on the ground state is 6.57 eV with a slight reduction in the excited state configuration to a gap of 6.42 eV. Charge transfer seems to be extremely relevant during the GS-ES transition due to an observed increase in dipole moment measured by the relaxed MP2 electronic density, going from 2.93 to 3.14 Debye, a 7% increase with noticeable dipole vector repositioning (Figure 6). The same trend is observed for cyanine precursor 6a, but with a remarkable increase of 27.32%, from 1.83 to 2.33 Debye; the orientation of the total dipole moment vector is, also, drastically changed, as can be seen in Figure 6, indicating a relevant charge transfer effect between GS and ES.
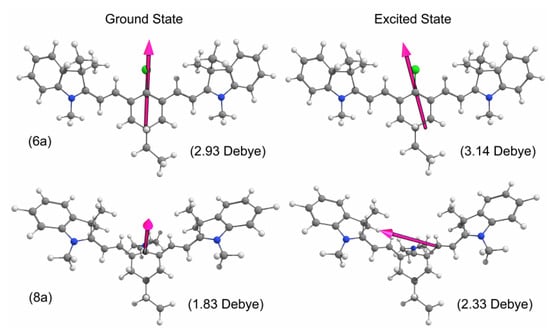
Figure 6.
Change in dipole moment between ground and excited state of cyanine dyes 6a (top) and 8a (bottom).
Our analysis using the Molecular Electrostatic Potential Surface (MEPS) reveals that both molecules have a higher concentration of negative charge (represented in red) toward the center (Figure S44), while the indoline “wings” remain, overall, positively charged. Upon transition to the first excited state, the meso-substituted heptamethine cyanine dye 8a migrates a considerable amount of negative charge to the center-left side of the molecule, in the opposite direction of the ethyl “tail”. Charge transfer visualization using MEPS is not as straightforward for cyanine dye 6a, because the dipole moment change is also due to a greater geometric change on the excited state and not just due to an almost vertical ground-to-excited transition as expected on cyanine 8a. It is still possible to discern a slight increase in negative charge toward the upper center of the molecule as the wings become more positive. The Configuration Interaction Singles (CIS) calculated for both cyanines corroborates that only the immediate frontier orbitals are substantially involved in the first electronic transition with an 89% HOMO-LUMO character for cyanine 8a and 86% HOMO-LUMO character for cyanine 6a. The Electronic Density Difference (EDD) [67] was used as a tool to describe the dynamic vertical charge transfer between the frontier orbitals by exploring the hole–particle formalism (Figure 7a). It could also be observed that, to some extent, conjugation plays an important role in the ground state of the molecules and their first excited state (Figure 7b). Applying the Pipek–Mezey localization method [68,69], it was possible to quantify the bonds with high delocalization character. Cyanine dye 6a accounts for a significantly higher delocalized orbital composition, presenting 10 bonds with a small electronic population. On the other hand, cyanine dye 8a presents only 6 delocalized orbitals, probably due to not being as planar as dye 6a and reducing the conjugation effects.
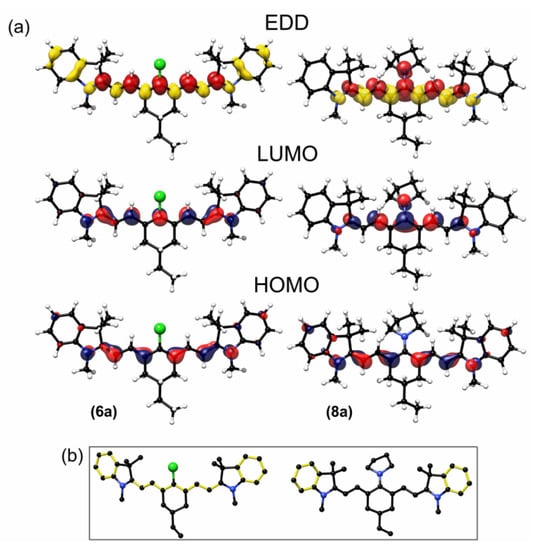
Figure 7.
(a) Electronic Density Difference (EDD) with isosurface = 0.0016 for cyanine dyes 6a and 8a. The red color indicates a vertical charge increase and the yellow indicates avertical charge decrease for the GS-ES transition. HOMO and LUMO orbitals have isosurface = 0.05 with the (+) phase color coded as red and the (−) phase as blue. (b) Bonds with strong delocalized character (yellow) calculated by the Pipek–Mezey method. Hydrogens were omitted for clarity.
3.4. Bioimaging
It was observed that all studied meso-substituted cyanines kept their optical properties in the dark at room temperature for over 4 weeks, presenting UV-Vis and PL spectra with similar intensity and shape. It was reported that traditional cyanine dyes display poor photostability [16,70,71]; however, it was observed that the incorporation of a rigid cyclohexenyl ring in the polymethine chain leads to increased photostability [72]. In addition, it was also reported that an improved photostability on the cyanine scaffold takes place upon the incorporation of electron-withdrawing groups [73]. Based on these results, and the studies regarding very close structures with their respective photostability studies [71,73], it was decided to investigate their ability in cell staining without a previous photostability experiment, as usually presented in the literature [42,73]. In this sense, their ability to stain cellular compartments in fixed and live cells was explored (Figure 8 and Figure 9). As shown in Figure 8, cyanine dye 8a, used as a model, showed strong staining of cellular cytoplasm with long-lasting staining, remaining 24 h after the incubation in fixed cells. Similarly, the cyanine could also stain the cellular cytoplasm of live cells (Figure 9). It was also verified whether this cyanine could compromise cell adhesion (Figure 10), where there is no impairment of cell adhesion. These results demonstrated that cyanine dye 8a could be used as a fluorescent probe in biotechnology and, more specifically, in protocols of cytochemistry for cytoplasm labeling. Further investigations are in progress for specific staining of selected organelles.
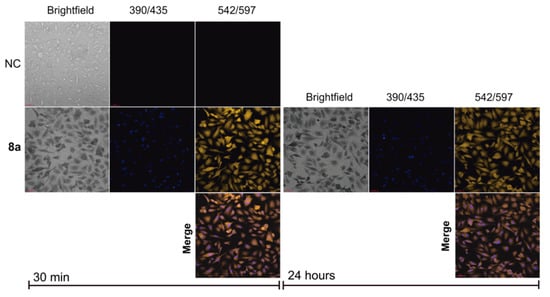
Figure 8.
Fluorescent staining of fixed (paraformaldehyde 4%) cells using the meso-substituted cyanine 8a (5 μM). The first column shows the brightfield, the central column showsthe fluorescence of cells incubated with the nuclear dye Hoescht, and the third column shows cyanine 8a. The result after 30 min of incubation is shown on the left, and that after 24 h of incubation is shown on the right. The first line represents cells without dye (negative control) and the third line represents the merge of Hoescht and cyanine 8a. Scale bar (red) = 60 μm.
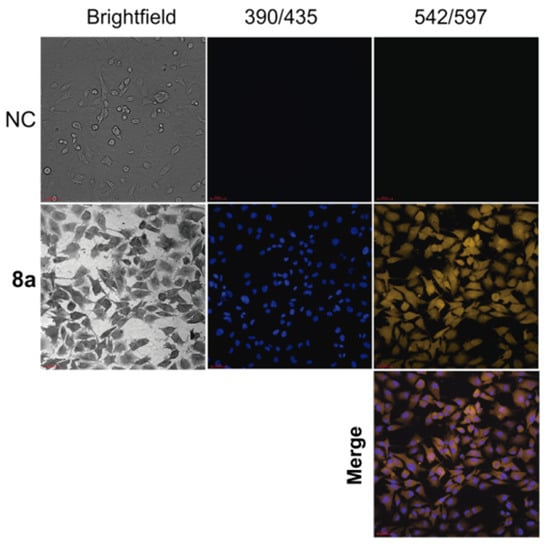
Figure 9.
Fluorescent staining of live cells using the meso-substituted cyanine 8a (5 μM). The images were obtained 30 min after incubation. NC = control. The first column shows the brightfield, the central column showsthe fluorescence of cells incubated with the nuclear dye Hoescht, and the third column shows cyanine 8a. The first line represents cells without dye (negative control), the second line represents cells exposed to cyanine 8a, and the third line represents the merge of Hoescht and cyanine 8a. Scale bar (red) = 60 μm.
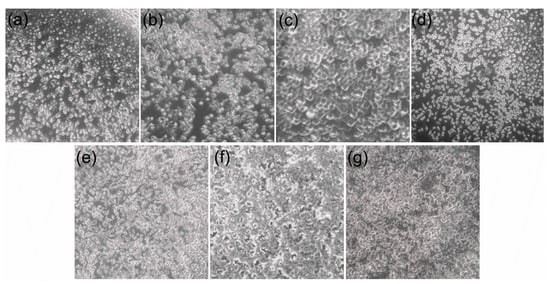
Figure 10.
Optical images of cellular confluence after treatment of increasing doses of cyanine dye8a: (a) negative control, (b) 0.005 μM, (c) 0.01 μM, (d) 0.05 μM, (e) 0.1 μM, (f) 0.5 μM, and (g) 5.0 μM after 30 min of incubation.
4. Conclusions
Chlorine heptamethine cyanine dyes were obtained in good yields using a methodology between quaternary indoles and a pentamethine salt, minimizing photooxidation. These cyanines presented a simple and behaved photophysical behavior with no evidence of aggregation in both ground and excited states. In a second step, they were used as molecular scaffolds to synthesize meso-substituted derivatives by reaction with pyrrolidine via the SRN1 mechanism with good yields. In this case, the substitution at the meso position showed a fundamental role in their photophysics, presenting intricate behavior but still related to monomeric species. DFT calculations showed that solvation effects, despite being present, are not responsible for relevant geometric or electronic changes on the studied cyanine dyes. Charge transfers between the ground and first excited states are responsible for an increase in negative charge to the center of the molecule, while the external rings become more positive. It is also clear that conjugation effects are much more active on the meso-substituted heptamethine cyanine dye due to its greater planarity in comparison to its chlorine heptamethine cyanine dye precursor. Finally, the observed photophysical features of the meso-substituted heptamethine cyanines were successfully used to explore their application as fluorescent probes in biological media, showing potential for cytoplasm labeling.
Supplementary Materials
The Supplementary Materials are available online at https://www.mdpi.com/article/10.3390/chemosensors11010047/s1. Figures S1–S20 (original spectra from the spectroscopic characterization), Figures S21–S40 and Table S1 (additional photophysical data), and Figures S41–S44, and Tables S2 and S3 (additional theoretical data).
Author Contributions
Conceptualization, F.S.R., D.J.M., H.d.C.S.J. and R.d.C.D.; methodology, R.d.C.D., H.d.C.S.J., D.J.M. and F.d.S.S.; validation, F.S.R. and D.J.M.; investigation, D.d.S.F., A.M.M., L.K.R., F.d.S.S., H.d.C.S.J. and R.d.C.D.; resources, F.S.R. and D.J.M.; writing—original draft preparation, F.S.R., D.J.M. and H.d.C.S.J.; writing—review and editing, R.d.C.D., H.d.C.S.J., D.J.M. and F.S.R.; visualization, F.S.R.; supervision, F.S.R. and D.J.M.; project administration, F.S.R.; funding acquisition, F.S.R. and D.J.M. All authors have read and agreed to the published version of the manuscript.
Funding
This research was funded by Fundação de Amparo à Pesquisa do Estado do Rio Grande do Sul (FAPERGS), grant number 17/2551-0000968-1; National Council for Scientific and Technological Development (CNPq), grant number 409855/2018-9 and 305954/2019-9 and Coordenação de Aperfeiçoamento de Pessoal de Nível Superior (CAPES), Finance Code 001.
Institutional Review Board Statement
Not applicable.
Informed Consent Statement
Not applicable.
Data Availability Statement
Not applicable.
Acknowledgments
All theoretical calculations were performed using the Lobo Carneiro supercomputer from Núcleo Avançado de Computação de Alto Desempenho (NACAD), under Project ID a20006e.
Conflicts of Interest
The authors declare no conflict of interest.
References
- Reichardt, C. Chiral polymethine dyes: A remarkable but forgotten conjugated π system. J. Phys. Org. Chem. 1995, 8, 761–773. [Google Scholar] [CrossRef]
- Panigrahi, M.; Dash, S.; Patel, S.; Mishra, B.K. Syntheses of cyanines: A review. Tetrahedron 2012, 68, 781–805. [Google Scholar] [CrossRef]
- Bricks, J.L.; Kachkovskii, A.D.; Slominskii, Y.L.; Gerasov, A.O.; Popov, S.V. Molecular design of near infrared polymethine dyes: A review. Dyes Pigm. 2015, 121, 238–255. [Google Scholar] [CrossRef]
- Shindy, H.A. Fundamentals in the chemistry of cyanine dyes: A review. Dyes Pigm. 2017, 145, 505–513. [Google Scholar] [CrossRef]
- Bouit, P.A.; Aronica, C.; Toupet, L.; Le Guennic, B.; Andraud, C.; Maury, O. Continuous symmetry breaking induced by ion pairing effect in heptamethine cyanine dyes: Beyond the cyanine limit. J. Am. Chem. Soc. 2010, 132, 4328–4335. [Google Scholar] [CrossRef]
- Strehmel, B.; Schmitz, C.; Kütahya, C.; Pang, Y.; Drewitz, A.; Mustroph, H. Photophysics and photochemistry of NIR absorbers derived from cyanines: Key to new technologies based on chemistry. Beilstein J. Org. Chem. 2020, 16, 415–444. [Google Scholar] [CrossRef]
- Štacková, L.; Muchová, E.; Russo, M.; Slavíček, P.; Štacko, P.; Klán, P. Deciphering the structure-property relations in substituted heptamethine cyanines. J. Org. Chem. 2020, 85, 9776–9790. [Google Scholar] [CrossRef]
- Usama, S.M.; Thompson, T.; Burgess, K. Productive manipulation of cyanine dye π-networks. Angew. Chem. Int. Ed. 2019, 8, 8974–8976. [Google Scholar] [CrossRef]
- Exner, R.M.; Cortezon-Tamarit, F.; Pascu, S.I. Explorations into the effect of meso-substituents in tricarbocyanine dyes: A path to diverse biomolecular probes and materials. Angew. Chem. Int. Ed. 2020, 60, 6230–6241. [Google Scholar] [CrossRef]
- Pascal, S.; Haefele, A.; Monnereau, C.; Charaf-Eddin, A.; Jacquemin, D.; Le Guennic, B.; Andraud, C.; Maury, O. Expanding the polymethine paradigm: Evidence for the contribution of a bis-dipolar electronic structure. J. Phys. Chem. A 2014, 118, 4038–4047. [Google Scholar] [CrossRef]
- Zhang, J.; Moemeni, M.; Yang, C.; Liang, F.; Peng, W.T.; Levine, B.G.; Lunt, R.R.; Borhan, B. General strategy for tuning the Stokes shifts of near infrared cyanine dyes. J. Mater. Chem. C 2020, 8, 16769–16773. [Google Scholar] [CrossRef]
- Sissa, C.; Painelli, A.; Terenziani, F.; Trotta, M.; Ragni, R. About the origin of the large Stokes shift in aminoalkyl substituted heptamethine cyanine dyes. Phys. Chem. Chem. Phys. 2020, 22, 129–135. [Google Scholar] [CrossRef]
- Gragg, J.L. Synthesis of Near-Infrared Heptamethine Cyanine Dyes. Ph.D. Thesis, Georgia State University, Atlanta, GA, USA, 2010. [Google Scholar]
- Gorka, A.P.; Nani, R.R.; Schnermann, M.J. Cyanine polyene reactivity: Scope and biomedical applications. Org. Biomol. Chem. 2015, 13, 7584–7598. [Google Scholar] [CrossRef] [PubMed]
- Dimer, L.M.Z.; Machado, V.G. Chromogenic and fluorogenic chemosensors for detection of anionic analites. Química Nova 2008, 31, 2134–2146. [Google Scholar] [CrossRef]
- Sun, W.; Guo, S.; Hu, C.; Fan, J.; Peng, X. Recent Development of chemosensors based on cyanine platforms. Chem. Rev. 2016, 116, 7768–7817. [Google Scholar] [CrossRef] [PubMed]
- Reichardt, C. Pyridinium-N-phenolate betaine dyes as empirical indicators of solvent polarity: Some new findings. Pure Appl. Chem. 2008, 80, 1415–1432. [Google Scholar] [CrossRef]
- Peng, X.; Song, F.; Lu, E.; Wang, Y.; Zhou, W.; Fan, J.; Gao, Y. Heptamethine cyanine dyes with a large Stokes shift and strong fluorescence: A paradigm for excited-state intramolecular charge transfer. J. Am. Chem. Soc. 2005, 127, 4170–4171. [Google Scholar] [CrossRef]
- Machado, V.G.; Nascimento, M.G.; Rezende, M.C. The halochromism of the 1-methyl-8-oxyquinolinium dye. Spectrosc. Lett. 1998, 31, 359–367. [Google Scholar] [CrossRef]
- Tada, E.B.; Novaki, L.P.; El Seoud, O.A. Solvatochromism in cationic micellar solutions: Effects of the molecular structures of the solvatochromic probe and the surfactant headgroup. Langmuir 2001, 17, 652–658. [Google Scholar] [CrossRef]
- Keum, S.R.; Roh, S.J.; Ahn, S.M.; Lim, S.S.; Kim, S.H.; Koh, K. Solvatochromic behavior of non-activated indolinobenzospiropyran 6-carboxylates in aqueous binary solvent mixtures. Part II. Dyes Pigm. 2007, 74, 343–347. [Google Scholar] [CrossRef]
- Medeiros, N.G.; Braga, C.A.; Câmara, V.C.; Duarte, R.C.; Rodembusch, F.S. Near-Infrared fluorophores based on heptamethine cyanine dyes: From their synthesis and photophysical properties to recent optical sensing and bioimaging applications. Asian J. Org. Chem. 2022, 11, 118–149. [Google Scholar] [CrossRef]
- Thomas, R.G.; Jeong, Y.Y. NIRF heptamethine cyanine dye nanocomplexes for multi modal theranosis of tumors. Chonnam Med. J. 2017, 53, 83–94. [Google Scholar] [CrossRef]
- Cosco, E.D.; Spearman, A.L.; Ramakrishnan, S.; Lingg, J.G.; Saccomano, M.; Pengshung, M.; Arús, B.A.; Wong, K.C.; Glasl, S.; Ntziachristos, V.; et al. Shortwave infrared polymethine fluorophores matched to excitation lasers enable non-invasive, multicolour in vivo imaging in real time. Nat. Chem. 2020, 12, 1123–1130. [Google Scholar] [CrossRef]
- Yang, X.; Shi, C.; Tong, R.; Qian, W.; Zhau, H.E.; Wang, R.; Zhu, G.; Cheng, J.; Yang, V.W.; Cheng, T.; et al. Near IR heptamethine cyanine dye-mediated cancer imaging. Clin. Cancer Res. 2010, 16, 2833–2844. [Google Scholar] [CrossRef]
- Myochin, T.; Kiyose, K.; Hanaoka, K.; Kojima, H.; Terai, T.; Nagano, T. Rational design of ratiometric near-infrared fluorescent pH probes with various pKa values, based on aminocyanine. J. Am. Chem. Soc. 2011, 133, 3401–3409. [Google Scholar] [CrossRef]
- Duarte, R.C.; Reimann, L.K.; Rodembusch, F.S.; Duarte, L.G.T.A. 1-Butyl-2,3,3-trimethylindol-1-ium iodide. IUCrData 2018, 3, x181130. [Google Scholar] [CrossRef]
- Menéndez, G.O.; Pichel, M.E.; Spagnuolo, C.C.; Jares-Erijman, E.A. NIR fluorescent biotinylated cyanine dye: Optical properties and combination with quantum dots as a potential sensing device. Photochem. Photobiol. Sci. 2013, 12, 236–240. [Google Scholar] [CrossRef]
- Neese, F.; Wennmohs, F.; Becker, U.; Riplinger, C. The ORCA quantum chemistry program package. J. Chem. Phys. 2020, 152, 224108. [Google Scholar] [CrossRef]
- Pracht, P.; Bohle, F.; Grimme, S. Automated exploration of the low-energy chemical space with fast quantum chemical methods. Phys. Chem. Chem. Phys. 2020, 22, 7169–7192. [Google Scholar] [CrossRef]
- Bannwarth, C.; Ehlert, S.; Grimme, S. GFN2-XTB—An accurate and broadly parametrized self-consistent tight-binding quantum chemical method with multipole electrostatics and density-dependent dispersion contributions. J. Chem. Theory Comput. 2019, 15, 1652–1671. [Google Scholar] [CrossRef]
- Brandenburg, J.G.; Bannwarth, C.; Hansen, A.; Grimme, S. B97-3c: A revised low-cost variant of the B97-D density functional method. J. Chem. Phys. 2018, 148, 064104. [Google Scholar] [CrossRef] [PubMed]
- Becke, A.D. Density-functional thermochemistry. V. Systematic optimization of exchange-correlation functionals. J. Chem. Phys. 1997, 107, 8554–8560. [Google Scholar] [CrossRef]
- Weigend, F.; Ahlrichs, R. Balanced basis sets of split valence, triple zeta valence and quadruple zeta valence quality for H to Rn: Design and assessment of accuracy. Phys. Chem. Chem. Phys. 2005, 7, 3297–3305. [Google Scholar] [CrossRef] [PubMed]
- Grimme, S.; Antony, J.; Ehrlich, S.; Krieg, H. A consistent and accurate ab initio parametrization of density functional dispersion correction (DFT-D) for the 94 elements H-Pu. J. Chem. Phys. 2010, 132, 154104. [Google Scholar] [CrossRef] [PubMed]
- Sure, R.; Grimme, S. Corrected small basis set Hartree-Fock method for large systems. J. Comput. Chem. 2013, 34, 1672–1685. [Google Scholar] [CrossRef]
- Cammi, R.; Mennucci, B.; Tomasi, J. Fast evaluation of geometries and properties of excited molecules in solution: A Tamm-Dancoff model with application to 4-dimethylaminobenzonitrile. J. Phys. Chem. A 2000, 104, 5631–5637. [Google Scholar] [CrossRef]
- Neese, F.; Schwabe, T.; Kossmann, S.; Schirmer, B.; Grimme, S. Assessment of orbital-optimized, spin-component scaled second-order many-body perturbation theory for thermochemistry and kinetics. J. Chem. Theory Comput. 2009, 5, 3060–3073. [Google Scholar] [CrossRef]
- Dost, T.L.; Gressel, M.T.; Henary, M. Synthesis and optical properties of pentamethine cyanine dyes with carboxylic acid moieties. Anal. Chem. Insights 2017, 12, 1–6. [Google Scholar] [CrossRef]
- Shi, Q.Q.; Sun, R.; Ge, F.J.; Xu, Q.F.; Li, N.J.; Lu, J.M. A comparative study of symmetrical and unsymmetrical trimethine cyanine dyes bearing benzoxazolyl and benzothiazolyl groups. Dyes Pigm. 2012, 93, 1506–1511. [Google Scholar] [CrossRef]
- Chapman, G.; Henary, M.; Patonay, G. The effect of varying short-chain alkyl substitution on the molar absorptivity and quantum yield of cyanine dyes. Anal. Chem. Insights 2011, 6, 29–36. [Google Scholar] [CrossRef]
- Shershov, V.E.; Spitsyn, M.A.; Kuznetsova, V.E.; Timofeev, E.N.; Ivashkina, O.A.; Abramov, I.S.; Nasedkina, T.V.; Zasedatelev, A.S.; Chudinov, A.V. Near-infrared heptamethine cyanine dyes. Synthesis, spectroscopic characterization, thermal properties and photostability. Dyes Pigm. 2013, 97, 353–360. [Google Scholar] [CrossRef]
- Owens, E.A.; Bruschi, N.; Tawney, J.G.; Henary, M. A microwave-assisted and environmentally benign approach to the synthesis of near-infrared fluorescent pentamethine cyanine dyes. Dyes Pigm. 2015, 113, 27–37. [Google Scholar] [CrossRef]
- Salon, J.; Wolinska, E.; Raszkiewicz, A.; Patonay, G.; Strekowski, L. Synthesis of benz[e]indolium heptamethine cyanines containing C-substituents at the central portion of the heptamethine moiety. J. Heterocycl. Chem. 2005, 42, 959–961. [Google Scholar] [CrossRef]
- Pascal, S.; Chi, S.H.; Perry, J.W.; Andraud, C.; Maury, O. Impact of ion-pairing effects on linear and nonlinear photophysical properties of polymethine dyes. ChemPhysChem 2020, 21, 2536–2542. [Google Scholar] [CrossRef]
- Strickler, S.J.; Berg, R.A. Relationship between absorption intensity and fluorescence lifetime of molecules. J. Chem. Phys. 1962, 37, 814–822. [Google Scholar] [CrossRef]
- Turro, N.J.; Scaiano, J.C.; Ramamurthy, V. Principles of Molecular Photochemistry: An Introduction, 1st ed.; University Science Book: Sausalito, CA, USA, 2008. [Google Scholar]
- Yao, Y.; Liang, Y.; Shrotriya, V.; Xiao, S.; Yu, L.; Yang, Y. Plastic near-infrared photodetectors utilizing low band gap polymer. Adv. Mater. 2007, 19, 3979–3983. [Google Scholar] [CrossRef]
- Qian, G.; Zhong, Z.; Luo, M.; Yu, D.; Zhang, Z.; Wang, Z.Y.; Ma, D. Simple and efficient near-infrared organic chromophores for light-emitting diodes with single electroluminescent emission above 1000 nm. Adv. Mater. 2009, 21, 111–116. [Google Scholar] [CrossRef]
- Shapiro, B.I. Molecular assemblies of polymethine dyes. Russ. Chem. Rev. 2006, 75, 433–456. [Google Scholar] [CrossRef]
- Lee, H.; Mason, J.C.; Achilefu, S. Synthesis and spectral properties of near-infrared aminophenyl-, hydroxyphenyl-, and phenyl-substituted heptamethinecyanines. J. Org. Chem. 2008, 3, 723–725. [Google Scholar] [CrossRef]
- Pydzińska, K.; Ziółek, M. Solar cells sensitized with near-infrared absorbing dye: Problems with sunlight conversion efficiency revealed in ultrafast laser spectroscopy studies. Dyes Pigm. 2015, 122, 272–279. [Google Scholar] [CrossRef]
- Arjona-Esteban, A.; Stolte, M.; Würthner, F. Conformational switching of π-conjugated junctions from merocyanine to cyanine states by solvent polarity. Angew. Chem. Int. Ed. 2016, 55, 2470–2473. [Google Scholar] [CrossRef]
- Egorov, V.V. Nature of the optical band shapes in polymethine dyes and H-aggregates: Dozy chaos and excitons. Comparison with dimers, H*- and J-aggregates. R. Soc. Open Sci. 2017, 4, 160550. [Google Scholar] [CrossRef]
- Bricks, J.L.; Slominskii, Y.L.; Panas, I.D.; Demchenko, A.P. Fluorescent J-aggregates of cyanine dyes: Basic research and applications review. Methods Appl. Fluoresc. 2018, 6, 012001. [Google Scholar] [CrossRef]
- Eisfeld, A.; Briggs, J. The shape of the J-band of pseudoisocyanine. Chem. Phys. Lett. 2007, 446, 354–358. [Google Scholar] [CrossRef]
- Würthner, F.; Kaiser, T.E.; Saha-Möller, C.R. J-aggregates: From serendipitous discovery to supramolecular engineering of functional dye materials. Angew. Chem. Int. Ed. 2011, 50, 3376–3410. [Google Scholar] [CrossRef]
- Rösch, U.; Yao, S.; Wortmann, R.; Würthner, F. Fluorescent H-aggregates of merocyanine dyes. Angew. Chem. Int. Ed. 2006, 45, 7026–7030. [Google Scholar] [CrossRef]
- El-Daly, S.A.; Asiri, A.M.; Alamry, K.A. Experimental determination of ground and excited state dipole moments of N,N-bis (2,5-di-tert-butylphenyl)-3,4:9,10-perylenebis (dicarboximide) (DBPI) a photostable laser dye. J. Fluoresc. 2014, 24, 1307–1311. [Google Scholar] [CrossRef]
- Lippert, E.; Lüder, W.; Moll, F.; Nägele, W.; Boos, H.; Prigge, H.; Seibold-Blankenstein, I. Umwandlung von elektronenanregungsenergie. Angew. Chem. 1961, 73, 695–706. [Google Scholar] [CrossRef]
- Dahiya, P.; Choudhury, S.D.; Maity, D.K.; Mukherjee, T.; Pal, H. Solvent polarity induced structural changes in 2,6-diamino-9,10-anthraquinone dye. Spectrochim. Acta A 2008, 69, 134–141. [Google Scholar] [CrossRef]
- Lakowicz, J.R. Principles of Fluorescence Spectroscopy, 3rd ed.; Springer: New York, NY, USA, 2006. [Google Scholar]
- Gündüz, M.G.; da Silva, C.B.; Zanotto, G.M.; Toldo, J.M.; Şimşek, R.; Şafak, C.; Gonçalves, P.F.B.; Rodembusch, F.S. Theoretical and experimental study of the ground and excited states of 1,4-dihydropyridine based hexahydroquinoline derivatives achieved by microwave irradiation. New J. Chem. 2017, 41, 11686–11694. [Google Scholar] [CrossRef]
- Breneman, C.M.; Wiberg, K.B. Determining atom-centered monopoles from molecular electrostatic potentials. The need for high sampling density in formamide conformational analysis. J. Comput. Chem. 1990, 11, 361–373. [Google Scholar] [CrossRef]
- Stowasser, R.; Hoffmann, R. What do the Kohn-Sham orbitals and eigenvalues mean? J. Am. Chem. Soc. 1999, 121, 3414–3420. [Google Scholar] [CrossRef]
- Tsuneda, T.; Song, J.W.; Suzuki, S.; Hirao, K. On Koopmans’ theorem in density functional theory. J. Chem. Phys. 2010, 133, 174101. [Google Scholar] [CrossRef]
- Harrison, J.F. On the role of the electron density difference in the interpretation of molecular properties. J. Chem. Phys. 2003, 119, 8763–8764. [Google Scholar] [CrossRef]
- Pipek, J.; Mezey, P.G. A fast intrinsic localization procedure applicable for ab initio and semiempirical linear combination of atomic orbital wave functions. J. Chem. Phys. 1989, 90, 4916–4926. [Google Scholar] [CrossRef]
- HØyvik, I.M.; Jansik, B.; JØrgensen, P. Pipek-Mezey localization of occupied and virtual orbitals. J. Comput. Chem. 2013, 34, 1456–1462. [Google Scholar] [CrossRef]
- Shi, C.; Wu, J.B.; Pan, D. Review on near-infrared heptamethine cyanine dyes as theranostic agents for tumor imaging, targeting, and photodynamic therapy. J. Biomed. Opt. 2016, 21, 050901. [Google Scholar] [CrossRef]
- Usama, S.M.; Thavornpradit, S.; Burgess, K. Optimized heptamethinecyanines for photodynamic therapy. ACS Appl. BioMater. 2018, 1, 1195–1205. [Google Scholar] [CrossRef]
- Lee, H.; Mason, J.C.; Achilefu, S. Heptamethine cyanine dyes with a robust C-C bond at the central position of the chromophore. J. Org. Chem. 2006, 71, 7862–7865. [Google Scholar] [CrossRef]
- Samanta, A.; Vendrell, M.; Das, R.; Chang, Y.T. Development of photostable near-infrared cyanine dyes. Chem. Commun. 2010, 46, 7406–7408. [Google Scholar] [CrossRef]
Disclaimer/Publisher’s Note: The statements, opinions and data contained in all publications are solely those of the individual author(s) and contributor(s) and not of MDPI and/or the editor(s). MDPI and/or the editor(s) disclaim responsibility for any injury to people or property resulting from any ideas, methods, instructions or products referred to in the content. |
© 2023 by the authors. Licensee MDPI, Basel, Switzerland. This article is an open access article distributed under the terms and conditions of the Creative Commons Attribution (CC BY) license (https://creativecommons.org/licenses/by/4.0/).