Communication

Interference Free HPLC-SERS for the Trace Analysis of Residual Furazolidones in the Aquaculture Sediment

1
Fuzhou Preschool Education College, Fuzhou 344099, China
2
Faculty of Geosciences and Environmental Engineering, Southwest Jiaotong University, Chengdu 611756, China
*
Author to whom correspondence should be addressed.
Chemosensors 2022, 10(12), 508; https://doi.org/10.3390/chemosensors10120508
Submission received: 9 November 2022 / Revised: 27 November 2022 / Accepted: 28 November 2022 / Published: 30 November 2022
(This article belongs to the Special Issue Nanoparticles in Chemical and Biological Sensing)

Abstract

:
Furazolidone (FZD), a typical highly effective nitrofuran antibiotic, has been banned in aquaculture for its carcinogenicity and other adverse health effects, but it is still wildly used for its low cost and significant efficacy. Since FZD will be rapidly metabolized in living organisms, the traditional standard mass spectrometry method can quantitatively analyze trace amount of FZD by detecting its derivative. However, a rapid qualitative analysis method is more consistent with market demand in regular monitoring. In this study, high performance liquid chromatography (HPLC) was used to separate and purify FZD from the sea cucumber culture sediment, and the purified effluent was combined with a substrate of gold nanoparticles (Au NPs) for surface enhanced Raman spectroscopy (SERS) detection. The absolute detection limit of FZD by SERS is 1 ng, and the detection limit of FZD in actual sediment samples is less than 1 μg/kg. The cost and period of FZD analysis by HPLC-SERS are greatly reduced for the omission of derivatization compared with the traditional mass spectrometry method, which can better meet the requirements of practical applications.

1. Introduction

Furazolidone (FZD) is a class of broad-spectrum antibiotics which were widely used in livestock and aquaculture to treat enteritis, scabies and ulcer disease caused by Escherichia coli, Salmonella and Coccidia [1,2]. Due to the carcinogenic, teratogenic and mutagenic side effects of FZD and its metabolites, many countries such as the European Union, the United States and Japan have explicitly banned its application in aquaculture [3,4]. The agriculture ministry of China also prohibited the use of FZD in food animal farming in 2002 [5]. However, the illegal usage of FZD in aquaculture is still been repeatedly discovered for its low price and significant efficacy [6].
FZD has a very short half-life and is rapidly metabolized in the organisms so no parent drug can be detected in edible tissues over 12 h after administration [7,8]. Therefore, the traditional standard method for the quantitative detection of FZD is based on its derivatization analysis by liquid chromatography-mass spectrometry (LC-MS), and the detection limit can reach 0.5 μg/kg [9,10]. However, the derivatization process is time-consuming, and the LC-MS analysis is expensive. Most importantly, for chemicals that are not permitted in food such as FZD, detection (yes/no) is far more important than concentration. In other words, qualitative or semi-quantitative detection is appropriate if achieved in a timely manner [11].
In practical application, the aquaculture substrate is a good information carrier which can load historical culture information [12,13,14]. FZD can exist stably in parent form in sediment, so the qualitive monitoring of the FZD in aquaculture environment can efficiently supervise the overuse of FZD. With the start point of zero tolerance for drug abuse, the development of a simple, rapid and low-cost analytical technique of FZD in aquaculture sediment was urgently in need.
Surface enhanced Raman scattering (SERS) is a phenomenon in which the Raman signal of the substances is significantly enhanced on the surface of noble metal nanomaterials [15,16,17]. SERS has proven to be a very valuable technique for molecular vibrational spectroscopy, not only in terms of speed (in the range of seconds to minutes), but also in terms of sensitivity (up to single molecule level) [18,19,20,21,22]. However, the activity of noble metal nanomaterials is easily interfered with by proteins, organic matter and other substances, so SERS is difficult to directly apply to biomass samples [23]. In addition, the high-performance liquid chromatography (HPLC) has attracted considerable attention due to its efficient separation performance for mixtures with different polarities [24,25,26]. Commercial HPLC detectors such as the ultraviolet visible detector (UVD) provided the absorption spectra and the corresponding retention time of each component. Unfortunately, some components are silent in UV spectroscopy, and the poor structural information from UV spectra brought critical difficulties in the identification of unknown components [27].
In this study, the complex sea cucumber culture sediment was separated and purified by HPLC, and the effluents were loaded onto gold nanoparticle (Au NPs) substrates for SERS measurements. The continuous rapid analysis of FZD was achieved with the separation efficiency and detection sensitivity of each technology. The results demonstrated that the HPLC-SERS hyphenated system exhibited the complementary capability of the significant separation and structural identification of illegal additives in real samples. The detection limit of FZD in actual sediment samples is less than 1 μg/kg, and the efficiency and accuracy regarding the separation and identification of complex samples were higher than those of the individual HPLC or SERS technology. It is believed that the HPLC-SERS hyphenated system would be developed as a promising technique for the separation and identification of complex multi-component mixtures.

2. Materials and Methods

2.1. Chemicals and Materials

Hydrogen tetrachloroaurate (HAuCl4), trisodium citrate dihydrate, methanol, acetonitrile, dichloromethane, ethyl acetate and ortho-phosphoric acid were purchased from Titan Scientific Co., Ltd. (Shanghai, China). The samples of sea cucumber culture sediment were provided by Beijing Tong Ren Tang Health (Dalian, China) Seafoods Co., Ltd. The pure water was prepared by Nanopure (Thermo, Waltham, MA, USA).

2.2. Instruments

The Elite EClassical 3100 HPLC (Dalian, China) was performed on a SinoChrom ODS-BP-C18 column (200 mm × 4.6 mm × 5 μm) with a column temperature of 35 °C and a UV detection wavelength of 365 nm. The HLB SPE column of 60 mg/3 mL was used for the initial preparation of the extracts. A Raman spectrometer (Pixis-100BR CCD, Acton SP-2500i spectrograph) was used for the final SERS characterization with an excitation wavelength of 633 nm and a laser power of 20 mW.

2.3. Au NPs Preparation

Au NPs were prepared by the trisodium citrate reduction method, which was first proposed by Frens.G [28], and the specific preparation process is as follows: 100 mL, 0.1% chloroauric acid solution was heated to boiling, then quickly added 1 mL, 15% trisodium citrate. After the solution turned red, the solution was kept heating for 15 min with continuous magnetic stirring. Finally, a transparent burgundy Au NPs colloid solution was obtained.

2.4. Standard Solution Preparation

The stock solution of FZD with a concentration of 100 μg/mL was obtained by dissolving 0.01 g FZD into 100 mL acetonitrile/water (4/6) mixture. Then, standard solutions (0.02–1 μg/mL) were prepared by diluting the stock solution with acetonitrile/water (4/6) mixture.

2.5. Extraction Method for FZD in Sediment

The sea cucumber culture sediment was dried, ground and sieved, and then kept in brown bottles for use. Samples of 20 g were separately put into 4 centrifuge tubes, and 10 mL extraction solution was added into each tube. FZD was extracted from the above mixture by vigorous vortexing for 5 min and centrifuging at 4000 r/min for 10 min. The extract process was then repeated twice, and the 120 mL extract was concentrated by rotary evaporation. The dried residue was sufficiently dissolved with 2 mL of acetonitrile, and then concentrated to 200 μL with nitrogen blowing at 40 °C water bath. The extracts were diluted to 5 mL by 0.1% phosphoric acid and filtered by a 0.45 μm filter membrane. Then, the above 5 mL of extraction solution was purified by the active HLB solid phase extraction column. Finally, the column was rinsed by 1 mL ultrapure water with vacuum filtration for 20 min and eluted with 2.5 mL methanol. The collected eluate was concentrated to 200 μL for measurement.

3. Results

3.1. Optimization of Extraction Conditions

The effective extraction of FZD from sea cucumber culture sediment is the most important foundation in this study, so the extraction conditions were optimized first. In most cases, the solvents, such as acetonitrile [29], ethyl acetate [30], methanol [31], dichloromethane [32] and acetonitrile/methanol mixture [33] were used as the FZD extractant. In order to explore the best extractant for the sediment matrix, four kinds of extractants were selected for comparison, including acetonitrile, dichloromethane, ethyl acetate and acetonitrile/methanol (1/1) mixture. The sediment samples were spiked with FZD at the concentration of 100 μg/kg, then it was extracted and detected according to the steps in Section 2.5.
The recovery rate with different extractants is shown in Figure 1a. It can be seen from the results that the extraction rate with dichloromethane is the lowest, ranging from 28.4% to 32.8%. The ethyl acetate is easiest solvent with which to extract diethyl lipids, which are the metabolites of FZD. Therefore, the extraction rate increased to 70% when acetonitrile and ethyl acetate were used. The highest extraction rate is about 80% to 90% while the acetonitrile/methanol (1/1) was used.
The HLB solid phase extraction column was used for the preliminary purification of the extract. It has been reported that the impurities were dissolved less when the N, N-dimethylformamide was introduced in eluents. Therefore, the elution efficiencies of different eluents were compared in this work, including methanol, acetonitrile and gradient concentrations of N, N-dimethylformamide with methanol. It was found that the introduction of N, N-dimethylformamide resulted in an increase in the consistency of the eluent and a slow speed of elution process. Conversely, the pure methanol showed the best elution performance. In order to achieve the best elution effect, the different volumes of methanol were implemented. The elution curve of the HLB column with methanol was shown in Figure 1b. It can be seen that the methanol can realize 94% recovery rate when the eluent volume increases to 2.5 mL, showing a good elution ability for FZD.
Therefore, the optimized extraction conditions, including the acetonitrile/methanol (1/1) extractant and 2.5 mL methanol eluent, were employed in the following experiments.

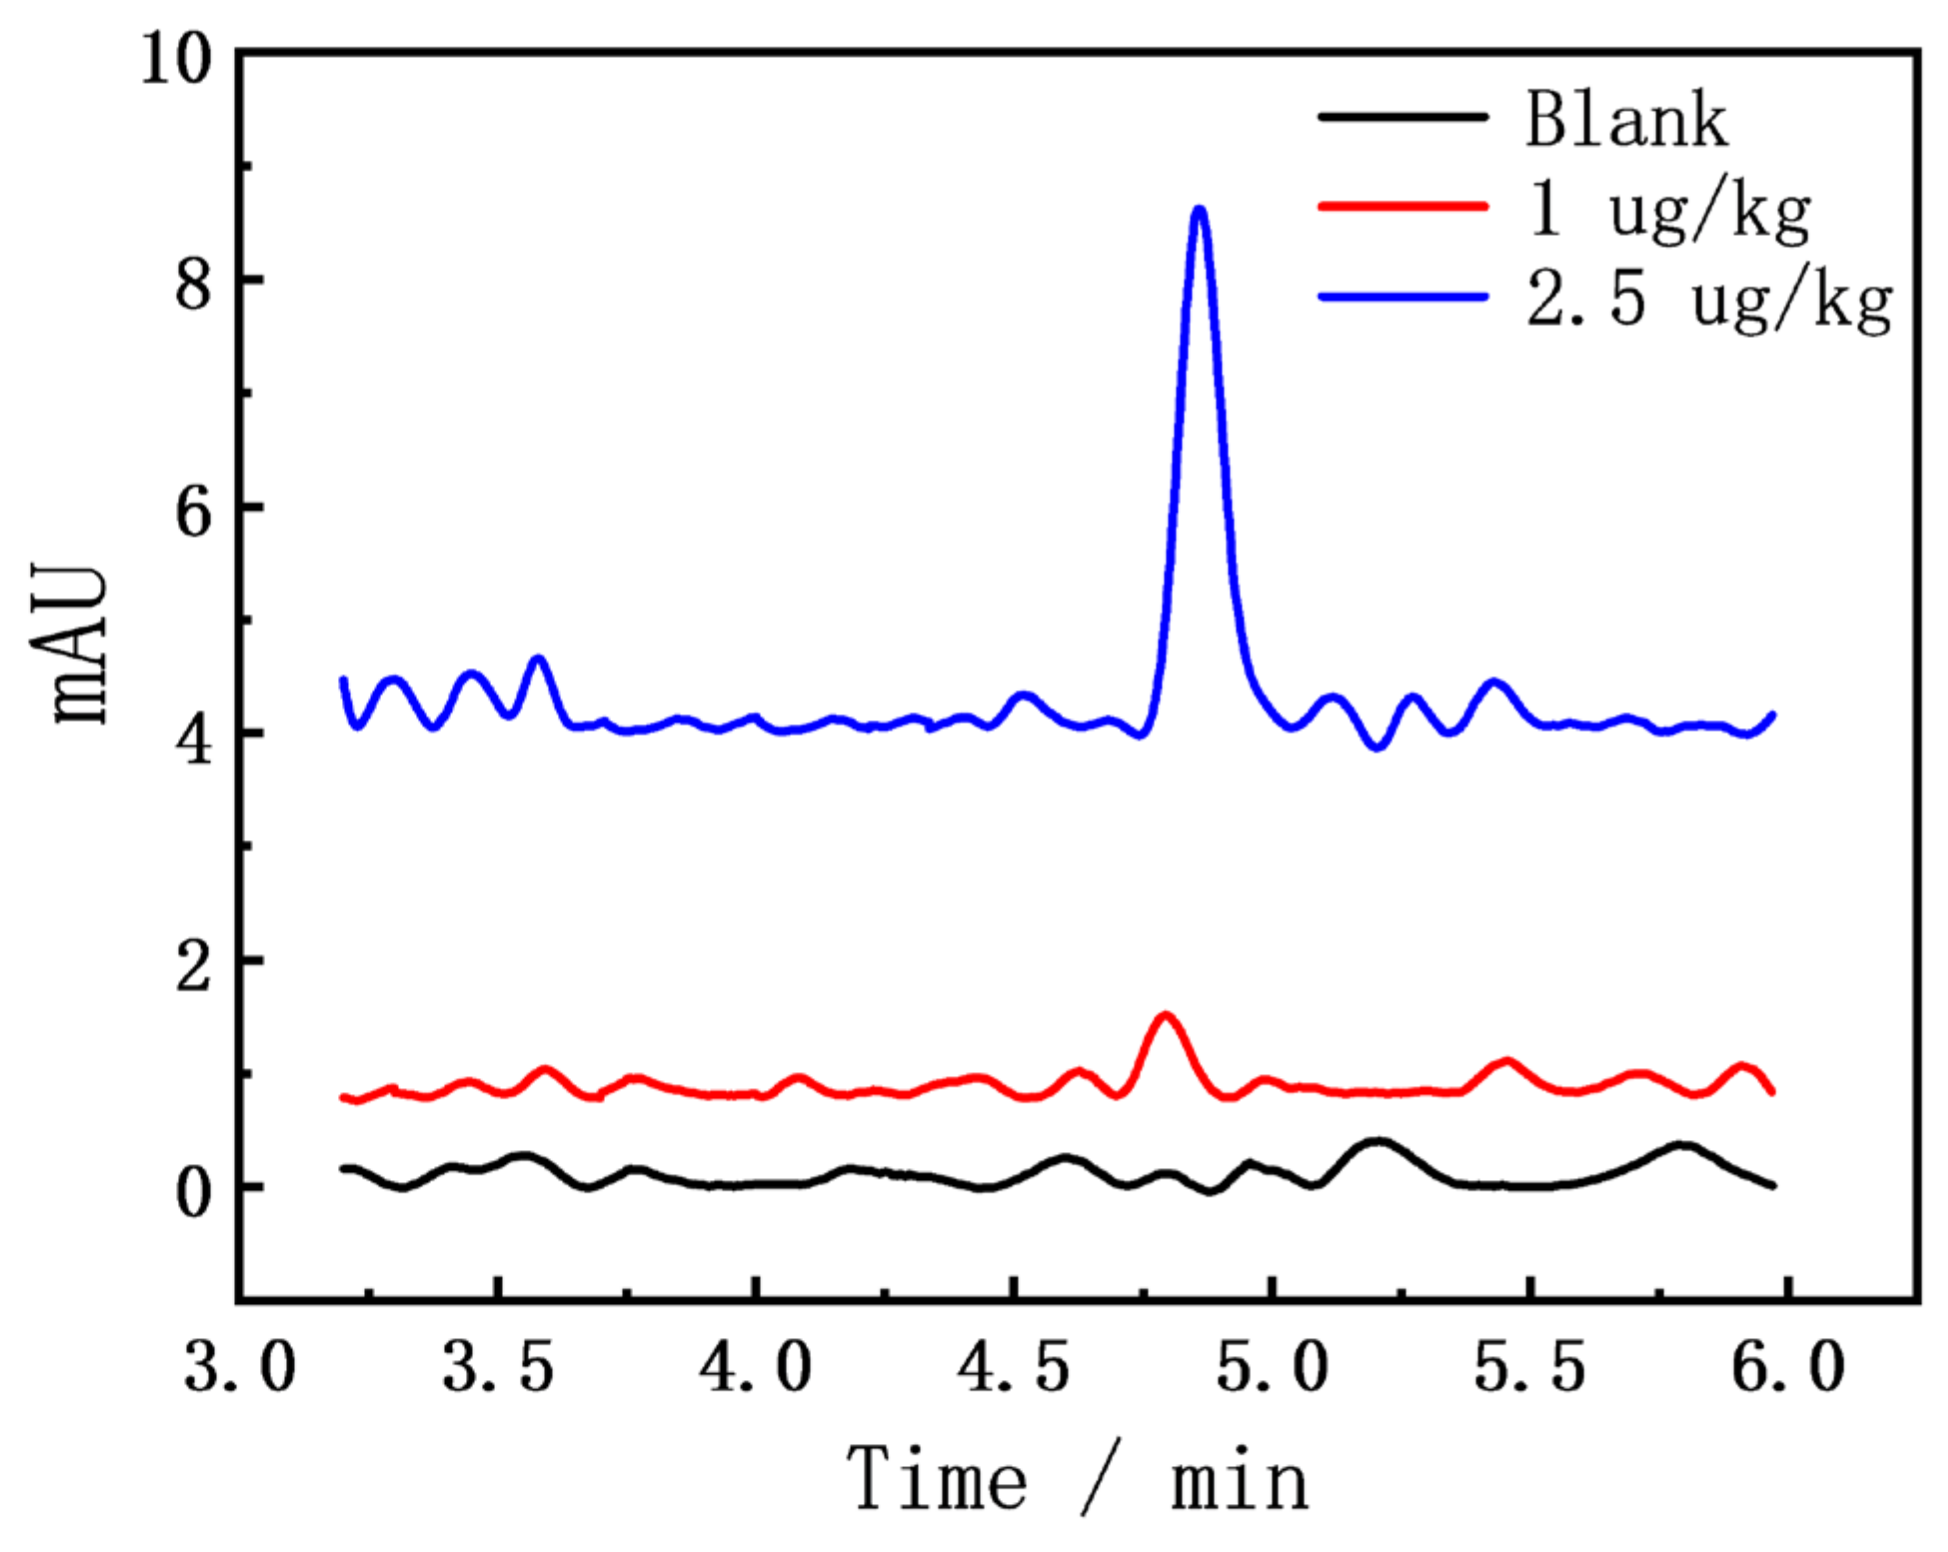
3.2. HPLC Analysis and Purification
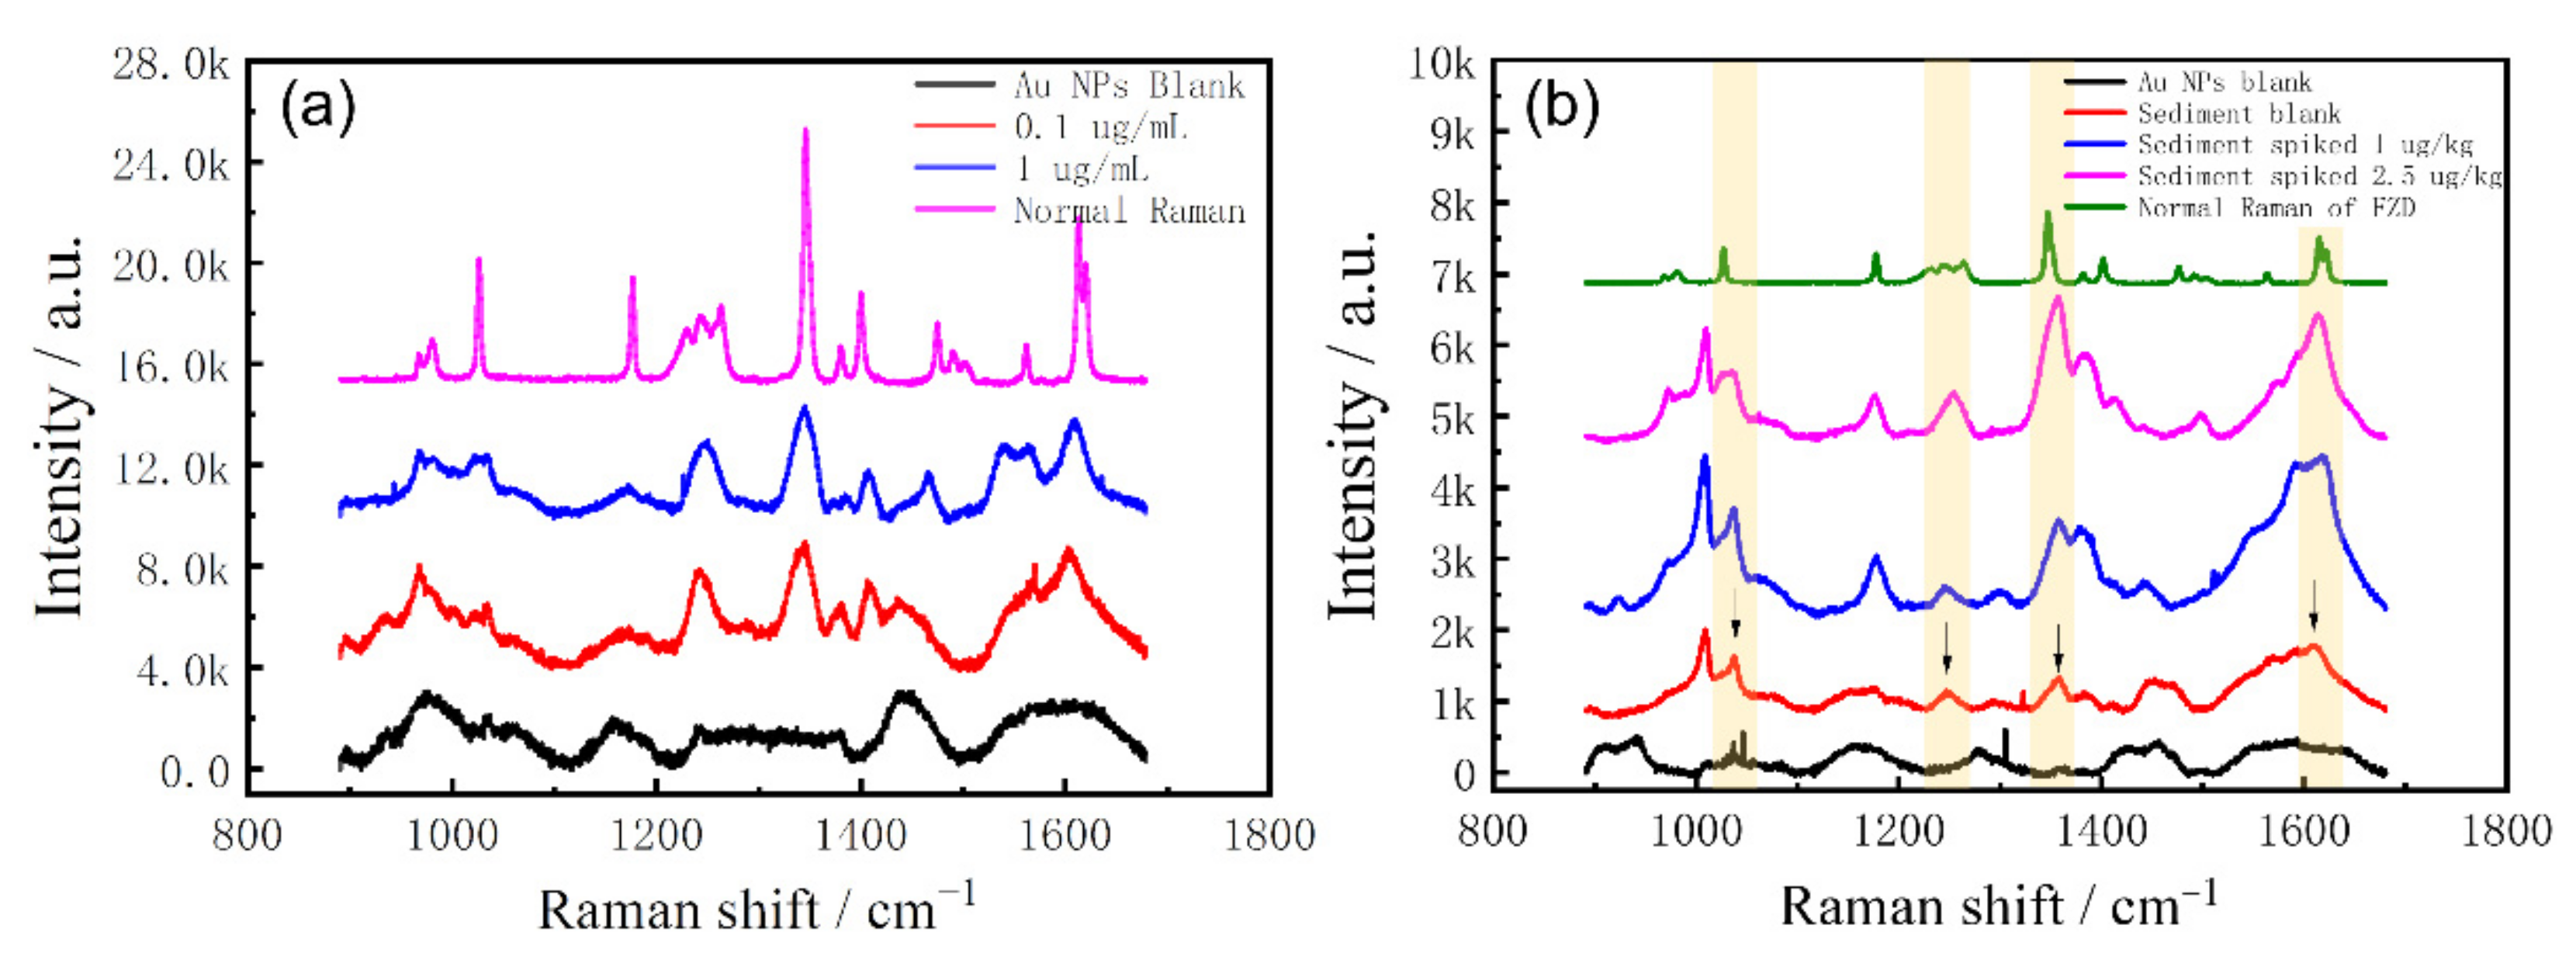
Since the chemical structural formula of FZD has the basic structure of 5-nitrofuran, an acidic solution is used as the mobile phase to improve its peak shape in HPLC analysis. In this study, the mixture of 0.1% phosphoric acid and acetonitrile was used as the mobile phase, and the mixing ratios were optimized. The mobile phase A is constituted by acetonitrile/0.1% phosphoric acid (4/6), and mobile phase B is the mixture of acetonitrile/0.1% phosphoric acid (6/4). The injection volume of 0.5 μg/mL FZD was 10 μL, and the flow rate was 1 mL/min. The detection results are shown in Figure 2a.
It can be seen that the increasing proportion of acetonitrile will advance the peak position of FZD, which easily leads to the inability to separate the target peak from other impurity peaks. Therefore, the mobile phase A was used in subsequent experiments. The FZD calibration curve was acquired with the above chromatographic conditions to explore the response performance of HPLC to FZD, which was shown in Figure 2b. The linear range is 0.02 to 1 μg/mL and the R2 is 0.9993. From the calibration curve, it can be seen that there is a poor linear relationship at low concentrations and the lowest response concentration of FZD by HPLC instrument was 0.01 μg/mL.
We explored the blank and spiked sediment samples, and the results are shown in Figure 3. Even at the level of FZD spiked at 1 μg/kg, the absorption peak was still clearly visible at about 4.8 min. In addition, the blank sample also has a certain signal response at the peak position of FZD. However, due to the influence of other substances in the sediment matrix, the chromatogram baseline is terrible, and it is difficult to determine whether the blank sediment sample contained the FZD. Therefore, the effluent from 4.7 to 4.9 min was collected and concentrated by nitrogen blowing for further SERS analysis.

3.3. SERS Detection

Au NPs colloid solutions were prepared as SERS substrates by the method in Section 2.3. Figure 4a shows the UV-Vis absorption spectra of three batches of Au NPs prepared repeatedly. It can be seen that Au NPs have an absorption peak at around 520 nm, and the high reproduction of the absorption spectra indicates that the Au NPs prepared by this method are very stable. In addition, the transmission electron microscopy (TEM) characterization of the Au NPs was carried out (Figure 4b), which shows that the Au NPs give rise to the spherical shape and uniform size.
In order to verify the SERS performance of the Au NPs substrate, 20 μL of the prepared Au NPs were dropped on the aluminum foil, and then 10 μL of the standard FZD solution was dropped on the Au NPs. After the analyte was dried at room temperature, SERS detection was implemented. Each substrate was collected 10 spectra, and three parallel experiments were performed to obtain the final averaged spectrum. The results are shown in Figure 5a. It can be seen that the SERS characteristic signal of FZD can still be obtained with the absolute amount of 1 ng, including the clearly visible characteristic peaks at 1350 cm−1, 1400 cm−1 and 1610 cm−1, which show a better performance than the reported enzyme-linked immunosorbent assay method (detection limit, 2 μg/kg) [34] and the similar SERS methods [35,36].
The spiked sediment extracts were tried to directly combine with Au NPs for SERS detection, but the SERS features of FZD could not be detected at all. It should be caused by the masking effect from the complex composition in sediment matrices, so that the extract cannot be used for SERS detection directly.
The HPLC effluent collected from the spiked sediments in Section 3.2 was concentrated, and then combined with Au NPs for SERS analysis. The detection process was the same as the above, and the results are shown in Figure 5b. It can be seen that HPLC realizes the effective separation and purification of the extract, so that the signal of FZD can be detected in the collected effluent. Compared with the normal Raman spectrum of FZD, we found that the characteristic peak of FZD was still obvious with 1μg/kg spiked, and it was even visible in the blank sediment sample. The blank sediment sample could not be accurately identified as containing FZD by HPLC analysis. However, the contamination of FZD in the blank sediment was confirmed by SERS detection, which further verified the practical application potential of the developed HPLC-SERS analysis method.

4. Conclusions

In this study, HPLC was used to separate and purify the crude FZD extract from the sea cucumber aquaculture sediment, and then the effluent was concentrated and analyzed by SERS to realize the rapid qualitative detection of FZD. The absolute detection limit of FZD by SERS was 1 ng, and the detection limit of FZD in actual sediment samples was lower than 1 μg/kg. Moreover, the doubtful contamination of FZD in the blank sediment in HPLC analysis was confirmed by SERS detection, which further verified the practical application potential of the developed HPLC-SERS analysis method.

Author Contributions

Conceptualization, B.Z. and Y.H.; investigation, B.Z. and Y.H.; methodology, B.Z. and Y.H.; data curation, B.Z. and Y.H.; writing—original draft preparation, B.Z. and Y.H.; writing—review and editing, M.F.; visualization, B.Z.; supervision, M.F.; funding acquisition, M.F. All authors have read and agreed to the published version of the manuscript.

Funding

This research was funded by the Science and Technology Research Project of Jiangxi Provincial Department of Education, grant number GJJ203801.

Institutional Review Board Statement

Not applicable.

Informed Consent Statement

Not applicable.

Data Availability Statement

Not applicable.

Acknowledgments

The authors also thank the Analytical and Testing Center of Southwest Jiaotong University for the instrument supports.

Conflicts of Interest

The authors declare no conflict of interest.

References

  1. Du, N.-N.; Chen, M.-M.; Sheng, L.-Q.; Chen, S.-S.; Xu, H.-J.; Liu, Z.-D.; Song, C.-F.; Qiao, R. Determination of nitrofuran metabolites in shrimp by high performance liquid chromatography with fluorescence detection and liquid chromatography–tandem mass spectrometry using a new derivatization reagent. J. Chromatogr. A 2014, 1327, 90–96. [Google Scholar] [CrossRef] [PubMed]
  2. Leitner, A.; Zöllner, P.; Lindner, W. Determination of the metabolites of nitrofuran antibiotics in animal tissue by high-performance liquid chromatography–tandem mass spectrometry. J. Chromatogr. A 2001, 939, 49–58. [Google Scholar] [CrossRef] [PubMed]
  3. Vass, M.; Hruska, K.; Franek, M. Nitrofuran antibiotics: A review on the application, prohibition and residual analysis. Vet. Med. 2008, 53, 469. [Google Scholar] [CrossRef] [Green Version]
  4. Song, J.; Yang, H.; Wang, Y.; Si, W.; Deng, A. Direct detection of 3-amino-5-methylmorpholino-2-oxazolidinone (AMOZ) in food samples without derivatisation step by a sensitive and specific monoclonal antibody based ELISA. Food Chem. 2012, 135, 1330–1336. [Google Scholar] [CrossRef] [PubMed]
  5. Zhao, H.; Guo, W.; Quan, W.; Jiang, J.; Qu, B. Occurrence and levels of nitrofuran metabolites in sea cucumber from Dalian, China. Food Addit. Contam. Part A 2016, 33, 1672–1677. [Google Scholar] [CrossRef]
  6. Fan, W.; Yang, S.; Gao, W.; Wang, D.; Fan, M. Highly sensitive bromide aided SERS detection of furazolidone and 3-amino-2-oxazolidinone residual in aquaculture products. Microchem. J. 2021, 169, 106532. [Google Scholar] [CrossRef]
  7. Xie, Y.; Zhang, L.; Le, T. An immunochromatography test strip for rapid, quantitative and sensitive detection of furazolidone metabolite, 3-amino-2-oxazolidinone, in animal tissues. Food Agric. Immunol. 2017, 28, 403–413. [Google Scholar] [CrossRef] [Green Version]
  8. Jin, X.; Tang, S.; Chen, Q.; Zou, J.; Zhang, T.; Liu, F.; Zhang, S.; Sun, C.; Xiao, X. Furazolidone induced oxidative DNA damage via up-regulating ROS that caused cell cycle arrest in human hepatoma G2 cells. Toxicol. Lett. 2011, 201, 205–212. [Google Scholar] [CrossRef]
  9. Wang, J.; Zhang, L. Simultaneous determination and identification of furazolidone, furaltadone, nitrofurazone, and nitrovin in feeds by HPLC and LC-MS. J. Liq. Chromatogr. Relat. Technol. 2006, 29, 377–390. [Google Scholar] [CrossRef]
  10. Cooper, K.; Mulder, P.J.; Van Rhijn, J.; Kovacsics, L.; McCracken, R.; Young, P.; Kennedy, D. Depletion of four nitrofuran antibiotics and their tissue-bound metabolites in porcine tissues and determination using LC-MS/MS and HPLC-UV. Food Addit. Contam. 2005, 22, 406–414. [Google Scholar] [CrossRef]
  11. Huang, Y.; Wang, D.; Liu, W.; Zheng, L.; Wang, Y.; Liu, X.; Fan, M.; Gong, Z. Rapid screening of rhodamine B in food by hydrogel solid-phase extraction coupled with direct fluorescence detection. Food Chem. 2020, 316, 126378. [Google Scholar] [CrossRef] [PubMed]
  12. Samuelsen, O.B.; Solheim, E.; Lunestad, B.T. Fate and microbiological effects of furazolidone in a marine aquaculture sediment. Sci. Total Environ. 1991, 108, 275–283. [Google Scholar] [CrossRef] [PubMed]
  13. Capone, D.G.; Weston, D.P.; Miller, V.; Shoemaker, C. Antibacterial residues in marine sediments and invertebrates following chemotherapy in aquaculture. Aquaculture 1996, 145, 55–75. [Google Scholar] [CrossRef]
  14. Kalantzi, I.; Rico, A.; Mylona, K.; Pergantis, S.A.; Tsapakis, M. Fish farming, metals and antibiotics in the eastern Mediterranean Sea: Is there a threat to sediment wildlife? Sci. Total Environ. 2021, 764, 142843. [Google Scholar] [CrossRef] [PubMed]
  15. Fleischmann, M.; Hendra, P.J.; McQuillan, A.J. Raman spectra of pyridine adsorbed at a silver electrode. Chem. Phys. Lett. 1974, 26, 163–166. [Google Scholar] [CrossRef]
  16. Cao, Y.; Zhang, J.; Yang, Y.; Huang, Z.; Long, N.V.; Fu, C. Engineering of SERS substrates based on noble metal nanomaterials for chemical and biomedical applications. Appl. Spectrosc. Rev. 2015, 50, 499–525. [Google Scholar] [CrossRef]
  17. Langer, J.; Jimenez de Aberasturi, D.; Aizpurua, J.; Alvarez-Puebla, R.A.; Auguié, B.; Baumberg, J.J.; Bazan, G.C.; Bell, S.E.J.; Boisen, A.; Brolo, A.G.; et al. Present and Future of Surface-Enhanced Raman Scattering. ACS Nano 2019, 14, 28–117. [Google Scholar] [CrossRef] [Green Version]
  18. Kneipp, K.; Wang, Y.; Kneipp, H.; Perelman, L.T.; Itzkan, I.; Dasari, R.R.; Feld, M.S. Single molecule detection using surface-enhanced Raman scattering (SERS). Phys. Rev. Lett. 1997, 78, 1667. [Google Scholar] [CrossRef] [Green Version]
  19. Wang, D.; Hui, B.; Zhang, X.; Zhu, J.; Gong, Z.; Fan, M. Facile Preparation of Ag-NP-Deposited HRGB-SERS Substrate for Detection of Polycyclic Aromatic Hydrocarbons in Water. Chemosensors 2022, 10, 406. [Google Scholar] [CrossRef]
  20. Huang, Y.; Liu, W.; Gong, Z.; Wu, W.; Fan, M.; Wang, D.; Brolo, A.G. Detection of buried explosives using a surface-enhanced Raman scattering (SERS) substrate tailored for miniaturized spectrometers. ACS Sens. 2020, 5, 2933–2939. [Google Scholar] [CrossRef]
  21. Fan, M.; Andrade, G.F.S.; Brolo, A.G. A review on recent advances in the applications of surface-enhanced Raman scattering in analytical chemistry. Anal. Chim. Acta 2019, 1097, 1–29. [Google Scholar] [CrossRef] [PubMed]
  22. Fan, M.; Andrade, G.F.; Brolo, A.G. A review on the fabrication of substrates for surface enhanced Raman spectroscopy and their applications in analytical chemistry. Anal. Chim. Acta 2011, 693, 7–25. [Google Scholar] [CrossRef] [PubMed]
  23. Yue, S.; Sun, X.-T.; Wang, Y.; Zhang, W.-S.; Xu, Z.-R. Microparticles with size/charge selectivity and pH response for SERS monitoring of 6-thioguanine in blood serum. Sens. Actuators B Chem. 2018, 273, 1539–1547. [Google Scholar] [CrossRef]
  24. Arabi, M.; Ostovan, A.; Bagheri, A.R.; Guo, X.; Li, J.; Ma, J.; Chen, L. Hydrophilic molecularly imprinted nanospheres for the extraction of rhodamine B followed by HPLC analysis: A green approach and hazardous waste elimination. Talanta 2020, 215, 120933. [Google Scholar] [CrossRef]
  25. Jiang, H.; Yang, K.; Zhao, X.; Zhang, W.; Liu, Y.; Jiang, J.; Cui, Y. Highly stable Zr (IV)-based metal–organic frameworks for chiral separation in reversed-phase liquid chromatography. J. Am. Chem. Soc. 2020, 143, 390–398. [Google Scholar] [CrossRef]
  26. Hu, K.; Shi, Y.; Zhu, W.; Cai, J.; Zhao, W.; Zeng, H.; Zhang, Z.; Zhang, S. Facile synthesis of magnetic sulfonated covalent organic framework composites for simultaneous dispersive solid-phase extraction and determination of β-agonists and fluoroquinolones in food samples. Food Chem. 2021, 339, 128079. [Google Scholar] [CrossRef]
  27. Fuh, M.-R.S.; Chan, S.-A.; Wang, H.-L.; Lin, C.-Y. Determination of antibacterial reagents by liquid chromatography-electrospray-mass spectrometry. Talanta 2000, 52, 141–151. [Google Scholar] [CrossRef]
  28. Frens, G. Particle size and sol stability in metal colloids. Kolloid-Zeitschrift und Zeitschrift für Polymere 1972, 250, 736–741. [Google Scholar] [CrossRef]
  29. Vinas, P.; Campillo, N.; Carrasco, L.; Hernández-Córdoba, M. Analysis of nitrofuran residues in animal feed using liquid chromatography and photodiode-array detection. Chromatographia 2007, 65, 85–89. [Google Scholar] [CrossRef]
  30. Barbosa, J.; Moura, S.; Barbosa, R.; Ramos, F.; da Silveira, M.I.N. Determination of nitrofurans in animal feeds by liquid chromatography-UV photodiode array detection and liquid chromatography-ionspray tandem mass spectrometry. Anal. Chim. Acta 2007, 586, 359–365. [Google Scholar] [CrossRef]
  31. JohnáBlanchflower, W.; GlennáKennedy, D. Determination of furazolidone in porcine tissue using thermospray liquid chromatography–mass spectrometry and a study of the pharmacokinetics and stability of its residues. Analyst 1995, 120, 2347–2351. [Google Scholar]
  32. Kao, Y.-M.; Chang, M.-H.; Cheng, C.-C.; Chou, S.-S. Multiresidue determination of veterinary drugs in chicken and swine muscles by high performance liquid chromatography. J. Food Drug Anal. 2001, 9, 84–95. [Google Scholar] [CrossRef]
  33. McCracken, R.J.; Kennedy, D.G. Determination of furazolidone in animal feeds using liquid chromatography with UV and thermospray mass spectrometric detection. J. Chromatogr. A 1997, 771, 349–354. [Google Scholar] [CrossRef]
  34. Li, J.; Liu, J.X.; Wang, J.P. Multidetermination of Four Nitrofurans in Animal Feeds by a Sensitive and Simple Enzyme-Linked Immunosorbent Assay. J. Agric. Food Chem. 2009, 57, 2181–2185. [Google Scholar] [CrossRef] [PubMed]
  35. Huang, J.-A.; Zhang, Y.-L.; Zhao, Y.; Zhang, X.-L.; Sun, M.-L.; Zhang, W. Superhydrophobic SERS chip based on a Ag coated natural taro-leaf. Nanoscale 2016, 8, 11487–11493. [Google Scholar] [CrossRef]
  36. Sun, H.; Li, X.; Hu, Z.; Gu, C.; Chen, D.; Wang, J.; Li, B.; Jiang, T.; Zhou, X. Hydrophilic-hydrophobic silver nanowire-paper based SERS substrate for in-situ detection of furazolidone under various environments. Appl. Surf. Sci. 2021, 556, 149748. [Google Scholar] [CrossRef]
Figure 1. (a) The recovery of FZD with different extractants, including acetonitrile (A), dichloromethane (B), ethyl acetate (C), and acetonitrile/methanol (1/1) mixture (D); (b) the elution curve with the methanol.
Chemosensors 10 00508 g001
Figure 2. (a) Chromatograms of FZD standard solution with different mobile phases; (b) the FZD calibration curve. A local enlargement of the curve is shown in the inset.
Chemosensors 10 00508 g002
Figure 3. HPLC chromatogram of the FZD in sediments.
Chemosensors 10 00508 g003
Figure 4. (a) UV-Vis absorption spectra of the Au NPs colloid solution; (b) TEM image of Au NPs.
Chemosensors 10 00508 g004
Figure 5. (a) SERS and Raman spectra of FZD; (b) SERS spectra of HPLC effluent from the sediments.
Chemosensors 10 00508 g005
Publisher’s Note: MDPI stays neutral with regard to jurisdictional claims in published maps and institutional affiliations.

