Abstract
In multi/many-objective evolutionary algorithms (MOEAs), to alleviate the degraded convergence pressure of Pareto dominance with the increase in the number of objectives, numerous modified dominance relationships were proposed. Recently, the strengthened dominance relation (SDR) has been proposed, where the dominance area of a solution is determined by convergence degree and niche size (). Later, in controlled SDR (CSDR), and an additional parameter associated with the convergence degree are dynamically adjusted depending on the iteration count. Depending on the problem characteristics and the distribution of the current population, different situations require different values of , rendering the linear reduction of k based on the generation count ineffective. This is because a particular value of is expected to bias the dominance relationship towards a particular region on the Pareto front (PF). In addition, due to the same reason, using SDR or CSDR in the environmental selection cannot preserve the diversity of solutions required to cover the entire PF. Therefore, we propose an MOEA, referred to as NSGA-III*, where (1) a modified SDR (MSDR)-based mating selection with an adaptive ensemble of parameter k would prioritize parents from specific sections of the PF depending on k, and (2) the traditional weight vector and non-dominated sorting-based environmental selection of NSGA-III would protect the solutions corresponding to the entire PF. The performance of NSGA-III* is favourably compared with state-of-the-art MOEAs on DTLZ and WFG test suites with up to 10 objectives.
1. Introduction
In literature [1], evolutionary algorithms (EAs) have demonstrated their ability to tackle a variety of optimization problems efficiently. Many real-world optimization problems involve several conflicting objectives that must be optimized simultaneously. Without prior preference information, the existence of conflicting objectives inevitably results in the impossibility of finding a single solution that is globally optimal concerning all of the objectives. In such a situation, instead of total order between various solutions, only partial orders between different solutions may be anticipated, resulting in a solution set consisting of a suite of alternative solutions that have been differently compromised. However, one of the difficulties in multi-objective optimization, compared to the single objective optimization, is that there does not exist a unique or straightforward quality assessment method to classify all the solutions obtained and to guide the search process towards better regions. Multi-objective evolutionary algorithms (MOEAs) are particularly suitable for this task because they simultaneously evolve a population of potential solutions to the problem at hand, which facilitates the search for a set of Pareto non-dominated solutions in a single run of the algorithm. Classically, a multi-objective problem (MOP) can be briefly stated as
However, as the number of objectives incorporated in a problem is more than three, typically known as many-objective optimization problems (MaOPs), many-objective evolutionary algorithms (MaOEAs) have undergone a lot of difficulties. First and foremost, most of the solutions in a population become non-dominated with each other with the increase in the number of objectives. Due to this tendency, the selection pressure toward the Pareto front (PF) deteriorates significantly, making the convergence process of MaOEAs very difficult, especially for the MaOEAs that use the Pareto dominance relation as a key selection criterion. In many-objective optimization, the phenomenon where most of the candidate solutions become incomparable in the sense of Pareto dominance is referred to as dominance resistance [2]. Because of dominance resistance, the ranking of the solutions would depend on the secondary selection criterion, which is diversity measure. Therefore, in the mating selection, the selection of the effective solutions to generate offspring depends on the crowding distance [3]. A variety of approaches have been suggested to address the issues raised by MaOPs in the context of the challenges discussed above. The utmost criterion in any MaOEA is the selection criterion, specifically the environmental selection criterion, which is used to reduce the overabundance of population members. Generally, MOEAs/MaOEAs can be roughly divided into three categories according to their environmental selection strategies: dominance-based [3,4,5], decomposition-based [6,7,8] and indicator-based [9,10,11]. Dominance-based methods mainly use the concept of Pareto dominance along with some diversity measurement criteria. NSGA-II [3] and PDMOEAs [12] are well-known in this category. Decomposition-based methods decompose an MOP/MaOP into a set of sub-problems and optimize them simultaneously. MOEA/D [6], NSGA-III [13], MOEA/DD [8] and RVEA [14] are some popular approaches under this category where a set of pre-defined, uniformly distributed reference vectors [15] are utilized to manage population convergence and diversity. Some of these approaches also incorporate Pareto dominance as a primary criterion to enhance the convergence of the population. Indicator-based approaches quantify the quality of candidate solutions by the indicator value which is a singular value obtained by combining information present in M-objective values. Indicator-based EA (IBEA) [9], HypE [10] and ISDE+ [11] are some representative algorithms in this category.
To enhance the performance of dominance-based MOEAs, the first and most intuitive idea is to establish a new dominance relation or modify the traditional Pareto dominance to increase the selection pressure toward the PF. In literature, many dominance relationships have been proposed in the last couple of years [16,17,18,19,20]. The controlling dominance area of solutions (CDAS) [16] and its adaptive version, referred to as self-CDAS (S-CDAS) [18], improve the convergence pressure by expanding the dominance area. In the generalized Pareto optimality (GPO) [20] and α-dominance [2], the dominance area is expanded by modifying the definition of dominance relation. Dominance relations such as –dominance [21] and grid dominance [22] are based on the gridding of the objective space. θ-dominance [19] and RP-dominance [23] are proposed to suit decomposition-based MaOEAs. Recently, in [24], a new dominance relation referred to as the strengthened dominance relation (SDR) was proposed where a tailored niching technique considering the angles between the candidate solutions was developed. In the proposed niching technique, the niche size () is adaptively determined by the distribution of the candidate solutions. In each niche of size , the solution with the best convergence degree defined by the sum of the objectives is selected. However, in SDR there is a possibility that some dominated solutions may be considered as non-dominated. To overcome this, a modification to SDR referred to as the controlled strengthened dominance relation (CSDR) was proposed in [25], where SDR is combined with traditional Pareto dominance. In addition, CSDR introduces two parameters and into convergence degree and niche size, to control the dominance area and to be adapted based on the generation count. In other words, CSDR degenerates into SDR when the traditional Pareto dominance condition is removed and the parameters and a are set to 1 and 50, respectively.
However, the use of SDR or CSDR in the niching process of the oversized population during the environmental selection results in the loss of some promising solutions as value stresses on some sections of the PF. In other words, the usage of SDR or CSDR in environmental selection may not be suitable. In addition, in the mating selection, a particular value of concentrates on a particular region of the PF. Therefore, the setting of the parameter should depend on the distribution of the current population. In other words, the linear reduction in would not be appropriate for the efficient parent selection for offspring generation.
Motivated by the observations that (1) by controlling the parameter , different sections of the PF can be emphasized, and (2) different stages of the evolutions require different parameter values of depending on the status of the population, we propose a mating selection that employs modified SDR with an adaptive ensemble of parameters where the probability of applying the parameter values in the ensemble depends on the success rate of the parameter values. However, the environmental selection is similar to the traditional NSGA-III because it is able to preserve solutions from the different parts of the PF, thus resulting in the selection of solutions that are diverse and represent the entire PF.
The remainder of this article is organized as follows. Section 2 covers the literature on different dominance relationships and the motivation for the current study. Section 3 describes the modified SDR and NSGA-III* framework with a modified SDR-based mating selection. Section 4 presents the experimental setup and comparison results of NSGA-III* with a number of state-of-the-art MOEAs/MaOEAs. Section 5 concludes the paper.
2. Related Study and Motivation
Given an MOP with M-objectives that are conflicting, as shown in Equation (1), the goal of MOEAs/MaOEAs is to find an optimal set of Pareto-optimal solutions (PS) whose objective values are usually referred to as a Pareto front (PF) that covers the entire decision-making range. In addition, since MOEAs employ a fixed population to cover the entire range, the solutions are expected to be diverse. Therefore, the goal of MOEAs is to start with the random initialization of solutions, referred to as population size, and drive the population close to the PF while maintaining the spread of solutions to cover the entire PF. MOEAs employ two main selection steps referred to as the mating selection and environmental selection to accomplish the task. The aim of the mating selection is to select better population members so that better offspring members can be produced through variation operators. On the contrary, the goal of environmental selection is to select a set of solutions from the solutions, which is the combined set of population and offspring members. In other words, the aim of mating selection is to prioritize better population members in the generation of offspring members, while the aim of environmental selection is to preserve better solutions for further generations. Therefore, for better convergence and diversity in MOEAs, both the selection operators play a crucial role. To promote convergence, both the selection operators employ different mechanisms. The most popular among them is Pareto dominance which can be enforced through non-dominated sorting [3,26].
In an MOP, when the goal is to minimize all the objective s simultaneously, a candidate solution Pareto dominates another solution (i.e., ), if and only if
If neither dominates nor dominates , then and are said to be “incomparable”. Alternatively, both solutions are “non-dominated” to each other. As the increases, i.e., the number of objectives increases, the probability of a solution being dominated by the other solutions decreases. In other words, in a given set of solutions, most of the solutions are labeled as “non-dominated”. Therefore, during the mating and environmental selections, the primary selection that is Pareto dominance fails to distinguish solutions; therefore, the selection entirely depends on the secondary selection criterion, e.g., crowding distance [3], density estimation [27], etc. In other words, the Pareto dominance, which is expected to promote convergence, does not play any role in both the selection steps. Therefore, the selection of solutions based on diversity is not expected to promote convergence, thus leading to the failure of the MOEAs.
To address the convergence issue, various approaches have been proposed to increase the probability that two candidate solutions are distinguishable and thus improve the selection pressure. The different approaches can be categorized as:
- Approaches that expand the dominance are by modifying the objective values such as CDAS [16], S-CDAS [18].
- Approaches that expand the dominance area by modifying the dominance relationship such as α-dominance, generalized Pareto dominance (GPO) [20].
- Approaches that employ gridding in the objective space such as -dominance [21], -dominance [28], cone -dominance [29], grid-dominance [22] and angle dominance [30].
- Fuzzy logic to define new dominance relationships such as (1-k) dominance [31], L-dominance [32] and fuzzy dominance [33].
As illustrated in [24]:
- (a)
- Pareto dominance, (1-k) dominance and L-dominance are good at achieving diversity but poor at promoting convergence.
- (b)
- CDAS, GPO and Grid-based methods are good at achieving convergence but poor at maintaining diversity.
- (c)
- S-CDAS is poor at promoting both diversity and convergence.
To overcome the issues, the strengthened dominance relation (SDR) and controlled strengthened dominance relation (CSDR) were proposed. According to CSDR, a solution is said to CSDR-dominate a solution (denoted as ) if and only if
where is a metric measuring the convergence degree of [11], is the acute angle between the objective values of two candidate solutions x and y in a population P and is expressed as
and is the niche size which is set to the th (a ∈ [1,100]) minimum element of
Before calculating and , the solutions in P are normalized with respect to the ideal and nadir points. The ideal point in the objective space is a vector composed of the optimum of each objective function. On the other hand, the nadir point is a vector made up of the worst of each objective function in the objective space.
In CSDR, by removing the first condition (Equation (3)i) related to Pareto dominance and setting the parameters and to 1 and 50, respectively, it degenerates into SDR. According to the definition of SDR, some of the Pareto-dominated solutions might be classified as non-dominated, which is not desired. However, in [24], it is claimed that since only a few candidate solutions in the population are Pareto-dominated on MaOPs, the classification of dominated solutions as non-dominated solutions has little influence on the performance of MOEA that employs SDR. However, this contradicts the claim regarding dominance resistance, and classifying dominated solutions as non-dominated further aggravates the issue. Therefore, CSDR combines SDR with traditional Pareto dominance and demonstrates a significant improvement in the performance in certain problem instances. However, the use of Pareto dominance in combination with SDR increases the computational complexity of the process.
According to (Equation (3)ii), which is applicable to both CSDR and SDR, the dominance relationship of solutions in the population is mainly controlled by the niche size . According to the first condition in (Equation (3)ii), if the acute angle between solution and solution is smaller than then the convergence degree determines if or Hence, in each niche, in addition to preserving the diversity, the required convergence pressure is enforced. In the second expression in (Equation (3)ii), even if the acute angle between and is greater than , or is possible if the convergence degree of is much smaller than that of . However, as increases the probability that is decreased.
The number of niches or diversity of the solutions or the dominance area of the solutions depend on the niche size ( According to Equation (4), the niche size can be controlled by adjusting the parameter . In other words, the proportion of the dominance area is increased with the increase of strengthening the convergence pressure towards PF due to a lesser number of niches. On the other hand, a small value of a is expected to improve the diversity due to a large number of niches. However, the lower and the upper bounds of a niche have to be restricted. In [25], it is justified that the values around 50 would be better, mostly a range from 40 to 60. This is based on the intuition that the environmental selection consistently chooses half of the combined population acquired at each generation in the majority of current MOEAs, the target of adapting is to guarantee that the ratio of the non-dominated solutions in a given candidate set is around 0.5.
To demonstrate the effect of , keeping the niche size constant, three solutions (A, B and C) are considered in a bi-objective space corresponding to a convex MOP and the convergence degree of the solutions when k varies from 0 to 2 is plotted in Figure 1. From Figure 1, it is evident that A always has a better convergence degree compared to C because . For > 1, the candidate solutions (A and C) from the center region of the objective space have a better convergence degree. On the other hand, for 0 < < 1, corner solutions (B) away from the centre of objective space have a better convergence degree. Based on the observation in [25], it can be concluded that (1) larger values of enhance the convergence pressure, and (2) small values of k enhance diversity.
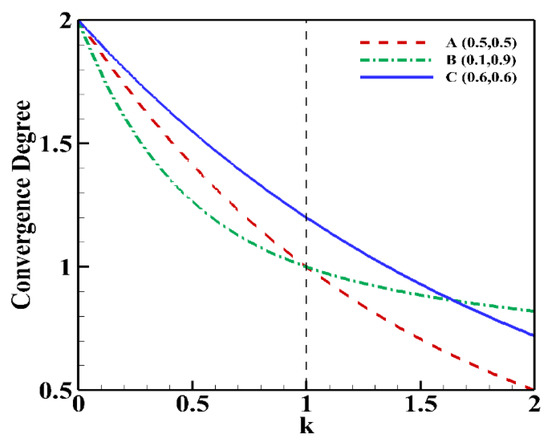
Figure 1.
Convergence degree of solutions A(0.5, 0.5), B(0.1, 0.9) and C(0.6, 0.6) with variation in parameter , [24].
Based on the above intuition, in CSDR, the parameters k and a can be adjusted as follows:
where and are predefined initial values, and are the variations of and , respectively, and is the maximum number of generations. The parameter settings are detailed in [25]. The decrease of parameters k and with respect to the generation count is based on the notion that dynamic dominance relations would improve the performance of MOEAs. In other words, high convergent pressure is exerted to push the population towards the PF in the early phase of evolution and as the search progresses, population diversity is enforced in the selection to generate well-distributed solutions. The value of starts with a value of 60 in the initial generations, and the value of is reduced to 40 in the final generation. In other words, with a large value of , niche size () would be large resulting in a smaller number of niches. This would help the better segregation of solutions and thus promote convergence. On the other hand, a smaller value of niche size () in the later stages would increase the number of niches to accommodate enough numbers of well-spread solutions. Therefore, with respect to parameter , the observation that starting with a large value and reducing to a smaller value over the generations would shift the focus from convergence to diversity as the number of generations increases.
However, as mentioned earlier, the observation that larger values of promote convergence and smaller values of promote diversity is not correct. Actually, depending on the nature of the problem, different values of prioritize the different regions of the PF. In other words, in a convex problem (ZDT1 [34]), as the value of is decreased the focus shifts from the center of the PF to the edges of the PF as shown in Figure 2a with five different solutions taken from the true PF. However, while in a concave problem (ZDT2 [34]), the contrary happens as shown in Figure 2b. Therefore, the actual observation is that as changes with respect to the dominance relationship, the focus shifts to different regions on the PF.
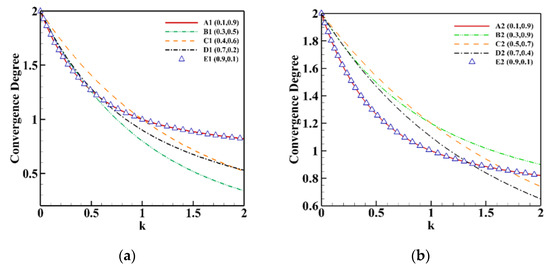
Figure 2.
(a) Convergence degree of solutions A1 (0.1, 0.9), B1 (0.3, 0.5), C1 (0.4, 0.6), D1 (0.7, 0.2) and E1 (0.9, 0.1) for convex problem and (b) convergence degree of solutions A2 (0.1, 0.9), B2 (0.3, 0.9), C2 (0.5, 0.7), D2 (0.7, 0.4) and E2 (0.9, 0.1) for concave problem whenever .
In addition, the use of CSDR in the environmental selection might result in issues such as: (1) as the adaptation of is based on the number of generations, in a convex problem, by the time the comes down to a value , if the convergence of the population reaches the center part of the optimal PF, then the decrease of further will allow the algorithm to slowly shift the focus to the edges. The reduction in combined with the decrease in would help CSDR perform well. However, if the value comes down to a value <1 before the population converges to the optimal PF in the central region, then decreasing further will only concentrate on the edges. Therefore, the centre part of PF will be left unexplored, resulting in degraded performance. In other words, some sections of the PF would not be adequately explored. (2) As the niche size is reduced with generation count, the number of niches increases resulting in some sparse regions during the search process. Therefore, different values of parameter would be helpful at different stages depending on the distribution of the current population.
Therefore, reduction of with respect to the generations heavily depends on the maximum generation count and is not appropriate to obtain a well converged diverse set of solutions. Therefore, motivated by the observation, we propose a modified SDR that employs an ensemble of parameter k. The probability of employing each parameter value in the ensemble pool is adapted over the generations depending on the performance. The modified SDR is only employed in the mating selection to select better parents for offspring generation. In contrast, the environmental selection is based on traditional Pareto dominance because of its unbiased nature and ability to preserve solutions corresponding to the entire PF.
3. Controlled Strengthened Dominance-Based Mating Selection with Adaptive Ensemble of Parameters for NSGA-III (NSGA-III*)
In this section, the concept of modified SDR is initially described and is followed by the framework of NSGA-III*. Based on the observations mentioned in the previous section, a modified SDR (MSDR) is proposed accordingly which a solution is said to MSDR dominates to another solution (i.e., ) if and only if
where the definitions of Con(x), are the same as in Equation (3). The adaptation of is the same as in CSDR. However, value is selected from a fixed pool of values sampled from the range . In the current study, the size of the pool is set to be five. The selection of the parameters from the pool is probabilistic, where the probabilities are adapted depending on the number of successful offspring members produced by the parameter values in the pool.
The basic framework of the proposed NSGA-III* is as follows:
- (1)
- Mating selection that employs modified SDR.
- (2)
- Environmental selection is similar to standard NSGA-III with weight vectors and traditional Pareto dominance.
NSGA-III* starts with a parent population which is of size (Algorithm 1, Line 1). In each generation (t), the mating selection is performed by probabilistically selecting a value from the pool and a mating pool (Algorithm 1, Line 4). After mating selection, the offspring population ( of size N is created (Algorithm 1, Line 5). The offspring population ( and population ( are combined to form (Algorithm 1, Line 6) and normalized (Algorithm 1, Line 7). Through environmental selection, best N solutions are selected from to form the population members for the next generation (Algorithm 1, Line 8).
| Algorithm 1: NSGA-III* pseudo-code |
| 01: Generate initial population (N) |
| 02: t = 1; |
| 03: While (t < tmax) do |
| 04: |
| 05: |
| 06: |
| 07: |
| 08: |
| 09: |
| 10: |
| 11: End While |
3.1. Initialization
A set of uniform weight vectors are generated using the NBI method [15], then subsequently, a population of size is initialized within the permissible boundaries. The pool of values and their initial probabilities of selection corresponding to the parameter is set as and , respectively. The size of the pool (p) is set to five in the current study. The effect of the parameter values in the ensemble on the performance of the algorithm is demonstrated in Section 4.
3.2. Mating Selection with Modified SDR and Offspring Generation
At each generation (t), the parameter value corresponding to a is obtained from Equation (6). In addition, considering each value in the pool, the population is sorted based on the modified SDR (Algorithm 2, Line 02). After sorting, through binary tournament selection ( solutions are selected into the mating pool, where the probabilities corresponding to each parameter value of at generation is given by After repeating the process for each value of the mating pool is formed (Algorithm 2, Line 05). Since the mating pool is formed considering different values of , the distribution of the parents selected for offspring generation would be sampled from different regions of the PF. In addition, as the probabilities of the parameter values are being adapted based on the performance, the values that perform better are given a chance to produce more offspring members (Algorithm 4). In other words, the region on the PF that corresponds to the values with high probabilities is given priority, and more offspring members would be generated in that region. In conclusion, depending on the nature of the problem, and distribution of the population members, different stages of the evolution require different values. Moreover, the selection probabilities of each parameter value in the pool reflect the state of the current population. The details regarding the adaptation of the probabilities corresponding to the parameter values in the pool are presented in Section 3.5 (Algorithm 4). After forming the mating pool, the variation operators, namely crossover and mutation, are employed to produce the offspring members (Algorithm 1, Line 05). In the current study, simulated binary crossover (SBX) and polynomial mutation (PM) are employed.
| Algorithm 2: |
| 01: Generate initial population (N) |
| 02: |
| 03: |
| 04: End For |
| 05: |
3.3. Normalization
Normalization is an essential tool to map the unscaled search space to a scaled one so as to characterize the badly scaled objectives. In NSGA-III*, the normalization of the jth population member is given in Equation (7).
where and are considered as the lowest and highest values of objective function.
3.4. Environmental Selection
To perform the environmental selection (Algorithm 3), where the goal is to select solutions for (t + 1)th generation ( from the combined population of size from generation (t), a set of pre-defined weight vectors is set [15]. First, the non-dominated sorting based on traditional Pareto dominance is performed on which is the result of normalization of Based on the number of individuals on the sub-fronts, if the condition satisfies then is considered as the parent population of the next generation (Algorithm 3, Lines 2~4). Otherwise, the association is performed between the set of weight vectors and the combined population (Algorithm 3, Line 5). Each solution tries to associate with each weight vector based on angle. If multiple solutions are associated with the same weight vector then a solution will be selected from the associated solutions which has a minimum perpendicular distance to that particular weight vector (Algorithm 3, Line 6). After the association process, the best associated solutions will be added to and if , then the weight vectors without any associated solutions are identified as ineffective weight vectors . These ineffective weight vectors again try to associate with the members of the last front (Algorithm 3, Line 8). The number of associated solutions selected is represented by . Finally, combined the population represents the parent population for the next generation (Algorithm 3, Lines 10).
| Algorithm 3: Environmental_selection |
| (Merged Population at generation), W (Reference Point Set), N (Size of Population) |
| 01: |
| 02: |
| 03: |
| 04: Else |
| 05: |
| 06: |
| 07: |
| 08: |
| 09: |
| 10: |
| 11: End If |
In [24,25], the modified dominance relationships, namely SDR and CSDR, are employed in the environmental selection, in addition to the mating selection. However, in the current work, the environmental selection is based on traditional Pareto dominance so that the environmental selection process is not biased to any section of the PF.
3.5. Adaptation of the Probability of Parameters in the Ensemble Pool
As mentioned in Section 3.2, the probabilities of applying the parameter values in the pool need to be adapted over the generations (Algorithm 4). At the end of each generation (t), the number of solutions produced by that entered the parent population are counted to modify the probabilities. In other words, count the number of solutions for each as after getting the parent set from the environmental selection (Algorithm 4, Line 1). Normalize each of the s as (Algorithm 4, Line 2). The probabilities of the parameters in the ensemble pool are thus updated using a weighted function where the performance of the current generation is given a weight of 0.3. In addition, a probability of applying any parameter value in the pool cannot go below a min threshold value of 0.05. Finally, the normalization of probabilities is performed (Algorithm 4, Lines 3~5).
| Algorithm 4: |
| 01: count the number of occurrences of solutions for each k. |
| 02: |
| 03: |
| 04: |
| 05: |
4. Experimental Setup, Results and Discussion
Experiments were conducted on 16 scalable test problems from DTLZ and WFG, test suites comprising of seven and nine problems, respectively. For each test problem, 2-, 4-, 6-, 8- and 10-objectives were considered. The parameter values employed are present in [11]. In order to compare the efficiency of NSGA-III* with the state-of-the-art algorithms a quantitative indicator, namely HyperVolume (HV), was employed. The larger value of HV implies the superiority of the algorithm. In this experiment, we first performed the normalization of the objective vectors before calculating the HV. The reference point was set as To evaluate the HV, we considered the Monte Carlo sampling, where the number of the sampling point was In each instance, 30 independent runs were performed for each algorithm on a PC with a 3.30 GHz Intel (R) Core (TM) i7- 8700 CPU and Windows 10 Pro 64-bit operating system with 16 GB RAM. As a stopping criterion, the maximum number of generations for DTLZ1 and WFG2 was set to 700 and for DTLZ3 and WFG1 it was set as 1000. For the other problems (DTL2, DTLZ4–7 and WFG3–9) it was set to 250. All algorithms considered employing a population size (N) of 100, 165, 182, 240 and 275 for 2-, 4-, 6-, 8-, 10-objectives, respectively. Simulated binary crossover and polynomial mutation with distribution indices and probabilities set to , , and , respectively, were employed.
The only additional component introduced into the NSGA-III* was the pool of parameter values . To investigate the robustness of the NSGA-III* algorithm with respect to the selection of the pool, we performed simulations with different sets of values. In all the sets, it was made sure that the pool of values were diverse, representative and covered the entire range. In addition, the size of the pool could not be large. Therefore, the size of pool was set to five. The experiments were conducted by incorporating five different sets of diverse and well representative pools corresponding to parameter into NSGA-III* named as NSGA-III1* , NSGA-III2* , NSGA-III3* , NSGA-III4* and NSGA-III5* .
The experimental analysis was also performed in 16 scalable test problems from DTLZ and WFG test suites. The results are presented in the supplementary file and the pair-wise comparisons are summarized in Table 1 with respect to the number of wins (W), number of losses (L) and number of ties (T). From the results, it is evident the performance of the NSGA-III* with respect to the selection of the pool is quite robust which is apparent from the performance similarity (represented with T) between the different versions of the ensemble of over 80%. However, NSGA-III2* with the pool of is the best suited value among them and with a slightly better performance. Therefore, the simulation results corresponding to referred to as NSGA-III* are employed to compare with the state-of-the-art algorithms in Table 2.

Table 1.
Summary of the experimental results demonstrating the robustness of the NSGA-III* to the parameter values in the ensemble pool.
Table 2.
Comparison of HV and statistical results on DTLZ and WFG test problems (“+”–WIN, “≈”–TIE, “−”–LOSS).
To demonstrate the effect of the different instances of NSGA-II/CSDR [25] where (1) the values are linearly reduced based on generations as in Equation 5, and (2) both the mating and environmental selections employ CSDR, all the instances of NSGA-II/CSDR considered start with . However, the rate of reductions employed are 0.6, 0.5, 0.4 and 0.2 and the instances are referred to as NSGA-II/CSDR1, NSGA-II/CSDR2, NSGA-II/CSDR3 and NSGA-II/CSDR4, respectively. The simulations are performed on 3-objective instances of DTLZ1 and DTLZ3. The plots corresponding to the final population are depicted in Figure 3 and Figure 4. From the figures, it is evident that all the four instances corresponding to NSGA-II/CSDR cannot produce well distributed solutions in all the three problems. In other words, even though all the instances of NSGA-II/CSDR start with the same due to the different values, the value of parameter in the final generation would be different. As mentioned earlier, as different values of emphasize the different regions of the PF, the use of CSDR in the environmental selection would result in bias resulting in non-uniform distribution of solutions. This is evident from the simulation results depicted in Figure 3 and Figure 4.
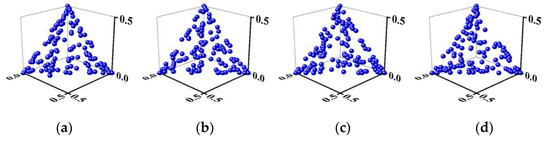
Figure 3.
Pareto front of 3-objective DTLZ1 for problems (a) NSGA-II/CSDR1 (b) NSGA-II/CSDR2 (c) NSGA-II/CSDR3 (d) NSGA-II/CSDR4.
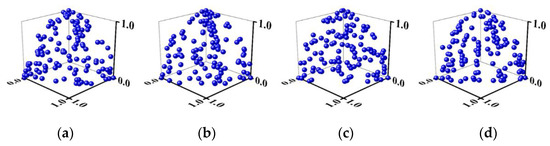
Figure 4.
Pareto front of 3-objective DTLZ3 for problems (a) NSGA-II/CSDR1 (b) NSGA-II/CSDR2 (c) NSGA-II/CSDR3 (d) NSGA-II/CSDR4.
To demonstrate that different values of are going to be effective at different stages of the evolutions, the plots corresponding to the changes in the probabilities of the parameter values in the ensemble pool are plotted in Figure 5. To plot, the 4- and 8-objective instances of DTLZ3 and WFG1 were considered. From the figure, it is evident that depending on the characteristics of the problem and distribution of the current population, different values of in the pool are considered to be effective at different stages of the evolution. In addition, there is no standard pattern of reducing that is suitable for all the problems. Therefore, continuously reducing the parameter , as done is NSGA-II/CSDR, is not suitable.
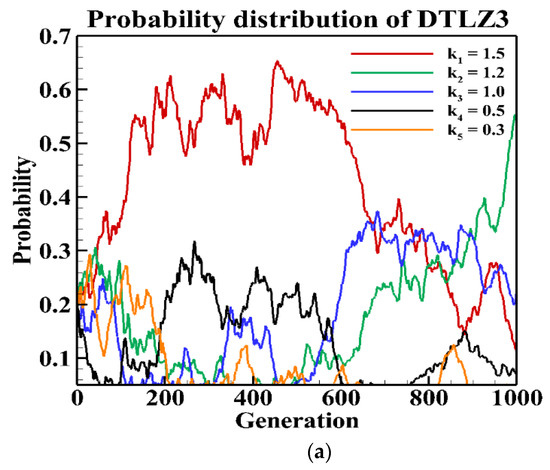
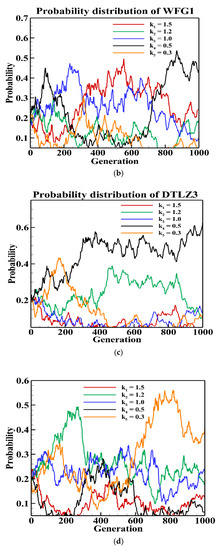
Figure 5.
Probability of parameters during evolution on 4- and 8-objective DTLZ3 and WFG1. (a) 4-objective DTLZ3, (b) 4-objective WFG1, (c) 8-objective DTLZ3 and (d) 8-objective WFG1.
First, we would like to compare the performance of NSGA-II, NSGA-III, NSGA-II/SDR and NSGA-II/CSDR to demonstrate the effect of not using Pareto dominance in environmental selection. In 2-objective instances of DTLZ1, DTLZ2 and DTLZ3, it is evident that NSGA-II, NSGA-III and NSGA-II/CSDR employ Pareto dominance in the environmental selection and perform better than NSGA-II/SDR which does not employ Pareto dominance. However, the performance of the proposed NSGA-III* is comparable to the best result as it employs Pareto dominance in the environmental selection.
In higher objectives in WFG4 to WFG9, the performance of NSGA-II/SDR is better than NSGA-II/CSDR, according to the simulation results. This might be due to the linear reduction of k with respect to generations in NSGA-II/CSDR compared to the constant setting ( = 1) in NSGA-II/SDR. In other words, the linear reduction of k with generations is not suitable for all the problems with diverse characteristics. However, the performance of NSGA-II* is comparable or better to the best of NSGA-II/SDR or NSGA-II/CSDR and indicates the effectiveness of the adaptive ensemble in finding the suitable k depending on the characteristics of the problem and the distribution of the population.
The performance of the proposed NSGA-III* was compared with state-of-the-art MOEAs such as NSGA-II, NSGA-II/SDR, NSGA-II/CSDR, MOEA/D, MOEAD-DE, NSGAIII, TDEA and ISDE+. The experimental results (mean and standard deviation values of normalized HV) on benchmark suites are presented in Table 2. In addition, the statistical tests (t-test) at a 5% significance level were conducted to compare the significance of the difference between the mean metric values yielded by NSGA-III* and state-of-the-art algorithms. The signs “+”, “−” and “≈” against the HV values indicate that the NSGA-III* is statistically “better”, “worse” and “comparable” with the corresponding algorithm, respectively. The last row of Table 2 represents the overall performance of NSGA-III* in terms of the number of instances where it is better (Win-W), comparable (Tie-T) and worse (Loss-L) with respect to the corresponding algorithm.
For better visualization, the performance of state-of-the-art algorithms in terms of wins, ties and losses are summarized in Figure 6.
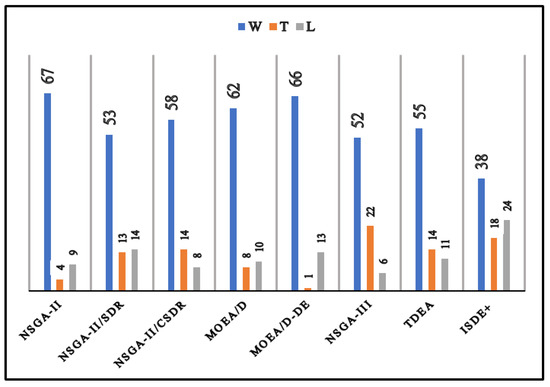
Figure 6.
Comparison of NSGA-III* with other state-of-the-art algorithims.
As shown in Figure 6 and Table 2, NSGA-III* significantly outperforms or is comparable to NSGA-II, NSGA-II/SDR, NSGA-II/CSDR, MOEA/D, MOEA/D-DE, NSGA-III, TDEA and ISDE+ in 71⁄80 ≈ 88.75%, 66⁄80 ≈ 82.5%, 72⁄80 ≈ 90%, 70⁄80 ≈ 87.5%, 67⁄80 ≈ 83.75%, 74⁄80 ≈ 92.5%, 69⁄80 ≈ 86.25% and 56⁄80 ≈ 70% of cases, respectively. In other words, NSGA-III* consistently performs better than the state-of-the-art algorithms. This can be attributed to the modified SDR-based mating selection with an ensemble of parameter values that ensures that solutions are uniformly sampled over the entire range of the PF by prioritizing respective values. In addition, the weight vector-based environmental selection based on Pareto dominance was able to provide the required diversity on the PF without any bias to specific regions. Furthermore, the NSGA-III* is implemented in MatLab using the PlatEmo [35] framework. The source code is accessible at https://github.com/Saykat1993/Mating-Selection-based-on-Modified-Strengthened-Dominance-Relation-for-NSGA-III.git (accessed on 2 November 2021).
5. Conclusions
In this manuscript, a modified strengthened dominance relation (MSDR) with an adaptive ensemble of parameter values that can enforce convergence is proposed. A multi/many-objective evolutionary algorithm (MOEA) that employs mating selection based on MSDR and environmental selection using weight vectors and Pareto dominance is proposed, referred to as NSGA-III*. In the proposed NSGA-III*, the probability of applying different parameter values in the ensemble is adapted based on the performance of the parameters. In other words, the probability of the parameters changes depending on the nature of the problem and the distribution of the population. The environmental selection with Pareto dominance enables the diversity of the solutions over the entire Pareto front due to its unbiased nature. The performance of the proposed NSGA-III* framework is compared with various state-of-the-art MOEA algorithms on standard benchmark test suites.
Supplementary Materials
The following are available online at https://www.mdpi.com/article/10.3390/math9222837/s1, In the supplementary materials the HyperVolume comparisons of NSGA-III* for different values of , named as NSGA-III1*, NSGA-III2*, NSGA-III3*, NSGA-III4* and NSGA-III5* are presented. In Table S1, the performance of NSGA-III1* with the rest of the others is compared. In a similar fashion, the performance of NSGA-III2*, NSGA-III3*, NSGA-III4* and NSGA-III5* are presented in Tables S2–S5, respectively.
Author Contributions
Conceptualization, S.D., S.S.R.M. and R.M.; methodology, S.D., S.S.R.M. and R.M.; software, S.D.; validation, S.D. and R.M.; formal analysis, S.D., S.S.R.M. and R.M.; investigation, K.N.D. and D.-G.L.; resources, K.N.D. and D.-G.L.; data curation, S.D. and R.M.; writing—original draft preparation, S.D. and S.S.R.M.; writing—review and editing, R.M., K.N.D. and D.-G.L.; visualization, S.D.; supervision, R.M.; project administration, K.N.D.; funding acquisition, R.M. and D.-G.L. All authors have read and agreed to the published version of the manuscript.
Funding
This work was supported by the National Research Foundation (NRF), Korea, under Project BK21.
Institutional Review Board Statement
Not applicable.
Informed Consent Statement
Not applicable.
Data Availability Statement
Not applicable.
Acknowledgments
Not applicable.
Conflicts of Interest
The authors declare no conflict of interest.
References
- Goldberg, D.E. Genetic Algorithms in Search, Optimization and Machine Learning; Addison-Wesley Longman Publishing Co., Inc.: Boston, MA, USA, 1989. [Google Scholar]
- Ikeda, K.; Kita, H.; Kobayashi, S. Failure of Pareto-based MOEAs: Does non-dominated really mean near to optimal? In Proceedings of the 2001 Congress on Evolutionary Computation (IEEE Cat. No.01TH8546), Seoul, Korea, 27–30 May 2001; Volume 2, pp. 957–962. [Google Scholar]
- Deb, K.; Pratap, A.; Agarwal, S.; Meyarivan, T. A fast and elitist multiobjective genetic algorithm: NSGA-II. IEEE Trans. Evol. Comput. 2002, 6, 182–197. [Google Scholar] [CrossRef] [Green Version]
- Knowles, J.; Corne, D. The Pareto archived evolution strategy: A new baseline algorithm for Pareto multiobjective optimisation. In Proceedings of the 1999 Congress on Evolutionary Computation-CEC99 (Cat. No. 99TH8406), Washington, DC, USA, 6–9 July 1999; Volume 1, pp. 98–105. [Google Scholar]
- Zitzler, E.; Laumanns, M.; Thiele, L. SPEA2: Improving the Strength Pareto Evolutionary Algorithm; Eidgenössische Technische Hochschule Zürich (ETH), Institut für Technische Informatik und Kommunikationsnetze (TIK): Zurich, Switzerland, 2001; Volume 103. [Google Scholar]
- Zhang, Q.; Li, H. MOEA/D: A Multiobjective Evolutionary Algorithm Based on Decomposition. IEEE Trans. Evol. Comput. 2007, 11, 712–731. [Google Scholar] [CrossRef]
- Liu, H.; Gu, F.; Zhang, Q. Decomposition of a Multiobjective Optimization Problem Into a Number of Simple Multiobjective Subproblems. IEEE Trans. Evol. Comput. 2014, 18, 450–455. [Google Scholar] [CrossRef] [Green Version]
- Li, K.; Deb, K.; Zhang, Q.; Kwong, S. An Evolutionary Many-Objective Optimization Algorithm Based on Dominance and Decomposition. IEEE Trans. Evol. Comput. 2015, 19, 694–716. [Google Scholar] [CrossRef]
- Ishibuchi, H.; Tsukamoto, N.; Sakane, Y.; Nojima, Y. Indicator-based evolutionary algorithm with hypervolume approximation by achievement scalarizing functions. In Proceedings of the 12th Annual Conference on Genetic and Evolutionary Computation, Portland, OR, USA, 11–13 July 2010. [Google Scholar]
- Bader, J.; Zitzler, E. HypE: An Algorithm for Fast Hypervolume-Based Many-Objective Optimization. Evol. Comput. 2011, 19, 45–76. [Google Scholar] [CrossRef] [PubMed]
- Pamulapati, T.; Mallipeddi, R.; Suganthan, P.N. ISDE +—An Indicator for Multi and Many-Objective Optimization. IEEE Trans. Evol. Comput. 2019, 23, 346–352. [Google Scholar] [CrossRef]
- Palakonda, V.; Mallipeddi, R. Pareto Dominance-Based Algorithms With Ranking Methods for Many-Objective Optimization. IEEE Access 2017, 5, 11043–11053. [Google Scholar] [CrossRef]
- Deb, K.; Jain, H. An Evolutionary Many-Objective Optimization Algorithm Using Reference-Point-Based Nondominated Sorting Approach, Part I: Solving Problems With Box Constraints. IEEE Trans. Evol. Comput. 2014, 18, 577–601. [Google Scholar] [CrossRef]
- Cheng, R.; Jin, Y.; Olhofer, M.; Sendhoff, B. A Reference Vector Guided Evolutionary Algorithm for Many-Objective Optimization. IEEE Trans. Evol. Comput. 2016, 20, 773–791. [Google Scholar] [CrossRef] [Green Version]
- Das, I.; Dennis, J.E. Normal-Boundary Intersection: A New Method for Generating the Pareto Surface in Nonlinear Multicriteria Optimization Problems. SIAM J. Optim. 1998, 8, 631–657. [Google Scholar] [CrossRef] [Green Version]
- Sato, H.; Aguirre, H.E.; Tanaka, K. Controlling Dominance Area of Solutions and Its Impact on the Performance of MOEAs. In Evolutionary Multi-Criterion Optimization; Obayashi, S., Deb, K., Poloni, C., Hiroyasu, T., Murata, T., Eds.; Springer: Berlin/Heidelberg, Germany, 2007; pp. 5–20. [Google Scholar]
- Wang, G.; Jiang, H. Fuzzy-Dominance and Its Application in Evolutionary Many Objective Optimization. In Proceedings of the 2007 International Conference on Computational Intelligence and Security Workshops (CISW 2007), Harbin, China, 15–19 December 2007; pp. 195–198. [Google Scholar]
- Sato, H.; Aguirre, H.E.; Tanaka, K. Self-Controlling Dominance Area of Solutions in Evolutionary Many-Objective Optimization. In Simulated Evolution and Learning; Deb, K., Ed.; Springer: Berlin/Heidelberg, Germany, 2010; pp. 455–465. [Google Scholar]
- Yuan, Y.; Xu, H.; Wang, B.; Yao, X. A New Dominance Relation-Based Evolutionary Algorithm for Many-Objective Optimization. IEEE Trans. Evol. Comput. 2016, 20, 16–37. [Google Scholar] [CrossRef]
- Zhu, C.; Xu, L.; Goodman, E.D. Generalization of Pareto-Optimality for Many-Objective Evolutionary Optimization. IEEE Trans. Evol. Comput. 2016, 20, 299–315. [Google Scholar] [CrossRef]
- Laumanns, M.; Thiele, L.; Deb, K.; Zitzler, E. Combining convergence and diversity in evolutionary multiobjective optimization. Evol. Comput. 2002, 10, 263–282. [Google Scholar] [CrossRef]
- Yang, S.; Li, M.; Liu, X.; Zheng, J. A Grid-Based Evolutionary Algorithm for Many-Objective Optimization. IEEE Trans. Evol. Comput. 2013, 17, 721–736. [Google Scholar] [CrossRef]
- Elarbi, M.; Bechikh, S.; Gupta, A.; Said, L.B.; Ong, Y. A New Decomposition-Based NSGA-II for Many-Objective Optimization. IEEE Trans. Syst. Man Cybern. Syst. 2018, 48, 1191–1210. [Google Scholar] [CrossRef]
- Tian, Y.; Cheng, R.; Zhang, X.; Su, Y.; Jin, Y. A Strengthened Dominance Relation Considering Convergence and Diversity for Evolutionary Many-Objective Optimization. IEEE Trans. Evol. Comput. 2019, 23, 331–345. [Google Scholar] [CrossRef] [Green Version]
- Shen, J.; Wang, P.; Wang, X. A Controlled Strengthened Dominance Relation for Evolutionary Many-Objective Optimization. IEEE Trans. Cybern. 2020, 1–13. [Google Scholar] [CrossRef]
- Srinivas, N.; Deb, K. Muiltiobjective Optimization Using Nondominated Sorting in Genetic Algorithms. Evol. Comput. 1994, 2, 221–248. [Google Scholar] [CrossRef]
- Li, M.; Yang, S.; Liu, X. Shift-Based Density Estimation for Pareto-Based Algorithms in Many-Objective Optimization. IEEE Trans. Evol. Comput. 2014, 18, 348–365. [Google Scholar] [CrossRef] [Green Version]
- Hernández-Díaz, A.G.; Santana-Quintero, L.V.; Coello, C.A.C.; Molina, J. Pareto-adaptive ε-dominance. Evol. Comput. 2007, 15, 493–517. [Google Scholar] [CrossRef] [PubMed]
- Batista, L.S.; Campelo, F.; Guimarães, F.G.; Ramírez, J.A. Pareto Cone ε-Dominance: Improving Convergence and Diversity in Multiobjective Evolutionary Algorithms. In Evolutionary Multi-Criterion Optimization; Takahashi, R.H.C., Deb, K., Wanner, E.F., Greco, S., Eds.; Springer: Berlin/Heidelberg, Germany, 2011; pp. 76–90. [Google Scholar]
- Liu, Y.; Zhu, N.; Li, K.; Li, M.; Zheng, J.; Li, K. An angle dominance criterion for evolutionary many-objective optimization. Inf. Sci. 2020, 509, 376–399. [Google Scholar] [CrossRef]
- Farina, M.; Amato, P. A fuzzy definition of “optimality” for many-criteria optimization problems. IEEE Trans. Syst. Man Cybern. Part A Syst. Hum. 2004, 34, 315–326. [Google Scholar] [CrossRef]
- Zou, X.; Chen, Y.; Liu, M.; Kang, L. A New Evolutionary Algorithm for Solving Many-Objective Optimization Problems. IEEE Trans. Syst. Man Cybern. Part B Cybern. 2008, 38, 1402–1412. [Google Scholar]
- He, Z.; Yen, G.G.; Zhang, J. Fuzzy-Based Pareto Optimality for Many-Objective Evolutionary Algorithms. IEEE Trans. Evol. Comput. 2014, 18, 269–285. [Google Scholar] [CrossRef]
- Zitzler, E.; Deb, K.; Thiele, L. Comparison of Multiobjective Evolutionary Algorithms: Empirical Results. Evol. Comput. 2000, 8, 173–195. [Google Scholar] [CrossRef] [Green Version]
- Tian, Y.; Cheng, R.; Zhang, X.; Jin, Y. PlatEMO: A MATLAB Platform for Evolutionary Multi-Objective Optimization [Educational Forum]. IEEE Comput. Intell. Mag. 2017, 12, 73–87. [Google Scholar] [CrossRef] [Green Version]
Publisher’s Note: MDPI stays neutral with regard to jurisdictional claims in published maps and institutional affiliations. |
© 2021 by the authors. Licensee MDPI, Basel, Switzerland. This article is an open access article distributed under the terms and conditions of the Creative Commons Attribution (CC BY) license (https://creativecommons.org/licenses/by/4.0/).