You are currently viewing a new version of our website. To view the old version click .
Mathematics
  • Article
  • Open Access

25 August 2021

Validity and Reliability of the Portuguese Version of Mathematics Academic Motivation Scale (MATAMS) among Third Cycle of Basic School Students

and
1
Polytechnic of Porto and Centre for Research in Economics and Management (NIPE), School of Technology and Management, University of Minho, 4710-057 Braga, Portugal
2
Centre for Transdisciplinary Development Studies (CETRAD), University of Trás–os–Montes e Alto Douro, 5000-801 Vila Real, Portugal
*
Authors to whom correspondence should be addressed.

Abstract

The importance of motivation in mathematics education is expressed in the large number of studies related to the teaching and learning process. Improving students’ motivation in the mathematics classroom is a fundamental issue for teachers, investigators, and policymakers, due to its relevance in the students’ behavior and academic success. The Academic Motivation Scale is a highly applied tool to evaluate students’ motivation based on Self-Determination Theory. In Portugal, there is a lack in the analysis of the different domains of mathematics motivation defined by Self-Determination Theory, for students attending basic education. Additionally, there is no comprehensive instrument that allows that evaluation. Adapting the Academic Motivation Scale, the purpose of this study is to assess the mathematics motivation of Portuguese students who attend the third cycle of basic education. In addition, it is intended to analyze the properties of this new instrument using a sample of 349 Portuguese students aged between 12 and 17. Exploratory and confirmatory factor analysis indicated a very good validity and reliability of this measuring instrument of mathematics students’ motivation. The results of this work allow the development of educational policies that promote strategies to increase students’ motivation in mathematics.

1. Introduction

Recently, an extensive multidisciplinary empirical literature has assessed the factors that influence students’ achievement, including studies in Economics of Education (e.g., [1,2,3,4]), as well in other social sciences (e.g., [5,6,7,8,9]).
This research provides evidence that student achievement depends on a whole range of factors that can be grouped into three categories: family characteristics, school characteristics, and the student himself. The students’ characteristics and their families are the main factors influencing student achievement gains, as expected [3]. Furthermore, this research suggests that among school-related factors, namely the teacher’s characteristics and class size, appear to matter for student’s performance [4].
Additionally, the literature has demonstrated the predictive importance of numerous unobservable characteristics, namely at the motivational level (e.g., [8,9,10,11]). Pintrich [10] puts forward that assessing motivation could address fundamental questions, such as why students distinguish themselves in their capacity to develop cognitive and knowledge resources that are essential for academic progress. In the same line, Barkoukis et al. [12] argue that the lack of academic motivation has been pointed to be a key predictor of negative academic achievements.
In their studies, the Academic Motivation Scale (AMS) has proven to be very effective in measuring students’ motivation. Thus, it is a potential instrument that could be modified to measure motivation in mathematics subject comprehensively and according to Self-Determination Theory (SDT).
Lack of academic motivation has been reported to be a cause for negative outcomes in education. Although motivation is correlated with the academic success of students, according to the literature there is a gap in terms of robust instruments for the construct of motivation in relation to mathematics education [13]. Additionally, researchers argue that educational investigation have given insufficient attention to the construct of mathematics motivation [14].
The failure of the mathematics subject has been seriously discussed in Portugal, since it is one of the subjects in the school curriculum, in which students have the worst academic results. Several factors have been pointed out for this failure, namely the students’ lack of motivation to study the discipline.
This disinvestment in the subject of mathematics can be motivated by the sequential and interconnected character of the different mathematical themes, which requires greater motivation and monitoring by students, compared to other subjects in their school curriculum.
This investigation aims to modify an existing theory-based instrument (AMS) tool—Mathematics Academic Motivation Scale (MATAMS)—as a measure of seven types of students’ motivation toward mathematics. Thus, the aim of this study is to validate MATAMS, relative to Portuguese students who attend the third cycle of basic education. Validation of this scale applied to mathematics will help to produce a new instrument that can be used to measure students’ motivation in this area of knowledge, evaluating their current status, and providing guidelines to promote their improvement.

2. Literature Review

Academic motivation is a key concept in the teaching–learning process. Pintrich [10] states that motivation is the most important factor affecting the academic success or failure of an individual in the learning process. As such, motivation is a concept that is important for both teachers and students in perceiving the reason for success or failure in education.
Academic motivation affects students’ performance (e.g., [5,9,11,15,16,17,18,19]), but it is also related to dropping out of school (e.g., [11,20,21,22]) and anxiety (e.g., [23,24]). In this context, the need for valid instruments that measure motivation in different areas of knowledge arose in the literature.
The AMS has been widely used to measure motivation in student populations and, based upon results, various methods have been posited to improve motivation in students. It relies on the Self-Determination Theory of human motivation, which proposes that motivation is intrinsic, extrinsic, or amotivated, and allows to assign values to these different types of motivation.
Consequently, the AMS was adapted and validated with various samples in several cultural contexts, namely, United States (e.g., [25,26,27,28,29,30,31,32,33]), Canada (e.g., [34,35,36,37,38]), Hungary e.g., [39], Greece (e.g., [12]); England (e.g., [40]), France (e.g., [39,41]), Spain (e.g., [42,43]), Turkey (e.g., [44,45,46,47]), Italy (e.g., [11,21]), Argentina (e.g., [48]), Singapore (e.g., [13,49]), China (e.g., [50]), Bulgaria (e.g., [51]), and Poland (e.g., [52]), among others.
In this context, the AMS has been adapted and validated in different areas of knowledge, namely, business (e.g., [28,29,33]), psychology (e.g., [26]), physical education (e.g., [40,52]), dentistry (e.g., [53]), human anatomy and physiology (e.g., [30,31,54]), physics and nutrition (e.g., [31]), tourism and recreation (e.g., [52]), chemistry (e.g., [32]), biology (e.g., [46]), mathematics (e.g., [13,51]), among others. This variety of studies provides an indication that the AMS is a motivarion tool that can be adapted to the different field of knowledge.
Note that in most studies on academic motivation are focused on college students and, moreover, they do not focus on a specific area of knowledge. In the literature, there are studies that use samples of students who attend elementary and high school, but in the same line as the previous ones, they only assess students’ motivation to attend school and do not assess students’ motivation for a specific academic subject.
Studies evaluating academic motivation for a specific area of knowledge are scarce. Table 1 presents the main studies on the application of AMS in elementary and secondary school by subject area:
Table 1. Main studies on the application of AMS in elementary and secondary school by subject area.
In Portugal, there have been some studies on the academic students’ motivation [55,56,57,58,59,60,61]. In these studies different levels of education are examined. Most of them use samples that include higher education students [57,58,59,61], however Lemos and Veríssimo [56] is focused on students attending elementary school, and Ferreira et al. [55] and Imaginario et al. [57] are focused on students attending high school.
Note that the focus of these studies is on the assessment of students’ motivation in different ways. Lemos and Veríssimo [56] evaluate Intrinsic Motivation (IM) and Extrinsic Motivation (EM), as two independent ways of motivation or, alternatively, as two opposite extremes of a continuum varying between the poor (extrinsic) and good (intrinsic) forms of motivation. Other authors analyze the psychometric properties of the AMS, which may be supported on the hypothesis of the Rating Scale Model (RSM) [59] or based on the Self-Determination Theory [57,58,61]. Additionally, Ferreira et al. [55] developed a version of the instrument adapted from the “The Psychological Sense of School Membership (PSSM) Scale” and Gomes et al. [60] explored the psychometric properties of a Portuguese version of Academic Self-Regulation Questionnaire (SRQ-A) in the domain of mathematics with elementary school children.
Thus, in Portuguese literature, in principle, there is only one study in which a subject is considered. In Silva et al. [58], based on the Self-Determination Theory, on accounting and marketing college undergraduates, AMS has been adapted and validated.
In summary, in Portugal, preoccupation with academic motivation has been present in the educational policymakers minds, mainly with regard to basic and secondary education and, particularly, in the mathematics subject. Because of this lack in Portuguese literature on the assessment of mathematics motivation of the students who attend the third cycle of basic education, this study improves the existing literature, since the purpose is to build a new tool that can be used to measure student’s motivation in mathematics.

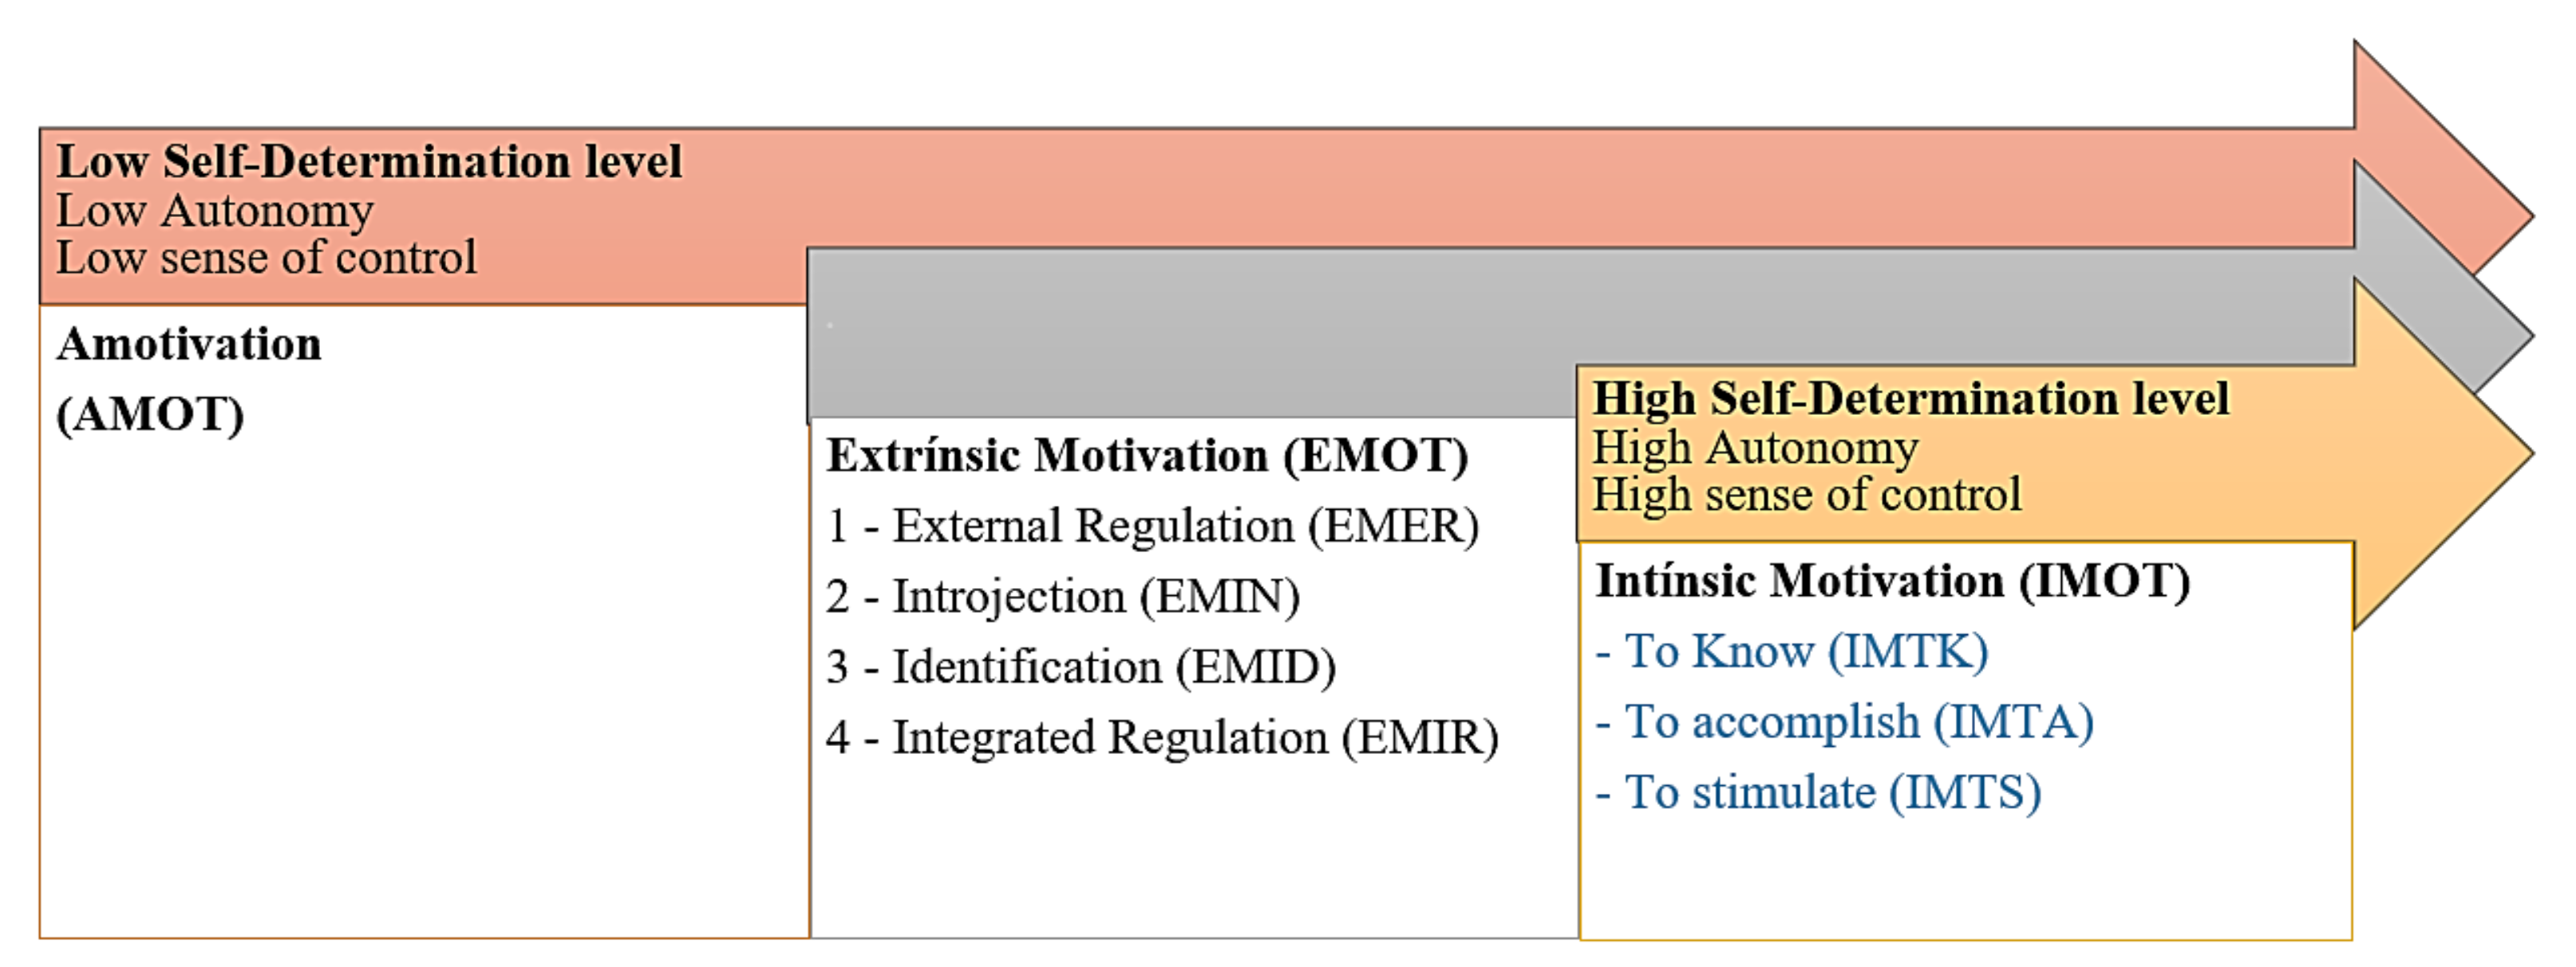
2.1. Brief Overview of Self-Determination Theory (SDT)

Self-Determination Theory (SDT) was developed in 1981 by Richard M. Ryan and Edward L. Deci, and it is described as an empirically based theory of human motivation, development, and wellness. The authors observed the individual’s motivation and personality, focusing on innate psychological needs and the impact of social factors on motivation, affection, behavior, and well-being. SDT has been extensively tested and implemented in several areas of knowledge, namely education, sports, parenting, health, and well-being [62].
According to SDT, motivation is the force that moves the person to interact in a certain environment. Thus, in an educational context, the authors claim that students develop their skills better when they experience pleasure and personal satisfaction resulting from their choices [62,63,64,65]. It considers that motivation is a multidimensional concept, whereby different forms of motivation based on distinct reasons and purposes are distinguished and which give rise to an action. This can be expressed by a continuum of increasing self-determination with three key positions (see Figure 1). These positions express the degree of autonomy on which behaviors are based: Amotivation (AMOT), Extrinsic Motivation (EMOT), and Intrinsic Motivation (IMOT) [34,62,64,65,66].
Figure 1. Self-determination continuum (adapted from Deci and Ryan [67] and Vallerand et al. [34]).
Amotivation (AMOT) is positioned on the left end of the self-determination continuum and it is characterized by the individual’s lack of will or motivation (intrinsic or extrinsic) to get involved in a certain assignment. It alludes to the condition in which the individual typically has no desire to pursue an assignment due to their feelings of incompetence and/or incapability of valuing the assignment or its consequences. It is often associated with decisions related to the abandonment of the activity [62,68].
Extrinsic Motivation (EMOT) lies in the midpoint of the self-determination continuum and it is characterized by the individual’s desire to engage in an activity for a separable outcome, therefore, the pursued goal is the main driving force of behavior [63,64,65,67]. In this context, Deci et al. [63] and Ryan and Deci [64] exemplify that a student who does his homework just because he fears his parents’ sanctions is extrinsically motivated, since he is doing the homework with the aim of achieving the separable outcome of avoiding sanctions. Similarly, a student who does the activity because he personally believes it is valuable for his chosen career is also extrinsically motivated, since he too does it for its instrumental value rather than because he considers it interesting. The authors point out that both cases have a purpose; however, in the latter case, it involves personal endorsement and a sense of choice, while the first one involves mere compliance with external control. Both represent intentional behavior, but the two types of extrinsic motivation vary in their relative autonomy [63,64].
In this sense, SDT proposes that Extrinsic Motivation can vary considerably in the degree of autonomy and establishes that extrinsic motivation is divided into four subtypes of progressive levels of self-determination: External Regulation (EMER), Introjected Regulation (EMIN), Identified Regulation (EMID), and Integrated Regulation (EMIR) [63,64]. External regulation (EMER) refers to behaviors that are imposed by others and are conducted to avoid punishments or to gain rewards. This is the less autonomous type of motivation and is regulated by external conditionals, namely, encouragements provided by teachers and/or peers throughout the teaching–learning process. Introjected Regulation (EMIN) occurs when individuals interiorize the motives for their behaviors and enforce their own rewards or restrictions. Therefore, individuals act mainly out of obligation or pressure, rather than of their own free will, to prevent feelings of anxiousness or blame, or to gain pride or recognition, i.e., this form of behavior is not considered self-determined. For instance, students may behave because they feel under pressure from others and not from the fact that they choose or want to do it. Identified Regulation (EMID) constitutes a form of extrinsic motivation that is more self-determined than the previous ones. In this case, the individual chooses the activities for extrinsic reasons, because involvement in the activity is linked not by pleasure but by instrumental values and goals, which can be valued by the individual. In case, it is possible that there is this kind of regulation, when students identify with a given school activity and embrace it voluntarily, adjusting their conduct appropriately. So, the student does it willingly, for personal reasons, rather than external pressure. Finally, Integrated Regulation (EMIR) is the most autonomous type of extrinsic motivation. It is related to behaviors in which the individual performs the activity due to the importance it assumes in the achievement of personal goals. Although this form of regulation represents a form of self-determined behavior, it is still an extrinsically motivated behavior, because it is carried out in order to achieve personal goals and not by an inherent resource in the activity. In this context, student’s behavior, when performing a given activity, it is perceived as being personally valuable for achieving the objectives that have been established by the students themselves, in an almost autonomous way [62,63,64,65].
On the far right-hand end of the self-determination continuum is Intrinsic Motivation (IMOT). Intrinsic Motivation is a prototype of self-determined activity. It is referring to an innate desire to perform an activity that yields feelings of satisfaction and accomplishment to the individual. For instance, the child who reads a book for the inherent pleasure of doing so is intrinsically motivated for that activity. Although Intrinsic Motivation has a relationship with integrated regulation, as both are forms of autonomous regulation. They are distinctive, since Intrinsic Motivation is characterized by the interest in the activity itself, while Integrated Regulation is characterized by the fact that the activity is important, in personal terms, to achieve a certain goal [63,64]. Ryan and Deci [64] point out that in schools, high-quality learning and creativity are usually the results of intrinsic motivation, thus, the facilitation of more self-determined learning requires an enabling environment.

2.2. Academic Motivation Scale (AMS)

The Academic Motivation Scale (AMS) is based on the Self-Determination Theory described in the previous section. The first version of the scale was developed by Vallerand et al. [69], in French, called Échelle de Motivation Éducation (EME) and, later on, it was translated into English giving rise to AMS [34].
AMS is an integrative theoretical approach for the multidimensional measurement of motivation within SDT [12]. It is an instrument to measure academic motivation and comprises 28 items distributed in seven subscales that answer to the dimensions established in SDT. Note that, Ryan and Deci [64], Ryan and Deci [65] established Intrinsic Motivation (IMOT) as a global construct, while Vallerand et al. [34] further categorized this dimension into three unordered subtypes: Intrinsic Motivation To Know (IMTK), Intrinsic Motivation To Accomplish (IMTA), and Intrinsic Motivation To Stimulate (IMTS) (see Figure 1). Intrinsic Motivation To Know (IMTK) refers to behaviors in which the activity is carried out for the pleasure of learning, exploring, or trying to comprehend something new. Intrinsic Motivation To Accomplish (IMTA) occurs when the individual gets involved in carrying out the activity because he feels pleasure and satisfaction when one attempts to accomplish or create something. Lastly, Intrinsic Motivation To Stimulate (IMTS) measures the desire to be involved in an activity, that is both challenging and stimulating [34].
Therefore, the 28 items of the scale are distributed over the different main dimensions as follows: 4 for AMOT, 12 for EMOT, and 12 for IMOT. Each item is measured on a seven-point scale, with answer choices varying from “Does not correspond to all” to “Corresponds exactly”. A common question to all items is: “Why do you go to college?” [34]. The subtype dimension—Integrated Regulation (EMIR)—is excluded from the AMS, since, according to the literature, it appears later in adult life [48].
It is assumed that the answers to the AMS must follow a simplex pattern: stronger positive correlations are expected between adjacent scales, as compared to subscales that are farther apart in the self-determination continuum. On the other hand, the strongest negative correlation is expected between the Amotivation subscales and the three types of Intrinsic Motivation [25,34,35,45].
As previously mentioned, the psychometric properties of the AMS have been extensively examined in several countries in which this scale was developed (e.g., [11,12,13,25,26,29,35,36,48,50]). Empirical investigations of several researchers found some deviations from the simplex pattern of the AMS assumed by Vallerant et al. [35], (e.g., [25,26,28]). These authors claim that the largest negative correlation is between Amotivation and Identified Regulation, and not between Amotivation and the three Intrinsic Motivation subscales; stronger positive correlations between each of the Intrinsic Motivation subscales and Introjected Regulation than with Identified Regulation, and a stronger positive correlation between Intrinsic Motivation to accomplish and Introjected Regulation than between the latter and Identified Regulation. These results lead these authors to indicate that the Intrinsic and Extrinsic Motivation measured in AMS may not be as distinct as defined by the SDT [29].

3. Materials and Methods

3.1. Methodology

The study was conducted in three stages: (1) translation of AMS English version into Portuguese version and its adaptation to mathematics subject—Mathematics Academic Motivation Scale (MATAMS); (2) conducting a pilot survey using the adapted MATAMS to evaluate the quality of the items that had been modified; (3) implementation of MATAMS to Portuguese students attending mathematics in basic education. After the analysis of the information obtained through the application of the questionnaires and following the literature, the internal consistency and reliability of the items and factors of the AMS scale adapted for mathematics through MATAMS was verified using Cronbach’s alpha, Average Variance Extracted, Composite Reliability, and the respective Exploratory Factor Analyses (EFA). Subsequently, in order to confirm the multifactorial nature of the scale and not underestimate the way in which items spontaneously group together, Confirmatory Factorial Analysis (CFA) is performed. These procedures are commonly used in the literature to validate measurement instruments of this type (for instance, [12,13,21,40,58]). Details of each stage will be presented in the following subsections.

3.1.1. Adaptation of AMS to MATAMS

MATAMS was designed to evaluate the mathematics motivation of Portuguese students. In this investigations, an English version of the AMS [35] was used. MATAMS is an instrument composed of 28 items with seven response options: (1) “Does not correspond in total”; (2–3) “Corresponds a bit”; (4) “Corresponds moderately”; (5–6) “Corresponds a lot”; (7) “Corresponds in total”. The items are divided into seven dimensions: Intrinsic Motivation to Accomplish (IMTA: e.g., “For the pleasure I experience while surpassing myself in mathematics”, “For the satisfaction I feel when I am in the process of accomplishing difficult academic activities related to mathematics”), Intrinsic Motivation to Stimulate (IMTS: e.g., “For the intense feelings I experience when I am communicating my own ideas about mathematics to others”, “For the pleasure that I experience when I learn how things work due to the agency of mathematics”), Intrinsic Motivation to Know (IMTK: e.g., “For the intense feelings I experience when I am communicating my own ideas about mathematics to others”, “For the pleasure that I experience when I learn how things work due to the agency of mathematics”), Amotivation (AMOT: e.g., “Honestly, I don’t know; I really feel that I am wasting my time studying mathematics”, “I can’t see why I study mathematics and frankly, I couldn’t care less”), Extrinsic Motivation External Regulation (EMER: e.g., “Because only with a good grade in mathematics, will I find a high paying job later on”, “In order to be able to get a job later on”), Extrinsic Motivation Introjection (EMIN: e.g., “Because of the fact that when I succeed in everything that is related to mathematics I feel important”, “To prove the others (teachers, relatives, friends) that I can be good at mathematics”), and Extrinsic Motivation Identification (EMID: e.g., “Because I think that mathematics will help me better prepare for the career I have chosen”, “Because studying mathematics will prove useful for me later on”).
The modified AMS-MATAMS has been used with students studying mathematics is shown in Table 2.
Table 2. Original and adapted items of the Academic Motivation Scale.

3.1.2. Pilot Study Using ALIPT

The Mathematics Academic Motivation Scale is implemented in a series of questionnaires to examine if AMS items’ original intention had been maintained. The students understood the statements that had been translated. This pilot study intended to ensure that the MATAMS did not require any adjustment, improvement, or revision to make it more feasible. This procedure is fundamental in assessing the validity of the adapted instrument, ensuring the necessary readability and consistency [70].
In the pilot study, MATAMS was applied to 100 students, guaranteeing its validity and reliability. Before its application, the questionnaire was read aloud, and students were encouraged to express their doubts, both on the interpretation of the questions and on the interpretation of the Likert scale, as well its classification. The sentences were explained and doubts clarified; since the doubts were only related to some linguistic aspects, it was considered not necessary to make any changes. However, the completion of the questionnaire was accompanied by a brief conversation with the students in order to try to get to the bottom of their doubts. The feedback on this conversation showed that the doubts had only been momentary and immediately cleared up.
The pilot sample consists of 100 students attending mathematics in the 7th, 8th, or 9th grade of basic education at the Lixa School Grouping, Felgueiras (Felgueiras is a town in the district of Porto, north region of Portugal.). Their ages vary between 13 and 17 years, with an average age of 13.92 years, and about 39% are male and about 61% are female.

3.2. Data

MATAMS was applied through an online questionnaire to students who attended the third cycle of basic education, in the academic year 2019/2020. Participants in the study completed the questionnaire during the maths classes, so its application was supervised by the teacher. They were informed that the goal of the instrument is to identify the reasons why they study mathematics. Sufficient time was provided for all students to complete each questionnaire.
Because these students are minors, in order to fill out the questionnaires, firstly, the parents’ authorization was requested. The questionnaire was filled in anonymously and students participated voluntarily.
A total of 351 questionnaires were collected, however, 2 of them were excluded because they were not completed or because they contained more than one answer to a question, for these reasons 349 questionnaires were validated.
The sample contains 349 students attending Mathematics in the 7th, 8th, or 9th grade of basic education. Their ages vary between 12 and 17 years, with an average age of 13.42 years, and about 50.4% are male and about 49.6% are female. Note that, the 349 students represent the entire population of students in the third cycle of basic education of a School Grouping in the municipality of Felgueiras.

4. Results

In line with the literature, in this study Exploratory Factor Analysis (EFA) and Confirmatory Factor Analysis (CFA) are simultaneously performed, in order to guarantee that all items of the MATAMS are grouped adequately by double-check analysis. If the EFA results indicate that each item is appropriately grouped and is corroborated by CFA results, showing a fit model, then it is safe to conclude that the items in the cluster can precisely measure the intended construct [71].
In order to ascertain the available sample, using IBM SPSS 27 software, a descriptive analysis of the data was done. The internal consistency and reliability of the AMS items and factors [72] adapted for mathematics students (resulting in the MATAMS) were also verified by means of the Cronbach’s Alpha and its corresponding EFA.
EFA aims to simplify the database obtained by evaluating how much each factor is associated with each variable, as well analyzing how much the set of factors explains the variability of the results obtained in that sample, through the sum of the variances of the original variables [73].
After performing the EFA, the scale’s multifactorial nature should be confirmed and it should be shown that it does not underestimate the way items are spontaneously grouped. For this, using the Amos 27 software, CFA was carried out. The CFA includes a set of techniques that measure the dimensionality of a scale [58,71], and it allows us to test the hypothesis relatively with a number of factors, evaluating the reliability of the indicators that represent this scale [74]. A minimum of five questionnaires per item is often recommended to perform the factor analysis [75]. According to the CFA, if an item has a high load indicates that the factor and the corresponding item have a lot in common; loads under 0.32 are considered to be very weak, loads between 0.32 and 0.45 weak and between 0.45 and 0.63 good, and loads over 0.71 very good [76].

4.1. Exploratory Factor Analysis (EFA)

In Portugal, studies on the AMS structural model applied in mathematics students are very scarce. As previously mentioned, the original version of the scale—AMS—was adapted, resulting in the MATAMS, which was applied to Portuguese students who study mathematics in basic education.
To verify if the factor model of MATAMS is in line with the literature, firstly, an EAF was performed. Factors and their respective oblique rotation were extracted by means of the Main Components Method (MCP) and only factors whose values are ≥1 were considered. Results indicate a K M O = 0.967 , meaning that the sample is sufficient to conduct an analysis and a seven-factor correlation matrix which accounts for 69.19% of the variance. Other extractions with a higher number of factors were simulated, maintaining the same extraction criterion: ≥1. Factor distribution and variance percentage values were in line with other studies. In this way, using seven factors, it was possible to verify that the exploratory factor model produced a structural model identical to the AMS one. Table 2 presents the exploratory factor matrix regarding the 28 adapted items of MATAMS and their respective factor load, showing how variables are distributed into the 7 EFA ensuing factors.
To estimate the model’s convergent validity and reliability, the Average Variance Extracted (AVE), the Composite Reliability (CR), and the Cronbach’s Alpha ( α ) were analyzed, using only measurement items whose factor loads ( A V E > 0.5 ; C R > 0.7 ; α > 0.7 ) were well within suitable statistical parameters [77]. In this respect, the measures used in this study are sufficiently valid and reliable (Table 3). The sample obtained meets the structural equation analysis [78].
Table 3. Exploratory Factor Analysis of the MATAMS sample regarding Portuguese students.

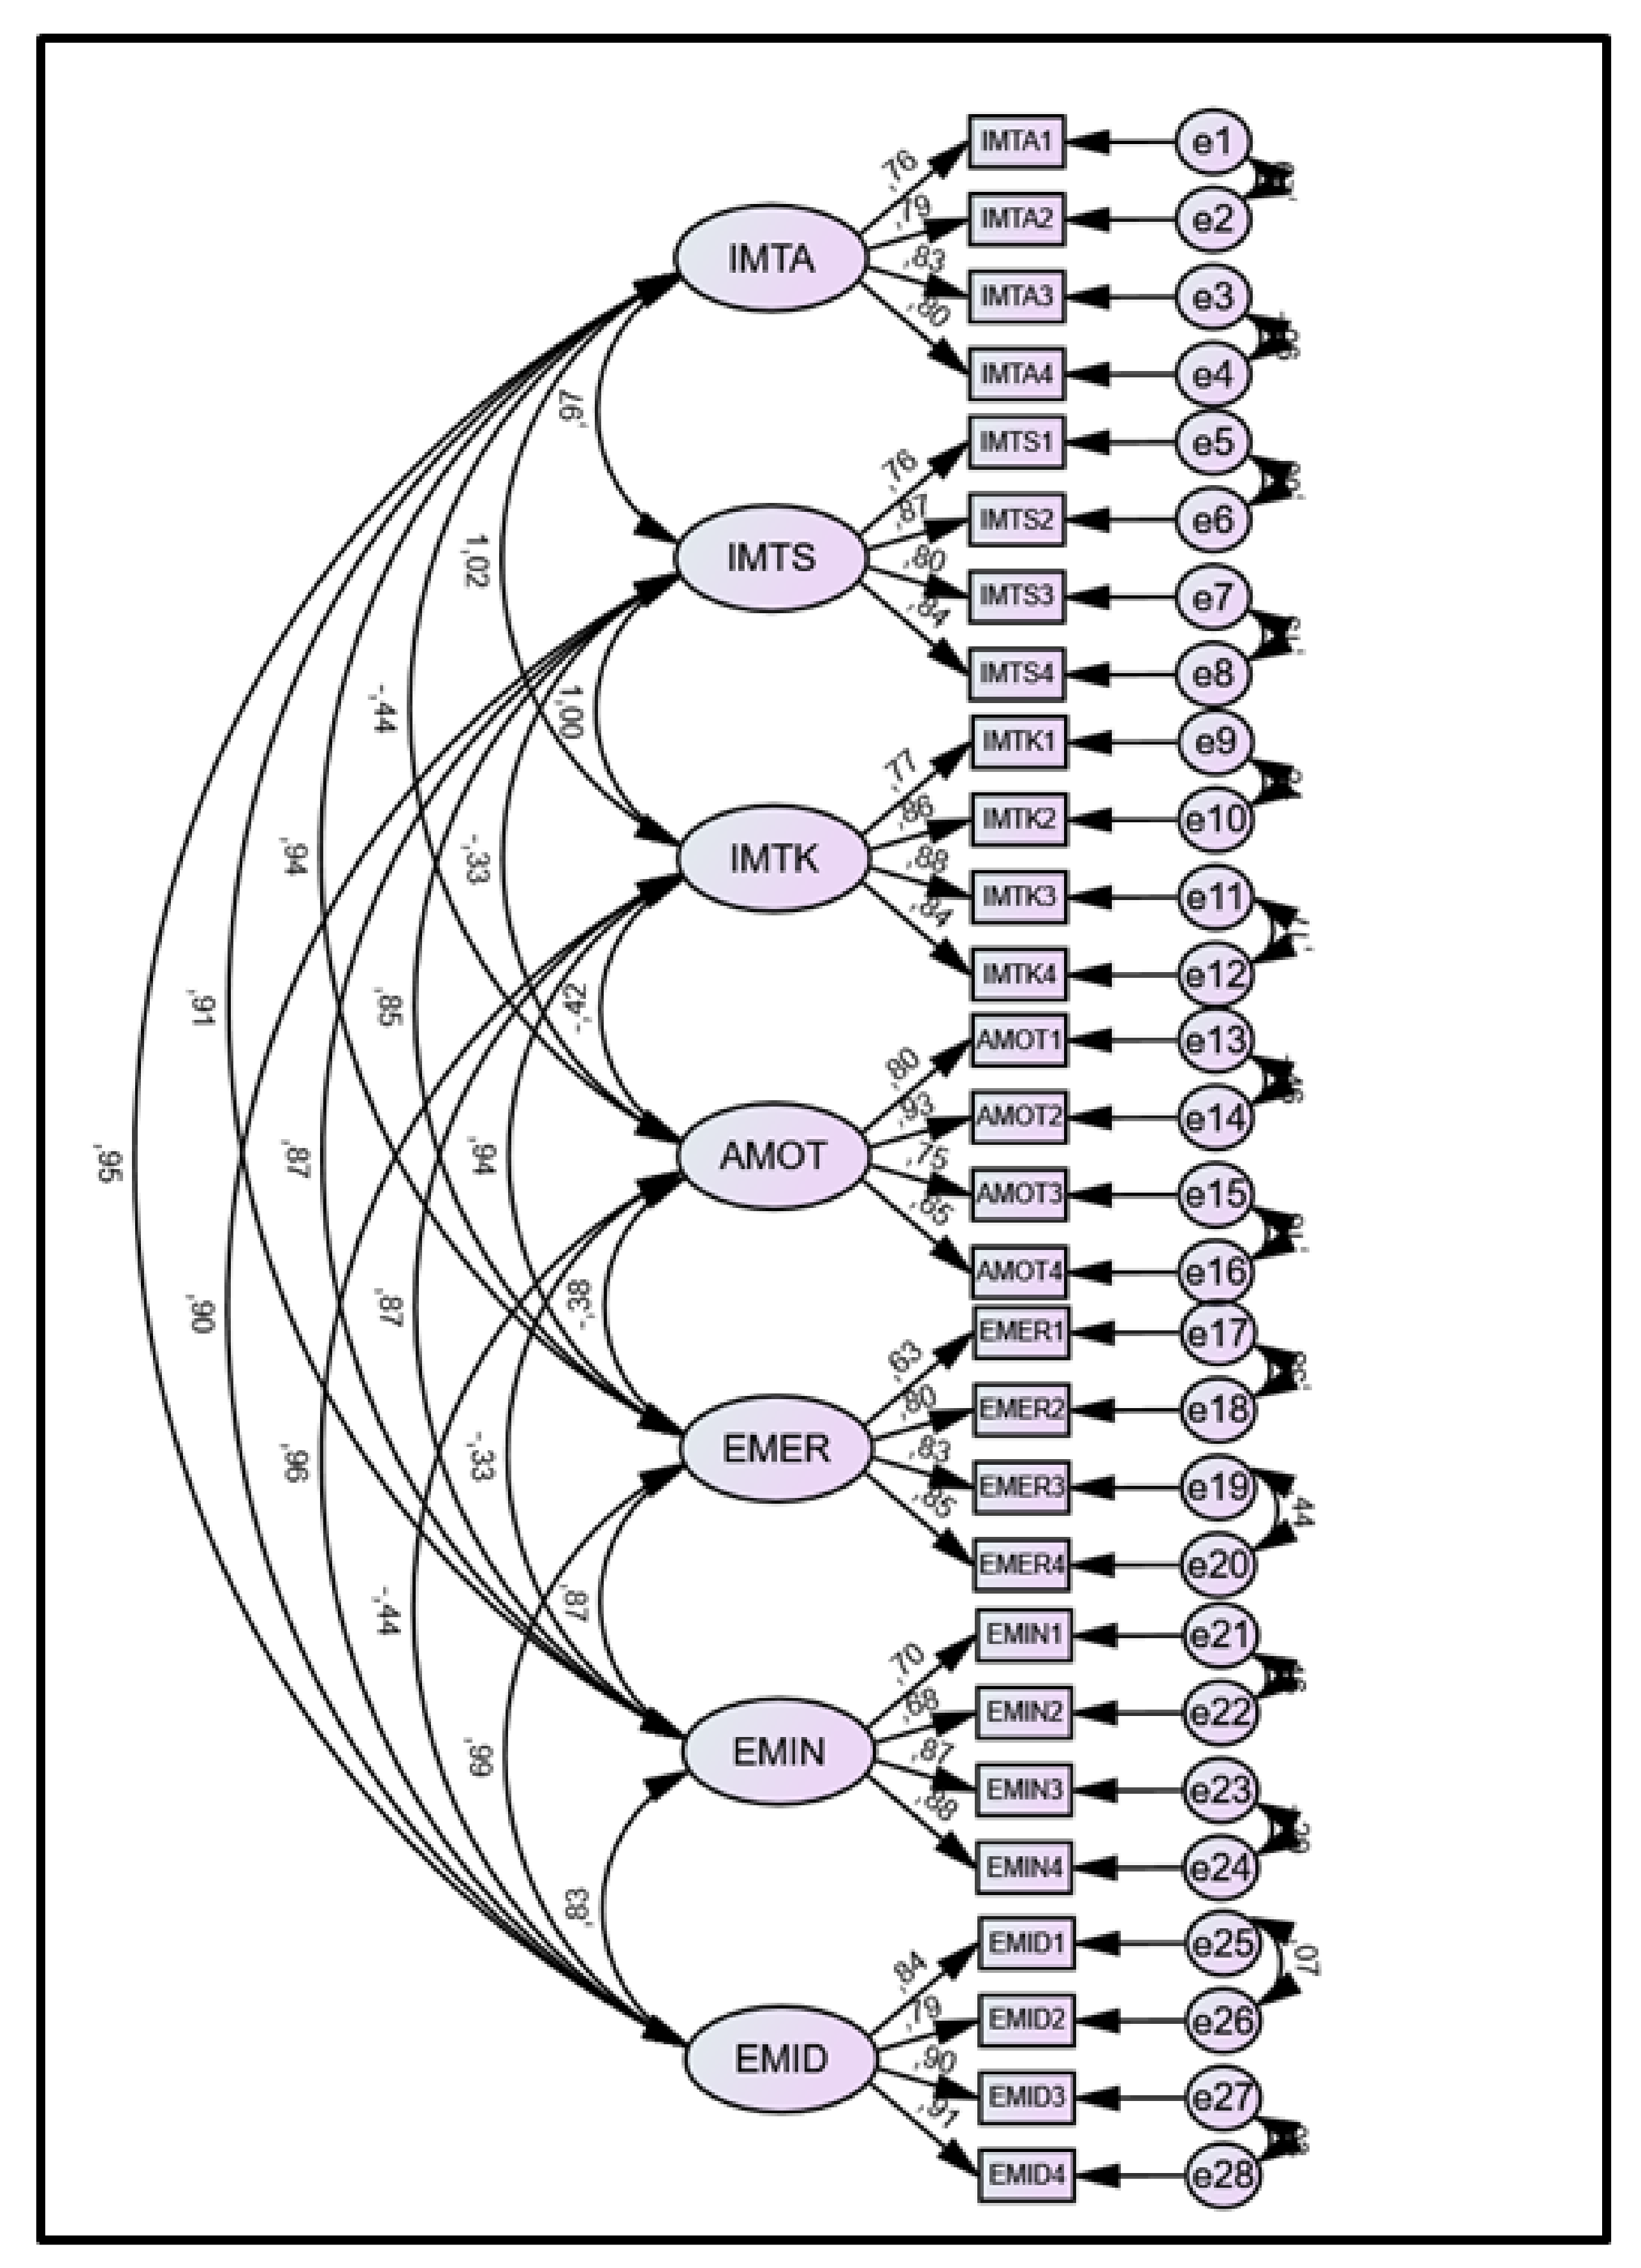
4.2. Confirmatory Factor Analysis (CFA)

In order to confirm the structure of the EFA, a Confirmatory Factor Analysis was performed. CFA allows checking how well the data fits into a particular theoretical model.
Therefore, in CFA the choice of the best factor model is essential. The factorial loads obtained and errors that were observed, statistically validate and prove his suitability for the study in question [75,76,77].
In order to do the CFA, a final model was tested including all items of the scale. Concerning factor loading, we obtain all factors with loading upper than 0.5. Because of that, we cannot remove any scale variable to have a very good model adjustment with statistical robustness.
The χ 2 / d f ratio was included as an absolute fitness index with reasonable chi-square score corrected for degrees of freedom defined as less than five. The Comparative Index of Fitness (CFI) was also included in the analysis and values greater than 0.90 are considered to be a good fit. Finally, the approximate square error of approximation (RMSEA) was examined. Values below 0.05 indicate a good fit, and values that are above 0.08 indicate reasonable approximation errors.
As such, the final model has good statistical results ( χ 2 = 838.183 , p = 0.001 , d f = 315 , χ 2 / d f = 2.661 , R M S E A = 0.069 , S R M R = 0.0525 , N F I = 0.910 , G F I = 0.908 , A G F I = 0.982 , and C F I = 0.941 ).
As far as item and factor reliability is concerned, a good total internal consistency was found ( α = 0.947 ) for the sample constituted by 349 students attending mathematics. Considering that the 7-factor structural model that was adopted, the internal consistency of the items was as follows: IMTA ( α = 0.880 ); IMTS ( α = 0.893 ); IMTK ( α = 0.911 ); AMOT ( α = 0.857 ), EMER ( α = 0.880 ); EMIN ( α = 0.863 ), and EMID ( α = 0.920 ).
In terms of the final measurement model (Model 2), Figure 2 presents the standard path coefficients, showing that they were all significant ( p < 0.001 ).
Figure 2. MATAMS final measurement model. Source: Created by the authors.
Four variables of each dimension of the motivation indicated strong correlation and prediction to the respective latent variable. The four items have their correlations with the respective latent variable ranging from 0.63 and 0.93.
Furthermore, the relationship between the sub-dimensions of Intrinsic Motivation and Amotivation showed a negatively correlation and, in the same way, the sub-dimensions of Extrinsic Motivation and Amotivation showed a negative relationship between them. There was positive relationship between the sub-dimensions of Intrinsic Motivation and the sub-dimensions of Extrinsic Motivation. The correlations between subscales indicate a pattern that corresponds to the SDT, since the adjacent subscales have stronger positive correlations, and the more distant ones either do not establish a significant correlation or the correlation is negative.

4.3. Explanation of the Validated Scale

The validated scale allows future researchers to use it again in another context of mathematics teaching and learning. It can be applied to any level of education as the statistically tested factors were relevant and statistically valid. Each dimension of the scale consisted of four questions that were assessed and answered by the respondents. After obtaining a sample of responses given by our study participants (students) capable of being assumed robust in statistical tests, we used SPSS 27 and AMOS 27 software to analyze the robustness of the items. To this end, we analyzed each question and its respective factorial weight (Exploratory Factorial Analysis). The literature tells us that a question with a factorial weight above 0.5 (corresponding to an explanation of more than 50% of the reality studied) is considered relevant to explain the reality inherent to what the question intends to understand. Therefore, after all the tests, we kept in the scale, the questions that assumed robustness above 0.5. Afterward, we performed other statistical tests (AVE and CR) that confirmed the scale’s quality and the possibility of using it to measure students’ motivation to study mathematics. If the scale items did not show the necessary robustness, they would have to be removed, leaving only the relevant ones in the scale. Our analysis showed that the scale works fully when we are assessing students’ motivation to study mathematics. This will allow it to be used again in the future.

5. Discussion of Results

The current study is based on the SDT construct of motivation and the purpose is to provide and examine the validity of the Portuguese version of the 7-factor model of the AMS applied to the subject of mathematics.
The assessment was performed by comparing the grouping of the 28-item MATAMS using CFA and EFA. Additionally, the findings were supported by the internal consistency result. Compared to existing studies in the literature on the original AMS, the results of this study, based on MATAMS, are in accordance with the proposed simplex pattern. For instance, between the Intrinsic Motivation scales, the correlation is very strong, with a minimum value of the correlation coefficient of 0.97 and with correlations higher than those between Intrinsic Motivation types and Extrinsic Motivation types. The three types of intrinsic motivation subscales have negative correlations with Amotivation and range between 0.44 and 0.33 , and the same is true between Extrinsic Motivation subscales and Amotivation. These results are in line with the original version of [21,36,38,69].
Thus, CFA supported the 7-factor and 28-item structure of the Portuguese version of the AMS, adapted to mathematics subject. The 7-factor correlated yielded good fit values and all factor loadings were statistically significant, as in [12,26,34,41,69]. Cronbach’s α was used to estimate reliability and the findings from this study revealed that their values were high for the AMS, as well as for all the subscales, as in [13,25,26,34,44].
Summarizing, a 7-factor structure representing the correlations among the AMS items was supported and adequate internal consistency estimates of the scores for each of the seven subscales were found. Thus, based on the results presented, this study on MATAMS, proposes a tool to be considered for measuring mathematical motivation as a multifaceted construct, which is based on the theory of self-determination, at the third cycle of basic education level.

6. Conclusions

The literature of the different areas of knowledge has assessed the factors that influence students’ achievement and provided evidence that student achievement depends on a whole range of factors that can be grouped into three categories: family characteristics, school characteristics, and the student himself. The students’ characteristics and their families are the main factors influencing student achievement gains, as expected.
Additionally, the literature has demonstrated the predictive importance of numerous students’ unobservable characteristics, namely, motivational. The literature claims that lack of academic motivation has been highlighted as a key determinant of negative academic performance.
Exploring the impact of motivation on students’ achievement in mathematics is a key issue since it is a predictor of the level of efficiency and success in the discipline of maths.
This study aimed to use and adapt the AMS, widely used in various areas of knowledge, into the Mathematics Academic Motivation Scale (MATAMS). To this goal, we conducted a study that aimed to assess students’ motivation in the third cycle of basic education. The application of the scale to 349 students who agreed to participate, allowing us to verify that the AMS can be used in mathematics. It allows, according to Self-Determination Theory, analyzing the different states of motivation, such as Amotivation (AMOT), Entrinsic Motivation (EMOT), and Intrinsic Motivation (IMOT) of students studying this specific and important area of knowledge.
The scale used is composed of three dimensions that are subdivided into seven constructs that allow the assessment of motivation along the Self-Determination Continuum belonging to the Self-Determination Theory (SDT). In order to analyze the scale’s capacity, two more robust statistical tests were performed. An Exploratory Factorial Analysis to check the behavior of the scale and the respective organization of the constructs in general and the respective variables, in particular, was performed. In this analysis, the scale behaved according to the original, subdividing its factors (all with loadings above 0.5) into seven constructs.
The CFA carried out by estimating a structural model allowed us to assess a good model fit, with statistical results of validity and reliability that clarify the measurement strength that this scale presents when applied to mathematics. It should also be noted that no variable of the scale proved to be statistically insignificant or outside its original measurement dimension. In this sense, the scale adapted to mathematics worked perfectly, keeping its 28 items divided into three main constructs, which are Amotivation (AMOT) with only one dimension, Extrinsic Motivation, which is divided into three subdimensions (EMER, EMIN, and EMID), and finally Intrinsic Motivation which is also divided into three subdimensions (IMTA, IMTS, and IMTK).
These results present an interesting contribution to the literature, as a valid and reliable scale will be published to be applied again to mathematics in future research. This will allow other researchers to use the scale in other national and international sociocultural contexts that allow studies capable of measuring students’ motivation to study the mathematics subject.
The analysis of the motivation in different educational grades will also allow important comparisons to be made related to the motivational state of students.
Motivation may explain why some students perform better than their peers in school despite being exposed to similar instruction. If the student motivation mechanism is understood, it will reduce the number of academic failures and the rate of dropping out of school. If students’ motivational directions are understood, it would help to inform the methods of teaching to be employed. It could help educators and policymakers to provide driving measures to increase academic success among students.

Author Contributions

Conceptualization, S.P.S.; Data curation, R.S.; Formal analysis, R.S.; Investigation, S.P.S.; Methodology, S.P.S.; Software, R.S.; Supervision, S.P.S.; Validation, R.S.; Writing—review and editing, S.P.S. All authors have read and agreed to the published version of the manuscript.

Funding

This research received no external funding.

Institutional Review Board Statement

Voluntary participation, informed consent, and anonymity of the participants were ensured in the research process. The study did not involve studying children under the age of 17 without parental consent.

Data Availability Statement

Not applicable.

Conflicts of Interest

The authors declare no conflict of interest.

References

  1. Hanushek, E.A.; Woessmann, L. The economics of international differences in educational achievement. In Handbook of the Economics of Education; Elsevier: Amsterdam, The Netherlands, 2011; Volume 3, pp. 89–200. [Google Scholar]
  2. Grosskopf, S.; Hayes, K.J.; Taylor, L.L. Applied efficiency analysis in education. Econ. Bus. Lett. 2014, 3, 19–26. [Google Scholar] [CrossRef] [Green Version]
  3. Sousa, S.P. Factors that Influence Student Achievement Gains and Performance Assessment of the Portuguese Public Schools. Ph.D. Thesis, University of Minho, Braga, Portugal, 2016. Chapter 5. pp. 121–168. [Google Scholar]
  4. Sousa, S.P. Teacher Characterístics and Student Progress. Ph.D. Thesis, University of Minho, Braga, Portugal, 2016. Chapter 6. pp. 170–196. [Google Scholar]
  5. Amrai, K.; Motlagh, S.E.; Zalani, H.A.; Parhon, H. The relationship between academic motivation and academic achievement students. Procedia-Soc. Behav. Sci. 2011, 15, 399–402. [Google Scholar] [CrossRef] [Green Version]
  6. Scheerens, J. The use of theory in school effectiveness research revisited. Sch. Eff. Sch. Improv. 2013, 24, 1–38. [Google Scholar] [CrossRef]
  7. Reynolds, D.; Sammons, P.; De Fraine, B.; Van Damme, J.; Townsend, T.; Teddlie, C.; Stringfield, S. Educational effectiveness research (EER): A state-of-the-art review. Sch. Eff. Sch. Improv. 2014, 25, 197–230. [Google Scholar] [CrossRef] [Green Version]
  8. Güvendir, M.A. Students’ extrinsic and intrinsic motivation level and its relationship with their mathematics achievement. Int. J. Math. Teach. Learn. 2016, 17, 1–21. [Google Scholar]
  9. Gupta, P.; Mili, R. Impact of academic motivation on academic achievement: A study on high schools students. Eur. J. Educ. Stud. 2017, 2, 10. [Google Scholar]
  10. Pintrich, P.R. A motivational science perspective on the role of student motivation in learning and teaching contexts. J. Educ. Psychol. 2003, 95, 667. [Google Scholar] [CrossRef] [Green Version]
  11. Alivernini, F.; Lucidi, F. Relationship between social context, self-efficacy, motivation, academic achievement, and intention to drop out of high school: A longitudinal study. J. Educ. Res. 2011, 104, 241–252. [Google Scholar] [CrossRef]
  12. Barkoukis, V.; Tsorbatzoudis, H.; Grouios, G.; Sideridis, G. The assessment of intrinsic and extrinsic motivation and amotivation: Validity and reliability of the Greek version of the Academic Motivation Scale. Assess. Educ. Princ. Policy Pract. 2008, 15, 39–55. [Google Scholar] [CrossRef]
  13. Lim, S.Y.; Chapman, E. Adapting the academic motivation scale for use in pre-tertiary mathematics classrooms. Math. Educ. Res. J. 2015, 27, 331–357. [Google Scholar] [CrossRef]
  14. Hannula, M.S.; Di Martino, P.; Pantziara, M.; Zhang, Q.; Morselli, F.; Heyd-Metzuyanim, E.; Lutovac, S.; Kaasila, R.; Middleton, J.A.; Jansen, A.; et al. Attitudes, Beliefs, Motivation and Identity in Mathematics Education; Springer: Cham, Switzerland, 2016; pp. 1–35. [Google Scholar]
  15. Fortier, M.S.; Vallerand, R.J.; Guay, F. Academic motivation and school performance: Toward a structural model. Contemp. Educ. Psychol. 1995, 20, 257–274. [Google Scholar] [CrossRef]
  16. Gottfried, A.E.; Marcoulides, G.A.; Gottfried, A.W.; Oliver, P.H.; Guerin, D.W. Multivariate latent change modeling of developmental decline in academic intrinsic math motivation and achievement: Childhood through adolescence. Int. J. Behav. Dev. 2007, 31, 317–327. [Google Scholar] [CrossRef]
  17. Özen, S.O. The effect of motivation on student achievement. In The Factors Effecting Student Achievement; Springer: Berlin/Heidelberg, Germany, 2017; pp. 35–56. [Google Scholar]
  18. Sivrikaya, A.H. The Relationship between Academic Motivation and Academic Achievement of the Students. Asian J. Educ. Train. 2019, 5, 309–315. [Google Scholar] [CrossRef]
  19. Tus, J. Academic Stress, Academic Motivation, and Its Relationship on the Academic Performance of the Senior High School Students. Asian J. Multidiscip. Stud. 2020, 8. [Google Scholar] [CrossRef]
  20. Stage, F.K. Motivation, academic and social integration, and the early dropout. Am. Educ. Res. J. 1989, 26, 385–402. [Google Scholar] [CrossRef]
  21. Alivernini, F.; Lucidi, F. The Academic Motivation Scale (AMS): Factorial structure, invariance and validity in the Italian context. Test. Psychom. Methodol. Appl. Psychol. 2008, 15, 211–220. [Google Scholar]
  22. Rump, M.; Esdar, W.; Wild, E. Individual differences in the effects of academic motivation on higher education students’ intention to drop out. Eur. J. High. Educ. 2017, 7, 341–355. [Google Scholar] [CrossRef]
  23. Rajiah, K.; Coumaravelou, S.; Ying, O.W. Relationship of test anxiety, psychological distress and academic motivation among first year undergraduate pharmacy students. Int. J. Appl. Psychol. 2014, 4, 68–72. [Google Scholar]
  24. Elmelid, A.; Stickley, A.; Lindblad, F.; Schwab-Stone, M.; Henrich, C.C.; Ruchkin, V. Depressive symptoms, anxiety and academic motivation in youth: Do schools and families make a difference? J. Adolesc. 2015, 45, 174–182. [Google Scholar] [CrossRef] [Green Version]
  25. Fairchild, A.J.; Horst, S.J.; Finney, S.J.; Barron, K.E. Evaluating existing and new validity evidence for the Academic Motivation Scale. Contemp. Educ. Psychol. 2005, 30, 331–358. [Google Scholar] [CrossRef]
  26. Cokley, K.O.; Bernard, N.; Cunningham, D.; Motoike, J. A psychometric investigation of the academic motivation scale using a United States sample. Meas. Eval. Couns. Dev. 2001, 34, 109–119. [Google Scholar] [CrossRef]
  27. Cokley, K. A confirmatory factor analysis of the Academic Motivation Scale with black college students. Meas. Eval. Couns. Dev. 2015, 48, 124–139. [Google Scholar] [CrossRef]
  28. Smith, K.J.; Davy, J.A.; Rosenberg, D.L. An examination of the validity of the Academic Motivation Scale with a United States business student sample. Psychol. Rep. 2010, 106, 323–341. [Google Scholar] [CrossRef]
  29. Smith, K.J.; Davy, J.A.; Rosenberg, D.L. An empirical analysis of an alternative configuration of the Academic Motivation Scale. Assess. Educ. Princ. Policy Pract. 2012, 19, 231–250. [Google Scholar] [CrossRef]
  30. Maurer, T.; Allen, D.; Gatch, D.B.; Shankar, P.; Sturges, D. Students’ academic motivations in allied health classes. Internet J. Allied Health Sci. Pract. 2012, 10, 6. [Google Scholar]
  31. Maurer, T.W.; Allen, D.; Gatch, D.B.; Shankar, P.; Sturges, D. Students’ academic motivations in three disciplines. J. Scholarsh. Teach. Learn. 2013, 13, 77. [Google Scholar]
  32. Liu, Y.; Ferrell, B.; Barbera, J.; Lewis, J.E. Development and evaluation of a chemistry-specific version of the academic motivation scale (AMS-Chemistry). Chem. Educ. Res. Pract. 2017, 18, 191–213. [Google Scholar] [CrossRef]
  33. Scifres, E.L.; Cox, M.; Crocker, R.M.; Mishra, R.; Scott, G.W. Academic motivation and the undergraduate business major. J. Educ. Bus. 2021, 1–10. [Google Scholar] [CrossRef]
  34. Vallerand, R.J.; Pelletier, L.G.; Blais, M.R.; Briere, N.M.; Senecal, C.; Vallieres, E.F. The Academic Motivation Scale: A measure of intrinsic, extrinsic, and amotivation in education. Educ. Psychol. Meas. 1992, 52, 1003–1017. [Google Scholar] [CrossRef]
  35. Vallerant, R.; Pelletier, L.G.; Blais, M.R.; Briere, N.M.; Senecal, C.; Vallieres, E.F. On the assessment of intrinsic, extrinsic, and amotivation in education: Evidence on the concurrent and construct validity of the Academic Motivation Scale. Educ. Psychol. Meas. 1993, 53, 159–172. [Google Scholar] [CrossRef]
  36. Ratelle, C.F.; Guay, F.; Vallerand, R.J.; Larose, S.; Senécal, C. Autonomous, controlled, and amotivated types of academic motivation: A person-oriented analysis. J. Educ. Psychol. 2007, 99, 734. [Google Scholar] [CrossRef] [Green Version]
  37. Areepattamannil, S.; Freeman, J.G. Academic achievement, academic self-concept, and academic motivation of immigrant adolescents in the greater Toronto area secondary schools. J. Adv. Acad. 2008, 19, 700–743. [Google Scholar] [CrossRef] [Green Version]
  38. Guay, F.; Morin, A.J.; Litalien, D.; Valois, P.; Vallerand, R.J. Application of exploratory structural equation modeling to evaluate the academic motivation scale. J. Exp. Educ. 2015, 83, 51–82. [Google Scholar] [CrossRef] [Green Version]
  39. Tóth-Király, I.; Orosz, G.; Dombi, E.; Jagodics, B.; Farkas, D.; Amoura, C. Cross-cultural comparative examination of the Academic Motivation Scale using exploratory structural equation modeling. Personal. Individ. Differ. 2017, 106, 130–135. [Google Scholar] [CrossRef] [Green Version]
  40. Ntoumanis, N. Motivational clusters in a sample of British physical education classes. Psychol. Sport Exerc. 2002, 3, 177–194. [Google Scholar] [CrossRef]
  41. Blanchard, S.; Vrignaud, P.; Lallemand, N.; Dosnon, O. Validation de léchelle de motivation en éducation aupres de lycéens francais. Orientat. Sc. Prof. 1997, 26, 33–56. [Google Scholar]
  42. Martín-Albo, J.; Núñez, J.L.; Navarro, J.G. Validation of the Spanish version of the Situational Motivation Scale (EMSI) in the educational context. Span. J. Psychol. 2009, 12, 799. [Google Scholar] [CrossRef] [Green Version]
  43. Núñez, J.L.; Martín-Albo, J.; Navarro, J.G.; Suárez, Z. Adaptación y validación de la versión española de la Escala de Motivación Educativa en estudiantes de educación secundaria postobligatoria. Estud. Psicol. 2010, 31, 89–100. [Google Scholar] [CrossRef]
  44. Karaguven, M. The Adaptation of Academic Motivation Scale to Turkish. Educ. Sci. Theory Pract. 2012, 12, 2611–2618. [Google Scholar]
  45. Can, G. Turkish version of the academic motivation scale. Psychol. Rep. 2015, 116, 388–408. [Google Scholar] [CrossRef]
  46. Aydın, S.; Yerdelen, S.; Yalmancı, S.G.; Göksu, V. Academic Motivation Scale for Learning Biology: A Scale Development Study. Educ. Sci./Egit. Bilim 2014, 39, 425–435. [Google Scholar] [CrossRef] [Green Version]
  47. Melike, F.A.I.Z.; AVCI, E.K. Academic Motivation Levels of Secondary School Students and Their Attitudes towards a Social Studies Course. Rev. Int. Geogr. Educ. Online 2020, 10, 156–185. [Google Scholar]
  48. Stover, J.B.; de la Iglesia, G.; Boubeta, A.R.; Liporace, M.F. Academic Motivation Scale: Adaptation and psychometric analyses for high school and college students. Psychol. Res. Behav. Manag. 2012, 5, 71. [Google Scholar] [CrossRef] [PubMed] [Green Version]
  49. Caleon, I.S.; Wui, M.G.L.; Tan, J.P.L.; Chiam, C.L.; Soon, T.C.; King, R.B. Cross-cultural validation of the Academic Motivation Scale: A Singapore investigation. Child Indic. Res. 2015, 8, 925–942. [Google Scholar] [CrossRef]
  50. Zhang, B.; Li, Y.M.; Li, J.; Li, Y.; Zhang, H. The revision and validation of the Academic Motivation Scale in China. J. Psychoeduc. Assess. 2016, 34, 15–27. [Google Scholar] [CrossRef]
  51. Staribratov, I.; Babakova, L. Development and Validation of a Math-specific Version of the Academic Motivation Scale (AMS-Mathematics) Among First-year University Students in Bulgaria. TEM J. 2019, 8, 317. [Google Scholar]
  52. Ardeńska, M.; Ardeńska, A.; Tomik, R. Validity and reliability of the Polish version of the Academic Motivation Scale: A measure of intrinsic and extrinsic motivation and amotivation. Health Psychol. Rep. 2019, 7, 254–266. [Google Scholar] [CrossRef]
  53. Orsini, C.; Binnie, V.; Evans, P.; Ledezma, P.; Fuentes, F.; Villegas, M.J. Psychometric validation of the academic motivation scale in a dental student sample. J. Dent. Educ. 2015, 79, 971–981. [Google Scholar] [CrossRef]
  54. Sturges, D.; Maurer, T.W.; Allen, D.; Gatch, D.B.; Shankar, P. Academic performance in human anatomy and physiology classes: A 2-yr study of academic motivation and grade expectation. Adv. Physiol. Educ. 2016, 40, 26–31. [Google Scholar] [CrossRef] [Green Version]
  55. Ferreira, M.; Cardoso, A.P.; Abrantes, J.L. Motivation and relationship of the student with the school as factors involved in the perceived learning. Procedia-Soc. Behav. Sci. 2011, 29, 1707–1714. [Google Scholar] [CrossRef] [Green Version]
  56. Lemos, M.S.; Veríssimo, L. The relationships between intrinsic motivation, extrinsic motivation, and achievement, along elementary school. Procedia-Soc. Behav. Sci. 2014, 112, 930–938. [Google Scholar] [CrossRef] [Green Version]
  57. Imaginário, S.; de Jesus, S.N.; Morais, F.; Fernandes, C.; Santos, R.; Santos, J.; Azevedo, I. Motivação para a aprendizagem escolar: Adaptação de um instrumento de avaliação para o contexto português. Rev. Lusófona Educ. 2014, 28, 28. [Google Scholar]
  58. Silva, R.; Rodrigues, R.; Leal, C. Academic Motivation Scale: Development, Application and Validation for Portuguese Accounting and Marketing Undergraduate Students. Int. J. Bus. Manag. 2018, 13, 11. [Google Scholar] [CrossRef] [Green Version]
  59. Lopes, P.; Silva, R.; Oliveira, J.; Ambrósio, I.; Ferreira, D.; Crespo, C.; Feiteira, F.; Rosa, P.J. Rasch analysis on the academic motivation scale in Portuguese university students. NeuroQuantology 2018, 16, 41–46. [Google Scholar] [CrossRef] [Green Version]
  60. Gomes, M.; Monteiro, V.; Mata, L.; Peixoto, F.; Santos, N.; Sanches, C. The Academic Self-Regulation Questionnaire: A study with Portuguese elementary school children. Psicol. Reflex. Crít. 2019, 32, 1–9. [Google Scholar] [CrossRef] [PubMed] [Green Version]
  61. Ribeiro, M.F.; Saraiva, V.; Pereira, P.; Ribeiro, C. Academic Motivation Scale: Validity in Portuguese Public Higher Education/Escala de Motivacao Academica: Validacao no Ensino Superior Publico Portugues. RAC-Rev. Adm. Contemp. 2019, 23, 288–311. [Google Scholar] [CrossRef]
  62. Deci, E.L.; Ryan, R.M. Self-determination theory: A macrotheory of human motivation, development, and health. Can. Psychol./Psychol. Can. 2008, 49, 182. [Google Scholar] [CrossRef] [Green Version]
  63. Deci, E.L.; Vallerand, R.J.; Pelletier, L.G.; Ryan, R.M. Motivation and education: The self-determination perspective. Educ. Psychol. 1991, 26, 325–346. [Google Scholar] [CrossRef]
  64. Ryan, R.M.; Deci, E.L. Intrinsic and extrinsic motivations: Classic definitions and new directions. Contemp. Educ. Psychol. 2000, 25, 54–67. [Google Scholar] [CrossRef]
  65. Ryan, R.M.; Deci, E.L. Self-determination theory and the facilitation of intrinsic motivation, social development, and well-being. Am. Psychol. 2000, 55, 68–78. [Google Scholar] [CrossRef]
  66. Deci, E.L.; Ryan, R.M. The general causality orientations scale: Self-determination in personality. J. Res. Personal. 1985, 19, 109–134. [Google Scholar] [CrossRef]
  67. Deci, E.L.; Ryan, R.M. Facilitating optimal motivation and psychological well-being across life’s domains. Can. Psychol./Psychol. Can. 2008, 49, 14. [Google Scholar] [CrossRef] [Green Version]
  68. Deci, E.L.; Ryan, R.M. The“ what” and“ why” of goal pursuits: Human needs and the self-determination of behavior. Psychol. Inq. 2000, 11, 227–268. [Google Scholar] [CrossRef]
  69. Vallerand, R.J.; Blais, M.R.; Briere, N.M.; Pelletier, L.G. Construction et validation de l’échelle de motivation en éducation (EME). Can. J. Behav. Sci./Rev. Can. Sci. Comport. 1989, 21, 323. [Google Scholar] [CrossRef] [Green Version]
  70. Barbera, J.; VandenPlas, J.R. All assessment materials are not created equal: The myths about instrument development, validity, and reliability. In Investigating Classroom Myths through Research on Teaching and Learning; ACS Publications: Washington, DC, USA, 2011; pp. 177–193. [Google Scholar]
  71. Netemeyer, R.G.; Bearden, W.O.; Sharma, S. Scaling Procedures: Issues and Applications; Sage Publications: Southend Oaks, CA, USA, 2003. [Google Scholar]
  72. Pestana, H.; Gageiro, N. Análise de Dados para as ciências Sociais: A Complementaridade do SPSS, 3rd ed.; Edições Silabo: Lisbon, Portugal, 2003. [Google Scholar]
  73. Costello, A.B.; Osborne, J. Best practices in exploratory factor analysis: Four recommendations for getting the most from your analysis. Pract. Assess. Res. Eval. 2005, 10, 7. [Google Scholar]
  74. Raykov, T.; Marcoulides, G.A. Estimation of generalizability coefficients via a structural equation modeling approach to scale reliability evaluation. Int. J. Test. 2006, 6, 81–95. [Google Scholar] [CrossRef]
  75. Hair, J.F.; Black, W.C.; Babin, B.J.; Anderson, R.E.; Tatham, R.L. Multivariate Data Analysis; Pearson: London, UK, 2010. [Google Scholar]
  76. Thompson, B. Exploratory and Confirmatory Factor Analysis; American Psychological Association: Washington, DC, USA, 2004. [Google Scholar]
  77. Brown, T.A. Confirmatory Factor Analysis for Applied Research; Guilford Publications: New York, NY, USA, 2015. [Google Scholar]
  78. Hair, J.F., Jr.; Sarstedt, M.; Hopkins, L.; Kuppelwieser, V.G. Partial least squares structural equation modeling (PLS-SEM): An emerging tool in business research. Eur. Bus. Rev. 2014, 26, 106–121. [Google Scholar] [CrossRef]
Publisher’s Note: MDPI stays neutral with regard to jurisdictional claims in published maps and institutional affiliations.

Article Metrics

Citations

Article Access Statistics

Multiple requests from the same IP address are counted as one view.