Article

Is Happiness Linked to Subjective Life Expectancy? A Study of Chilean Senior Citizens

by
Gregorio Gimenez
1,*,
Ana Isabel Gil-Lacruz
2 and
Marta Gil-Lacruz
3
1
Department of Applied Economics, Faculty of Economics and Business, University of Zaragoza, 50009 Zaragoza, Spain
2
Department of Management, School of Engineering and Architecture, University of Zaragoza, 50009 Zaragoza, Spain
3
Department of Psychology and Sociology, Health Science Faculty, University of Zaragoza, 50009 Zaragoza, Spain
*
Author to whom correspondence should be addressed.
Mathematics 2021, 9(17), 2050; https://doi.org/10.3390/math9172050
Submission received: 4 June 2021 / Revised: 22 July 2021 / Accepted: 23 August 2021 / Published: 25 August 2021
(This article belongs to the Special Issue Quantitative Methods for Social Sciences)

Abstract

:
The main goal of this research is to determine the link between happiness and individual subjective life expectancy (SLE) among Chilean senior citizens. We use data from the 2015 edition of the Chilean Social Protection Survey. Our sample consists of 1298 seniors: 700 aged 65–74, 421 aged 75–84, and 177 aged 85 and older. We provide a novel methodological approach that allows us to measure the relative contribution of happiness to SLE, by combining the Shapley–Owen–Shorrocks decomposition with contrasts of marginal linear predictions of the equality of the means by groups. Results reveal that happiness is the most important determinant of seniors’ SLE, and the effect is stronger the older the people are. Addressing varying levels of happiness is important because both happiness and unhappiness have a significant impact. In an ageing population, social agents should consider that these variables (happiness and SLE) are related to engagement in healthy lifestyles. If prevention programs integrated this interaction, welfare systems could save scarce resources. Therefore, governments should foster happiness to support active ageing.

1. Introduction

In the last 40 years, life expectancy has increased by 15 years for men and 10 years for women worldwide. However, this increase is not homogenous and there are important life expectancy differences among, for example, income groups [1]. Our research focuses on integrating the perspective of a general increase in life expectancy with certain declines due to differences among individual characteristics, such as socioeconomic backgrounds and health conditions [2,3].
International comparisons are complex because there are differences and similarities between distant and close countries. US life expectancy at birth is now lower than in other high-income countries. In fact, US predictions for 2030 are similar to the Czech Republic for men, and Croatia and Mexico for women [4]. Chile, the focus of this research, has the highest life expectancy in South America (80.5 years old), followed by Mexico, with a life expectancy five years lower. There are important gender differences within the country: while life expectancy for Chilean men is 77.4 years old, for Chilean women it is 83.4 [5].
Longevity is not only related to length but also to quality. Subjective statistics on happiness and life satisfaction across countries control for a wide range of variables [6]. Although economic development is a key element for a better future, it is not the only one; for instance, South American countries report higher levels of happiness when socio-political and economic indicators are considered [7].
The direct and indirect effects of a variety of variables raise many questions about how to improve citizens’ wellbeing. For example, widespread coverage by mass media of public health information on life expectancy and health determinants facilitates awareness. If people knew how many years they are likely to live, they would plan their remaining time in the best way possible. Researchers should study how general health knowledge transforms into citizens’ realistic evaluations of their expectations of survival. If these expectations correlate with mortality rates, we can infer that the population shares a well-informed view that allows them to make rational decisions [8].
In this context, the term “subjective life expectancy” (SLE), which consists of a self-evaluation of how many years remain, is becoming more and more popular in health studies [9]. Nevertheless, this internal representation configures a mental model that is not always accurate, such as the importance given to environmental determinants or health-risk behaviors; it is also a dynamic construct that changes with experience and learning [9,10]. The relevance of SLE lies in providing a personal framework of expectations in different spheres: economic, labor, health, leisure, and so on [11,12,13]. SLE has been linked to short- and long-term goals, behavioral intentions, and decision-making processes [14,15]; for instance, given the sustainability problems of public pensions around the world, people are increasingly concerned about saving for the future. Individual evaluation of life expectancy and resource use will have a significant impact on national economies, societies, and policies [8].
Our research contributes to the state of art the consideration of a complex set of variables that influence SLE. Previous studies have analyzed health indicators, happiness, sex and age, education, and income in an isolated way. With this article we observe them together in an empirical framework that allows us to look deeper at the impact of happiness and the perception of SLE.
While happy people are more optimistic [16], people with anxiety/depression might, therefore, be more pessimistic [17]. The problem is that pessimism is associated with higher mortality [17,18]. At this point, gender differences should be approached cautiously because, while senior women live happier and longer, it is senior men who expect to live happier and longer [19]. In addition, happiness has a greater impact on men’s life expectancy, thus reducing the life expectancy gap between women and men [20].
Nevertheless, in general terms, positive mental health indicators, such as optimism, have an evident beneficial impact on SLE [9]. For example, optimistic seniors usually “normalize” symptoms and assume that health declines and difficulties in coping with their lives are normal parts of ageing rather than the result of a physical illness. In addition, they may compare their health with that of their age peers and, despite their specific health problems, rate their health favorably and make more positive social comparisons [21].
Following this line of argument, pessimistic life expectations in old age can undermine the desire to live [22]. Optimists and pessimists suffer from health problems with approximately equal frequency, but optimists make more positive initial assumptions than pessimists [21]. The differences between dispositional optimists and pessimists concerning SLE seem to be consistent across lifespans: optimists rate their past, present, and anticipated future SLE more positively than pessimists [23].
Happiness is an attitude and, although there is a certain degree of inherence, people can work on it to some extent. For example, social interactions and social support constitute protective factors for happiness and SLE [9,24]. In this social sphere, cultural differences matter. Latin American people share a specific pattern of interpersonal relationships providing them with a social support network and positive emotions [7].
Nevertheless, beyond national particularities, an international study with data from 151 countries ratifies the idea that there is a strong link between happiness and SLE [25]. Subjective wellbeing measures inform about individual self-assessment and the corresponding factors people consider important in their lives [7]. In this respect, self-rated health and other perceived measures are found to be suitable predictors of health outcomes [26]. Self-rated health is positively related to SLE [15], and, therefore, it has been used as a proxy and a control variable in studies on SLE [9].
The scientific literature highlights the impact of new diagnoses on SLE: for example, a new diagnosis of cancer or stroke causes a reduction in SLE of around 5% for English people over 50 [8]. Stress, anxiety, and depression, and their related negative perceptions, influence SLE [9]. In general, reporting physical or mental health problems is associated with lower subjective survival expectations [17]. In a study for Chile, senior women who rated their health as poor had a twofold risk of mortality than senior women who rated their health as good [27].
This evaluation could also reflect the impact of other variables, such as healthy habits. SLE is integrated not only by the evaluation of current health state but also by the awareness of risks on their lifestyles [8]. Being overweight and obese are important health risk factors that cause serious damage to individual health and life expectancy. Although the population is aware of these facts when they calculate their remaining years [28], their view is not always realistic because they tend to underestimate their effects [10].
The quality of life measurement must integrate subjective and objective indicators, measurements of environmental quality and inequality, individual and collective wellbeing, and material and non-material aspects. In a study focused on Chilean regions with a rapidly growing economy, variations in quality of life have suggested to policymakers that pursuing economic targets is not enough to promote quality of life [29].
Regarding the demographic and socioeconomic factors that determine SLE, public health has emphasized the role of sex and age on life expectancy. Women live longer, and this fact seems to be computed under SLE [15]. However, the direction of this relationship is not so straight. Younger generations tend to assess survival with pessimism, while an increasing optimism is observed for older generations [17]). Recent birth cohorts have a significantly lower SLE, with women being less optimistic than men at every age [8] Whereas for some authors optimism begins at 85 years old, for others it already starts at 70 [30,31]. While subjective survival probabilities are generally pessimistic [17], pessimism decreases as the target age approaches (forecasting horizon), and also as subjects age (cohort age) [17,30].
In addition, age is a variable that integrates individual perceptions of one’s own family history, comparisons with the same and other cohorts, or present and past health conditions, among other features. For example, the early death of parents could provide us with information on mutual environmental conditions (such as diet) or genetic conditions [30,32]. People could also alter their beliefs across their lifespan based on information provided by the death of friends and family members, for example [17].
SLE strongly depends on education and income [9]. Higher levels of education and income predict a longer life expectancy [33]. Both socioeconomic indicators behave as protective health resources. Higher incomes and education improve access to health information and services that are useful for maintaining healthy lifestyles and addressing health problems. Further empirical evidence is required because some studies prioritize the impact of education [28] and others income level [15,34].
In addition, the results might reveal important gender differences. Women with tertiary education show better SLE than other groups, while men with secondary and tertiary education present the same SLE tendency [8]. Regarding wealth, higher levels of income are positively correlated with higher perceived survival rates for men and women, with the correlation being weaker for women [8]. However, increased income and higher levels of education do not necessarily imply greater levels of happiness [35].
Income and wealth are important both separately and combined. Firstly, education reinforces income and vice versa. Secondly, both factors are related because wealthier and higher educated individuals have more access to resources, and care about and understand their health and potential risks [8].
Lastly, regarding marital status, the worst expectancies are found for people whose spouse has died, followed by those that are divorced or separated. Single men are the only people more optimistic about their SLE than the real measure of their mortality risk [8].
All these factors form the basis of the empirical model we will use in the methodological section. The present study focuses on the importance of happiness in figuring out individual SLE. The main contributions of this article are threefold. First, we offer empirical evidence from a middle-income country: Chile (with data from the Social Protection Survey, commissioned by the Ministry of Labor and Social Welfare of the Government of Chile [36]); this is a key contribution since most articles exclusively consider samples from Australia, England, and USA. Second, as senior citizens represent one of the most heterogeneous population groups, to facilitate comparisons, we disaggregate the sample of seniors into three age groups: 65–74, 75–84, and 85 and older. Third, we offer a methodological approach based on the use of the Shapley–Owen–Shorrocks decomposition and contrasts of marginal linear predictions of the equality of the means. This methodological approach, as far as we are aware, constitutes an innovation in the field of health economics and allows strong testing of the effects of happiness on SLE.
The results of this research reveal that happiness is a key determinant of SLE and it overcomes traditional explanatory factors. The effect of happiness on health is stronger the older the people are. These results will provide policymakers and social agents with more in-depth knowledge of how to improve seniors’ wellbeing and how to guide them to make better decisions regarding their life energy and material resources. Understanding the factors helping to define SLE could be useful to design information-centered preventive strategies to promote healthy behaviors and attitudes. Individuals could also consider their SLE consciously or unconsciously to invest their time and economic resources in issues such as their retirement age and pensions.
The paper is structured as follows. The next section discusses the methodological framework. Then, we focus on the results, and we conclude by summarizing the main outcomes, discussing the implications and pointing out limitations and future lines of research.

2. Materials and Methods

The paper focuses on the impact of happiness on seniors’ SLE. Our data source is the 2015 edition of the Social Protection Survey (Encuesta de Protección Social, EPS). Commissioned by the Undersecretary of Social Welfare of the Ministry of Labor and Social Welfare of the Government of Chile, the EPS is a nationally-representative stratified random survey, conducted every three years since 2002. It covers wealth, schooling, financial literacy, work history, childhood background, social protection, and selected personality traits [37]. The survey is comparable to the U.S. Health and Retirement Study (HRS); but, in contrast to the HRS, the EPS covers all adults, not just respondents over age 50 [37]. The questionnaire is widely used in Chile to diagnose, develop, and evaluate public policies [38].
In the 2015 edition, the methodological design of the sample selection was supervised by Dr. Steven Heeringa, director of the Survey Design and Analysis Unit of the Institute for Social Research at the University of Michigan, and carried out by the Department of Economics of the Faculty of Economic and Administrative Sciences of the University of Chile, an institution that has extensive experience in the design and application of representative surveys in Chile [39]. The final sample consisted of 16,906 respondents, and was representative (also by age groups) of the Chilean population affiliated with the pension system in June 2015. This target population included the entire population over 18 years of age in the country, excluding members of the Armed Forces and law enforcement (because they have their own social security system), and a very small percentage of the Chilean people residing in areas that are difficult to access [39].
In what follows, we limited our attention to the 1298 respondents age 65 or over. Of these, 700 were aged 65–74, 421 aged 75–84, and 177 aged 85 and older. This allowed us to control for younger seniors (3rd age: 65–74), middle seniors (4th age: 75–84), and older seniors (5th age: 85 and older) because their life energy differs significantly. We performed a statistical sensitivity power analysis to determine the smallest effects related to our objectives that we would have adequate power to detect in the case of the parametric analysis. With an alpha = 0.05 and power = 0.95, the minimum effect size (ES) that is likely to be detected with this sample is ES = 0.003. Thus, this sample size was more than adequate for statistical analysis carried out in the research.
The survey included very relevant questions for our research. Our endogenous variable, SLE in seniors, was explored with the question: What are your chances of living to the age of 75? (if the interviewee is 65–74); up to 85 (if 75–84); up to 100 (if 85 and older). In the sample, 65.14% of the interviewees thought they would live up to 75 years, 56.88% up to 85 years, and 47.41% up to 100 years.
The predictors we used for SLE were chosen based on the theoretical framework explained in the introduction section. They were happiness, gender, age, educational level, civil status, body mass index, diseases suffered, and subjective health condition. Happiness was measured with the question: In the past 30 days, how would you say you have felt? Five possible responses were offered: Not happy at all, slightly happy, moderately happy, quite happy, and very happy. This means we worked with five categories sorting individuals with differing levels of happiness. 6.91% of the individuals of the sample felt not happy at all, 15.16% slightly happy, 41.60% moderately happy, 29.87% quite happy, and 6.46% very happy. With respect to socioeconomic characteristics: 47.22% of the sample were men and 52.78% women; the average age was 74.6 years; 26.35% had primary studies or less, 65.96% a high school degree, and 7.69% tertiary studies; lastly, 48.14% of the individuals were married, 27.39% widower, 11.83% single, 1.84% divorced, and 10.80% had an annulled marriage or were separated. Objective health status was proxied by the body mass index: 1.20% had low weight, 35.05% normal, 17.79% overweight, and 45.96% obesity. We controlled, additionally, for the diseases suffered by building a dichotomic variable that considered if the individual had any of the following in the moment of the survey: asthma or pulmonary emphysema, depression, diabetes, hypertension or high blood pressure and heart problems, cancer, arthritis or osteoarthritis, kidney disease, and stroke. The variable had a value of 1 if the individual had one or more diseases, and 0 if did not. In the sample, 79.46% of the individuals suffered from any of the mentioned diseases. Finally, subjective health was measured asking about health status: 1.81% of the individuals considered that their health was excellent, 2.32% very good, 27.06% good, 44.59% fairly good, 18.83% bad, and 4.39% very bad.
The statistical relation between SLE and its predictors was determined through the model
S L E i = β 0 + β 1 x i 1 + + β i x i j + + β k x i k + ε i
where S L E i represents the subjective life expectancy of an individual i; and K = x 1 , , x j , , x k is a set of individual i characteristics (regressor variables). As explained, they include individuals’ perception of happiness, socioeconomic, and health characteristics.
To understand the importance that happiness had on the SLE of Chilean senior citizens, we implemented a two-step empirical strategy. Below, we explain this double approach.
In a first step, we carried out a nonparametric Shapley–Owen–Shorrocks decomposition to compute the relative importance of happiness, comparing it with other traditional factors, to explain the variance in SLE. This technique has been used mostly in economics to understand the causes of inequality and poverty [40,41] and, recently, it has been used in other fields, such as economics of education or economic growth [42,43,44,45]. Nevertheless, to the best of our knowledge, it has not been applied, until now, in health economics, in spite of its methodological advantages. The coefficients of the traditional regressions give information about the sense of the correlation between variables and its significance, but they do not allow to rank the explanatory variables in order of importance [46,47]. Hence, they do not permit to quantify the true contribution of each variable to explain the endogenous. Shapley–Owen–Shorrocks methodology allows such limitations to be overcome, and to calculate the exact contributions of the explanatory variables of a regression to its R-square [46]. Its calculation is explained in Appendix A. We performed the analysis using the command rego, developed by Huettner and Sunder (2012) for Stata statistical software [48]. The code used to compile and analyze data was written in Stata 16. The code and data to replicate figures and tables are available as Supplementary Materials accompanying the article.
In a second step, we carried out a parametric contrast of marginal linear predictions of the equality of the means by groups. With this, we wanted to delve into the pattern of influence of happiness on SLE, and on how it differed by age groups. Specifically, we tested whether a particular age group significantly diverged from all groups combined through the following null hypothesis, which assumes that there were no statistically significant differences
H 0 :   μ i = μ m e a n
where μ i is the adjusted for the covariates mean of age group i and μ m e a n the observation-weighted grand mean of all groups.

3. Results

We have divided this section into two subsections. They follow the two-step empirical strategy.

3.1. Shapley–Owen–Shorrocks Decomposition

Table 1 presents the decomposition of the SLE function for the three age groups: seniors aged 65–74, seniors aged 75–84, and seniors aged 85 and older. The results are given both as levels and as a percentage of the total variance. Each component is accompanied by its 95% confidence interval, which was obtained using a nonparametric bootstrap estimation. We calculated a distribution for each component, from which we have computed the 2.5th and the 97.5th percentiles. It is not possible to estimate the significance of the components, as the R-square always rises when an additional explanatory variable is introduced into the regression [46].
As we can see, happiness made the largest contribution to the explanation of SLE. For every age group, it accounted for 36%, 30%, and 37% of the R-square, respectively. It was followed in importance by diseases suffered (this was the most important factor for individuals aged 75–84) and by subjective health condition. Other determinants contributed far less to explaining the variance differences between individuals: gender and age, educational level, civil status, and body mass index almost equally explained the remaining variation. The explanatory factors’ contribution was very homogeneous and consistent among the three age ranges. However, in the group of individuals that were 85 and older, diseases suffered became a less important factor and the significance of civil status and body mass index increased.

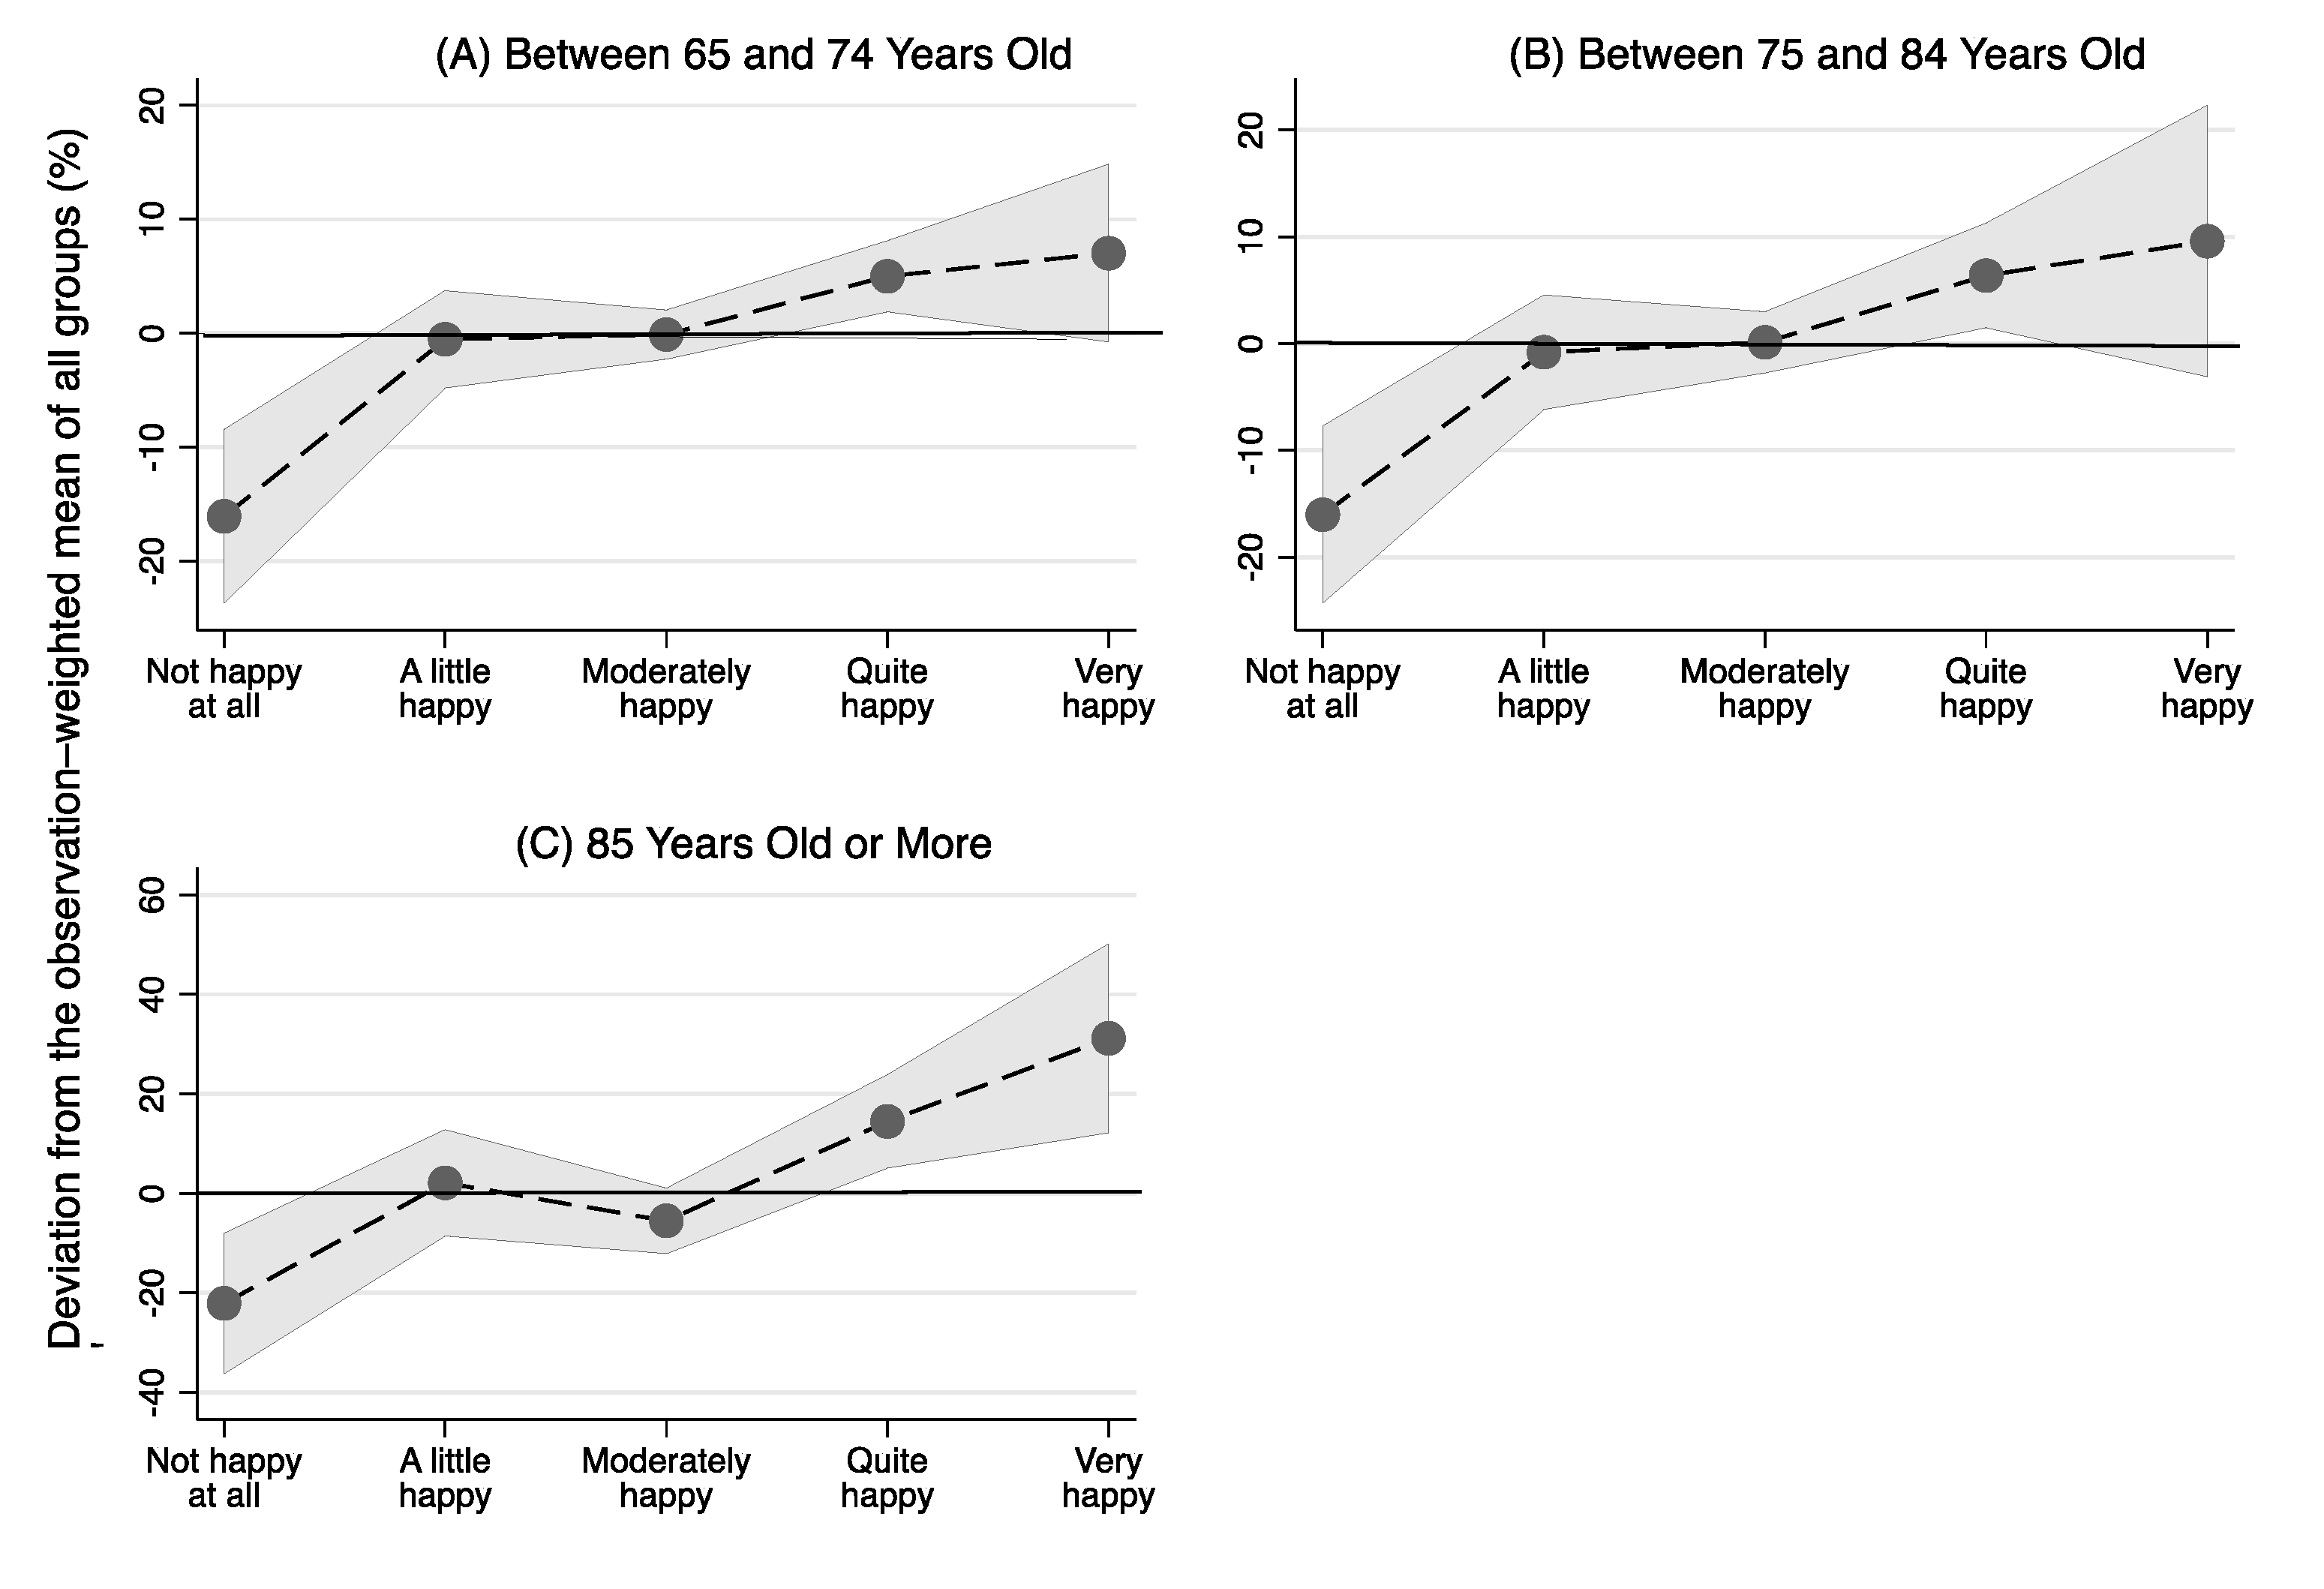
3.2. Contrasts of Marginal Linear Predictions of the Equality of the Means

Table 2 provides the summary statistics for each of the contrasts comparing the mean of every happiness category with the observation-weighted grand mean, after adjusting for the other explanatory variables. The grand mean groups all the happiness categories: not happy at all, slightly happy, moderately happy, quite happy, and very happy. The overall joint test, presented at the bottom of the table, simultaneously examines all the specified contrasts and shows that there were significant differences between the mean of the age groups and the observation-weighted grand mean.
If we focus on each category separately and compare it with the grand mean, we observe that a much larger proportion of people in the not happy at all category thought they were not going to live much longer (not reach the next age group): 16.06% in the 65–74 group, 16.00% in the 75–84 group and 22.10% in the 85 and older group.
The opposite can be observed in the categories where people said they felt happier. In the 65–74 group, if people felt very happy, their perception of being able to live longer (reaching the next age group) increased by 7.04%. The rise was 5.00% in people who felt quite happy. In the 75–84 group, feeling quite happy increased the probabilities by 6.37%. Finally, in the group of people 85 and older, feeling very happy had a major impact and increased their perceived probabilities of living longer by 31.16%. The effect of feeling quite happy was also very significant and increased their perception by 14.47%.
We could not reject the other hypothesis as the contrasts were not statistically significant.
Figure 1 depicts the contrasts and is extremely illustrative. The line at zero indicates the observation-weighted mean of all groups. Each dot represents the differences in SLE with the grand mean, after controlling for the other explanatory factors. We can clearly see the increasing effect of happiness and its greater importance at older ages.
All in all, happiness led to a statistically significant increase in SLE. This was a growing effect: the happier the senior was, the higher the increase. Not feeling happy at all had the most negative effect on SLE for the three age groups in the analysis. Finally, we could also appreciate that the observed effect of happiness on health was stronger the older the people were.

4. Discussion

Self-rated health and psychosocial indicators of health have a significant influence on SLE. The scientific literature emphasizes the importance of positivism and life control, which help predict engagement in healthy behaviors [49,50]. In our sample, happiness is the main variable that impacts on SLE. Its influence is larger than subjective health-rated measures such as suffered diseases or self-perception of health.
However, age requires a special mention as an explanatory variable. The diseases suffered in the sample group made up of individuals between 75 and 84 years old have an important explanatory role on SLE. In the sample group who were 85 years or older, diseases lose their explanatory force; other individual variables such as body mass index and marital status become more important. As we suggested in the introduction, at a certain point in life, health difficulties could be assumed to be normal indicators of aging [21]. Even the scientific literature indicates that pessimism could decrease in older age groups [17,30]. However, social support (such as partner support) acts as a protective resource in older groups for happiness and SLE [9,24]; meanwhile, the death of friends and loved ones could have a significant negative effect on these perceptions [17].
The complementary results have to do with unhappiness. Again, the oldest age group (85 and older) who are not happy at all value their SLE the worst. Optimists and pessimists may suffer from the same health problems, but optimists’ positive assumptions hold throughout their lives and they anticipate a better SLE in their future [21,23].
Happiness and positive emotions and their interactions contribute to increasing the wellbeing of the population even though they are not the most common indicators of socioeconomic development [7]. This is especially relevant in Latin American cultures, such as Chile’s, because they are characterized by the importance of the family, affective expression, and human-relationship orientation [7].
Our results corroborate this line of argument. The Shapley–Owen–Shorrocks decomposition results and the contrasts of marginal linear predictions of the equality of the means provide strong evidence supporting the link between happiness and SLE. The Shapley–Owen–Shorrocks decomposition we conducted shows that happiness accounts for one third of the variance in SLE, once we control for factors such as suffered diseases, subjective health condition, body mass index, and socioeconomic characteristics. Those who are happier think they are going to live longer. This is a growing effect, the happier they are, the higher the increase in SLE, and the effect is stronger the older the people are.

5. Conclusions

Given the importance of happiness in the third age, identifying strategies that help our seniors feel happier is essential. Organizing social meetings once a week is found to significantly improve seniors’ happiness [51,52]. Solutions might be sought in the education domain. Individuals with higher levels of education have more extensive social networks and are better able to cope with daily activities and, in turn, these life conditions have a positive impact on happiness. Education improves one’s ability and propensity to connect with other people and this, in turn, has a positive effect on subjective wellbeing [53].
Understanding the factors defining SLE could be useful for citizens and social agents (health planners, policymakers, and so on). Citizens could use key information to take individual decisions and social agents should be concerned about providing proper intervention and/or activities to improve seniors’ quality of life, especially among the unhappy elderly [9,25].
Social policies should be designed in a cross-cutting fashion to promote healthy ageing and adequate ageing attitudes and behaviors. Social and health care policies have to consider the important role of education. Investment in social policies and health feeds back on itself because, if active ageing contributes to wellbeing, feeling good and happy also promotes self-care. Happiness and SLE reinforce life goals, healthy lifestyles, and the retirement-decision process [14,15]. Adequate awareness and a population educated on these issues could contribute to improving the sustainability of our welfare systems.
One limitation of our study is using a single subjective health indicator. In this context, it would be interesting to use other models and variables as soon as data becomes available. Therefore, for future research, we recommend adding more objective health information. In addition, to provide a broader picture of seniors’ wellbeing, these results need to be compared with results coming from seniors living in retirement homes and hospitals because their SLE and happiness might be significantly lower [8]. Another line of interest would consist of taking advantage of the longitudinal perspective of the Social Protection Survey database. The objective would be to study how economic, political, and social structural changes, such as the recent financial crisis, affect happiness and produce variations in the SLE.

Supplementary Materials

The following are available online at https://www.mdpi.com/article/10.3390/math9172050/s1.

Author Contributions

Conceptualization, A.I.G.-L. and M.G.-L.; methodology, G.G.; software, G.G.; formal analysis, G.G.; writing—original draft A.I.G.-L., G.G. and M.G.-L.; writing—review and editing, A.I.G.-L., G.G. and M.G.-L.; visualization, A.I.G.-L.; supervision, A.I.G.-L.; project administration, A.I.G.-L. and M.G.-L.; funding acquisition, A.I.G.-L. and M.G.-L. All authors have read and agreed to the published version of the manuscript.

Funding

This research was founded by Ministerio de Economía, Industria y Competitividad, Spain grant number CSO2017–82110-R Spain and Gobierno de Aragón-Universidad de Zaragoza, Spain grant number BYCS S16_17R Zaragoza, Spain).

Institutional Review Board Statement

It is our understanding that our research was conducted in accordance with the ethics requirements of our universities and is exempt from research ethics committee oversight. The reason is that the Encuesta de Protección Social (Social Protection Survey) dataset is a source of public access in which subjects cannot be identified in anyway or exposed to risks, liabilities, or reputational damage.

Informed Consent Statement

Not applicable.

Data Availability Statement

Data supporting reported results come from the Encuesta de Protección Social (Social Protection Survey), conducted by the Chilean Undersecretary of Social Security and available at [36]. The code used to compile and analyze data was written in Stata 16. The code and data to replicate figures and tables are available as Supplementary Materials accompanying the article. Note that, as consequence of the bootstrapping method applied in the routine, every time that is performed results can show very slightly differences in the decimals.

Conflicts of Interest

The authors declare no conflict of interest. The funders had no role in the design of the study; in the collection, analyses, or interpretation of data; in the writing of the manuscript, or in the decision to publish the results.

Appendix A. Calculating the Shapley–Owen–Shorrocks Decomposition

Methodologically, the Shapley–Owen–Shorrocks procedure combines the Shapley (1953) and Owen (1977) values [54,55], widely used in cooperative game theory, with the decomposition techniques recently developed by Shorrocks (2013) [41]. The Shapley method tries to fairly distribute the total gains of a game among all its participants. “[It] has several basic features which make it an attractive candidate for a general decomposition rule. It treats the factors in a symmetric manner; the contributions sum to the amount which needs to be ‘explained’; and the contributions can be interpreted as the expected marginal effect” [41] (p. 121). The marginal impact of each contributing factor is calculated as they are eliminated in succession. Then, the variable’s marginal contributions are averaged over all the possible elimination sequences.
If we can identify different sets of factors that can be grouped together, then it is more convenient to apply a two-stage variation of the Shapley rule, which is called the Owen value. In this case, the decomposition result is not affected by the choice of an omitted category (due to perfect multicollinearity). This is because the Owen value has the advantage of being aggregation-consistent: the sum of the contributions of the secondary factors is always equal to that of the primary factor from which they are derived [46]. In our model, we had several groups formed by categorical variables, and the use of the Owen value revealed the contribution of all the categories.
The procedure can be applied to the decomposition of any statistic of the model but it is normally applied to the R-square. Formally, following Huettner and Sunder (2012, pp. 1241-2) [56], from Equation (1) in Section 2, we define θ as a permutation of the variables considering that variable xj has the position θ j in θ . The set of variables that appears before xj in θ is denoted by P θ , x j x p K | θ p < θ j . In the permutation θ , variable xj changes the R-square by
M C x j , θ f P θ , x j x j P θ , x j
These are variables xj’s marginal contributions in θ .
We may now calculate the Owen value of variable xj as
O w x j f , G = 1 Θ K , G · θ Θ K , G M C x j θ
where Θ K , G is the set of rank orders that respects the partitioning scheme G for all possible permutations, calculated as
Θ K , G = γ ! · s = 1 γ G s !

References

  1. Chetty, R.; Stepner, M.; Abraham, S.; Lin, S.; Scuderi, B.; Turner, N.; Bergeron, A.; Cutler, D. The Association Between Income and Life Expectancy in the United States, 2001–2014. JAMA 2016, 315, 1750. [Google Scholar] [CrossRef] [PubMed]
  2. Oeppen, J. DEMOGRAPHY: Enhanced: Broken Limits to Life Expectancy. Science 2002, 296, 1029–1031. [Google Scholar] [CrossRef] [PubMed] [Green Version]
  3. Vaupel, J.W. Biodemography of Human Ageing. Nature 2010, 464, 536–542. [Google Scholar] [CrossRef] [PubMed] [Green Version]
  4. Kontis, V.; Bennett, J.E.; Mathers, C.D.; Li, G.; Foreman, K.; Ezzati, M. Future Life Expectancy in 35 Industrialised Countries: Projections with a Bayesian Model Ensemble. Lancet 2017, 389, 1323–1335. [Google Scholar] [CrossRef] [Green Version]
  5. World Health Organization. Word Report on Ageing and Health; World Health Organization: Geneva, Switzerland, 2015. [Google Scholar]
  6. John, F.; Helliwell, J.F.; Huang, H.; Wang, S.; Shiplett, H. International Migration and World Happiness. In World Happiness Report, Chapter 2; Halliwell, J., Layard, R., Sachs, J., Eds.; Sustainable Development Solutions Network: New York, NY, USA, 2018. [Google Scholar]
  7. Rojas, M. Latin American Happiness has Social Foundations. In World Happiness Report, Chapter 6; Halliwell, J., Layard, R., Sachs, J., Eds.; Sustainable Development Solutions Network: NewYork, NY, USA, 2018. [Google Scholar]
  8. O’Dea, C.; Sturrock, D. Subjective Expectations of Survival and Economic Behavior; IFS Working Papers W18/14; Institute for Fiscal Studies: London, UK, 2018. [Google Scholar] [CrossRef]
  9. Griffin, B.; Loh, V.; Hesketh, B. A Mental Model of Factors Associated with Subjective Life Expectancy. Soc. Sci. Med. 2013, 82, 79–86. [Google Scholar] [CrossRef]
  10. Falba, T.A.; Busch, S.H. Survival Expectations of the Obese: Is Excess Mortality Reflected in Perceptions? Obes. Res. 2005, 13, 754–761. [Google Scholar] [CrossRef] [Green Version]
  11. Hesketh, B.; Griffin, B.; Loh, V. A Future-Oriented Retirement Transition Adjustment Framework. J. Vocat. Behav. 2011, 79, 303–314. [Google Scholar] [CrossRef]
  12. Post, T.; Hanewald, K. Longevity Risk, Subjective Survival Expectations, and Individual Saving Behavior. J. Econ. Behav. Organ. 2013, 86, 200–220. [Google Scholar] [CrossRef]
  13. Salm, M. Subjective Mortality Expectations and Consumption and Saving Behaviours among the Elderly. Can. J. Econ. Rev. Can. D’écon. 2010, 43, 1040–1057. [Google Scholar] [CrossRef]
  14. Griffin, B.; Hesketh, B.; Loh, V. The Influence of Subjective Life Expectancy on Retirement Transition and Planning: A Longitudinal Study. J. Vocat. Behav. 2012, 81, 129–137. [Google Scholar] [CrossRef]
  15. Van Solinge, H.; Henkens, K. Living Longer, Working Longer? The Impact of Subjective Life Expectancy on Retirement Intentions and Behaviour. Eur. J. Public Health 2010, 20, 47–51. [Google Scholar] [CrossRef]
  16. Wright, W.F.; Bower, G.H. Mood Effects on Subjective Probability Assessment. Organ. Behav. Hum. Decis. Process. 1992, 52, 276–291. [Google Scholar] [CrossRef]
  17. Wu, S.; Stevens, R.; Thorp, S. Cohort and Target Age Effects on Subjective Survival Probabilities: Implications for Models of the Retirement Phase. J. Econ. Dyn. Control 2015, 55, 39–56. [Google Scholar] [CrossRef]
  18. Mykletun, A.; Bjerkeset, O.; Øverland, S.; Prince, M.; Dewey, M.; Stewart, R. Levels of Anxiety and Depression as Predictors of Mortality: The HUNT Study. Br. J. Psychiatry 2009, 195, 118–125. [Google Scholar] [CrossRef]
  19. Lima, M.G.; Belon, A.P.; Barros, M.B. Happy Life Expectancy among Older Adults: Differences by Sex and Functional Limitations. Rev. Saúde Pública 2016, 50. [Google Scholar] [CrossRef] [Green Version]
  20. Kageyama, J. Happiness and Sex Difference in Life Expectancy. J. Happiness Stud. 2012, 13, 947–967. [Google Scholar] [CrossRef]
  21. Van Doorn, C. A Qualitative Approach to Studying Health Optimism, Realism, and Pessimism. Res. Aging 1999, 21, 440–457. [Google Scholar] [CrossRef]
  22. Bowen, C.E.; Skirbekk, V. Old Age Expectations Are Related to How Long People Want to Live. Ageing Soc. 2017, 37, 1898–1923. [Google Scholar] [CrossRef] [Green Version]
  23. Busseri, M.A. How Dispositional Optimists and Pessimists Evaluate Their Past, Present and Anticipated Future Life Satisfaction: A Lifespan Approach. Eur. J. Personal. 2013, 27, 185–199. [Google Scholar] [CrossRef]
  24. Holt-Lundstad, J.; Simth, T.B.; Layton, J.B. Social Relationships and Mortality Risk: A Meta-Analytic Review. PLoS Med. 2010, 7, e1000316. [Google Scholar] [CrossRef]
  25. Evans, G.F.; Soliman, E.Z. Happier Countries, Longer Lives: An Ecological Study on the Relationship between Subjective Sense of Well-Being and Life Expectancy. Glob. Health Promot. 2019, 26, 36–40. [Google Scholar] [CrossRef]
  26. Sargent-Cox, K.A.; Anstey, K.J.; Luszcz, M.A. Patterns of Longitudinal Change in Older Adults’ Self-Rated Health: The Effect of the Point of Reference. Health Psychol. 2010, 29, 143–152. [Google Scholar] [CrossRef]
  27. Moreno, X.; Albala, C.; Lera, L.; Sánchez, H.; Fuentes-García, A.; Dangour, A.D. The Role of Gender in the Association between Self-Rated Health and Mortality among Older Adults in Santiago, Chile: A Cohort Study. PLoS ONE 2017, 12, e0181317. [Google Scholar] [CrossRef] [Green Version]
  28. Ross, C.E.; Mirowsky, J. Family Relationships, Social Support and Subjective Life Expectancy. J. Health Soc. Behav. 2002, 43, 469. [Google Scholar] [CrossRef] [PubMed]
  29. Aroca, P.; Gonzalez, P.A.; Valdebenito, R. The Heterogeneous Level of Life Quality across Chilean Regions. Habitat Int. 2017, 68, 84–98. [Google Scholar] [CrossRef]
  30. Ludwig, A.; Zimper, A. A Parsimonious Model of Subjective Life Expectancy. Theory Decis. 2013, 75, 519–541. [Google Scholar] [CrossRef] [Green Version]
  31. Bissonnette, L.; Hurd, M.D.; Michaud, P. Individual Survival Curves Comparing Subjective and Observed Mortality Risks. Health Econ. 2017, 26, e285–e303. [Google Scholar] [CrossRef] [PubMed] [Green Version]
  32. Wang, Y. Dynamic Implications of Subjective Expectations: Evidence from Adult Smokers. Am. Econ. J. Appl. Econ. 2014, 6, 1–37. [Google Scholar] [CrossRef] [Green Version]
  33. Ross, C.E.; Mirowsky, J. Neighborhood Socioeconomic Status and Health: Context or Composition? City Community 2008, 7, 163–179. [Google Scholar] [CrossRef]
  34. Gonza, G.; Burger, A. Subjective Well-Being During the 2008 Economic Crisis: Identification of Mediating and Moderating Factors. J. Happiness Stud. 2017, 18, 1763–1797. [Google Scholar] [CrossRef]
  35. Schimmel, J. Development as Happiness: The Subjective Perception of Happiness and UNDP’s Analysis of Poverty, Wealth and Development. J. Happiness Stud. 2009, 10, 93–111. [Google Scholar] [CrossRef]
  36. Encuesta de Protección Social-Subsecretaría de Previsión Social. Available online: https://www.previsionsocial.gob.cl/sps/biblioteca/encuesta-de-proteccion-social/ (accessed on 31 May 2021).
  37. Behrman, J.R.; Mitchell, O.S.; Soo, C.K.; Bravo, D. How Financial Literacy Affects Household Wealth Accumulation. Am. Econ. Rev. 2012, 102, 300–304. [Google Scholar] [CrossRef] [Green Version]
  38. Bucciol, A.; Manfrè, M.; Gimenez, G. The 2008 Chilean Pension Reform: Household Financial Decisions and Gender Differences. J. Econ. Policy Reform 2020, 1–18. [Google Scholar] [CrossRef]
  39. Subsecretaría de Previsión Social del Ministerio de Trabajo y Previsión Social del Gobierno de Chile and Centro de Encuestas y Estudios Longitudinales de la Pontificia Universidad Católica de Chile. In Diseño Muestral y Factores de Expansión VI Ronda EPS; Ministerio de Trabajo y Previsión Social: Santiago de Chile, Chile, 2016.
  40. Baye, F.M. Growth, Redistribution and Poverty Changes in Cameroon: A Shapley Decomposition Analysis. J. Afr. Econ. 2006, 15, 543–570. [Google Scholar] [CrossRef]
  41. Shorrocks, A.F. Decomposition Procedures for Distributional Analysis: A Unified Framework Based on the Shapley Value. J. Econ. Inequal. 2013, 11, 99–126. [Google Scholar] [CrossRef] [Green Version]
  42. Gimenez, G.; Martín-Oro, Á.; Sanaú, J. The Effect of Districts’ Social Development on Student Performance. Stud. Educ. Eval. 2018, 58. [Google Scholar] [CrossRef]
  43. Gimenez, G.; Barrado, B.; Arias, R. El Papel Del Profesorado y El Entorno de Aprendizaje En El Rendimiento de Los Estudiantes Costarricenses: Un Análisis a Partir de PISA. Rev. Complut. de Educ. 2019, 30, 1127–1145. [Google Scholar] [CrossRef]
  44. Barcenilla, S.; Gimenez, G.; López-Pueyo, C. Differences in Total Factor Productivity Growth in the European Union: The Role of Human Capital by Income Level. Prague Econ. Pap. 2019, 28, 70–85. [Google Scholar] [CrossRef] [Green Version]
  45. Barrado, B.; Gimenez, G.; Sanaú, J. The Use of Decomposition Methods to Understand the Economic Growth Gap between Latin America and East Asia. Sustainability 2021, 13, 6674. [Google Scholar] [CrossRef]
  46. Israeli, O. A Shapley-Based Decomposition of the R-Square of a Linear Regression. J. Econ. Inequal. 2007, 5, 199–212. [Google Scholar] [CrossRef]
  47. Nathans, L.L.; Oswald, F.L.; Nimon, K. Interpreting Multiple Linear Regression: A Guidebook of Variable Importance. Pract. Assess. Res. Eval. 2012, 17, 1–19. [Google Scholar]
  48. Huettner, F.; Sunder, M. Rego: Stata Module for Decomposing Goodness of Fit According to Owen and Shapley Values. In United Kingdom Stata Users’ Group Meetings 2012; Stata Users Group: London, UK, 2012. [Google Scholar]
  49. Skaff, M.A. Sense of control and health: A dynamic duo in the aging process. In Handbook of Health Psychology and Aging; Press, T.G., Aldwin, C.M., Park, C.L., Spiro, A., Eds.; The Guilford Press: New York, NY, USA, 2007. [Google Scholar]
  50. Scott-Sheldon, L.A.J.; Carey, M.P.; Vanable, P.A.; Senn, T.E. Subjective Life Expectancy and Health Behaviors among STD Clinic Patients. Am. J. Health Behav. 2010, 34, 349–361. [Google Scholar] [CrossRef] [PubMed] [Green Version]
  51. Mathieu, S.I. Happiness and Humor Group Promotes Life Satisfaction for Senior Center Participants. Act. Adapt. Aging 2008, 32, 134–148. [Google Scholar] [CrossRef]
  52. Sumngern, C.; Azeredo, Z.; Subgranon, R.; Sungvorawongphana, N.; Matos, E. Happiness among the Elderly in Communities: A Study in Senior Clubs of Chonburi Province, Thailand. Jpn. J. Nurs. Sci. 2010, 7, 47–54. [Google Scholar] [CrossRef]
  53. Chen, W. How Education Enhances Happiness: Comparison of Mediating Factors in Four East Asian Countries. Soc. Indic. Res. 2012, 106, 117–131. [Google Scholar] [CrossRef]
  54. Shapley, L. A value for n-person games. In Contributions to the Theory of Games, Volume 2; Press, P.U., Kuhn, H.W., Tucker, A.W., Eds.; Princeton University Press: Princeton, NJ, USA, 1953. [Google Scholar]
  55. Owen, G. Values of games with priori unions. In Essays in Mathematical Economics and Game Theory; Heim, R., Moeschlin, O., Eds.; Springer: New York, NY, USA, 1977. [Google Scholar]
  56. Huettner, F.; Sunder, M. Axiomatic Arguments for Decomposing Goodness of Fit According to Shapley and Owen Values. Electron. J. Stat. 2012, 6, 1239–1250. [Google Scholar] [CrossRef]
Figure 1. Contrasts of linear predictions of happiness categories with 95% confidence intervals. Note: The line at zero indicates the observation-weighted mean of all groups.
Mathematics 09 02050 g001
Table 1. Shapley–Owen–Shorrocks decomposition of subjective life expectancy.
Between 65 and 74 Years OldBetween 75 and 84 Years Old85 Years Old and Older
Contributing FactorsValuePercentageValuePercentageValuePercentage
Happiness0.06436%0.07130%0.13337%
(0.030, 0.104) (0.032, 0.118) (0.064, 0.232)
Gender and age0.0074%0.0083%0.0185%
(0.001, 0.021) (0.002, 0.027) (0.003, 0.065)
Educational level0.0032%0.0073%0.0103%
(0.001, 0.011) (0.001, 0.027) (0.002, 0.039)
Civil status0.0074%0.0115%0.03811%
(0.002, 0.020) (0.003, 0.029) (0.007, 0.091)
Body mass index0.0032%0.0125%0.0349%
(0.001, 0.011) (0.002, 0.034) (0.008, 0.092)
Diseases suffered *0.05330%0.07833%0.06418%
(0.026, 0.087) (0.039, 0.131) (0.025, 0.131)
Subjective health condition0.04223%0.04820%0.06117%
(0.021, 0.071) (0.023, 0.087) (0.023, 0.118)
Total R-Squared0.179100%0.235100%0.358100%
Observations700421177
Proportion of R-Squared
explained by happiness (in dark grey)
Mathematics 09 02050 i001 Mathematics 09 02050 i002 Mathematics 09 02050 i003
Note: 95% confidence intervals are reported in parentheses. Obtained using a nonparametric bootstrap estimation with 1000 replications. * Diseases: asthma or pulmonary emphysema, depression, diabetes, hypertension or high blood pressure and heart problems, cancer, arthritis or osteoarthritis, kidney disease, and stroke.
Table 2. Contrasts of marginal linear predictions of the equality of the means for each group with the observation-weighted grand mean.
Between 65 and 74 Years OldBetween 75 and 84 Years Old85 Years Old or More
GroupFP > FContrastFP > FContrastFP > FContrast
Not happy at all17.150.000−16.06314.440.000−16.0039.600.002−22.099
(−3.879) (4.212) (7.132)
A little happy0.060.811−0.5200.090.769−0.7990.150.6952.127
(2.176) (2.715) (5.404)
Moderately happy0.010.916−0.1150.010.9320.1242.740.100−5.501
(1.089) (1.447) (3.321)
Quite happy9.910.0025.0036.530.0116.3729.340.00314.466
(1.589) (2.494) (4.734)
Very happy3.150.0777.0362.200.1399.59010.570.00131.159
(3.966) (6.461) (9.583)
Joint5.840.000 4.560.001 7.500.000
Observations700421177
Note: The Delta method estimated standard errors are in parentheses below the statistical coefficients.
Publisher’s Note: MDPI stays neutral with regard to jurisdictional claims in published maps and institutional affiliations.

