Article

Application of the Entropy Method and Color Difference Formula to the Evaluation of Round Brilliant Cut Diamond Scintillation

1
School of Gemmology, China University of Geosciences, Beijing 100083, China
2
School of Water Resources and Environment, China University of Geosciences, Beijing 100083, China
3
School of Land Science and Technology, China University of Geosciences, Beijing 100083, China
*
Author to whom correspondence should be addressed.
Mathematics 2020, 8(9), 1489; https://doi.org/10.3390/math8091489
Submission received: 10 August 2020 / Revised: 29 August 2020 / Accepted: 31 August 2020 / Published: 3 September 2020

Abstract

:
A modeling approach combining the entropy method and color difference formula is proposed in order to quantitatively evaluate diamond scintillation. The images of 66 diamonds were captured from 0° to 105° rotation at 15° intervals. The color difference of corresponding pixels in adjacent rotation angle images was calculated using a MatLab r2014a program, which indicated the diamond’s color change due to its scintillation. A threshold (10) was determined to divide the color difference into seven color difference intervals, the percentage of which indicated the color-change area. The color difference and the percentage were comprehensively analyzed using the entropy method to evaluate diamond scintillation objectively and quantitatively. Lightness was the main factor affecting the diamond scintillation while chroma and hue also significantly affected it.

1. Introduction

As a mineral, the diamond has certain indicators in geology [1,2]. Because of their high hardness, high refractive index, and high dispersion, larger and more pure diamonds are often used as gemstones. Diamonds are evaluated in terms of four aspects: carat weight, color, clarity, and cut in various standards. Faceted diamonds can also be characterized by scintillation, a dynamic and comprehensive display of fire and brightness. Moses et al. [3] defined scintillation as the appearance, or extent, of spots of light seen in a polished diamond when viewed face-up that flash as the diamond, observer, or light source moves (sparkle), as well as the relative size, arrangement, and contrast of bright and dark areas that result from internal and external reflections seen in a polished diamond when viewed face-up while that diamond is either still or moving (pattern). By trial and error, ancient jewelers produced cuts that refracted light and gave illumination life to gemstones. Tolkowsky systematically analyzed the diamond’s optical characteristics and estimated the best proportions for round brilliant cut diamonds, which today’s standards for “ideal-cut” diamonds are based upon with minor changes [4].
When a polished diamond is viewed face-up, brightness and fire refer to the appearance or extent of internal and external reflections of “white” light and light dispersed into spectral colors, respectively [3]. Thus, gemstone scintillation is related to brightness and fire, as well as the patterns produced by various optical effects [5,6]. In order to observe the optical effects of the gemstone, FireScope, Brilliance Scope, Diamond Integrator, ASET instruments, GemCad, GemRay, DiamCalc, and other tools and computer software have been developed [7,8,9,10,11,12,13,14].
For diamond images, scintillation implies a color change in the visual perception, which can be evaluated by the color difference [9]. The quantitative measurement of object color is extremely complex. Since it involves the observer’s visual physiology, visual psychology, lighting conditions, observation conditions, and many other factors. In order to obtain a consistent measurement effect, the Commission Internationale de l’Eclairage (CIE) has stipulated a set of standard color systems. Subsequently, the CIE 1931 standard colorimetric observer, CIE 1964 supplementary standard colorimetric observer, CIE 1976 Lab color space, and so on were proposed [15]. Currently, the most common color difference formula in research are the CIE 1976 Lab color difference formula [16,17] and the CIE DE2000 color difference formula [18,19,20,21,22,23]. The geometric meaning of the CIE 1976 Lab color difference formula is an ellipsoid centered on the coordinate point of the standard color sample in a uniform color space. The color space is not uniform in practical situations, however. The color tolerance is different at different positions of the chromaticity diagram—it is smallest in the blue portion and largest in the green portion [24,25,26]. The color difference formula is constantly being improved. McDonald, Witt, RIT-Dupont [27], and others have conducted a series of experiments and collected important data sets for the proposal or prediction of color difference formulas [28,29,30,31]. The CIE DE2000 color difference formula is currently the closest color difference formula to human vision. It is both more accurate and more computationally demanding [32].
The entropy method uses the effective information provided by the measurement data to make an objective evaluation of the evaluation object. In the evaluation process, a smaller entropy value of an evaluation index leads to larger amount of information being provided, and a larger corresponding weight; otherwise, the index weight is smaller [33]. The entropy method is widely used in various fields such as computer algorithms [34], evaluation of handling equipment [35], and product quality assessment [36].

2. Materials and Methods

2.1. Materials

Sixty-six non-fancy-color round brilliant cut diamonds were provided by the School of Gemmology, China University of Geosciences (Beijing). The stones were graded and certified by professionals at the China National Gemstone Training Center (NGTC). Based on the Chinese national standards, these diamonds were evaluated in terms of five aspects: carat weight, color, clarity, cut, and fluorescence.
  • Carat weight: Carat weight refers to the weight of the diamond, and its unit is generally the carat (ct), with 1 ct = 0.2 g.
  • Color: Non-fancy-color diamonds often have a yellow tone. Depending on the amount of yellow tone, the diamond’s color is classified as D, E, F, G, H, I, J, K, L, M, N, and < N; D has almost no yellow tone.
  • Clarity: Diamonds often contain a variety of inclusions, including solids, liquids, gases, and cracks. According to the diamond’s inclusions seen under a 10 × magnifying glass, the diamond’s clarity is classified as LC (Loupe Clean), VVS (Very Very Slight Inclusions), VS (Very Slight Inclusions), SI (Slight Inclusions), and P (Pique), and further subdivided into 11 small levels, i.e., FL (Flawless), IF (Internally Flawless), VVS1, VVS2, VS1, VS2, SI1, SI2, P1, P2, and P3.
  • Cut: After a rough diamond is cut, light beams are reflected, refracted and dispersed, making the diamond very beautiful. Based on proportion and finish, the diamond cut is classified as EX (Excellent), VG (Very Good), G (Good), F (Fair), and P (Poor).
  • Fluorescence: According to the intensity of light emitted by diamonds under long-wavelength ultraviolet light, a diamond’s fluorescence is divided into four levels: STR (Strong), MED (Medium), FNT (Faint) and NON (None).
The grading results of the diamonds in this study were as follows:
  • Shape: round brilliant
  • Weight: 0.11–0.40ct
  • Color: D–M
  • Clarity: LC–P
  • Cut: P–EX
  • Fluorescence: NON–STR
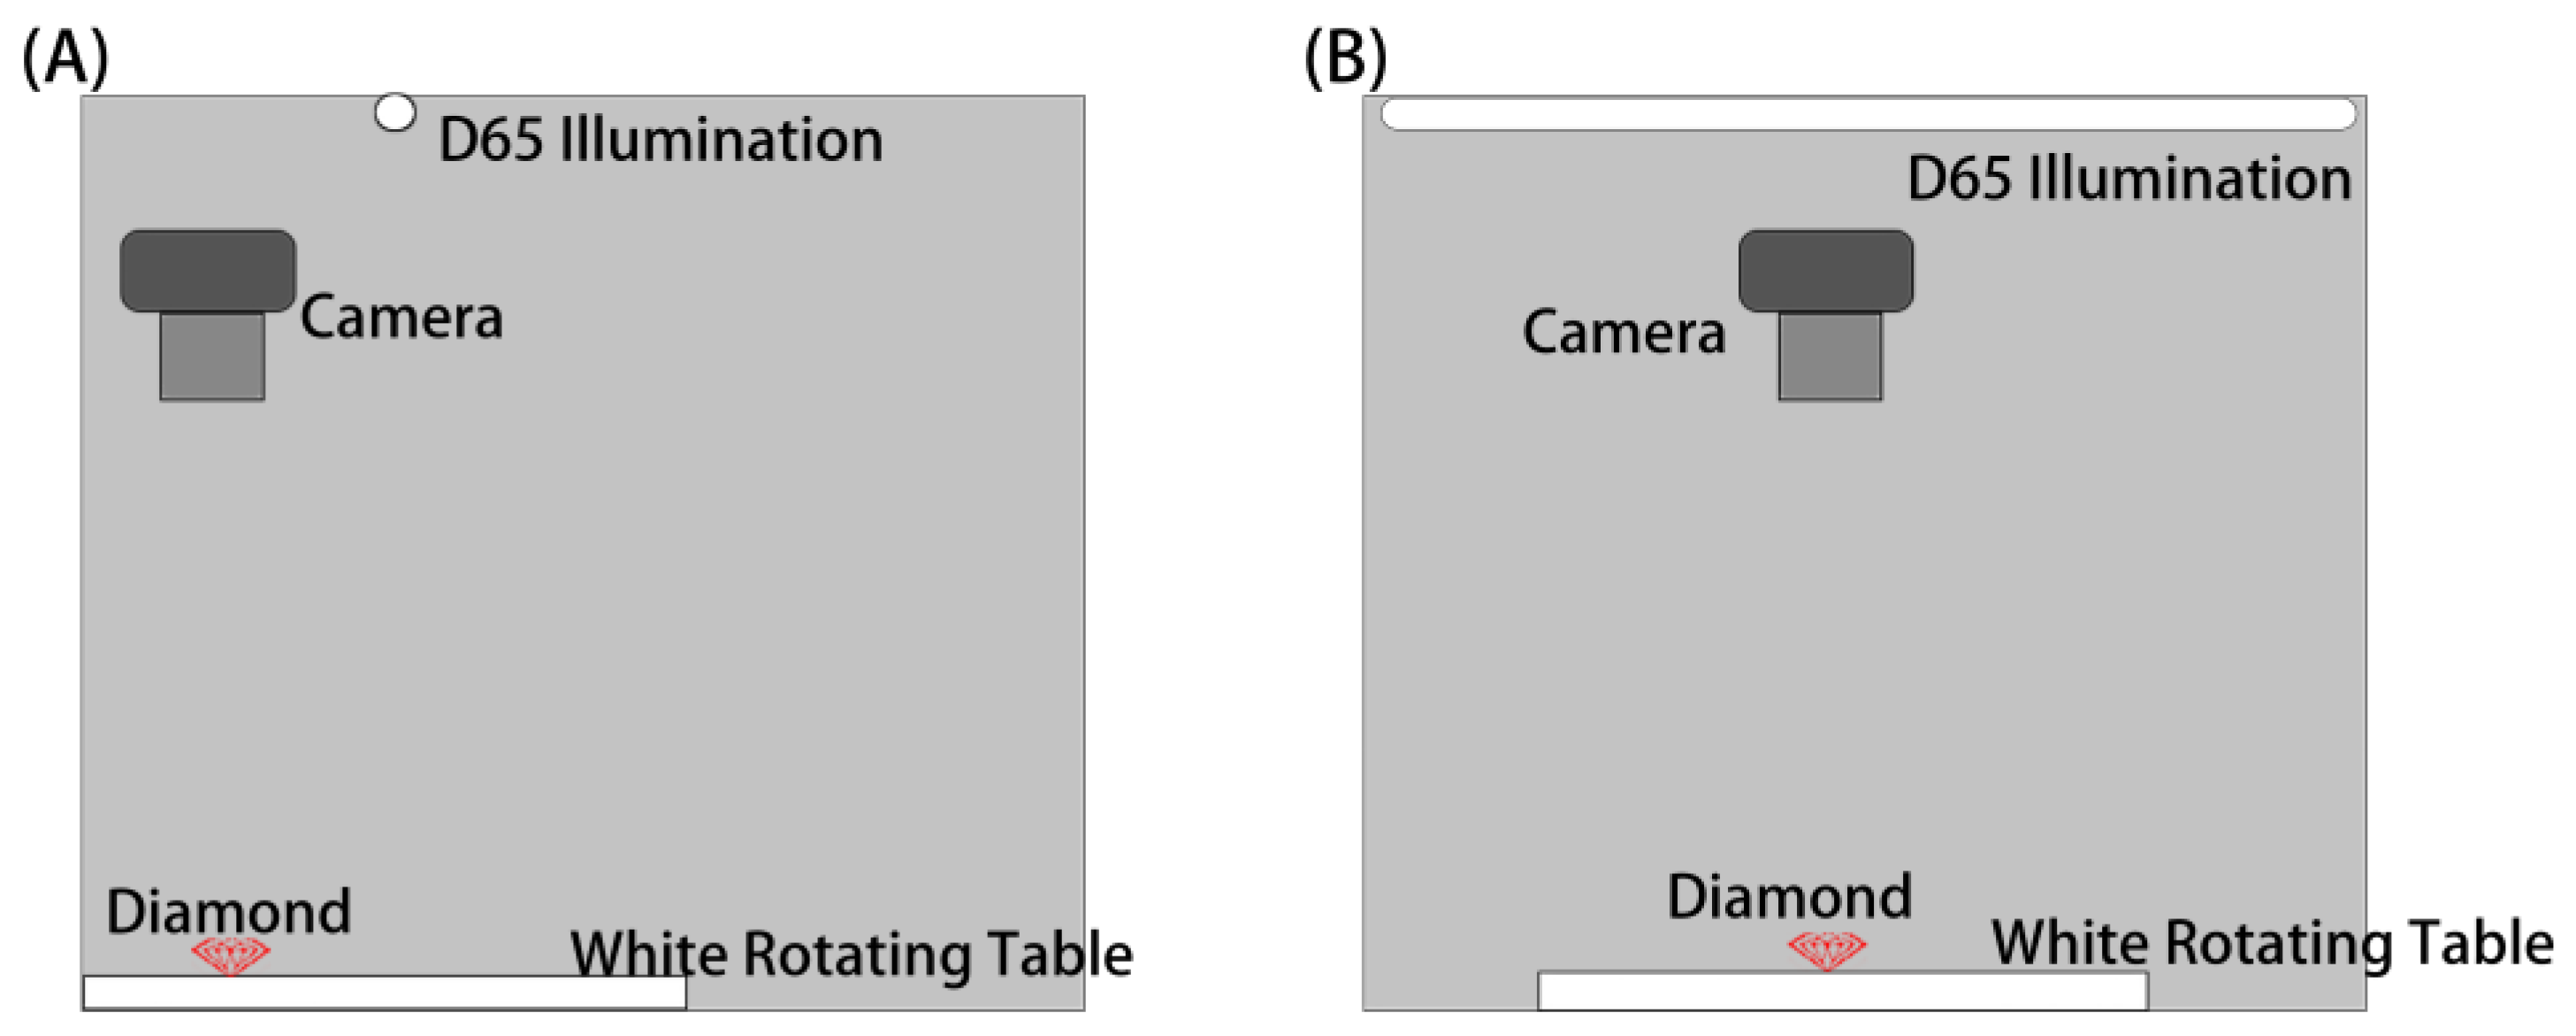
2.2. Diamond Images

The diamonds were placed face-up on a white rotating table marked with a scale from 0° to 360° in a standard light source box. The box has the following advantages [35]:
  • It can provide various illuminants.
  • Its size allows the observer to observe the diamonds at what is an optimal viewing distance of the diamonds from both the light source and the observer.
  • It provides adequate shielding from extraneous light.
  • It is deep enough to eliminate color distractions from the surrounding area.
  • Its interior color is Munsell “N7 neutral gray,” which can reduce color contrasts between the diamonds and the background.
The diamonds were exposed to the CIE standard illuminant D65, which simulated daylight with a correlated color temperature of approximately 6500 K. The relative spectral power distribution was extrapolated based on the measured daylight data. This is the best illumination for evaluating a gemstone’s color [37,38]. The illumination parameters where the diamonds were positioned were measured by a chroma meter (CL200, Minolta, Japan), with the following results:
  • Illuminance: Ev = 1011 lx
  • Chromaticity coordinates: u’ = 1976; v’ = 4784
  • Tristimulus value: X = 978; Y = 1052; Z = 1012
The CIE color system is a color mixture system based on the fundamental that each color can be made from a mixture of three primary colors in a certain proportion. The number of the three primary colors required to match the color to be measured is known as the tristimulus value. X, Y, and Z are the tristimulus values defined in the CIE 1931-XYZ system and are widely used in other color systems; u’, v’ are the chromaticity coordinates obtained from X, Y, and Z [15].
The diamonds were photographed using a Canon EOS 200D at ISO 640, f/6.3, and 1/200 s. The observer (camera) and illumination were held still, and the diamonds were rotated counterclockwise from 0° to 105° at 15° intervals. They were parallel to the stage during the rotation. Eight images were taken at each chosen angle for every diamond (Figure 1).
Each diamond image was set to 500 × 500 pixels using Adobe Photoshop CC2018. In order to calculate the color difference between pixels of adjacent rotation angle images, and eight images of each diamond were rotated to the same position as the first image. For example, when Dia 1708 was not rotated (rotation angle = 0°), the first image was recorded as Dia 1708-1; the second image (recorded as Dia 1708-2) was rotated counterclockwise by 15°. Dia 1708-2 was then rotated clockwise by 15° to its original orientation, i.e., that of Dia 1708-1. Dia 1708-3, Dia 1708-4, Dia 1708-5, Dia 1708-6, Dia 1708-7, and Dia 1708-8 were similarly reoriented for evaluation (Figure 2A).

2.3. Digital Image Information

2.3.1. Calculation of Color Difference

The corresponding pixels and color differences in adjacent rotation angle images were calculated via the CIE DE2000 color difference formula [39,40,41].
ΔE00 = {[ΔL’/(kLSL)]2 + [ΔC’/(kCSC)]2 + [ΔH’/(kHSH)]2 + RT[ΔC’/(kCSC)] [ΔH’/(kHSH)]}1/2.
In Equation (1), ΔE00 is the total color difference calculated with CIE DE2000. The terms ΔL’, ΔC’, and ΔH’ are the CIE Lab metric lightness, chroma, and hue differences, respectively. While the terms SL, SC, and SH are the weighting functions for the lightness, chroma, and hue components, respectively. The calculated values vary according to the positions of the color pair being considered in CIELab color space [40,41].
SL = 1 + 0.015 (Lm’ − 50)2/[20 + (Lm’ − 50)2]1/2
SC = 1+ 0.045Cm
SH = 1+ 0.015Cm’T.
T = 1 − 0.17cos(hm’ − 30) + 0.24cos(2hm’) + 0.32cos(3hm’ + 6) − 0.20cos(4hm’ − 63).
where Lm’, Cm’, and hm’ respectively represent the arithmetic mean values of the lightness, chroma, and hue of the color sample and the standard color sample calculated by CIE DE2000.
The kL, kC, and kH values are parametric factors that are adjusted according to different viewing parameters for the lightness, chroma, and hue components, respectively. RT is intended to improve the performance of the color difference equation for fitting chromatic differences in the blue region [42]. In gemology, kL = kC = kH = 1 [38].
RT = −sin(2Δθ)RC,
Δθ = 30exp{−[(hm’ − 275)/25]2},
RC = 2[Cm7/(Cm7 + 257)]1/2.
RT is intended to improve the performance of the color difference equation for fitting chromatic differences in the blue region [42]. Δθ is the rotation angle determined by the hue angle, and RC is the rotation amplitude according to the change in chroma [41].
The color difference was calculated via a program written in MatLab r2014a software (MathWorks, USA). Two images of the same diamond were opened in the software and the color parameters (L, a, b) of the images could be read and be converted into L (lightness), C (chroma), h (hue). Then the color difference of the corresponding pixels was calculated by the Equation (1). The results were exported as an Excel spreadsheet and used to draw the color difference images. Each diamond could produce seven Excel spreadsheets and seven color difference images of the 0° image and 30° image, 30° image and 60° image, 60° image and 90° image, 90° image and 120° image, and 120° image and 150° image (labeled SD1-2, SD2-3, SD3-4, SD4-5, SD5-6, SD6-7, and SD7-8, respectively, in Figure 2A).

2.3.2. Determining the Color Difference Interval Threshold

A very small color change would cause a large color difference value change, and the color space was not uniform, so it was necessary to divide the color difference into several intervals for further analysis. We borrowed McAdam’s method of determining the boundary of McAdam’s ellipse to determine the threshold of the color difference interval [24]. With the NBS as the unit which derived using the CIE 1964 uniform color space color difference formula, when the color difference value is 1.5–3.0 NBS, and the human eye can detect the color change. When the color difference value is 3.0–6.0 NBS, the human eye can recognize the color change. When the color difference value is 6.0–12.0 NBS, the human eye can perceive a large color change. When the color difference value is > 12 NBS, the human eye can perceive a very large color change [15]. The color difference results calculated using different color difference formulas were different, thus the color difference formula used must be noted when performing the calculation. Each group of data was divided into several different color difference intervals based on the large color changes that the human eye can perceive using the CIE DE2000 color difference formula (Figure 2B). The color difference could be further analyzed by the standard deviation to determine the threshold of the color difference intervals [24].
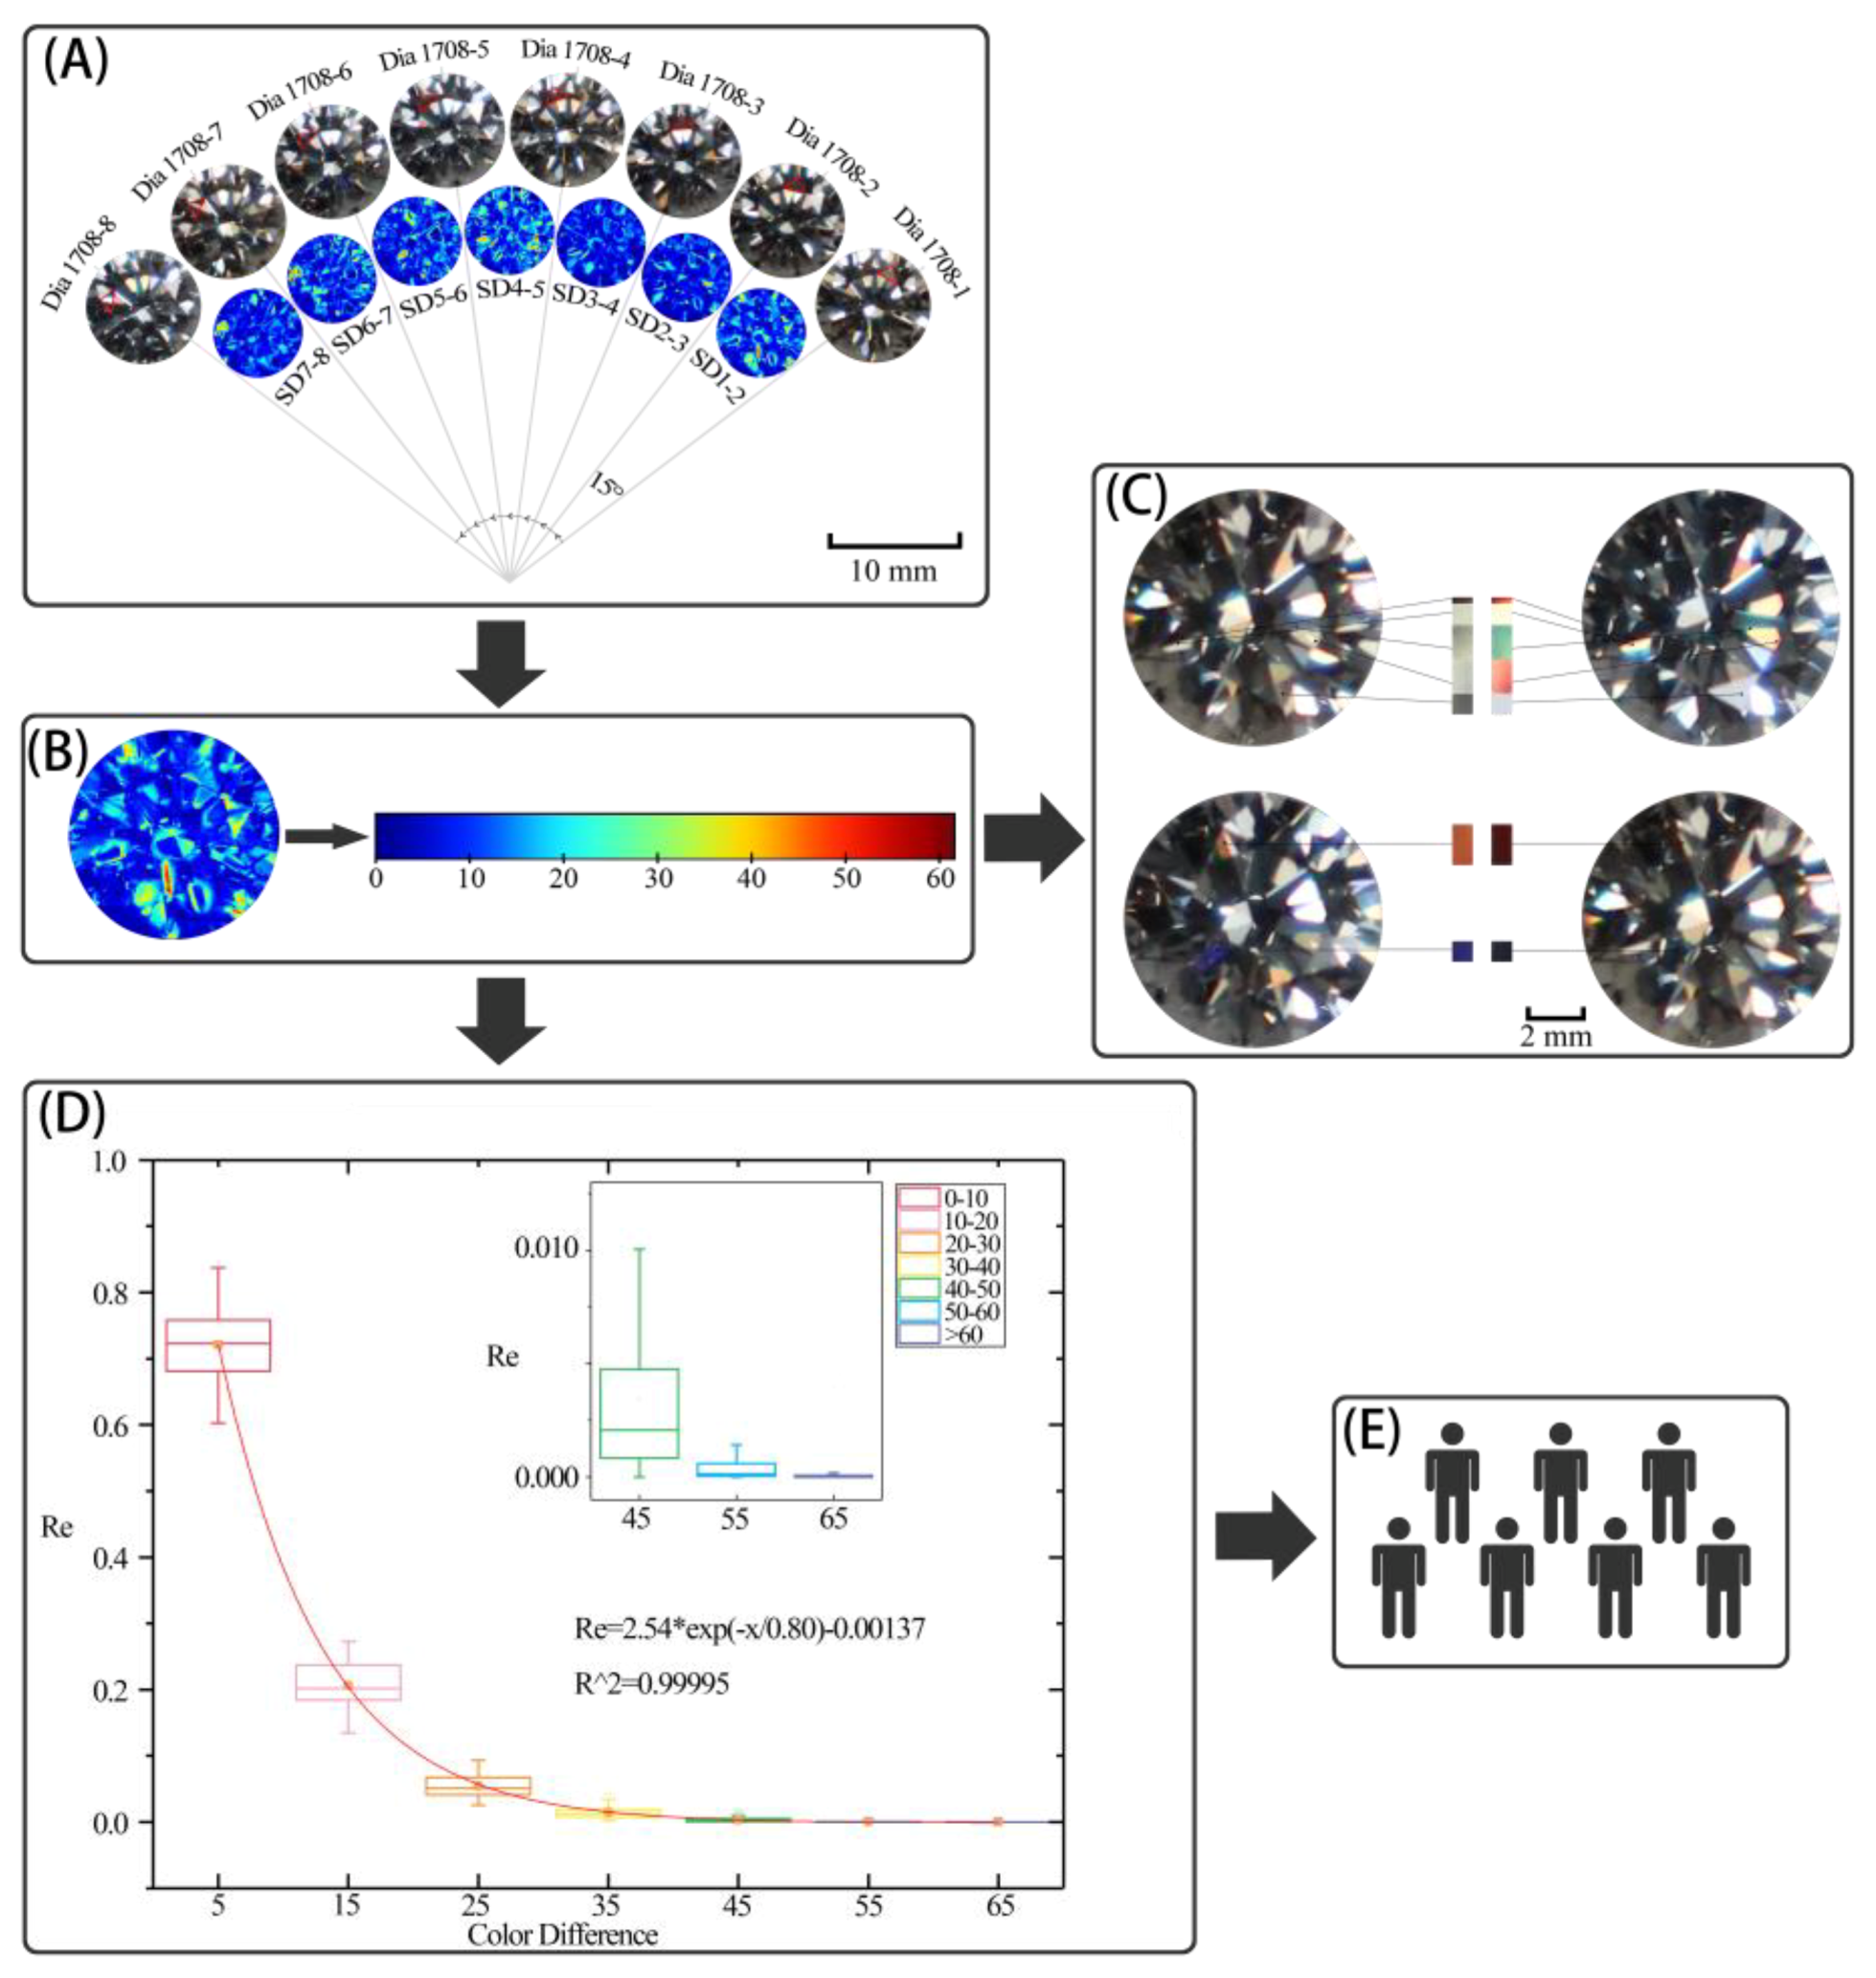
  • Contrasting blocks: Eighteen pairs of areas with a very large color change were selected (Figure 2C). These were mainly changed in hue and lightness. Each area contained 3 × 3 to 20 × 20 pixels. These color areas were referred to as contrasting blocks. For example, C-A1 and C-B1 were a pair of contrasting blocks. Portions of selected contrasting blocks are listed in Table 1 (labeled C).
  • Standard blocks: The color was selected at the center of each contrasting block. The color blocks of the same size as the corresponding contrasting blocks were produced according to the selected color’s parameters using Adobe Photoshop CC2018. These blocks were called standard blocks (labeled S in Table 1). Thus, S-A1 was the standard blocks of C-B1.
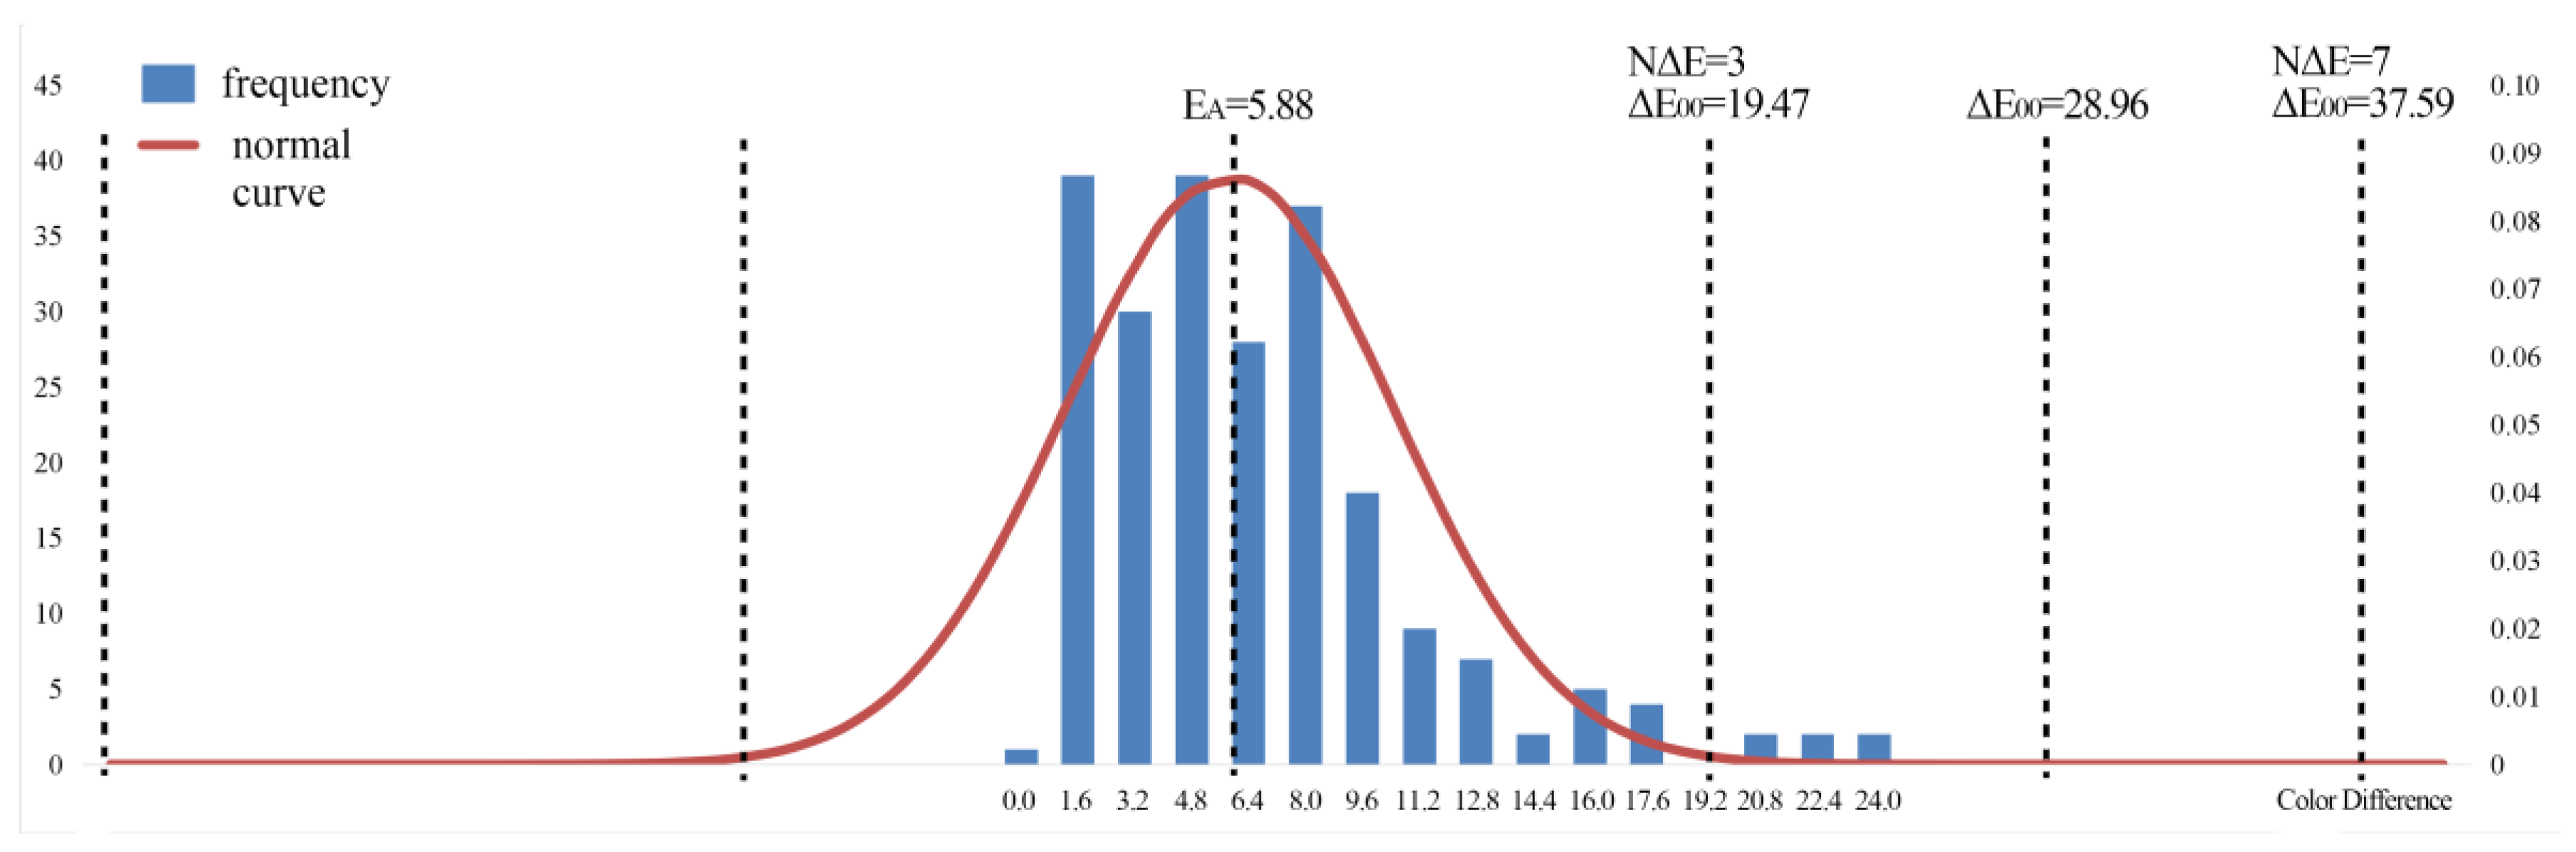
  • Normal distribution: The color difference between each contrasting block and the standard block (such as C-A1 and S-A1) was calculated via the program written in MatLab r2014a and output as an Excel spreadsheet that obeyed the normal distribution N (ΔEA, ΔESD2) (Figure 3). Here, ΔESD represents the standard deviation of the color difference, and ΔEA represents the average of the color difference. Thus, there was a total of 36 Excel spreadsheets.
  • Color difference: The color difference between each pair of contrasting blocks (such as C-A1 and C-B1) was calculated and output as an Excel spreadsheet. There was a total of 18 Excel spreadsheets. Each pair of contrasting block color difference was represented by each spreadsheet’s average color differences (ΔE). Each pair of contrasting blocks contained two kinds of standard color, and thus each color difference value corresponded to two standard blocks (such as S-A1 and S-B1).
  • NΔE: NΔE was calculated, meaning that ΔE was on the order of a normal distribution N (ΔEA, ΔESD2).

2.4. Evaluation of Scintillation by Entropy Method

After the threshold of the color difference intervals was determined, the percentage of the number of data in each color difference interval to the number of all data was calculated.
Re = me/m*
In Equation (9), me represents the amount of the data in the specific color difference interval e, and m* represents the amount of all of the data.
During rotation, the largest degree of brightness and fire color represented the diamond’s scintillation quality. The Re value of the spreadsheet with the largest standard deviation among the seven Excel spreadsheets produced by a given diamond’s eight images was selected as the basis for quantitatively evaluating the diamond scintillation. All of the diamond data that were ultimately used for calculation were plotted in a box map (Figure 2D). The color difference indicated the change of brightness and fire color; the percentage of the number of data in each color difference interval to the number of all data (Re) was indicated by the area of the color change. Re was found to decrease with increasing color difference intervals.

2.5. Evaluation of Scintillation by Naked Eye

The objective evaluation results obtained by the entropy method required verification by visual evaluation. It was difficult to directly evaluate the diamond scintillation when they were rotated. The eight images of each diamond were made into a GIF animation with each image having a dwell time of 1 s. The sixty-six diamonds were divided into ten groups on average based on the cut. The diamond scintillation was determined by the changes to the degree and area of the diamonds’ fire color and brightness. The sixty-six diamonds were evaluated by seven experienced graders with professional knowledge, each of whom had received the diploma of HRD Antwerp Certified Diamond Grader. The final results of evaluating diamond scintillation by the naked eye was the dominant evaluation of the seven observers (Figure 2E). Each observer was required to be in good health with normal vision, aged 22–24 years, and to have extensive experience. The criteria of the naked eye observations were the following:
  • Excellent (EX): The diamond was extremely bright with extremely high fire. The changes in the diamond table’s brightness and fire color were extremely obvious when the diamond was rotated.
  • Very good (VG): The diamond was very bright with a great deal of fire. The changes in the diamond table’s brightness and fire color were quite obvious when the diamond was rotated.
  • Good (G): The diamond was quite bright with some fire. The changes in the diamond table’s brightness and fire color were obvious when the diamond was rotated.
  • Fair (F): The diamond was bright with some fire. The changes in the diamond table’s brightness and fire color were obvious when the diamond was rotated.
  • Poor (P): The diamond was not bright with little fire. The changes in the diamond table’s brightness and fire color were not obvious when the diamond was rotated.

3. Results and Discussion

3.1. Division of Color Difference Interval

The larger the NΔE, the easier it is for the human eye to perceive color change. When NΔE > 3, the human eye exactly perceives the color change. When NΔE > 7, the human eye very obviously perceives the color change [43], and the corresponding color difference could be used as the threshold for dividing the color difference interval. Table 1 lists the group when NΔE ≤ 7.
The color difference values, ΔE, were similar for some pairs of contrasting blocks while the NΔE values were different. For instance, the color difference of the fourth group (28.02) was similar to that of the sixth group (28.96), while the maximum NΔE of the fourth group (4.82) was significantly different than that of the sixth group (18.43).
For a given pair of color changes, the NΔE was different if the change direction was different. For example, in the first pair of color changes, NΔE was 6.95 when changing from A1 to B1; when changing from B1 to A1, NΔE was 25.42. This indicated that the human eye should perceive a higher level of diamond scintillation when B1 changed to A1.
When NΔE ≤ 7, the maximum of ΔEA for the diamond was 10.49; hence, the minimum of the color difference that the human eye could perceive significant color change was 10.49. For convenience of calculation, 10 was set as the color difference threshold. Each group color difference of two adjacent images was divided into 0–10, 10–20, 20–30, 30–40, 40–50, 50–60, and > 60, and thus there were seven color difference intervals.

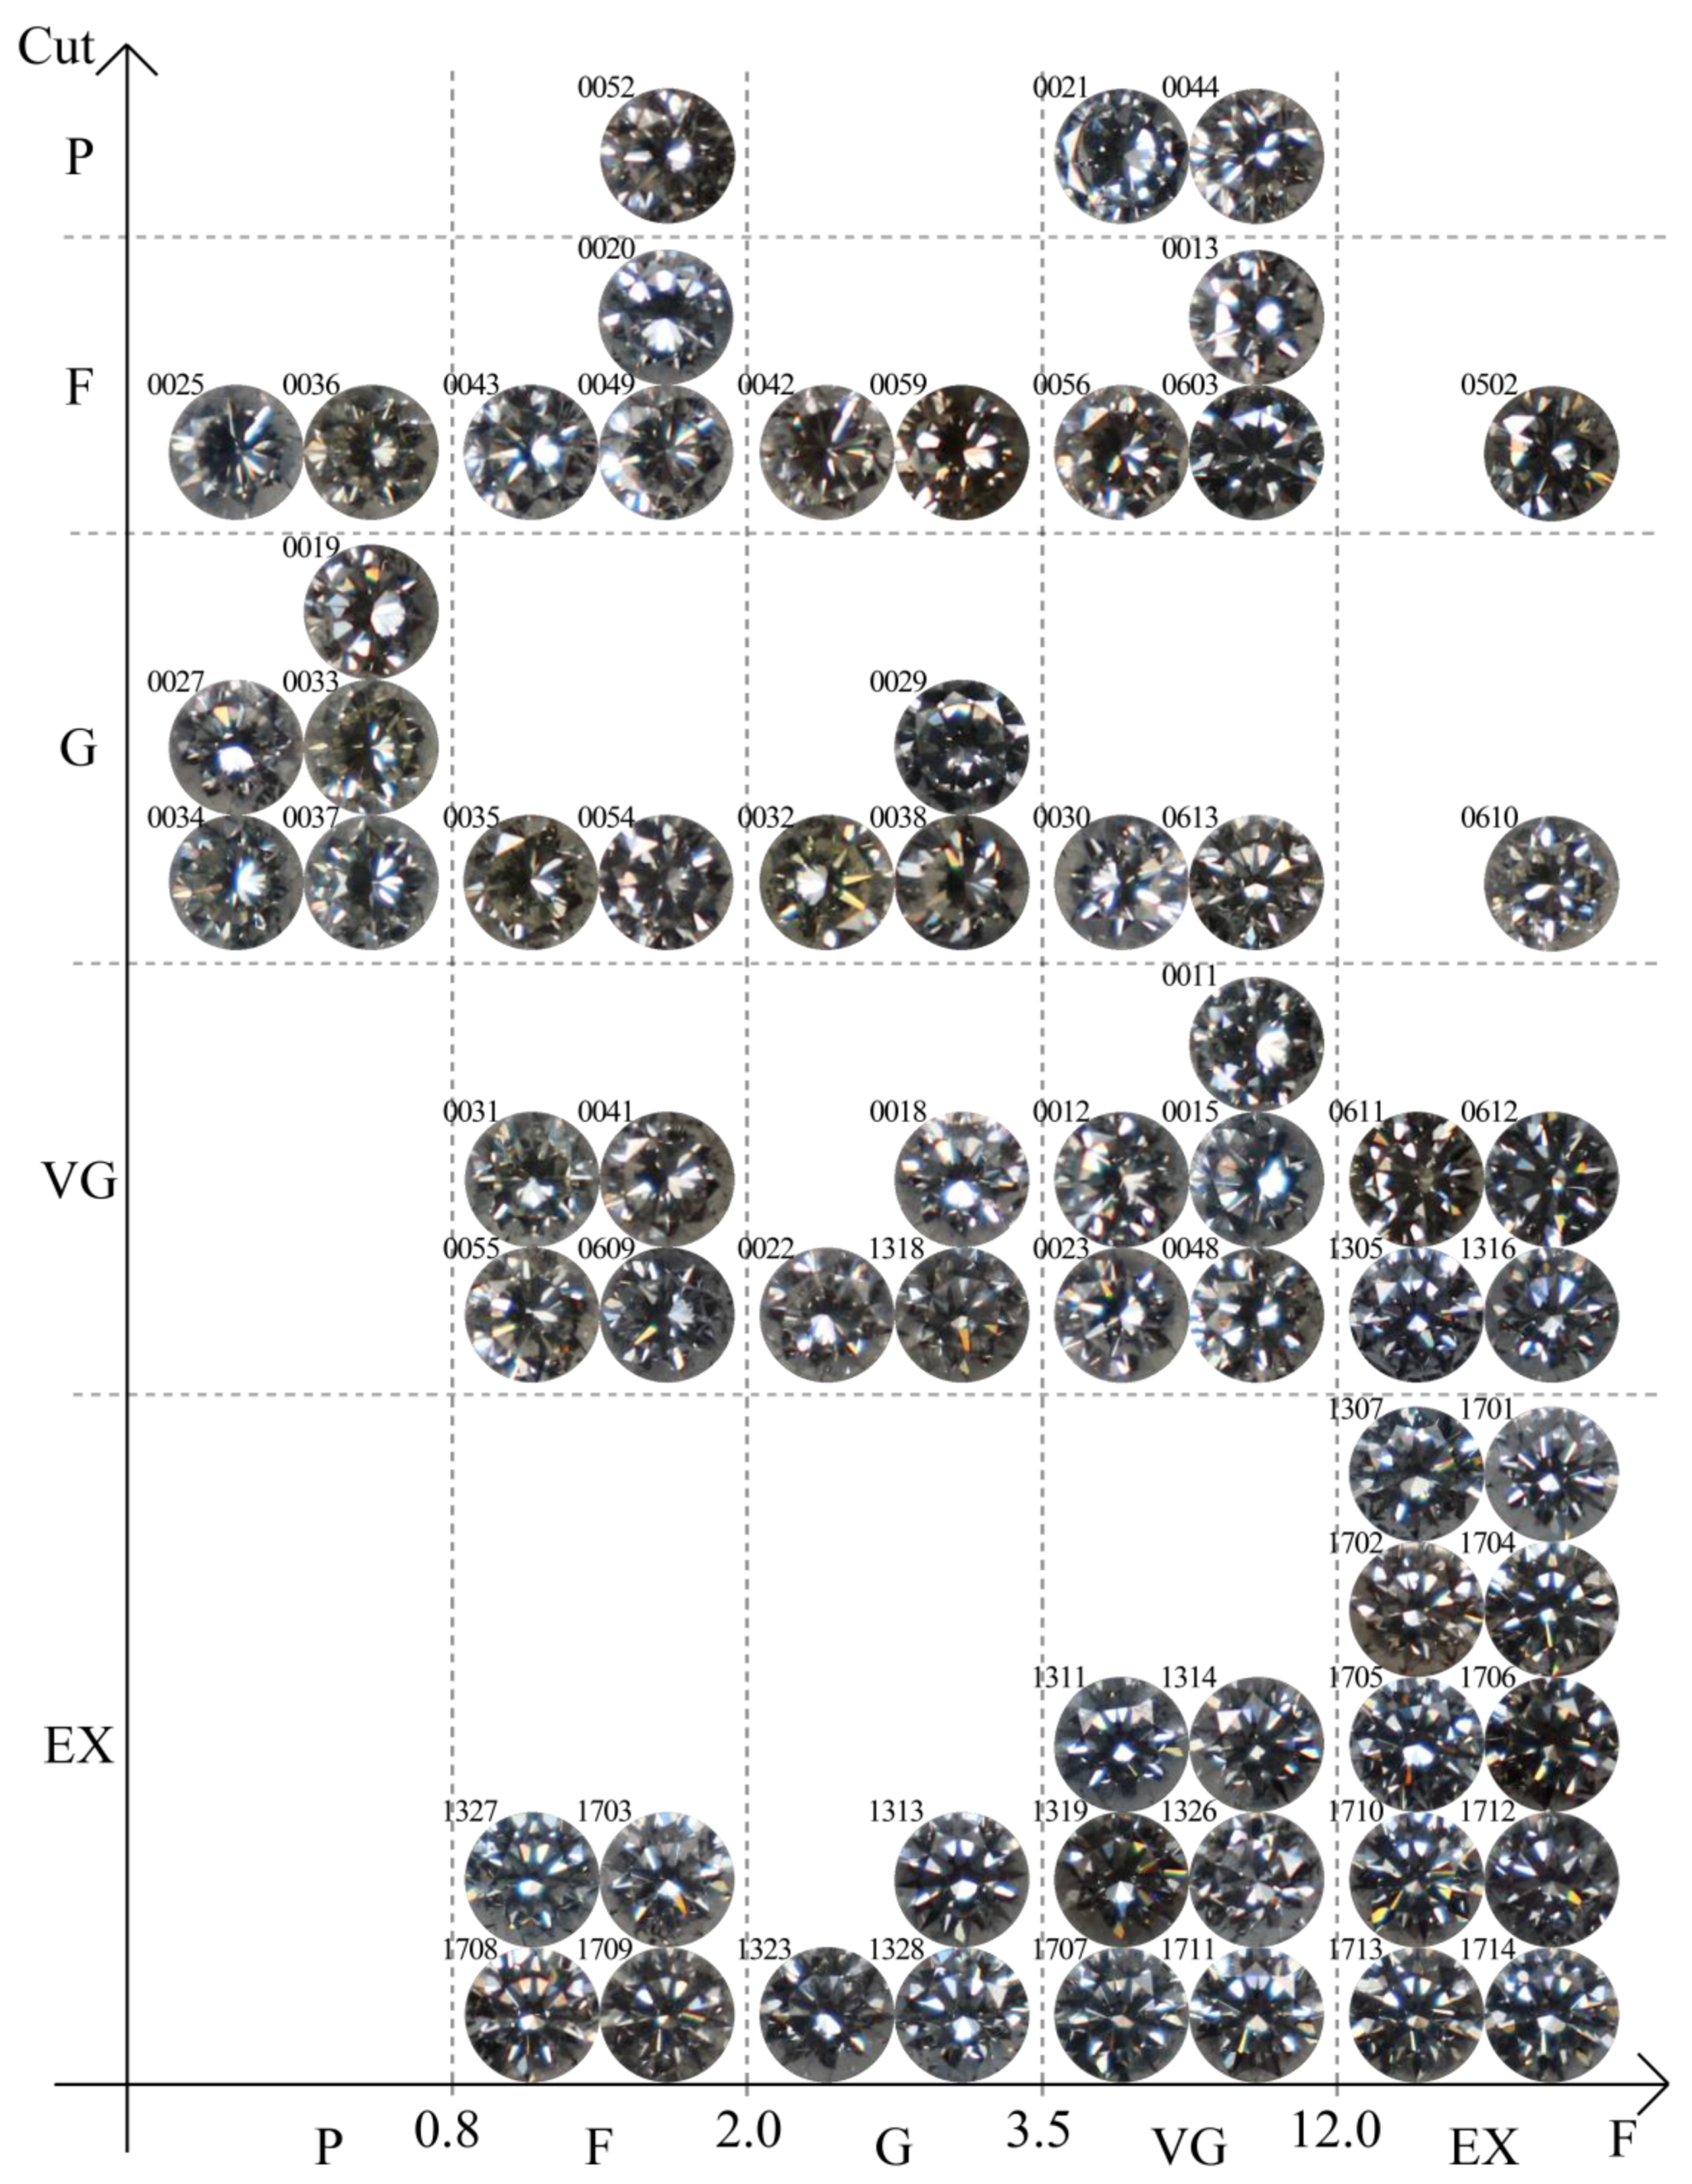
3.2. Comparison of Results by Entropy Method and by Naked Eye

The color difference exerted different impacts on the diamond scintillation. The diamond scintillation was quantitatively classified into five levels—EX, VG, G, F, and P—using the entropy method. The seven color difference intervals were identified for each of the 66 diamonds. Here, xij represents the NO. j percentage of the NO. i diamond.
Each variable was normalized. Different Re could either inhibit the diamond scintillation or promote it. Variables that had inhibitory effects were described as having a negative index, while those that promoted scintillation were described as positive. A higher positive index implied a better promotion effect.
Positive index:
x’ij = {[xij – min(x1j, x2j, … xnj)]/[ max(x1j, x2j, … xnj) − min(x1j, x2j, … xnj)]} × 100
Negative index:
x’ij = {[ max(x1j, x2j, … xnj) − xij]/[ max(x1j, x2j, … xnj) − min(x1j, x2j, … xnj)]} × 100
To facilitate the calculation, let xij’ = xij.
Calculate the proportion of the NO. i diamond’s NO. j percentage using the following:
p ij =   x ij i   =   1 66 x ij ,   ( i = 1 ,   2 ,   ,   66 ;   j = 1 ,   2 ,   ,   7 )
Calculate the entropy value of the NO. j percentage, that was, the dispersion of R0-10, R10-20, … R> 60.
e j =   k i   =   1 66 [ p ij ln ( p ij ) ] ,   k   >   0 ,   k = 1 [ ln ( 66 ) ] ,   e j 0
The difference coefficient of the NO. j percentage defined in Equation (14) was calculated. For the NO. j percentage, a larger difference between the color difference intervals implied a smaller entropy value, and a correspondingly greater impact on the evaluation of the diamond scintillation.
g j   =   1 e j 10 E e ,   0 g j 1 ,   j   =   1 7 g j = 1 ,   E e =   j   =   1 7 e j
Calculate gj of the NO. j color difference interval to account for all the difference in coefficient weights:
w j =   g j j   =   1 7 g j   ( 1 j 7 )
The composite score for each diamond was the sum of the proportional difference of the color difference percentages between adjacent images multiplied by its weighted entropy. The larger the composite score, the stronger the diamond scintillation:
S i =   j   =   1 7 ( w j   ×   p ij ) ,   ( i = 1 ,   2 ,   ,   66 ) ,
F = 1000   ×   S i .
The F value was divided into different intervals according to its magnitude; each interval corresponds to a different diamond scintillation quality. The evaluation criteria are listed below:
  • F < 0.8: The diamond scintillation under the D65 illumination was P.
  • 0.8 ≤ F < 2.0: The diamond scintillation under the D65 illumination was F.
  • 2.0 ≤ F < 3.5: The diamond scintillation under the D65 illumination was G.
  • 3.5 ≤ F < 12: The diamond scintillation under the D65 illumination was VG.
  • F ≥ 12: The diamond scintillation under the D65 illumination was EX.
The results are shown in Figure 4. Under these conditions, the consistency and similarity were 51.51% and 92.42%, respectively, for the results evaluated by the entropy method versus those by the naked eye.
  • Consistency: Implied that the results achieved via the two methods were comparable.
  • Similarity: Meant that they were at the same grade or differed by one level.

3.3. Factors Affecting Diamond Scintillation

The Re value with the largest standard deviation among the seven groups of color differences produced by each diamond’s images was selected as the basis to quantitatively evaluate the diamond scintillation. The percentage of the lightness difference (ΔL), chroma difference (ΔC), and hue difference (Δh) for each group was calculated and recorded as Rl, Rc, and Rh, respectively (the calculation method was similar to the method used for calculation of Re and the interval threshold was also 10). The Pearson correlation coefficients of Re with Rl, Rc, and Rh were analyzed separately in order to determine the factors that affected the non-fancy-colored round brilliant diamond scintillation.

3.3.1. The Main Factors Affecting Diamond Scintillation

Rl, Rc, and Rh were significantly correlated with Re. The 100% diamond correlation of Rl and Re were the highest of the three; the 56.06% diamond correlation of Rc and Re were second only to that of Rl and Re; the 19.70% diamond correlation of Rh and Re were second only to the that of Rl and Re; the 24.24% diamond correlation of Re with Rc, and Re with Rh were equal. Lightness, chroma, and hue all significantly affected the diamond scintillation, with lightness being the main factor. Diamond hue was primarily influenced by dispersion, which could cause the diamond to produce colored light resembling a rainbow. The lightness was mainly influenced by its refractive index, and the chroma was influenced by a variety of factors, mainly the refractive index and dispersion. The diamond maximizes its reflective ability after being cut and polished, so most of its surface could reflect white light. Therefore, the area of brightness changed greatly during the rotation process. Although the dispersion of the diamonds was also strong, the area of hue change was much smaller than that of lightness change because of the more stringent criterion of hue change compared with lightness change.

3.3.2. Discussion on the Higher Evaluation Level by the Entropy Method

The evaluation results by the naked eye were subjectively affected by the observer. Specifically, 21.21% diamonds’ evaluation results by the entropy method were one level higher than the results obtained by the naked eye. Among these diamonds, the Pearson correlation coefficients of Re with Rl, Rc, and Rh were not the same (Figure 5A), and were all in the middle range of the correlation of all the diamonds (Figure 5C). For example, the correlation of Re and Rc for all the diamonds ranged from 0.942–0.992, while that of the diamonds, whose evaluation results by the naked eye were one level lower than the results by the entropy method, ranged from 0.957–0.986. Since the influence of Rl on Re was significantly higher than the influence of either Rc or Rh, only the influence of chroma and hue on the evaluation results was discussed here. When the degrees of influence of Rc and Rh on Re were in the moderate range and different, the diamond scintillation perceived by the naked eye could be weaker than that by the entropy method.

3.3.3. Discussion on the Lower Evaluation Level by the Entropy Method

18.18% diamonds’ evaluation results by the entropy method were one level lower than that by the naked eye. In these diamonds, the Pearson correlation coefficients of Re and Rh were the lowest (Figure 5B). Different color changes were perceived by the human eye during observing different areas in the color space with same color difference value. The human eye was more sensitive to the perception of lightness. Therefore, the human eye could perceive a stronger scintillation than the objective evaluation by the entropy method due to the hue had little effect on the color change.

4. Conclusions

This study proposed a method combining the entropy method and color difference formula to quantitatively evaluate non-fancy-colored round brilliant diamond scintillation. The color difference of corresponding pixels in two adjacent rotation angle images was calculated using a MatLab r2014a program during the in situ rotation of non-fancy-colored round brilliant diamonds (color changes of fire and brightness during diamond rotation). Each group color difference of two adjacent images was divided into seven color difference intervals with a threshold of 10. The percentage of the number of data in each color difference interval to the number of all data (the area of the color change) was comprehensively analyzed using the entropy method in order to evaluate diamond scintillation quantitatively and objectively.
The Pearson correlation coefficients of color difference percentage with lightness difference percentage, chroma difference percentage, and hue difference percentage in each interval were analyzed separately. The results revealed that the lightness difference percentage, chroma difference percentage, and hue difference percentage were significantly correlated with color difference percentage, with correlation coefficients ranging from 0.979–1.000, 0.942–0.992, and 0.937–0.992, respectively. The correlation coefficient of lightness difference percentage and color difference percentage was the highest among the three coefficients in each diamond sample. Therefore, lightness was the main factor affecting the diamond scintillation while chroma and hue also significantly affected it.

Author Contributions

Conceptualization and investigation, F.L. and Y.G.; methodology, formal analysis and data curation, G.C., S.L., Y.G., and F.L.; writing—original draft preparation, F.L., G.C., and S.L.; writing—review and editing, F.L. and Y.G. All authors have read and agreed to the published version of the manuscript.

Funding

This research received no external funding.

Acknowledgments

We would like to thank the Diamond Grading Laboratory of the China University of Geosciences (Beijing) for providing the samples, and the seven experienced graders for evaluating the samples. Thanks to lab instructor Yu Zhang for her patient guidance during the experiment. We also thank the LetPub editor for polishing the English used in this manuscript.

Conflicts of Interest

The authors declare no conflict of interest.

References

  1. Ragozin, A.; Zedgenizov, D.; Shatsky, V.; Kuper, K.; Hiroyuki, K. Deformation Features of Super-Deep Diamonds. Minerals 2020, 10, 18. [Google Scholar] [CrossRef] [Green Version]
  2. Shchukina, E.V.; Shchukin, V.S. Diamond Exploration Potential of the Northern East European Platform. Minerals 2018, 8, 189. [Google Scholar] [CrossRef] [Green Version]
  3. Moses, T.M.; Johnson, M.L.; Green, B.; Blodgett, T.; Cino, K.; Geurts, R.H.; Gilbertson, A.M.; Hemphill, T.S.; King, J.M.; Kornylak, L.; et al. A Foundation for Grading the Overall Cut Quality of Round Brilliant Cut Diamonds. Gems Gemol. 2004, 40, 202–228. [Google Scholar] [CrossRef] [Green Version]
  4. Sasián, J.M.; Yantzer, P.; Tivol, T. The Optical Design of Gemstones. Opt. Photonics News 2003, 14, 24–29. [Google Scholar] [CrossRef]
  5. Sasian, J.; Quick, J.; Sheffield, J.; Caudill, J.; Yantzer, P. Evaluation of brilliance, fire, and scintillation in round brilliant gemstones. Opt. Eng. 2007, 46, 093604. [Google Scholar]
  6. Gilbertson, A. Optimizing Face-Up Appearance in Coloured Gemstone Faceting. Gems Gemol. 2013, 49, 64–81. [Google Scholar] [CrossRef]
  7. Liu, P.P.; Yuan, X.Q.; Shi, B.; Wang, Y.J. Study on Measuring Brilliance of Round Brilliant Cut Cubic Zirconia under Ring Light. J. Gems Gemol. 2014, 16, 62–69. [Google Scholar]
  8. Liu, P.P.; Yuan, X.Q.; Shi, B. Feasibility Study on Evaluation of Fire in Round Brilliant Cut Diamond. J. Gems Gemol. 2016, 18, 47–54. [Google Scholar]
  9. Liu, P.P.; Yuan, X.Q.; Ang, N.; Shi, B. A Method for Quantitative Evaluation of Scintillation in Round Brilliant Diamond. J. Gems Gemol. 2016, 18, 9–17. [Google Scholar]
  10. Shi, B.; Yuan, X.Q. Study on Emulation Model and Principle of Optical Effect of Brilliant Cut Diamond. J. Gems Gemol. 2007, 9, 8–12. [Google Scholar]
  11. Shi, B.; Yuan, X.Q. Principle and Application of Automatic Diamond Cut Measuring System. J. Gems Gemol. 2007, 9, 5–8. [Google Scholar]
  12. Shi, B.; Yuan, X.Q. Numerical Method on Inclination of Star Facet, Upper and Lower Girdle Facets of Round Brilliant Cut. J. Gems Gemol. 2010, 12, 40–47. [Google Scholar]
  13. Xu, Y.; Yuan, X.Q.; Shi, B.; Xu, X. Research on Auto-Building 3-D Analytic Model about Round-Brilliant-Cut Diamond with Computer. J. Gems Gemol. 2010, 12, 35–38. [Google Scholar]
  14. Wang, Y.J.; Shi, B.; Yuan, X.Q. Measurement Precision of DC2000 Diamond Proportion Analyzer. J. Gems Gemol. 2011, 13, 47–51. [Google Scholar]
  15. Tang, S.Q. Colorimetry, 1st ed.; B. Inst. Technol. Press: Beijing, China, 1990; pp. 96–97. [Google Scholar]
  16. Guo, Y.; Zhang, J.; Mo, T. Contribution of Green Jadeite-Jade’s Chroma Difference Based on CIE 1976 L* a* b* Uniform Colour Space. Adv. Mater. Res. 2010, 177, 620–623. [Google Scholar] [CrossRef]
  17. Guo, Y.; Zhang, J.; Mo, T. Quality Evaluation of Green Jadeite-jade’s Lightness Based on CIE 1976 L* a* b* Uniform Colour Space. Bull. Chin. Ceram. Soc. 2010, 29, 560–566. [Google Scholar]
  18. Guo, Y.; Wang, H.; Du, H.M. The Foundation of Colour-Chips Evaluation System of Jadeite-Jade Green with Colour Difference Control of Medical Device. Multimed. Tools. Appl. 2016, 75, 14491–14502. [Google Scholar] [CrossRef]
  19. Guo, Y. Quality evaluation of tourmaline red based on uniform colour space. Clust. Comput. 2017, 20, 3393–3408. [Google Scholar] [CrossRef]
  20. Guo, Y.; Zhang, X.Y.; Li, X.; Zhang, Y. Quantitative Charaterization Appreciation of Golden Citrine Golden by the Irradiation of [FeO4]4-. Arab. J. Chem. 2018, 918–923. [Google Scholar]
  21. Guo, Y.; Zong, X.; Qi, M.; Zhang, Y.; Wang, H. Feasibility study on colour evaluation of jadeite based on GemDialogue colour chip images. EURASIP J. Image Video Process. 2018, 95. [Google Scholar] [CrossRef] [Green Version]
  22. Cristina, G.P.; Javier, M.; Miguel, G.P.; Ana, M.C. Comparison of the CIELab and CIEDE 2000 Color Difference Formulas on Gingival Color Space. J. Prosthodont. 2020, 29, 401–408. [Google Scholar]
  23. Cristina, G.P.; Javier, M.; Ana, M.C. Comparison of two color-difference formulas using the Bland-Altman approach based on gingiva color space. Odontology 2019, 107, 72–79. [Google Scholar]
  24. MacAdam, D.L. Visual Sensitivities to Colour Differences in Daylight. J. Opt. Soc. Am. 1942, 32, 247–273. [Google Scholar] [CrossRef]
  25. MacAdam, D.L. Specification of Small Chromaticity Differences. J. Opt. Soc. Am. 1943, 33, 18–26. [Google Scholar] [CrossRef]
  26. MacAdam, D.L. Metric coefficients for CIE colour-difference formulas. Color Res. Appl. 1985, 10, 45–49. [Google Scholar] [CrossRef]
  27. Berns, R.S.; Alman, D.H.; Reniff, L.; Snyder, G.D.; Balonon-Rosen, M.R. Visual determination of suprathreshold colour-difference tolerances using probit analysis. Color Res. Appl. 1991, 16, 297–316. [Google Scholar] [CrossRef]
  28. Wang, Z.H.; Xu, H.S. Investigations for Weighting Functions of Colour-Difference Formulae Based on Small Suprathreshold Colour Differences. Acta Optica Sin. 2008, 6, 1215–1219. [Google Scholar] [CrossRef]
  29. Wang, Z.H.; Xu, H.S. Evaluation of Colour-Difference Formulae Based on the Correlation between Visual Tolerances and Hue Angles. Acta Optica Sin. 2009, 7, 1838–1841. [Google Scholar] [CrossRef]
  30. Shen, S.Z.; Berns, R.S. Evaluating colour difference equation performance incorporating visual uncertainty. Color Res. Appl. 2009, 34, 375–390. [Google Scholar] [CrossRef]
  31. Jin, X.K.; Zhang, S.C.; Li, Q.Z.; Du, L.; Zhu, C.Y. Development of Colour Difference Formula and Its Application in Fabric Colour Evaluation. Silk 2013, 5, 33–38. [Google Scholar]
  32. Huang, M.; Liu, H.X.; Liao, N.F. Revision of the Weight Functions of CIE DE2000 Colour Difference Formula. Package Eng. 2008, 29, 33–35. [Google Scholar]
  33. Lin, C.R.; Yang, X.Y. Product Quality Evaluation Based on Entropy Method and Rank Correlation Analysis. Modul. Mach. Tool. Autom. Manuf. Tech. 2018, 10, 156–160. [Google Scholar]
  34. Liu, C.; Fan, B. Weighted Least Squares Support Vector Machine Based on Entropy Evaluation. Comput. Sci. 2017, 44, 428–431. [Google Scholar]
  35. Zheng, S.S.; Wang, A.H. Port Container Handling Decision-making Equipment Evaluation Based on Multi-attribute Method and Information Entropy Method. Oper. Res. Manag. Sci. 2017, 26, 10–19. [Google Scholar]
  36. John, M.K.; Thomas, M.M.; James, E.S.; Yan, L. Color Grading of Colored Diamonds in the GIA Gem Trade Laboratory. Gems Gemol. 1994, 30, 220–242. [Google Scholar]
  37. Guo, Y.; Wang, H.; Li, X.; Dong, S.R. Metamerism Appreciation of Jadeite-Jade Green under the Standard Light Sources D65, A and CWF. Acta Geol. Sin. Engl. 2016, 90, 2097–2103. [Google Scholar] [CrossRef]
  38. Guo, Y. Quality grading system of Jadeite-Jade green based on three colourimetric parameters under CIE standard light sources D65, CWF and A. Bulg. Chem. Commun. 2017, 49, 961–968. [Google Scholar]
  39. Guo, Y.; Mo, T.; Cheng, S.H. Contribution of Lightness Difference to Colour Difference of Jadeite-jade Based on Colour Different Formula. Bull. Chin. Ceram. Soc. 2010, 29, 496–501. [Google Scholar]
  40. Janos, S. Colorimetry Understanding the CIE System; John Wiley & Sons, Inc. Press: Hoboken, NJ, USA, 2007; pp. 91–97. [Google Scholar]
  41. Liu, H.X. The Application of CIE Uniform Color Space and Its Color Difference Formula. J. Beijing Inst. Graph. Commun. 2003, 11, 3–8. [Google Scholar]
  42. Luo, M.R.; Cui, G.; Rigg, B. The Development of the CIE 2000 Colour-Difference Formula: CIEDE2000. Color Res. Appl. 2001, 26, 340–350. [Google Scholar] [CrossRef]
  43. Li, Z.L.; Shao, Y.N.; Huang, H.; Huang, C.L. Comparison of Color Differences between MacAdam Ellipse and Rhombus for LED Lighting Products. China Light Lighting 2013, 12, 31–36. [Google Scholar]
Figure 1. Schematics illustrating photographic conditions. (A) Side view. (B) Main view.
Mathematics 08 01489 g001
Figure 2. Schematic of the experimental process. (A) Each sample was photographed after being rotated counterclockwise by 0° to 105° at 15° intervals and the color difference between pixels of adjacent rotation angle images was calculated (the size of each image was 500 × 500 pixels, and take Dia 1708 as an example). (B) The color difference was divided into seven color difference intervals for subsequent analysis by entropy method. (C) In order to divide the color difference interval, contrasting blocks on the diamond image were selected (seven of which are shown in this figure). The standard deviation (representing the resolution of chromaticity) of the pixels’ color difference were calculated to determine the color difference threshold. (D) The box plot showed the percentage of the number of data in each color difference interval to the number of all data for each sample, which decreased with increases in color difference intervals. The entropy method was used to analyze these data to quantitatively evaluate the diamond scintillation. (E) The diamond scintillation was visually evaluated by seven experienced graders with professional knowledge to verify the result by entropy method.
Mathematics 08 01489 g002
Figure 3. Normal distribution of color difference between C-A6 and S-A6. The color difference between C-A6 and S-A6 obeyed the normal distribution N (5.88, 4.532). When the color difference a certain color and S-A6 was 19.47, NΔE was 3; when the color difference between a certain color and S-A6 was 37.59, NΔE was 7. Because the color difference was a positive number, the negative number had no reference value.
Mathematics 08 01489 g003
Figure 4. Diamond scintillation evaluation results. The larger the F, the stronger the diamond scintillation. This figure shows that the diamond scintillation is generally positively correlated with cut quality.
Mathematics 08 01489 g004
Figure 5. Pearson correlation coefficients of Re with Rl, Rc, and Rh. (A) Pearson correlation coefficients of Re with Rc, and Rh when the results by the entropy method were one level higher than the results by the naked eye and the color difference image, lightness difference image, chroma difference image, and hue difference image of Dia 0035 (within the gray frame). (B) Pearson correlation coefficients of Re with Rc and Rh when the results by the entropy method were one level lower than the results by the naked eye and the color difference image, lightness difference image, chroma difference image, and hue difference image of Dia 1711 (inside the gray frame). (C) Pearson correlation coefficients ranges of Re with Rl, Rc, and Rh when the results by the entropy method were one level higher than the results by the naked eye.
Mathematics 08 01489 g005
Table 1. Calculation results of contrasting blocks and standard blocks.
CSΔESDΔEANΔE CSΔESDΔEANΔEΔE
A1 Mathematics 08 01489 i001 Mathematics 08 01489 i0020.761.236.95B1 Mathematics 08 01489 i003 Mathematics 08 01489 i0040.230.6425.426.54
A2 Mathematics 08 01489 i005 Mathematics 08 01489 i0062.003.174.50B2 Mathematics 08 01489 i007 Mathematics 08 01489 i0081.993.364.4312.17
A3 Mathematics 08 01489 i009 Mathematics 08 01489 i0103.654.704.72B3 Mathematics 08 01489 i011 Mathematics 08 01489 i0121.212.5015.9921.93
A4 Mathematics 08 01489 i013 Mathematics 08 01489 i0145.9010.492.97B4 Mathematics 08 01489 i015 Mathematics 08 01489 i0164.376.954.8228.02
A5 Mathematics 08 01489 i017 Mathematics 08 01489 i0181.082.7126.87B5 Mathematics 08 01489 i019 Mathematics 08 01489 i0204.968.944.5931.68
A6 Mathematics 08 01489 i021 Mathematics 08 01489 i0224.535.885.09B6 Mathematics 08 01489 i023 Mathematics 08 01489 i0241.422.7318.4328.96

