Abstract
The quality characteristics with unilateral specifications include the smaller-the-better (STB) and larger-the-better (LTB) quality characteristics. Roundness, verticality, and concentricity are categorized into the STB quality characteristics, while the wire pull and the ball shear of gold wire bonding are categorized into the LTB quality characteristics. In terms of the tolerance, zero and infinity () can be viewed as the target values in line with the STB and LTB quality characteristics, respectively. However, cost and timeliness considerations, or the restrictions of practical technical capabilities in the industry, mean that the process mean is generally far more than 1.5 standard deviations away from the target value. Researchers have accordingly proposed a process quality index conforming to the STB quality characteristics. In this study, we come up with a process quality index conforming to the LTB quality characteristics. We refer to these two types of indices as the unilateral specification process quality indices. These indices and the process yield have a one-to-one mathematical relationship. Besides, the process quality levels can be completely reflected as well. These indices possess unknown parameters. Therefore, sample data are required for calculation. Nevertheless, interval estimates can lower the misjudgment risk resulting from sampling errors more than point estimates can. In addition, considering cost and timeliness in the industry, samples are generally small, which lowers estimation accuracy. In an attempt to increase the accuracy of estimation as well as overcome the uncertainty of measured data, we first derive the confidence interval for unilateral specification process quality indices, and then propose a fuzzy membership function on the basis of the confidence interval to establish the two-tailed fuzzy testing rules for a single indicator. Lastly, we determine whether the process quality has improved.
1. Introduction
According to a number of studies, process capability indices (PCIs) are convenient tools for process quality assessment, such that they are widely employed in the manufacturing industry [1,2,3,4,5,6,7,8]. Six Sigma is also a widely-used approach which can enhance process quality levels in manufacturing [9,10,11,12]. Many researchers examined the relations of various PCIs with Six Sigma quality levels [13,14,15]. According to the definitions of Six Sigma quality levels, Chen et al. [13] and Huang et al. [16] proposed a Six Sigma quality index—when the process mean shifts 1.5 standard deviations from the target value and the standard deviation of the process is one-sixth of the tolerance, the quality level of the process is exactly 6 standard deviations, which means the Six Sigma quality index is exactly 6.
Chen et al. [13] noted that the PCIs for unilateral specifications do not have specific target values. Although zero and infinity ( ) can respectively be considered the target values of STB and LTB quality characteristics, considerations of cost and timeliness and the restrictions of practical technical capabilities in the industry mean that the process mean is generally far more than 1.5 standard deviations away from the target value. The STB quality characteristics include roundness, verticality, and concentricity, while the LTB quality characteristics include the wire pull and ball shear of gold wire bonding. Chang et al. [17] accordingly presented a process quality index in line with STB. In this study, a process quality index is proposed to conform with LTB. Under the assumption of normality, we let the random variable follow the normal distribution with the process mean and process standard deviation σ. Therefore, the process quality index of the unilateral specification can be expressed as follows:
where and respectively represent the upper as well as lower specification limits. On the basis of the concept put forward by Chang et al. [17], when , then the process quality level reaches for STB quality characteristics. Therefore,
Similarly, when , then the process quality level reaches k sigma for LTB quality characteristics. Therefore,
Based on the above description, if the process quality level attains to k sigma, then the unilateral specification process quality index value will be equal to k. The process yield for the STB quality characteristic can be calculated as follows:
Similarly, for LTB quality characteristics, the process yield can be displayed in the following:
where complies with the standard normal distribution. , a cumulative function of the standard normal distribution, is expressed as follows:
Based on the above description, the process yield and unilateral specification process quality indices have a one-to-one mathematical relationship. Obviously, the process quality indices of the unilateral specification show the process yield as well as the quality level, so they are good quality assessment tools for processes with unilateral specifications. These indices include unknown parameters, so sample data are required for calculation [18,19]. However, interval estimates can decrease the misjudgment risk resulting from sampling errors more than point estimates can [20,21]. In addition, due to cost and timeliness considerations, samples are generally small, which lowers estimation accuracy. To increase the accuracy of estimation and decrease the uncertainty of measurement data, many researchers use the confidence interval of indices to construct confidence interval-based fuzzy evaluation models [22,23,24,25,26]. In this study, we first derive the confidence interval for the unilateral specification process’ quality indices, and then propose a confidence interval-based fuzzy membership function to establish the two-tailed fuzzy testing rules for a single index. Lastly, we determine whether process quality has improved. Obviously, the fuzzy evaluation model proposed by this study can make a more accurate judgment in a short period of time on whether the process has improved through a smaller sample size and the integration of accumulated past expert experience [20,22,23,24,25]. Besides, grasping the opportunity for improvement can not only reduce the testing cost but also make the quality level quickly meet the requirements of the specifications. At the same time, it has the advantage of reducing the ratio of rework and scrap as well as further reducing social losses, such as carbon emissions [26,27]. Central Taiwan holds a strategic position in the global machine-tool and machinery industries, and is home to a complete industry chain, including upstream, midstream and downstream manufacturers [28,29]. We therefore demonstrated the application of the proposed approach using the roundness of a gear-grinding process at a factory in Central Taiwan.
As to the rest of this paper, it will be arranged as follows: Section 2 indicates the confidence interval of a unilateral specification process quality index; Section 3 presents the two-tailed statistical hypothesis testing of a unilateral specification process quality index; Section 4 develops the two-tailed fuzzy testing model on the basis of the above rules with critical values; Section 5 employs an application to demonstrate the efficacy of the proposed approach. Last but not least, conclusions are given in Section 6.
2. Confidence Intervals
It is assumed that ( ,…, ,…, ) is a random sample derived from using sample size n. Then, the estimator of and is
As a result, the estimator of these two process quality indices can be expressed as follows:
Let the random variable . The characteristic function of is ; therefore, proceeds with the chi-square distribution using degrees of freedom, expressed as . If we let 1, then
where refers to the lower quantile of the chi-square distribution using degrees of freedom. Therefore,
If we let the random variable
then follows the standard normal distribution, denoted as . We also let 1 . Then
where means the upper quantile of the standard normal distribution. Therefore,
We set event and event as:
and are independent, and so are and . Therefore, event and event are independent.
Thus,
and we have
Based on the above description, is the 100(1 )% confidence interval of the index where
3. Two-Tailed Statistical Hypothesis Testing
Statistical hypothesis testing is an effective approach determining whether the process quality index of the unilateral specification value is equal to k, which demonstrates that the process quality has attained to the level. Therefore, the hypotheses for testing at significance level α can be described as below:
If we let , then the statistical test function for the null hypothesis
is given by
Furthermore, suppose the random variable , then
proceeds with the non-central t-distribution at degrees of freedom using the non-centrality parameter , denoted as and
is denoted as . Then the critical value , is controlled by
where is the lower quantile of . Similarly, the critical value , is determined by
where is the lower 1 quantile of . If we let (,…, ,…, ) be the observed value of (,…, ,…, ), then the observed values of and are
and
Therefore, the observed value of can be displayed as follows:
The statistical testing rules are listed below:
- (1)
- If , then is not rejected, and it is concluded that ;
- (2)
- If , then is rejected, and it is concluded that ;
- (3)
- If , then is rejected, and it is concluded that .
4. Two-Tailed Fuzzy Testing
As noted by Chen [30], sample size n can affect the statistical inference results. Thus, this paper develops a two-tailed fuzzy testing model on the basis of the above rules with critical values and . Furthermore, the observed values of and , respectively, are
According to the observed values of the confidence interval and the proposal made by Chen [22], the of the triangular fuzzy number is for , where
It is recalled that the of triangular fuzzy number for is equal to . In the case of , . According to Chen [22], considering the convenience in practice, we let
Thus:
- (1)
- When , then
- (2)
- When , then
Therefore, the α-cuts of the new triangular fuzzy number of is for , where
It is suggested that all of the α-cuts of for be equal to . Obviously, if , then . The new triangular fuzzy number of is , where
Then, the membership function of the triangular fuzzy number is
where and are determined by and . The membership function is presented in Figure 1.
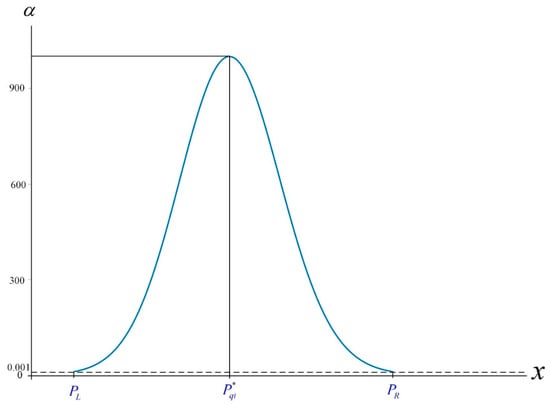
Figure 1.
Membership function η(x).
Suppose is the area in the graph of η(x), and then
As noted by Chen [31] and Buckley [32], the area of set can be computed as follows:
Based on Chen [31], it is difficult to calculate directly via integration, so we let , 0,1,…,1000 for 0 1, where refers to the largest integer less than or equal to 1000. We let 0.001 and 0,1,…,1000, showing that is divided into 1000 trapezoid-shaped blocks by 1001 horizontal lines. Therefore, the th block for 0, 1, 2, …, 999 can be stated in the following equation:
We also let the coordinates of the two intersection points of horizontal line 0.001 and set be and . Thus, the distance between these two points is as shown below:
Obviously, …, 0 and is a trapezoid-shaped block containing lower base , upper base , and height 0.001. As a result, the approximate value of its area for = 1, 2, …, 1000 can be written as
Therefore,
As noted by Chen [22], since the test is two-tailed, the following two cases must be taken into account:
Case 1:
Similar to , when , the of triangular fuzzy critical value number is for , where
It is suggested that all of the of for are equal to . Obviously, if , then and the triangular fuzzy number of is , where and . Then, the membership function of the triangular-shaped fuzzy number is
where and are determined by and . Therefore, the membership functions and are presented in Figure 2.
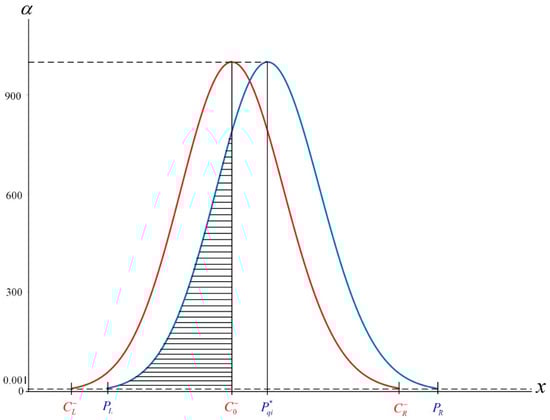
Figure 2.
Membership functions η(x) and .
Suppose is the area attaining to the left of the vertical line x in the graph of , and then
where . We also let 0.001 and 1,…, , which indicate that horizontal lines divide into trapezoid-shaped blocks. Then, the block can be displayed as follows:
We also let the coordinates of the two intersection points of horizontal line 0.001 and set be and . Thus, the distance between these two points is , as shown below:
Obviously, … , 0 and is a trapezoid-shaped block, including lower base , upper base , and height 0.001. Consequently, the approximate value of its area for 1,…, can be expressed below:
Therefore,
Case 2:
Similar to , when , the of triangular fuzzy critical value number will be for , where
Suppose the of for equals . Obviously, if , then and the triangular fuzzy number of is where and . Then, the membership function of triangular fuzzy number is
where and are determined by and . Therefore, the membership functions η(x) and are as presented in Figure 3:
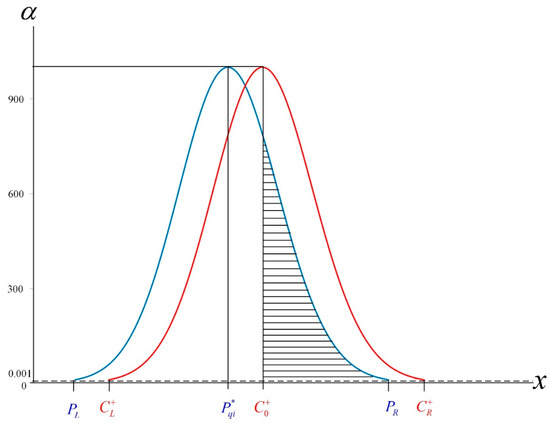
Figure 3.
Membership functions η(x) and .
It is assumed that is the area extending to the right of the vertical line x = in the graph of η(x), and then
where . We let 0.001 and 1,…, , which indicate that horizontal lines divide into trapezoid-shaped blocks. Therefore, the block can be expressed in the following equation:
We also set the coordinates of the two intersection points of horizontal line = 0.001 × and set as and . Thus, the distance between these two points is as shown below:
Obviously, … , 0 and is a trapezoid-shaped block with a lower base , upper base , and height 0.001. As a result, the approximate value of its area for 1,..., can be written as follows:
Therefore,
According to the above-mentioned inferences, the fuzzy testing rules can be based on case 1 () and case 2 ( ). Letting 0 0.5, the fuzzy hypothesis testing rules can be listed as follows:
Case 1: .
- (1)
- If , then is not rejected, and it is concluded that ;
- (2)
- If , then no decision is made;
- (3)
- If , then is rejected, and it is concluded that .
Case 2: .
- (1)
- If , then is not rejected, and it is concluded that ;
- (2)
- If , then no decision is made;
- (3)
- If , then is rejected, and it is concluded that .
5. A Practical Application
As noted by Wu et al. [28] and Chen et al. [29], Central Taiwan boasts a large machinery industry including various upstream, midstream, and downstream manufacturers. We therefore used the roundness of a gear-grinding process at a factory in Central Taiwan to illustrate the two-tailed fuzzy hypothesis testing method with process quality indices of the unilateral specification. The roundness of the inner hole in a gear is an STB quality characteristic, and the upper specification limit USL 0.01 µm. Based on Equations (27) and (28), we can compute the values of and s with sample size n = 100 as follows:
Therefore,
According to Equations (39)–(41), we have , and the membership function with 4.125 is
where and are determined by and . Since and , then, based on Equation (48), we have
Our goal is to test whether the unilateral specification process quality index value is equal to k 5 with sample size n 100 and α = 0.01. The null hypothesis is : 5, and the alternative hypothesis is : 5. Obviously, 4.125 5 belongs to case 1. Thus, based on Equation (25), we can compute the values of as follows:
According to Equations (49) and (50), we have , and the membership function with 4.060 is
where and are determined by and . Therefore, the membership functions and are as presented in Figure 4.
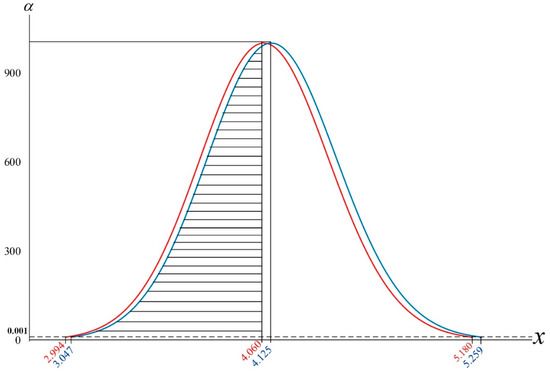
Figure 4.
Membership functions η(x) with 4.125 and with 4.060.
Since and (b = 983), then based on Equation (56), we have
Based on Chen [30] and setting = 0.40,
Based on the fuzzy testing rule (3) of case 1, we can conclude that
5. According to the statistical testing rules, since
4.125 4.060 , the null hypothesis cannot be rejected ( = 5). However, = 4.125 is much smaller than 5, so the conclusion that = 5 is obviously unreasonable. The conclusion that < 5, received via the fuzzy testing method suggested in this study, is obviously more reasonable than the conclusion of the statistical testing method [20,22,24,25,26,31].
In order to facilitate the use of the industry, this study summarizes the above and provides an application process as follows:
Step 1: Calculate the sample mean , and sample standard deviation s;
Step 2: Calculate the estimated value of the indicator, , and the critical value, ;
Step 3: Apply the Statistical software (e.g., SAS programming), first, enter the required value of the quality level, and then enter the estimated value of the index, , as well as the critical value, ;
Step 4: Execute the completed Statistical software and then simply calculate to get the value .
Step 5: Then, judgments can be made based on the fuzzy evaluation criteria.
6. Conclusions
The unilateral specification process quality index reflects process yield and quality level. In addition, it serves as a good bridge between the industry and customers as well as a tool for internal engineers. This study proposes a two-tailed fuzzy test method built on the basis of the process quality indices of the unilateral specification for performance evaluation conducted by the industry. First, we derived the confidence interval of the unilateral specification process quality index based on the results of statistical inferences. Next, we used the confidence interval to develop the two-tailed fuzzy testing model based on the above rules with critical values. This two-tailed test provides an effective method for process quality assessment as well as improvement. We also present a case study evaluating the roundness of a gear-grinding process at a factory in Central Taiwan. The results of the case study illustrate the application of the two-tailed fuzzy hypothesis testing method for the unilateral specification process quality index, and further prove that the proposed method provides more reasonable results than statistical testing [20,22,24,25,26,31]. Our proposed method can decrease the testing cost and make the quality level reach the standard rapidly. Besides, it diminishes the ratio of rework and scrap, as well as further reducing social losses such as carbon emissions [26,27]. Obviously, this method is an innovation for sustainable concept and application. In view of global warming, sustainable development is the premise for all companies to maintain the advantages of high quality and production efficiency. The sustainability concept is different from the traditional one, which focuses on the profits only. Increasingly more and more companies apply our proposed method and concept, not only to improve production efficiency, but also to reduce waste for the goal of sustainability.
After the enterprise has completed the process improvement, it should carry out the improvement verification [33] in order to practice the spirit of total quality management. Therefore, this study suggests that the fuzzy improvement verification model be developed in the future. In addition, considering that many process distributions are abnormal, the future research can focus on exploring how to imitate a normal process as well as create a fuzzy evaluation model of the abnormal process distribution when the process distribution is abnormal, the median replaces the average, and ( upper quantile— upper quantile)/6 replaces the standard deviation [34,35].
Author Contributions
Conceptualization, C.-M.Y.; methodology, C.-M.Y. and W.-J.L.; software, T.-H.H.; validation, K.-K.L.; formal analysis, C.-M.Y. and W.-J.L.; resources, K.-K.L.; data curation, T.-H.H., and K.-K.L.; writing—original draft preparation, C.-M.Y., W.-J.L., T.-H.H.; writing—review and editing, C.-M.Y. and W.-J.L.; visualization, K.-K.L.; supervision, W.-J.L.; project administration, C.-M.Y. All authors have read and agreed to the published version of the manuscript.
Funding
This research received no external funding.
Conflicts of Interest
The authors declare no conflict of interest.
References
- Chen, K.S.; Yang, C.M. Quality capability assessment for thin-film chip resistor. IEEE Access 2019, 7, 92511–92516. [Google Scholar] [CrossRef]
- Chen, K.S.; Wang, C.C.; Wang, C.H.; Huang, C.F. Application of RPN analysis to parameter optimization of passive components. Microelectron. Reliab. 2010, 50, 2012–2019. [Google Scholar] [CrossRef]
- Otsuka, A.; Nagata, F. Quality design method using process capability index based on Monte-Carlo method and real-coded genetic algorithm. Int. J. Prod. Econ. 2018, 204, 358–364. [Google Scholar] [CrossRef]
- Nikzad, E.; Amiri, A.; Amirkhani, F. Estimating total and specific process capability indices in three-stage processes with measurement errors. J. Stat. Comput. Simul. 2018, 88, 3033–3064. [Google Scholar] [CrossRef]
- Yu, C.M.; Lai, K.K.; Chen, K.S.; Chang, T.C. Process-quality evaluation for wire bonding with multiple gold wires. IEEE Access 2020, 8, 106075–106082. [Google Scholar] [CrossRef]
- Chang, T.C.; Wang, K.J.; Chen, K.S. Sputtering process assessment of ITO film for multiple quality characteristics with one-sided and two-sided specifications. J. Test. Eval. 2014, 42, 196–203. [Google Scholar] [CrossRef]
- Chen, K.S. Estimation of the process incapability index. Commun. Stat. Theory Methods 1998, 27, 1263–1274. [Google Scholar] [CrossRef]
- Chen, K.S.; Wang, K.J.; Chang, T.C. A novel approach to deriving the lower confidence limit of indices cpu, cpl, and cpk in assessing process capability. Int. J. Prod. Res. 2017, 55, 4963–4981. [Google Scholar] [CrossRef]
- Chang, T.C.; Chen, K.S. Testing process quality of wire bonding with multiple gold wires from the viewpoint of producers. Int. J. Prod. Res. 2019, 57, 5400–5413. [Google Scholar] [CrossRef]
- Anderson, N.C.; Kovach, J.V. Reducing welding defects in turnaround projects: A lean six sigma case study. Qual. Eng. 2014, 26, 168–181. [Google Scholar] [CrossRef]
- Gijo, E.V.; Scaria, J. Process improvement through Six Sigma with Beta correction: A case study of manufacturing company. Int. J. Adv. Manuf. Technol. 2014, 71, 717–730. [Google Scholar] [CrossRef]
- Shafer, S.M.; Moeller, S.B. The effects of Six Sigma on corporate performance: An empirical investigation. J. Oper. Manag. 2012, 30, 521–532. [Google Scholar] [CrossRef]
- Chen, K.S.; Chen, H.T.; Chang, T.C. The construction and application of six sigma quality indices. Int. J. Prod. Res. 2017, 55, 2365–2384. [Google Scholar] [CrossRef]
- Ouyang, L.Y.; Chen, K.S.; Yang, C.M.; Hsu, C.H. Using a QCAC-Entropy-TOPSIS approach to measure quality characteristics and rank improvement priorities for all substandard quality characteristics. Int. J. Prod. Res. 2014, 52, 3110–3124. [Google Scholar] [CrossRef]
- Yu, K.T.; Sheu, S.H.; Chen, K.S. The evaluation of process capability for a machining center. Int. J. Adv. Manuf. Technol. 2007, 33, 505–510. [Google Scholar] [CrossRef]
- Huang, C.F.; Chen, K.S.; Sheu, S.H.; Hsu, T.S. Enhancement of axle bearing quality in sewing machines using six sigma. Proc. Inst. Mech. Eng. Part B J. Eng. Manuf. 2010, 224, 1581–1590. [Google Scholar] [CrossRef]
- Chang, T.C.; Chen, K.S.; Yu, C.M. Process quality assessment model of hand tools: A case study on the handle of ratchet torque wrench. Int. J. Reliab. Qual. Saf. Eng. 2016, 23, 1650017. [Google Scholar] [CrossRef]
- Wang, C.H.; Chen, K.S. New process yield index of asymmetric tolerances for bootstrap method and six sigma approach. Int. J. Prod. Econ. 2020, 219, 216–223. [Google Scholar] [CrossRef]
- Yu, K.T.; Chen, K.S. Testing and analyzing capability performance for products with multiple characteristics. Int. J. Prod. Res. 2016, 54, 6633–6643. [Google Scholar] [CrossRef]
- Chen, K.S.; Yu, C.M. Fuzzy test model for performance evaluation matrix of service operating systems. Comput. Ind. Eng. 2020, 140, 106240. [Google Scholar] [CrossRef]
- Chen, K.S.; Lii, P.C.; Li, S.Y.; Yu, C.M. Development and application of a performance evaluation matrix: A case study on exploring the items considered critical to quality. J. Test. Eval. 2018, 48, 3468–3478. [Google Scholar] [CrossRef]
- Chen, K.S. Fuzzy testing of operating performance index based on confidence intervals. Ann. Oper. Res. 2019. [Google Scholar] [CrossRef]
- Yang, C.M.; Lin, K.P.; Chen, K.S. Confidence interval based fuzzy evaluation model for an integrated-circuit packaging molding process. Appl. Sci. 2019, 9, 2623. [Google Scholar] [CrossRef]
- Yu, C.M.; Chen, K.S.; Lai, K.K.; Hsu, C.H. Fuzzy supplier selection method based on smaller-the-better quality characteristic. Appl. Sci. 2020, 10, 3635. [Google Scholar] [CrossRef]
- Yu, C.H.; Liu, C.C.; Chen, K.S.; Yu, C.M. Constructing fuzzy hypothesis methods to determine critical-to-quality service items. Mathematics 2020, 8, 573. [Google Scholar] [CrossRef]
- Chen, K.S.; Wang, C.H.; Tan, K.H. Developing a fuzzy green supplier selection model using Six Sigma quality indices. Int. J. Prod. Econ. 2019, 212, 1–7. [Google Scholar] [CrossRef]
- Li, K.Y.; Luo, W.J.; Hong, X.H.; Wei, S.J.; Tsai, P.H. Enhancement of machining accuracy utilizing varied cooling oil volume for machine tool spindle. IEEE Access 2020, 8, 28988–29003. [Google Scholar] [CrossRef]
- Wu, M.F.; Chen, H.Y.; Chang, T.C.; Wu, C.F. Quality evaluation of internal cylindrical grinding process with multiple quality characteristics for gear products. Int. J. Prod. Res. 2019, 57, 6687–6701. [Google Scholar] [CrossRef]
- Chen, K.S.; Chang, T.C.; Guo, Y.Y. Selecting an optimal contractor for production outsourcing: A case study of gear grinding. J. Chin. Inst. Eng. 2020, 43, 415–424. [Google Scholar] [CrossRef]
- Chen, K.S. Fuzzy testing decision-making model for intelligent manufacturing process with Taguchi capability index. J. Intell. Fuzzy Syst. 2020, 38, 2129–2139. [Google Scholar] [CrossRef]
- Chen, K.S. Two-tailed Buckley fuzzy testing for operating performance index. J. Comput. Appl. Math. 2019, 361, 55–63. [Google Scholar] [CrossRef]
- Buckley, J.J. Fuzzy statistics: Hypothesis testing. Soft Comput. 2005, 9, 512–518. [Google Scholar] [CrossRef]
- Chen, K.S.; Chang, H.T.; Yu, C.M. Development and application of performance improvement verification model: A case study of an e-learning system. Total Qual. Manag. Bus. Excell. 2019, 30, 936–952. [Google Scholar] [CrossRef]
- Pearn, W.L.; Chen, K.S. Estimating process capability indices for non-normal pearsonian populations. Qual. Reliab. Eng. Int. 1995, 11, 386–388. [Google Scholar] [CrossRef]
- Tai, Y.T.; Pearn, W.L. Measuring the manufacturing yield for skewed wire bonding processes. IEEE Trans. Semicond. Manuf. 2015, 28, 424–430. [Google Scholar] [CrossRef]
Publisher’s Note: MDPI stays neutral with regard to jurisdictional claims in published maps and institutional affiliations. |
© 2020 by the authors. Licensee MDPI, Basel, Switzerland. This article is an open access article distributed under the terms and conditions of the Creative Commons Attribution (CC BY) license (http://creativecommons.org/licenses/by/4.0/).