Abstract
The paper presents a novel method for automated image processing that combines pyramidal generalized contour preprocessing with parallel–hierarchical segmentation, integrating adaptive multilevel thresholding to enhance segmentation accuracy and robustness. The proposed approach is designed to overcome the limitations of traditional methods—whose performance declines under variations in brightness, surface texture, and noise—by enhancing image contrast and structural defect detection, thereby reducing diagnostic errors and misclassification risks. To achieve these objectives, the implementation utilizes multilevel adaptive thresholding, enabling step-by-step segmentation refinement and the extraction of informative regions using three-level coding (positive, negative, and neutral elements). In conjunction with parallel–hierarchical (PH) transformations and high-frequency filtering, the method enhances image contrast, enables more accurate detection of structural defects, and reduces the number of false positives. Experimental results demonstrate a 10–15% improvement in segmentation accuracy compared to classical methods such as region-growing techniques. Furthermore, correlation analysis between automatic and manual segmentation results demonstrated a high degree of consistency, with a correlation coefficient of 0.95–0.99, indicating the reliability and reproducibility of the developed approach. The proposed method is distinguished by its high processing speed, computational simplicity, and versatility of application, ranging from medical thermography for pathological diagnostics to real-time monitoring of railway infrastructure. The practical significance of these results lies in advancing automation, reducing decision-making errors, and ensuring greater reliability of technical and medical control systems.
Keywords:
PH-transformations; image processing; real-time image segmentation; high-frequency filtering; diagnostic methods; rail damage; railway infrastructure MSC:
68U10; 68T45; 94A08
1. Introduction
The increasing complexity and resolution of imaging technologies in rail infrastructure monitoring necessitate advanced segmentation techniques for accurate defect detection. Railway tracks are subject to continuous wear, and early identification of structural defects is critical to ensuring safety and optimizing maintenance. Traditional segmentation methods often struggle with the varying brightness, reflectivity, and texture of rail surfaces, leading to misclassification and missed defects. To address these challenges, we propose a pyramidal generalized contour preparation algorithm that enhances image segmentation by adapting to the distribution of pixel intensities across multiple levels [1,2,3,4].
Recent comparative studies of rail defect detection methods reveal a persistent trade-off between segmentation accuracy and computational efficiency [5,6]. Deep learning architectures, while achieving impressive accuracy, impose computational demands that often preclude real-time deployment in embedded inspection systems [7,8,9]. Classical thresholding approaches such as Otsu’s method offer computational simplicity but assume intensity distributions that cleanly separate foreground from background—an assumption that frequently fails under spatially varying illumination and textured surfaces [10]. Region-growing methods produce spatially coherent segments but incur computational overhead that scales unfavorably with image resolution and exhibit sensitivity to seed point selection [11]. Clustering-based approaches like K-means accommodate multiple intensity classes yet provide no inherent mechanism for exploiting spatial structure, often producing fragmented results requiring extensive post-processing [12].
Multi-scale approaches such as phase congruency offer illumination-invariant feature detection through frequency-domain analysis. However, these methods rely on computationally intensive orthogonal transformations (Fourier transforms, Log-Gabor filters), making them less suitable for real-time embedded inspection systems where computational simplicity is essential.
These limitations are equally pronounced in biomedical thermography, where smooth intensity gradients and ill-defined boundaries between regions of interest present analogous challenges [13,14]. Despite the underlying commonality of segmentation problems across industrial and biomedical domains, methods developed for each context are rarely evaluated for cross-domain applicability.
A critical examination of existing literature reveals several gaps motivating the present work: hierarchical segmentation methods lack adaptive mechanisms responding to individual image statistics; computational efficiency required for real-time monitoring remains inadequately addressed; and three-level contour encoding schemes, though efficient, suffer from information loss when intermediate intensities spanning wide dynamic ranges are collapsed into a single category. These gaps point to the need for a segmentation framework combining adaptive multi-level thresholding with hierarchical refinement, achieving both computational efficiency and detection accuracy.
The parallel–hierarchical segmentation method, combined with PH transformations and high-frequency filtering, enhances contrast and enables finer differentiation between normal wear patterns and critical rail damage. The same pyramidal generalized contour preprocessing and high-frequency filtering techniques used in rail defect detection can be applied to segment medical images more effectively, improving the identification of critical areas in thermographic scans. In both fields, the integration of these advanced segmentation techniques enhances automation, reduces false positives, and ensures greater accuracy in defects localization and classification [2,3,4].
The proposed pyramidal generalized contour preprocessing method addresses these limitations by introducing criterion-based threshold optimization that maximizes discriminative distribution of representations at each segmentation level while systematically refining results through successive exclusion of classified regions. This iterative approach counteracts information loss inherent in coarse quantization and adapts threshold selection to the evolving statistical properties of unclassified pixels.
This paper describes fast, reliable and universal segmentation techniques applicable to both railway infrastructure monitoring and biomedical thermography.
To carry out this work, the following tasks were performed:
- Section 2 develops an improved pyramidal contour preprocessing method for grayscale rail images and defines the threshold-based encoding procedure. This approach improves segmentation accuracy, enabling more reliable detection of structural defects in automated rail inspection systems.
- Section 3 evaluates the pyramidal generalized contour preprocessing algorithm through multilevel segmentation of thermal and rail images. Results were validated against other segmentation methods, showing high correlation and confirming its effectiveness for automated defect detection.
- The results obtained and conclusions presented are discussed in Section 4.
2. Materials and Methods
For efficient representation of grayscale images, the generalized contour preprocessing method transforms multi-gradation intensity images into bi-level contour-based representations. This approach preserves image information and maintains normalization and centering conditions, such as equalized mean intensities and intensity ranges, which improves the accuracy of mutual correlation functions [3,4,15].
The method detects intensity variations between image samples, generating two-level detection signals that form contour representations. In rail surface defect detection, this enables differentiation between normal and compromised areas, even under varying lighting and environmental conditions [2,4,15,16].
We enhance this method with a pyramidal procedure that encodes each pixel into three categories using a two-bit scheme:
- Negative representations (): darkest intensity levels
- Positive representations (): brightest intensity levels
- Zero representations (): intermediate values
The preprocessing threshold is selected to evenly distribute these representations across the image field. While this three-level encoding is computationally efficient, it can be coarse—many gray levels may be grouped as zero, causing loss of detail. To address this limitation, our multi-level pyramidal procedure iteratively:
- Excludes pixels classified as negative representations;
- Recalculates the threshold for remaining pixels;
- Reapplies contour preprocessing. This refinement continues for several levels, progressively improving segmentation accuracy [15].
Finally, network-based image comparison benefits from prior spatially connected preprocessing, where boundary processing and reference image masking are crucial for robust analysis [15,16,17].
The experimental evaluation of the proposed segmentation method was conducted using a private dataset comprising 2000 high-resolution images. The biomedical component of the database consists of thermal scans captured in the laboratory of functional thermodiagnostics at the “Avangard” sanatorium in Nemyriv. For industrial applications, the dataset includes high-resolution images of rail surfaces specifically selected to test the detection of cracks, corrosion, and structural deformations. The imaging conditions were purposefully varied to address real-world challenges, including fluctuating lighting, surface reflectivity, and complex textures that often lead to misclassification in traditional systems. All images were processed in PCX or BMP graphic formats, allowing the algorithm to decode pixel intensity values into a matrix for direct preprocessing. To enhance model robustness and prevent overfitting, image augmentation techniques were applied, and the total data was partitioned into a 75/25 ratio for training and testing phases, respectively [16,17,18,19].
The proposed hierarchical segmentation method evaluates specific image features—primarily pixel brightness and its deviation from the global mean—to classify structural anomalies. The process begins with the input image matrix , where represents the discrete grayscale intensity of the pixel at coordinates .
To normalize the image data and center it around the mean intensity, we first calculate the average intensity :
where is the total number of pixels in the image. Subsequently, the difference array is computed to determine the deviation of each pixel from this average: .
The segmentation relies on an adaptive threshold to categorize these deviations into three distinct contour representations: positive (brightest), negative (darkest), and zero (intermediate). The optimal threshold is determined by evaluating the distribution of pixels across these categories. The optimization criterion is defined as finding the value that maximizes the product of these distributions: [18].
In this equation, the parameters are defined as follows:
- (Positive Distribution): The count of pixels where the difference . These correspond to high-intensity anomalies such as surface reflectivity or deformations.
- (Negative Distribution): The count of pixels where the difference . These correspond to low-intensity anomalies such as cracks or corrosion.
- (Zero Distribution): The count of pixels where . These represent the structurally intact or background surfaces.
Once the optimal threshold is identified, the final contour representation for the -th segmentation level is generated using the following logic:
To compute the contour-based representations, the preprocessing threshold is selected based on condition (2), which ensures an even distribution of contour representations across the image field. Image masking enhances the sensitivity of pyramidal generalized contour preprocessing in forming contour representations [19,20].
The method detects intensity variations between grayscale samples, generating two-level detection signals that form the basis of contour representations. We extend this by introducing a pyramidal procedure: each pixel is encoded as negative (darkest), positive (brightest), or zero (intermediate) using a straightforward two-bit scheme. The preprocessing threshold is selected to evenly distribute these representations across the image, with optional masking to further enhance sensitivity.
During the experiment, similar threshold optimization procedures were performed for all noisy images. The results of the optimal threshold selections are presented in Figure 1. The chart indicates that the value of the optimal preparation threshold decreases slightly as the noise level increases; this effect is more pronounced for uniform noise distributions.
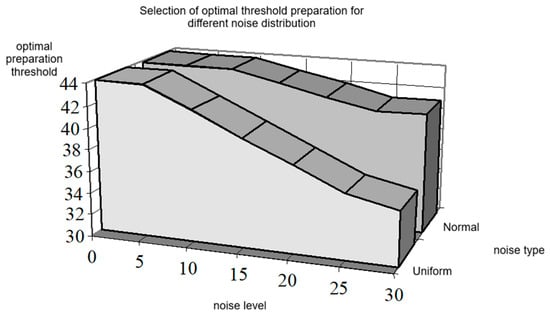
Figure 1.
Optimal preparation threshold for different noise distribution.
Although the initial three-level encoding is efficient, it is relatively coarse, as many gray levels are collapsed into zero, leading to a loss of detail. To address this, our multi-level pyramidal procedure iteratively excludes pixels marked as negative, recalculates the threshold for the remaining pixels, and reapplies contour preprocessing. This refinement continues for several levels, progressively improving the accuracy and informativeness of the final binarized image representation [20].
To mitigate this effect, we propose a multi-level contour preprocessing procedure. This approach involves excluding pixels encoded with negative representations from the transformed image after the first contour preprocessing step. Then, in the second step, a new threshold is selected according to expression (1), but only for the remaining pixels classified as zero or positive representations in the first step. The generalized contour preprocessing operation is then applied again in a manner similar to the first step, using the newly computed threshold. As a result, the process iteratively refines the formation of positive, negative, and zero-contour representations, improving the accuracy of the final binarized image representation [7,21].
As a result, at an arbitrary k-th step, the preprocessing operation uses zero and positive representations, excluding the pixels classified as negative representations in the (k − 1) step. Clearly, the pyramidal generalized contour preprocessing operation can also be conducted by excluding bright areas of the image, which are represented by positive representations, and then further excluding specific image regions at each new step based on the distribution of positive representations [22]. This step-by-step refinement process ensures that only the most relevant features remain in the final segmented image, providing railway monitoring systems with accurate and actionable defect detection data.
Mathematically, the threshold selection for k steps of pyramidal generalized contour preprocessing can be represented by the following criterion system:
where , , —the distribution of zero, negative, and positive representations at the k-th step of pyramidal generalized contour preprocessing (where (k = 1, 2, …, n), n is the number of segmentation levels, while t is the number of levels in the grayscale scale). The criterion system of the form (2) allows, by calculating the threshold for each level t of the grayscale scale, to represent the analyzed image with the corresponding contour representations at k segmentation levels [5,22,23].
To implement the parallel–hierarchical (PH) transformation in each branch of the network, the criterion system of the form (3) is applied as the G transformation.
3. Modeling Results of Pyramidal Generalized Contour Preprocessing Algorithm
Using the criterion system of the form (3), the pyramidal generalized contour preprocessing algorithm can be described as follows. At the first segmentation level (k = 1), by iterating through all grayscale levels t, we determine the value of t at which the threshold is established. At an arbitrary k-th level, by similarly iterating through all grayscale levels t, we determine the value of t that meets the threshold conditions . Thus, at each segmentation level, a specific threshold is computed using the criterion system (1). This ensures the adaptability of the pyramidal generalized contour preprocessing algorithm, meaning that for each newly formed image, a specific threshold is calculated based on the grayscale distribution [5,22,23,24].
As follows from the description of the PH-segmentation algorithm, its implementation requires the following operations:
- Determining pixel brightness and computing their average values and differences.
- Performing comparison operations (“greater than,” “less than,” “equal to”) for brightness differences relative to a fixed threshold value.
- Applying a masking (shifting) operation in cases where the image is processed by scanning it with a reference mask.
- Summing operations to compute the number of positive, negative, and zero representations.
- Finding the maximum product of these values.
These operations confirm that the proposed method avoids computationally intensive procedures, such as orthogonal transformations, making it a promising approach for real-time multimedia image processing and subsequent classification [22]. The proposed network segmentation method is particularly significant for analyzing a class of grayscale images characterized by the presence of spatially connected regions distributed within a specific grayscale range. This class includes a large group of biomedical images, particularly thermal images.
Experimental studies of PH-segmentation demonstrate correct threshold calculation during pyramidal preprocessing of thermal images. By applying the criterion expression of type (1) to evaluate the distribution of contour elements, the contour representation of thermal images can be described with sufficient accuracy [5,23]. Figure 2 presents the results of multilevel segmentation of thermal images based on pyramidal generalized contour preprocessing.
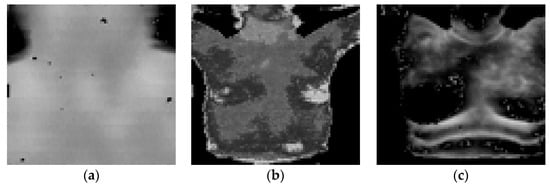
Figure 2.
A fragment of the used database of segmented test thermal images: (a)—initial thermal image after noise suppression, where the primary temperature distribution becomes visible; (b)—intermediate segmentation result showing major contour regions and separating dark, bright, and transitional areas; (c)—final multilevel segmentation output obtained after applying the pyramidal generalized contour preprocessing method, highlighting structural boundaries and defect-related regions.
At the first segmentation level, which corresponds to segmentation based on contour preprocessing (Figure 3a–c), contour elements are extracted, forming dark, bright, and intermediate regions in the thermal image according to their brightness level [5].
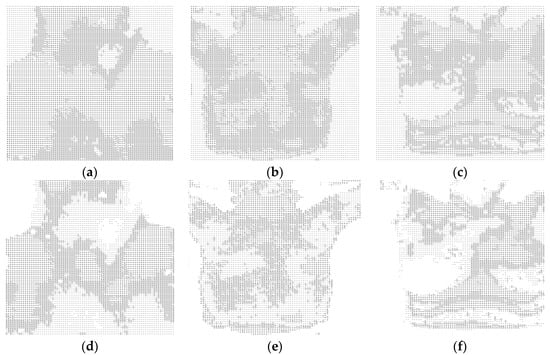
Figure 3.
Multilevel segmentation results at the first (a–c) and second (d–f) levels: (a)—initial segmentation result showing the distribution of the main contour regions; (b)—segmentation of dark, bright, and transitional temperature areas after contour refinement; (c)—final first-level segmentation highlighting the contours of major structural elements; (d)—second-level segmentation obtained after removing the darkest areas of the thermal image; (e)—refined structural segmentation emphasizing the contours of the remaining bright regions; (f)—final second-level segmentation result used for further high-level analysis.
At the second level, multilevel segmentation is performed by removing the darkest areas of the thermal image (Figure 3d–f), which correspond to negative elements. This removal of the darkest areas allows for further analysis of the brighter regions.
This procedure corresponds to recursive contour preprocessing. According to the criterion expression of type (1), preprocessing is performed for all pixels of the thermal image except those that have been removed [24].
The distribution graphs of contour elements for these thermal images are presented in Figure 4a–c. The graphs of the criterion function for contour element distribution at the first and second segmentation levels for the test thermal images are shown in Figure 5a–c. Step 1 corresponds to the first level, and step 2 corresponds to the second level of segmentation.
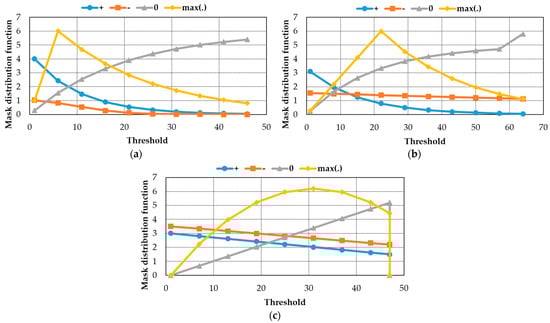
Figure 4.
Graphs of the distribution of contour preparations for thermal images presented in Figure 2a–c for the first step of multilevel segmentation: (a)—criterion function peaks at low thresholds (~8–12); counts of “+” and “−” decrease as the threshold grows, while “0” (neutral) monotonically increases; the yellow max(·) curve drops steadily after the early peak, indicating that fine contour elements vanish first as the threshold rises; (b)—peak occurs at low–mid thresholds (~15–25); “+” shows rises to a modest local maximum then decays toward zero at higher thresholds; “−” stays relatively stable; “0” increases with threshold; max(·) shows a pronounced single peak, consistent with background vs. object contrast; (c)—criterion maximum lies at mid thresholds (~25–35); “+” and “−” curves are both ap-appreciable and cross around the mid-range, reflecting multiple contour levels; “0” grows through the mid-range and flattens/slightly dips near high thresholds; max(·) declines after ~40 as structures merge.
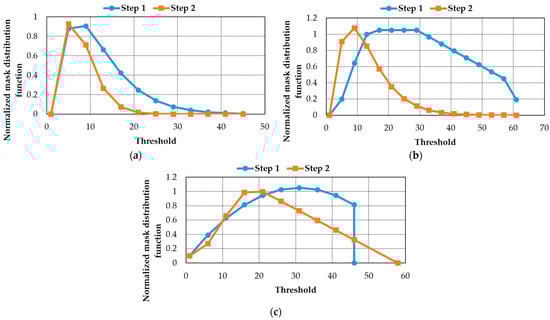
Figure 5.
Graphs of the criterion function for the distribution of contour preparations at the first and second segmentation levels: (a)—step 1: single, early peak at low thresholds (~8–12) followed by a rapid monotonic decay; long tail fades by ~40–45; step 2: peak shifts left to ~6–9, becomes narrower and lower in amplitude; the tail vanishes by ~20; (b)—step 1: broad maximum/plateau across ~20–35 with high amplitude, reflecting strong object–background contrast; step 2: sharp, earlier peak at ~10–15 with a fast decay to near zero by ~35–40; (c)—step 1: maximum at mid thresholds (~25–35); decline toward zero by ~45–50—consistent with multiple contour levels along ridges/isotherms; step 2: peak shifts left to ~20–30 with reduced amplitude and a nearly linear falloff toward high thresholds.
As shown in Figure 3d–f, at the second segmentation level, brighter areas are encoded as negative elements. Further segmentation follows the same approach as in the first level, encoding the remaining regions accordingly [6,8,9].
As can be seen from the graphs of the criterion function for the distribution of contour preparations of type (1) (Figure 4a–c) for the studied thermal images, the coordinates of their maxima shift to the left and become more narrowly directed. This is explained by the removal of certain areas of the thermal images at higher segmentation levels [8].
From the appearance of the graphs (Figure 5a–c), it follows that the criterion functions for the distribution of contour preparations for the studied thermal images do not correlate with each other. This, firstly, enables the correct differentiation of thermal images, and secondly, provides favorable results for recognition in the diagnosis of pathological processes [6,9,25].
The pyramidal generalized contour preprocessing approach, as formalized in Section 2, provides an effective framework for rail surface image analysis. By converting multi-gradation intensity images into structured contour-based representations, this method enhances defect visibility while maintaining consistent detection performance across varying lighting conditions and imaging systems [24,25,26,27].
When applied to rail inspection, the three-level encoding scheme offers practical advantages for defect classification. Negative representations effectively capture deep cracks and areas of significant material loss, which typically appear as the darkest regions in rail surface images. Conversely, positive representations identify worn or deformed areas that manifest as brighter intensity levels. The intermediate zero representations correspond to structurally intact rail surfaces, enabling clear differentiation between compromised and healthy track sections.
Figure 6 illustrates a defected rail head processed using this approach. The systematic application of pyramidal contour preprocessing enables railway monitoring systems to achieve reliable automated defect detection, reducing manual inspection efforts while ensuring infrastructure safety.
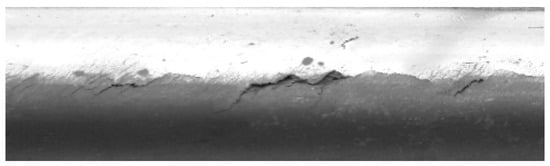
Figure 6.
Defected rail head.
To compute the binarized representations, the preprocessing threshold is selected by maximizing the product as defined in criterion (3). This maximization inherently promotes a balanced distribution of contour representations across the three categories. The mathematical basis for this property stems from the arithmetic–geometric mean (AM-GM) inequality: for a fixed total number of pixels , the product of three non-negative quantities is maximized when the quantities are equal. For example, given 300 pixels, a balanced distribution (100 × 100 × 100 = 1,000,000) yields a significantly higher product than a skewed distribution (200 × 50 × 50 = 500,000) or an extreme case (280 × 10 × 10 = 28,000). Thus, the optimization criterion naturally avoids degenerate segmentations where one category dominates. When a masked region of interest is defined (e.g., the rail head surface), the threshold is computed using only pixels within that mask; otherwise, all pixels in the rail track image are included in the optimization.
When applying the image masking operation, it becomes possible to enhance the sensitivity of the proposed method to the formation of contour representations, particularly for detecting micro-cracks and surface wear. However, this three-level representation may lead to information loss, as a wide range of grayscale gradations falls into the zero-contour category, encoding both minor defects and normal surfaces similarly. By applying the suggested approach to Figure 6, we can identify defected parts of the rail head [11,27].
To mitigate this issue, we introduce a multi-level contour representation procedure Figure 7a,b presents the results of multilevel segmentation of thermal images based on pyramidal generalized contour preprocessing. This approach involves an initial exclusion of pixels identified as negative representations during the first contour preprocessing step. Subsequently, in the second step, a refined threshold is computed for pixels initially classified as zero or positive representations.
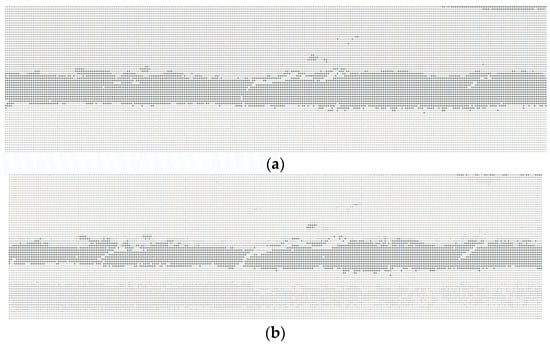
Figure 7.
Multilevel segmentation results of defected rail head: first-level segmentation result obtained after excluding negative contour representations, showing the primary distribution of contour elements and highlighting major structural irregularities of the rail head (a); second-level segmentation result generated after applying the refined threshold, providing a more detailed contour representation that enhances the visibility of critical defects and separates them from minor surface imperfections (b).
The generalized contour preprocessing operation is then reapplied, generating a new set of positive, negative, and zero-contour representations. This iterative refinement process enhances the ability to distinguish between minor rail surface imperfections and critical defects, thereby improving defect detection accuracy [11,28,29].
To obtain a comparative evaluation of the segmentation results, we utilized a database fragment of 10 thermal images. The effectiveness of PH-segmentation was assessed using the standard normalized correlation function based on the Schwarz-Bunyakovsky inequality. Manual expert segmentation served as the ground truth benchmark [11,30].
For comparative analysis of the obtained results, other segmentation methods were used, which are most like the given automatic image segmentation method. These include segmentation using the region-growing method, Otsu’s Method (Global Thresholding) and K-Means Clustering. These methods were selected as standard baselines representing different segmentation paradigms. All methods, including PH-segmentation, were applied to the same thermal image database (fragment shown in Figure 2) [13,14,31].
Table 1 presents the correlation comparison results of the segmented regions obtained using manual and automatic segmentation methods for a database fragment (10 thermal images). Each cell in Table 1 contains the correlation coefficient of the segmented regions obtained by manual and PH-segmentation. The comparison of manual and PH-segmentation results demonstrates the full adequacy of these segmentation methods for thermal images. The correlation coefficient was determined in the range of 0.95—0.99.

Table 1.
Correlation coefficients comparing PH-segmentation against manual expert segmentation.
Table 2 presents the correlation comparison results of the segmented regions obtained using the manual segmentation method and the region-growing segmentation method for the same fragment of the database (10 thermal images). Each cell contains the correlation coefficient of the segmented regions obtained by the manual segmentation method and the region-growing segmentation method.
Table 2.
Correlation comparison results of segmented regions obtained by the manual segmentation method and the region-growing segmentation method.
The comparison of manual segmentation and the region-growing segmentation method, like the first case, demonstrates the favorable adequacy of these segmentation methods for thermal images. The correlation coefficient was determined in the range of 0.9–0.97.
Table 3 presents the correlation comparison for Otsu’s Method. As a global technique, it struggles with local intensity variations, resulting in lower diagonal correlation values 0.76–0.82 and notably lower cross-correlation consistency, confirming its limited suitability for high-precision defect detection [32].
Table 3.
Correlation comparison results of segmented regions obtained by the manual segmentation method and the Otsu’s segmentation method.
Table 4 displays the results for K-Means Clustering (with ). This iterative method demonstrates improved performance over global thresholding by grouping pixels based on feature similarity. The diagonal correlation values increase to the 0.88–0.93 range, indicating a stronger agreement with expert segmentation [10].
Table 4.
Correlation comparison results of segmented regions obtained by the manual segmentation method and the K-means segmentation method.
The generalized results of the comparative analysis—correlation comparison of segmented regions obtained by manual segmentation and PH-segmentation, comparison of segmented regions obtained by manual segmentation and the region-growing segmentation method, as well as correlation comparison of segmented regions obtained by manual segmentation against Otsu’s global thresholding method, and K-Means clustering for a database containing 500 thermal images—are presented in Table 5 [10,11,24,32].
Table 5.
Comparative analysis results of various segmentation methods.
The proposed method achieves correlation coefficients of 0.95–0.99, outperforming region-growing (0.90–0.97), K-Means (0.88–0.93) and Otsu’s method (0.76–0.82). Crucially, it maintains this accuracy while requiring significantly lower computational complexity than region-growing and K-Means, making it suitable for real-time embedded systems [32].
4. Conclusions
PH-segmentation is comparable in quality to established methods and offers a key advantage: a simplified multi-level segmentation process using connectivity histograms and adaptive thresholding. This ensures efficient automatic segmentation of biomedical images into distinct regions.
By the third segmentation level, all pixels corresponding to negative representations are excluded, allowing for progressive refinement. The number of segmentation levels depends on image complexity and grayscale distribution and can be set manually or during training.
A similar approach enhances rail surface defect detection by accurately isolating cracks, corrosion, and deformations in high-resolution images. Multi-step segmentation filters out irrelevant regions, ensuring precise defect localization, while the PH transformation method refines contrast and highlights micro-cracks.
Experimental results confirm that integrating multi-step segmentation and PH transformations improves both biomedical diagnostics and rail defect detection, reducing false positives and enhancing automated analysis for safer and more efficient infrastructure monitoring.
Author Contributions
Conceptualization, L.T., V.T., N.K., Y.D., M.D. and I.V.; methodology, L.T., V.T., N.K., Y.D., M.D. and I.V.; software, L.T., V.T., N.K., Y.D., M.D. and I.V.; validation, L.T., V.T., N.K., Y.D., M.D. and I.V.; formal analysis, L.T., V.T., N.K., Y.D., M.D. and I.V.; investigation, L.T., V.T., N.K., Y.D., M.D. and I.V.; resources, L.T., V.T., N.K., Y.D., M.D. and I.V.; data curation, L.T., V.T., N.K., Y.D., M.D. and I.V.; writing—original draft preparation, V.L., L.T., V.T., N.K., Y.D., M.D., I.V., A.K. and A.P.; writing—review and editing, V.L., L.T., V.T., N.K., Y.D., M.D., I.V., A.K. and A.P.; visualization, V.L., L.T., V.T., N.K., Y.D., M.D., I.V., A.K. and A.P.; supervision, V.L., V.T., A.K. and A.P.; project administration, V.L., V.T., A.K. and A.P. All authors have read and agreed to the published version of the manuscript.
Funding
This research received no external funding.
Data Availability Statement
The original contributions presented in this study are included in the article. Further inquiries can be directed to the corresponding authors.
Conflicts of Interest
The authors declare no conflicts of interest.
References
- Hendra, F.; Mohammad, R.; Amrin, A.; Maarop, N.; Zagloel, T.Y. Systematic literature review of risk assessment techniques, standard and guidelines for railway. Int. J. Technol. 2024, 15, 1148–1161. [Google Scholar] [CrossRef]
- Wei, Y.; Han, J.; Chen, Z. Research on the temperature rise characteristics and material fatigue damage of steel rail under different contact slip ratios. Eng. Fail. Anal. 2025, 169, 109234. [Google Scholar] [CrossRef]
- Zhao, Y.; Liu, Z.; Yi, D.; Yu, X.; Sha, X.; Li, L.; Sun, H.; Zhan, Z.; Li, W.J. A review on rail defect detection systems based on wireless sensors. Sensors 2022, 22, 6409. [Google Scholar] [CrossRef]
- He, Z.; Wang, Y.; Yin, F.; Liu, J. Surface defect detection for high-speed rails using an inverse P-M diffusion model. Sens. Rev. 2016, 36, 86–97. [Google Scholar] [CrossRef]
- Kumar, A.; Harsha, S.P. A systematic literature review of defect detection in railways using machine vision-based inspection methods. Int. J. Transp. Sci. Technol. 2025, 18, 207–226. [Google Scholar] [CrossRef]
- Gao, W.; Geng, R.; Wu, H. Comparative study on rail damage recognition methods based on machine vision. Infrastructures 2025, 10, 171. [Google Scholar] [CrossRef]
- Mohammadi, S.; Karganroudi, S.S.; Adda, M.; Ibrahimm, H. Rail defect classification with deep learning method. Green Energy Intell. Transp. 2025, 5, 100332. [Google Scholar] [CrossRef]
- Xie, H.; Zhou, H.; Chen, R.; Wang, B. RAP-DETR: Enhancing RT-DETR for railway track defect detection. Measurement 2026, 258, 119058. [Google Scholar] [CrossRef]
- Quan, L.; Wang, M.; Baihang, L.; Ziwen, Z. Integration of deep learning and railway big data for environmental risk prediction models and analysis of their limitations. Front. Environ. Sci. 2025, 13, 1550745. [Google Scholar] [CrossRef]
- Otsu, N. A Threshold Selection Method from Gray-Level Histograms. IEEE Trans. Syst. Man Cybern. 1979, 9, 62–66. [Google Scholar] [CrossRef]
- Gupta, P.; Saxena, S.; Singh, S.; Dhami, S.; Singh, V. Color image segmentation: A state of the art survey. Int. J. Comput. Res. 2012, 8, 17–26. Available online: https://link.gale.com/apps/doc/A323258555/AONE?u=anon~cf730020&sid=googleScholar&xid=01332e56 (accessed on 20 August 2025).
- Dhanachandra, N.; Manglem, K.; Chanu, Y.J. Image Segmentation Using K-means Clustering Algorithm and Subtractive Clustering Algorithm. Procedia Comput. Sci. 2015, 54, 764–771. [Google Scholar] [CrossRef]
- Blasch, E.; Liu, Z.; Zheng, Y. Advances in deep learning for infrared image processing and exploitation. In Proceedings of the SPIE 12107, Infrared Technology and Applications XLVIII, 121071M, Orlando, FL, USA, 27 May 2022. [Google Scholar] [CrossRef]
- Qi, C.; Li, Q.; Liu, Y.; Ni, J.; Ma, R.; Xu, Z. Infrared image segmentation based on multi-information fused fuzzy clustering method for electrical equipment. Int. J. Adv. Robot. Syst. 2020, 17, 1–18. [Google Scholar] [CrossRef]
- Oksana, Y.; Strelko, O.; Vasilova, H.; Rudiuk, M.; Goretskyi, O. Analysis of the Possibility of Using Analytical Methods to Model the Risks and Consequences of Transport Events in the Transport of Dangerous Goods by Railway Transport. In Integrated Computer Technologies in Mechanical Engineering—2022. ICTM 2022; Nechyporuk, M., Pavlikov, V., Kritskiy, D., Eds.; Lecture Notes in Networks and Systems; Springer: Cham, Switzerland, 2023; p. 657. [Google Scholar] [CrossRef]
- Gorobchenko, O.; Holub, H.; Zaika, D. Theoretical basics of the self-learning system of intelligent locomotive decision support systems. Arch. Transp. 2024, 71, 169–186. [Google Scholar] [CrossRef]
- Xiong, L.; Jing, G.; Wang, J.; Liu, X.; Zhang, Y. Detection of rail defects using NDT methods. Sensors 2023, 23, 4627. [Google Scholar] [CrossRef]
- Rail Running Surface Inspection. Available online: https://www.networkrail.co.uk/wp-content/uploads/2019/06/Rail-Running-Surface-Inspections-v1.pdf (accessed on 20 August 2025).
- Eddy Current vs. Ultrasonic Testing in Railway Inspection. Available online: https://adortech.com/blog/eddy-current-vs-ultrasonic-testing-in-railway (accessed on 20 August 2025).
- Mićić, M.; Brajović, L.; Lazarević, L.; Popović, Z. Inspection of RCF rail defects–review of NDT methods. Mech. Syst. Signal Process. 2023, 182, 109568. [Google Scholar] [CrossRef]
- Building a Safer Future. Examining Freight Rail’s Comprehensive Safety Framework. Available online: https://www.aar.org/wp-content/uploads/2024/03/AAR-Building-A-Safer-Future-2024-White-Paper.pdf (accessed on 3 September 2025).
- Li, R.; Li, P.; Zhang, Y.; Liu, Y.; Meng, L.; Yin, W. The detection method of rail surface defects based on channel fusion. In Proceedings of the Fourth International Conference on Machine Vision, Automatic Identification, and Detection, Wuhan, China, 19 September 2025. [Google Scholar] [CrossRef]
- Tverdomed, V.; Gorban, A.; Kushmar, L. Image segmentation method of rail head defects and area measurement of selected segments. MATEC Web Conf. 2024, 390, 04008. [Google Scholar] [CrossRef]
- Min, Y.; Li, J.; Li, Y. Rail Surface Defect Detection Based on Improved UPerNet and Connected Component Analysis. Comput. Mater. Contin. 2023, 77, 941–962. [Google Scholar] [CrossRef]
- Arbelaez, P.; Maire, M.; Fowlkes, C.; Malik, J. Contour detection and hierarchical image segmentation. IEEE Trans. Pattern Anal. Mach. Intell. 2010, 33, 898–916. [Google Scholar] [CrossRef]
- Kukieła, G.; Woźnicki, J. Hierarchical Method of Digital Image Segmentation Using Multidimensional Mathematical Morphology. In Computer Analysis of Images and Patterns; Lecture Notes in Computer Science CAIP 2001; Skarbek, W., Ed.; Springer: Berlin/Heidelberg, Germany, 2001; p. 2124. [Google Scholar] [CrossRef]
- Soille, P.; Najman, L. On Morphological Hierarchical Representations for Image Processing and Spatial Data Clustering. In Applications of Discrete Geometry and Mathematical Morphology. WADGMM 2010. Istanbul, Turkey, 22 August 2010; Lecture Notes in Computer Science; Springer: Berlin/Heidelberg, Germany, 2012. [Google Scholar] [CrossRef]
- Felzenszwalb, P.F.; Huttenlocher, D.P. Efficient Graph-Based Image Segmentation. Int. J. Comput. Vis. 2004, 59, 167–181. [Google Scholar] [CrossRef]
- Ke, T.-W.; Mo, S.; Yu, S.X. Learning Hierarchical Image Segmentation for Recognition and by Recognition. In Proceedings of the ICLR 2024, Vienna, Austria, 7–11 May 2024. [Google Scholar]
- Mei, Y.; Fan, Y.; Zhang, Y.; Yu, J.; Zhou, Y.; Liu, D.; Fu, Y.; Huang, T.S.; Shi, H. Pyramid Attention Network for Image Restoration. Int. J. Comput. Vis. 2023, 131, 3207–3225. [Google Scholar] [CrossRef]
- Timchenko, L.; Kokriatskaya, N.; Tverdomed, V.; Didenko, Y.; Kotyra, A.; Kulazhanov, T.; Reshetnik, O.; Orazayeva, A.; Piliavoz, T.; Smailova, S. The method of pyramid contour Q-transformation of biomedical images. In Proceedings of the SPIE 13400, Photonics Applications in Astronomy, Communications, Industry, and High Energy Physics Experiments, Lublin, Poland, 16 December 2024. [Google Scholar] [CrossRef]
- Yushkevich, P.A.; Pashchinskiy, A.; Oguz, I.; Mohan, S.; Schmitt, J.E.; Stein, J.M.; Zukić, D.; Vicory, J.; McCormick, M.; Yushkevich, N.; et al. User-Guided Segmentation of Multi-modality Medical Imaging Datasets with ITK-SNAP. Neuroinformatics 2019, 17, 83–102. [Google Scholar] [CrossRef] [PubMed]


Disclaimer/Publisher’s Note: The statements, opinions and data contained in all publications are solely those of the individual author(s) and contributor(s) and not of MDPI and/or the editor(s). MDPI and/or the editor(s) disclaim responsibility for any injury to people or property resulting from any ideas, methods, instructions or products referred to in the content. |
© 2026 by the authors. Licensee MDPI, Basel, Switzerland. This article is an open access article distributed under the terms and conditions of the Creative Commons Attribution (CC BY) license.