Abstract
Biomedical researchers typically investigate the effects of specific exposures on disease risks within a well-defined population. The gold standard for such studies is to design a trial with an appropriately sampled cohort. However, due to the high cost of such trials, the collected sample sizes are often limited, making it difficult to accurately estimate the effects of certain exposures. In this paper, we discuss how to leverage the information from external “big data” (datasets with significantly larger sample sizes) to improve the estimation accuracy at the risk of introducing a small amount of bias. We propose a family of weighted estimators to balance bias increase and variance reduction when incorporating the big data. We establish a connection between our proposed estimator and the well-known penalized regression estimators. We derive optimal weights using both second-order and higher-order asymptotic expansions. Through extensive simulation studies, we demonstrate that the improvement in mean square error (MSE) for the regression coefficient can be substantial even with finite sample sizes, and our weighted method outperformed existing approaches such as penalized regression and James–Stein estimator. Additionally, we provide a theoretical guarantee that the proposed estimators will never yield an asymptotic MSE larger than the maximum likelihood estimator using small data only in general. Finally, we apply our proposed methods to the Asia Cohort Consortium China cohort data to estimate the relationships between age, BMI, smoking, alcohol use, and mortality.
MSC:
62J12; 62P10
1. Introduction
In most research settings in medicine, we aim to know the effect of a specific exposure to the risk of some specific disease among a well-defined targeted population. To achieve this goal, well-designed trials are usually used. However, the sample sizes for such studies are usually limited due to the high cost of recruitment and thus the sample size usually just has the power to detect the effect for the primary exposure of interest. In the meantime, the number of available observational studies or trial studies from other populations is accumulating quickly nowadays. Can we use information from these data to improve our inference on the population where small data are drawn from? Here, we refer to the randomized clinical trial data that have a clearly defined target population by the design and sampling scheme as “small data” and refer to other external data as “big data”. Our goal is to efficiently combine the information from these two types of data to obtain a more accurate estimation of the association between some readily available quantities that are presented in both data (e.g., age and gender) and the risk of diseases among the population where small data are drawn from. Since the distributions of predictors, as well as the relationship among these predictors and the event of interest, are likely to be different between “big data” and “small data”, we are at risk of introducing some bias when using the information from big data. However, given the size of the big data, they can still provide insightful information about how we predict risk among the targeted population, assuming that the two populations share a certain degree of similarity in their prediction model forms. This motivates us to find an estimator that is better than using “small data” only with a bias–variance trade-off. Directly pooling the two data together can lead to substantial bias and increase mean square error (MSE) when the difference between the two sources is large. This motivates us to find estimators that always do not lead to increased MSE and lead to decreased MSE under certain situations when compared with estimator that using “small data” only.
Previous studies have shown the plausibility of this type of idea. In the simple mean estimation, ref. [1] showed that the simple sample mean is inadmissible. Ref. [2] studied the combining of regression results from small and big data in a linear regression setting and showed Stein-type results for Gaussian responses, i.e., the use of small data only is inadmissible when and degree of freedom is more than 10. Ref. [3] proposed to use shared Lasso to achieve this in a linear regression setting. However, the similar enhanced regression approach for non-Gaussian outcomes has not been fully studied. To our knowledge, risk prediction work is mostly dependent on the assumption that certain reduced marginal models or marginal information from the big data are accurate [4,5]. In this work, we propose to fill the gap of risk prediction by combining information from small and big data for binary outcomes that rely on an alternative structural assumption, where we assume the effect structure rather than the effect magnitude is the same. Specifically, we proposed two new estimators that can incorporate information from big data to improve efficiency in estimating parameters related to small data. We showed that these estimators are better than using small data both theoretically and via extensive numerical studies. In addition, we compared our proposed estimators with several existing alternative estimators (pooled estimator, penalized regression estimator, and James–Stein estimator).
The structure of this paper is as follows: In Section 2, we introduce the notation and models we used followed by our proposed estimators and their connection to other existing estimators. In Section 3, we study the performance of different estimators for their finite sample properties and show the improvement using our proposed estimator. In Section 4, we provide theoretical results that guarantee our proposed estimator to be no worse than the small data-only analysis in terms of MSE. In Section 5, we applied our method to analyze the Asia Cohort Consortium data with sensitivity for potential violation of model assumptions. In Section 6, we discuss the potential extension of our proposed estimator to a more general setting.
2. Methods
2.1. Notation and Model
We denote our outcome of interest as and denote the design matrices by and , where and represent the sample sizes for the small data and the big data, respectively. In general, we reserve the subscripts B and S to denote quantities related to the big data and the small data, respectively. Since the outcomes of interest are binary (disease occurrence), denoting , we assume logistic regression models for both the small data and the large data and write them as
where and are unknown regression parameters, and is the indicator function. Our goal is to obtain an accurate estimation of while treating as a nuisance parameter using information from both the small and big data. In this project, we propose novel weighted shrinkage estimators and relate them to the penalized regression-based estimators. We compare the performance of weighted estimators, penalized estimators, and the James–Stein-type shrinkage estimator [6,7]. In this paper, we adopt the following big O and small O notations: A sequence is said to be if and is said to be if ; a random variable sequence is said to be if for and is said to be if for arbitrary when .
2.2. Penalized Regression-Based Estimators
Here, we first introduce the existing penalized regression-based estimators that can be used to integrate the information from the two data sets. We consider minimizing the following object function to obtain an estimate of , where a penalty is put on only:
where is the penalty term. The estimators from the above optimization problem can be implemented using a penalized logistic regression such as glmnet in R 4.0 [8] with a design matrix that has a row like and the penalty factor . Here, the form of the penalty term can be flexible, for example, for LASSO penalty [9,10], for ridge regression penalty. Other penalties like elastic net [11], SCAD [12], and MCP [13] can also be used, but for comparison purposes, we use and penalty to represent the performance of this class of estimators.
When the prediction in the small dataset is more important than the estimation of regression parameter , instead of penalizing based on the parameter, we might penalize on the extra linear predictor and use to replace . The tuning parameter could be determined via fold cross-validation [14] in the small data set.
2.3. Weighted Shrinkage Estimator
We propose an alternative approach to the penalized regression method via the weighted shrinkage method. This method has been shown to be useful under a linear regression model [2]; however, as we see in this section, the application of it to this nonlinear model is not straightforward.
The basic idea of this kind of weighted shrinkage estimator is to first fit the logistic regression model among the small data and the big data separately to obtain and as the estimator for and and then combine the two estimators through a weighted average for a specific weight matrix . Specifically, when , this is just the estimator of using small data only, and when , this can be approximately viewed as a pooled estimator of the small and the big dataset assuming .
It is obvious that the performance of highly depends on the choice of weight matrix W. The major goal here is to find the optimal weight matrix as a function of , and data , , where and are design matrices for small and large data, respectively. Here, we define optimal weight by the weight that minimizes the coefficient estimation error .
To find the form for the optimal weight, we use the asymptotic expansion of and . The optimal weight obtained via second-order approximation is denoted as , and the optimal weight obtained via higher-order Edgeworth expansion [15] is denoted as . For all these weights, we could plug in and for and to obtain estimated version of these optimal weights.
Another existing estimator that we want to compare our newly proposed estimator with is the James–Stein estimator. For the James–Stein estimator, we use the form from [16], i.e, or , where and , is the test statistic for . Here, we have .
Now, we provide more details on how to obtain these weights. We begin with the second-order approximation. Using the expansion of the logistic regression estimator, we have
where are the variance of , and are the variance of . Ignoring the and terms in the above expansion lead to second-order optimal weight
where , and corresponding estimated second-order optimal weight , where means the terms and are replaced by their consistent estimated version and , where and with and .
For the higher-order approximation, we use the approximation
where , , and the expression of higher-order terms can be found in Appendix A. We have and , , and . Denote , , , , and , , , , , and , . Ignore , terms; we have is minimized at
where
The estimated version can be denoted as , where means , , , , , , , , , , , in are replaced by their consistent estimators (i.e., and replaced by and and expectation and variance replaced by sample mean and sample variance-covariance within the expression of , , , , , , , , , , , terms).
2.4. Relationship Between Two Types of Estimators
The shrinkage estimator defined above is closely related to the penalized estimator. W can be written as based on the penalty using the asymptotic linear expansion of GLM as in Equations (2) and (5) are the term, whose form can be obtained from Edgeworth expansion [17]. To relate this to the penalized regression method, we consider the following penalized version and find and minimize
Denote and and , the score function will be
and the information matrix
So, we have the approximation
Define and
Then, we have
So, we can see that with different choices of and , the penalized estimator is asymptotically equivalent to the weighted estimator.
3. Simulations
To see how much efficiency we can gain using our proposed estimator under a finite sample setting, we use a detailed simulation exercise, as described below, to compare the different methods with each other. In these simulations, we consider different sizes for p, the dimension for (including intercept), such that , but we set the norm of , i.e., to be fixed at . We also vary , the amount of bias in the big data such that takes the following values . We generate the small data and the big data from the same Gaussian distribution, and the covariates are assumed to be uncorrelated with each other. We also vary , the size of the small data , between 100 and 500 in increments of 50 (thus ), while we consider two fixed sizes for , namely {1000, 10,000}. For each simulation, we generate Y based on our assumed logistic models for the small and the big data, given in Equation (1). In addition, we also consider the setting where is 0 and the setting where the bias of is due to covariate missing in the big data.
For each simulation scenario, we perform 100 simulations to compute the mean squared error (MSE) in estimation, . We obtain estimates for by (1) using small data only (Small), (2) pooling big and small data (Pool), (3) weighted with optimal weight from second-order approximation (), (4) weighted with optimal weight from higher-order approximation (), (5) penalized regression (), (6) penalized regression (), or (7) JS+ weighted estimator (JSP).
Table 1 and Table 2 provides the mean square error (MSE) of the 7 estimators listed above under various small data sample sizes (), number of covariates (p), and the magnitude of bias in the big data (). The simulation results are further summarized in Figure 1 and Figure 2 to compare the efficiency gain between different methods and to show the trend of efficiency gain over the sample size of the small data. Specifically, Table 1 and Figure 1 provide results for different simulation settings when while Table 2 and Figure 2 provide results for different simulation settings when = 10,000. In each figure, nine plots are presented in a grid of three rows and three columns, where the columns show plots for a particular ratio of (in increasing order of magnitude from left to right), while the rows show plots for different dimension size p (in increasing order of magnitude from top to bottom). Figure 3 shows the setting without bias (i.e., ), and Figure 4 shows the setting where the bias in the big data is due to missing of . Each plot in the grid presents the graphs of the log-transformed ratio of the MSE of , when we use each of the procedures (Small, Pool, , , , , JSP), versus that when we only use the small data (Small), as a function of the varying sizes for . A specific curve below the horizontal zero line indicates that the estimator is consistently more efficient than the estimator from using small data only. When the curve for an estimator A is lower than the curve for another estimator B, it shows that estimator A is consistently more efficient than estimator B. From the plots, we can make the following observations:

Table 1.
Mean square errors (MSE) of when we use each of the procedures (Small, Pool, , , , , JSP) for varying sizes of , number of covariates p, and magnitude of bias when is 1000.
Table 2.
Mean square errors (MSE) of when we use each of the procedures (Small, Pool, , , , , JSP) for varying sizes of , number of covariates p, and magnitude of bias when is 10,000.
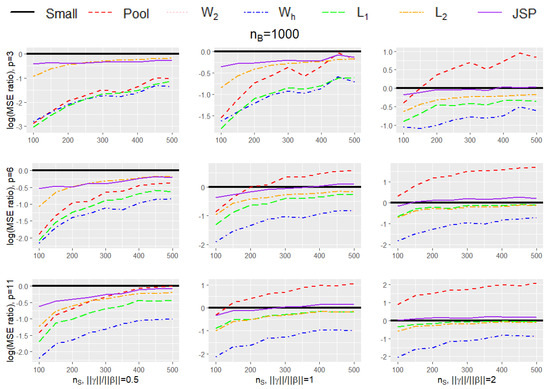
Figure 1.
Plot for the log-transformed ratios of the mean squared error of , when we use each of the procedures (Small, Pool, , , , , JSP), versus that when we only use the small data (Small), for varying sizes of and when is 1000.
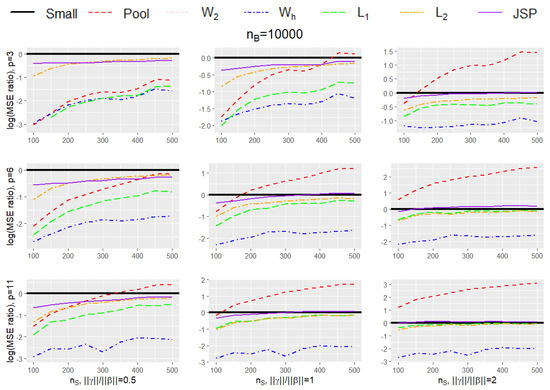
Figure 2.
Plot for the log-transformed ratios of the mean squared error of , when we use each of the procedures (Small, Pool, , , , , JSP), versus that when we only use the small data (Small), for varying sizes of and when is 10,000.
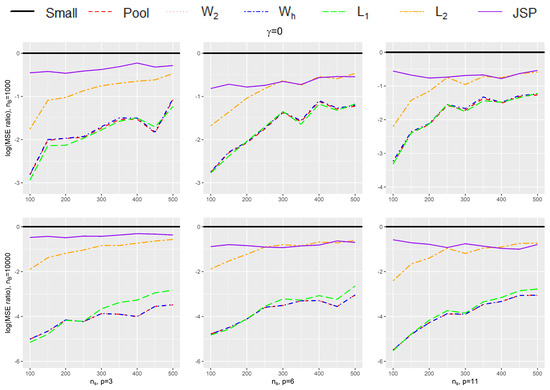
Figure 3.
Plot for the log-transformed ratios of the mean squared error of , when we use each of the procedures (Small, Pool, , , , , JSP), versus that when we only use the small data (Small), for varying sizes of and when .
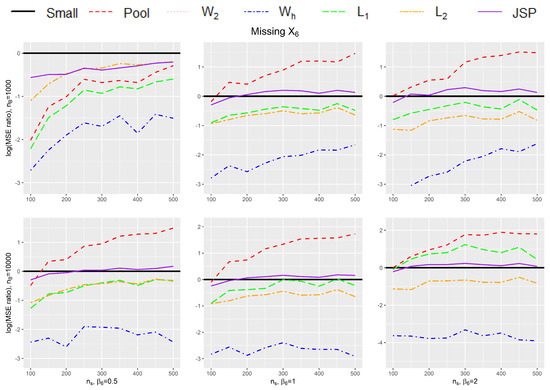
Figure 4.
Plot for the log-transformed ratios of the mean squared error of , when we use each of the procedures (Small, Pool, , , , , JSP), versus that when we only use the small data (Small), for varying sizes of and when the bias term is caused by missing the covariate in big data.
- The performance of and procedures are very close to each other in every setting, pointing to the fact that probably the optimal second-order approximation weights suffice for our problem (in fact it is difficult to visually observe the graph for as it is exactly overlaid by the graph for ).
- In every simulation setting, the and the procedures outperform every other method. The gain in performance of and over the next best-performing method increases with increasing dimension size p, and increasing ratio of . The same trend is observed for both sizes for (1000/10,000).
- The penalized procedure is the third best-performing method overall (after and ), and its performance is similar to the / procedures when dimension size is small (), and the relative bias is low ().
- The pooled procedure is the worst-performing method overall and is quite sensitive to the bias . Although it shows relatively good performance when dimension size is small (), and when the relative bias is low (), with increasing dimensions, and especially with increasing bias, its performance becomes very poor. Apart from JSPs in some scenarios, it is the only procedure that shows extremely elevated MSEs in comparison to the small data.
- The performance of the procedure is similar to JSP in some settings but is better than it in others. For example, with increasing dimensions, and with increasing bias, the JSP procedure sometimes tends to have higher MSE than those obtained from the small data (Small), especially when the size of the small data is on the higher end, but the procedure always performs better than Small.
- All methods (except for Pool and in some instances JSP) show lower MSE than the estimates obtained from the small data themselves, and the gain in efficiency is most pronounced when the size of the small data is small.
4. Theoretical Results
The simulation results indicate that our proposed estimator always outperforms the small-data-only analysis in terms of MSE and such improvement is substantial sometimes. However, to apply our proposed method in general, a natural question is whether there exists a certain scenario under which the proposed estimator will underperform the small-data-only analysis, especially when the difference between the two sources of data is large. To answer this question, here we summarize the theoretical guarantee of our proposed weighted estimators in the following theorems with brief proof idea and the detailed expression and proof can be found in the Appendix A.
Theorem 1.
The second-order optimal weight and its estimated version approximately minimize at level in the sense that
where the infimum is taken over all random matrix that are measurable given .
and are also approximate optimal weights for prediction purpose in the sense that
For the proof of Theorem 1, we can use the second order expansion of around to obtain the optimal weight as a function of and . Since the approximation error for will be at the level of , the mean square error for and mean square prediction error can be approximated with error at level . Replacing optimal weight with estimated optimal weight will further introduce an error term of , but the term will still be the dominant term. Details can be found in Appendix A.
Theorem 2.
The higher-order optimal weight and its estimated version approximately minimize at and level in the sense that
Similarly, for Theorem 2, we can use the high order expansion of around with approximation error at the level of , then the approximation error for the mean square error for and mean square prediction error will be at the level of . In addition, we can show that the difference between MSE based on this estimated optimal weight and the optimal oracle weight is with an approximation error of the order of so that the final approximation error will be at the level of .
Theorem 3.
Assuming and , the weighted estimator based on estimated higher-order optimal weights is more efficient than using small data only, i.e., hold asymptotically when .
For Theorem 3, since using small data only is equivalent to using weight matrix I, we can show that the improvement from the estimated higher-order optimal weight is always larger than the estimated second-order optimal weight which is in the order of and thus approximation error can be ignored when comparing and .
5. Analysis of ACC Data
The Asia Cohort Consortium (ACC) is a collaborative effort born out of the need to study the Asian population, seeking to understand the relationship between genetics, environmental exposures, and the etiology of a disease through the establishment of a cohort of at least one million healthy people around different countries in Asia, followed over time to various disease endpoints and death. This pooling project, with its huge sample size across 29 subcohorts from 10 Asian countries (https://www.asiacohort.org/ParticipatingCohorts/index.html (accessed on 23 March 2017)), provides the perfect opportunity to explore informative relationships (association of exposure with disease, genome variability with disease, etc.) among major Asian ethnic groups.
Over the last few decades, obesity has become an important health issue in many countries. According to World Health Organization estimates, more than a billion adults around the world are overweight, and at least 300 million of them are obese (see [18]). Many epidemiological studies have found an association between the body mass index (BMI) and a variety of health outcomes, including mortality (see [19]). However, most of these inferences have been drawn from studies in populations of European origins, and very little focus has been given to the relationship between BMI and the overall risk of death among Asians, who account for more than 60% of the world population (see [20]). The data collected as part of the ACC can be used to answer these important questions.
To show the usefulness of our proposed methodology in a practical setting, we use data from the ACC to explore the relationship between BMI and mortality. In particular, we concentrate only on the cohorts from China—data from the Shanghai Cohort Study (SCS) are used to form our small data—while data from the rest of the Chinese subcohorts—China Hypertension Survey Epidemiology Follow-up Study (CHEFS), Linxian General Population Trial Cohort, Shanghai Men’s Health Study (SMHS), and Shanghai Women’s Health Study (SWHS)—are pooled together to form the initial big data. Since the SCS cohort only included males, we decided to restrict the big data to include only male participants from the other subcohorts (which completely excluded the SWHS). For individuals in the small data, enrollment started in 1986 and the study continued till 2007, while for the pooled large data, enrollment started in 1985, and the last year of follow-up was 2011. Missingness in covariates is not a big concern (no missingness in the small data and only 0.79% missingness in the large data). The baseline age distribution of the individuals is found to be different in the small and the large data, and since mortality is a definite function of age, for better comparability, we decided to restrict the two datasets such that they contain individuals whose baseline age varied between 50 and 60. And because methods described in this paper pertain to binary outcomes only, and time to follow-up varies for different individuals in the two datasets, we decided to only consider the first year of follow-up for each individual. Firstly, this makes the binary statuses of mortality comparable for individuals in the two datasets, and secondly, the short period of follow-up ensures that we do not lose too many individuals who are lost to follow-up. Such individuals form only 0.06% of the small data and 2.88% of the large data and are removed from the analysis. After performing all these data management steps, the small data are found to contain 10,675 individuals with 40 mortality events, while the large data are found to contain 46,779 individuals with 206 events. Apart from BMI, baseline age is also included as a covariate in the model, as well as indicators for each individual’s smoking and drinking habits, as these covariates have been proven to be important predictors of mortality in many settings.
We start off by analyzing the small and the big data separately first, using the standard logistic regression model, and then pooling them together. We then estimate the regression coefficients using the proposed weighted shrinkage methods, namely, with the optimal second-order weights (), the optimal higher-order Edgeworth weights (), and for comparison, the optimal James–Stein weights (JSPs). We also obtained the penalized estimates, using the and procedures.
The estimates, their standard errors, and estimated mean square errors for the various procedures are presented below in Table 3. Unlike the simulation data, we cannot know the true bias, and thus, we cannot obtain the true MSE. To illustrate the efficiency gain of the proposed estimators, we estimated MSE for each method by approximating the bias by the difference between the point estimate of each method and the small data estimator. From the table, we can see that the two proposed weighting estimators and provide smaller estimated MSEs than the estimator using small data only. These numerical results match the theoretical results from Theorem 3 as expected, since we have a large sample size here for and to make the asymptotic results hold. In addition, we noticed that except for the intercept, the two proposed weighting estimators and also provide smaller estimated MSE than other alternative estimators which is consistent with the simulation results. As can be seen, the pooled procedure obtains the lowest standard errors as expected, because it uses the entirety of the big and the small data, but it also means that the estimates for this procedure are inherently biased towards the ones that we obtain from the big data themselves, as it contains a lot more information (than the small data) because of its size, so naive pooling inappropriately shifts most of the focus to the big data themselves. The weighted shrinkage procedures seem to be better adjusted in this respect, with estimates shrunk somewhat but much closer to the ones that we see from the small data themselves but with much lower standard errors than the small data estimates. The optimal second-order and higher-order Edgeworth weights ( and ) we proposed perform similarly in this regard and have lower standard errors than the estimates from the James–Stein-adjusted weights (JSPs), except for BMI, in which case the JSP procedure obtains a lower standard error than or ; however, the estimate for BMI obtained by JSP is shrunk completely to that obtained from the big data themselves, which implies potential large bias. Similarly, for other variables, the JSP estimate is far from the small data estimator compared with our two proposed weighted estimators which suggests a potential larger bias. Among the penalized procedures, seems to borrow more strength from the big data and thus has lower standard errors and a higher amount of shrinkage, which leads to potential higher bias, while the estimates for the procedure seem to be closer to the small data estimates and thus have higher standard errors compared with the proposed weighted estimators. In general, the two proposed weighted estimators show a better balance of bias and SD in this example.
Table 3.
Estimates (Est), their standard errors (Std Err), and estimated mean square error (Est MSE) from ACC data analysis.
6. Discussion
In this paper, we proposed better estimators that allow more accurate estimation of the regression coefficient and the risk prediction for our target population using information from another different population with more observations. Although the expansion and detailed form of the weight we provided are specifically for logistic regression, the optimal weight formula is general in terms of the expansion formula C, D, Es. So the framework we proposed here could be extended to a generalized linear model and estimating equation models straightforwardly, though the more complicated computation of Edgeworth expansion for these estimating equation-based estimators needs to be derived for the optimal estimation weight.
To utilize big data, although we do not need to know the exact relationship between the small and big data in terms of association strength, we need the model form in big data to be correctly specified. In our setting, the same logistic form needs to hold for both the big and the small data. When the covariate is limited and categorical, this assumption is weak and easy to satisfy. When there is a continuous covariate, we can apply existing model-checking tools to the big data to check whether our model assumption holds.
In our analysis of the ACC data, we only concentrated on the first year of follow-up, because the methods presented in this paper are only relevant for binary outcomes, and the short period of follow-up ensured that we did not lose too many individuals to loss to follow-up, which would have otherwise introduced unforeseen sources of bias in our analysis. However, in doing so, we lost a lot of rich information that is contained in the time-to-follow-up data. This shows the need to extend our methods to the case when we have time-to-event data, and this indeed is one of our future research goals.
Author Contributions
Conceptualization, C.Z. and Y.-Q.C.; methodology, C.Z. and Y.-Q.C.; software and data analysis, S.D., Y.X. and A.H.; resources, Y.-Q.C.; data curation, Y.-Q.C.; writing—original draft preparation, C.Z., S.D., Y.X. and A.H.; writing—review and editing, C.Z., S.D., Y.X., A.H. and Y.-Q.C. All authors have read and agreed to the published version of the manuscript.
Funding
This research was partly funded by the National Institute of General Medical Science U54 GM115458.
Data Availability Statement
Restrictions apply to the availability of these data. Data were obtained from ACC and are available from the corresponding author at https://www.asiacohort.org/ParticipatingCohorts/index.html (accessed on 23 March 2017) in a collaboration mode with the permission of ACC.
Conflicts of Interest
The authors declare no conflicts of interest.
Abbreviations
The following abbreviations are used in this manuscript:
| MSE | Mean square error |
| ACC | Asia Cohort Consortium China |
| BMI | Body mass index |
| LASSO | Least Absolute Shrinkage and Selection Operator regression |
| SCAD | Smoothly Clipped Absolute Deviation |
| MCP | Minimax Concave Penalty |
Appendix A
Appendix A.1. High-Order Expansion for Logistic Regression
In this section, we derive the high-order asymptotic expansion for the maximum likelihood estimator based on n i.i.d. data sampled from the logistic regression model . The small and big data expansion can be obtained by replacing X by and , replacing by and and replacing n by and .
For logistic regression, we have the score function written as . Let and , then converge to standard normal distribution. So, following Sun, Loader, McCormick [17], we have that where
with
where is a matrix with the th element equal to .
Similarly, we have , where
where
and
where
where is a matrix with the th element equal to and
Now, we have , where
where
and
where
where
So, we have
and
Using subindex S and B, we can obtain , , , and , and we can estimate the mean and variance and the covariance between these terms using an empirical version of these terms.
Appendix A.2. Proof of Theorem 1
Proof of Theorem 1.
Under second-order approximation, we have
minimize the quadratic form when ignoring the term. Denote the real optimal weight as , and the optimal value is ; then, we have
For the main part, we have that minimize both the estimation MSE and prediction MSE with the same approximation error rate. So, we finish the first part of the proof.
Note that both and are consistent, so we have , so . So, this leads to the conclusion
and assume is bounded; then, we have
□
Appendix A.3. Proof of Theorem 2
Proof of Theorem 2.
We have and , and . Denote , , , and , , , , , and , . So, the mean square error for a weight matrix W will be
This can be simplified as
where
So we have minimize the . Denote the real optimal weight as and the optimal value is , then we have
So, we finish the first part of the proof.
Following the proof of Theorem 1, we have and , which will lead to the result
□
Appendix A.4. Proof of Theorem 3
Proof of Theorem 3.
When , or if we allow to be a function of sample size such that , then we have , and the improvement in MSE by using oracle high-order weight will be on the order of , so combined with Theorem 2, we conclude that the estimated high-order weight will lead to smaller MSE compared with using small data only.
When , we have , so the improvement is on the order of from Taylor expansion . Thus, we cannot directly apply Theorem 2 to obtain the conclusion that the estimated high-order weight is always superior to using small data only.
To obtain the conclusion we want, we need to show that ignoring the approximation error term, the estimated weight leads to a smaller main part compared with using small data only, i.e.,
It is obvious that the main estimation error contributes to the estimated weight that comes from the term, while the estimation error of other parts, c, d, e, , are asymptotically ignorable. The improvement from the high-order approximation is asymptotically larger than the second-order approximation, and the improvement of the second-order approximation part is shown to always be positive and is on the order of with large (see Section 9.7 of [2]). This proves that , and thus, we have
when is large. □
References
- Stein, C.M. Estimation of the mean of a multivariate normal distribution. Ann. Stat. 1981, 9, 1135–1151. [Google Scholar] [CrossRef]
- Chen, A.; Owen, A.B.; Shi, M. Data enriched linear regression. Electron. J. Stat. 2015, 9, 1078–1112. [Google Scholar] [CrossRef]
- Gross, S.M.; Tibshirani, R. Data shared Lasso: A novel tool to discover uplift. Comput. Stat. Data Anal. 2016, 101, 226–235. [Google Scholar] [CrossRef] [PubMed]
- Chatterjee, N.; Chen, Y.; Maas, P.; Carroll, R.J. Constrained maximum likelihood estimation for model calibration using summary-level information from external big data sources. J. Am. Stat. Assoc. 2016, 111, 107–117. [Google Scholar] [CrossRef] [PubMed]
- Cheng, W.; Taylor, J.M.G.; Gu, T.; Thomlins, S.A.; Mukherjee, B. Informing a risk prediction model for binary outcomes with external coefficient information. J. R. Stat. Soc. Ser. C 2019, 68, 121–139. [Google Scholar] [CrossRef] [PubMed]
- Efron, B.; Morris, C. Stein’s estimation rule and its competitors—An empirical Bayes approach. J. Am. Stat. Assoc. 1973, 68, 117–130. [Google Scholar]
- James, W.; Stein, C. Estimation with quadratic loss. Proc. Fourth Berkeley Symp. Math. Statist. Prob. 1961, 1, 361–379. [Google Scholar]
- Friedman, J.; Hastie, T.; Tibshirani, R. Regularization Paths for Generalized Linear Models via Coordinate Descent. J. Stat. Softw. 2008, 33, 1–22. [Google Scholar] [CrossRef]
- Efron, B.; Hastie, T.; Johnstone, L.; Tibshirani, R. Least angle regression (with discussion). Ann. Stat. 2004, 32, 407–499. [Google Scholar] [CrossRef]
- Tibshirani, R. Regression shrinkage and selection via the Lasso. J. R. Stat. Soc. Ser. B 1996, 58, 267–288. [Google Scholar] [CrossRef]
- Zou, H.; Hastie, T. Regularization and variable selection via the elastic net. J. R. Stat. Soc. Ser. B 2005, 67, 301–320. [Google Scholar] [CrossRef]
- Fan, J.; Li, R. Variable selection via nonconcave penalized likelihood and its oracle properties. J. Am. Stat. Assoc. 2001, 96, 1348–1360. [Google Scholar] [CrossRef]
- Zhang, C.H. Nearly unbiased variable selection under minimax concave penalty. Ann. Stat. 2010, 38, 894–942. [Google Scholar] [CrossRef] [PubMed]
- Arlot, S.; Celisse, A. A survey of cross-validation procedures for model selection. Stat. Surv. 2010, 4, 40–79. [Google Scholar] [CrossRef]
- Hall, P. The Bootstrap and Edgeworth Expansion; Springer: New York, NY, USA, 1992. [Google Scholar]
- An, L.; Fung, K.Y.; Krewski, D. Mining pharmacovigilance data using Bayesian logistic regression with James-Stein type shrinkage estimation. J. Biopharm. Stat. 2010, 20, 998–1012. [Google Scholar] [CrossRef]
- Sun, J.; Loader, C.; McCormick, W.P. Confidence bands in generalized linear models. Ann. Stat. 2000, 28, 429–460. [Google Scholar] [CrossRef]
- Abelson, P.; Kennedy, D. The obesity epidemic. Science 2004, 304, 1413. [Google Scholar] [CrossRef] [PubMed]
- Haslam, D.W.; James, W.P. Obesity. Lancet 2005, 366, 1197–1209. [Google Scholar] [CrossRef] [PubMed]
- Zheng, W.; McLerran, D.F.; Roll, B.; Zhang, X.; Inoue, M.; Matsuo, K.; He, J.; Gupta, P.C.; Ramadas, K.; Tsugane, S.; et al. Association between body-mass index and risk of death in more than 1 million Asians. N. Engl. J. Med. 2011, 364, 719–729. [Google Scholar] [CrossRef]
Disclaimer/Publisher’s Note: The statements, opinions and data contained in all publications are solely those of the individual author(s) and contributor(s) and not of MDPI and/or the editor(s). MDPI and/or the editor(s) disclaim responsibility for any injury to people or property resulting from any ideas, methods, instructions or products referred to in the content. |
© 2025 by the authors. Licensee MDPI, Basel, Switzerland. This article is an open access article distributed under the terms and conditions of the Creative Commons Attribution (CC BY) license (https://creativecommons.org/licenses/by/4.0/).