Abstract
Mathematics is a discipline that forms the foundation of many fields and should be learned gradually, starting from early childhood. However, some subjects can be difficult to learn due to their abstract nature, the need for attention and planning, and math anxiety. Therefore, in this study, a system that contributes to mathematics teaching using computer vision approaches has been developed. In the proposed system, users can write operations directly in their own handwriting on the system interface, learn their results, or test the accuracy of their answers. They can also test themselves with random questions generated by the system. In addition, visual graph generation has been added to the system, ensuring that education is supported with visuals and made enjoyable. Besides the character recognition test, which is applied on public datasets, the system was also tested with images obtained from 22 different users, and successful results were observed. The study utilizes CNN networks for handwritten character detection and self-created image processing algorithms to organize the obtained characters into equations. The system can work with equations that include single and multiple unknowns, trigonometric functions, derivatives, integrals, etc. Operations can be performed, and successful results can be achieved even for users who write in italicized handwriting. Furthermore, equations written within each closed figure on the same page are evaluated locally. This allows multiple problems to be solved on the same page, providing a user-friendly approach. The system can be an assistant for improving performance in mathematics education.
MSC:
68T45
1. Introduction
Mathematics is an important discipline that develops people’s abstract thinking skills and forms the basis of many branches of science [1,2,3]. However, the abstract structure of mathematics creates difficulties, especially for students, in the teaching process and often causes anxiety among students [4,5]. Reasons for this may include the level of abstraction, concepts without concrete equivalents, the difficulty of symbolic language, computational complexity, and the fact that multi-step problem solving requires attention and planning, as well as math anxiety and low self-confidence [6,7,8,9].
Owing to technological developments, Artificial Intelligence and virtual reality-based systems assist learning stages in many areas [10,11,12]. A system was developed to overcome the inexperience of drivers in traffic training by simulating safedriving through the simulator [13,14]. To use in e-learning platforms, AI-based personalized systems were developed in [15]. In [16,17,18,19], the, benefits of AI-based systems were emphasized in medical training. In [20], the authors presented a simulator developed for earning performance [21,22]. Ref. [23] investigated the impact of an AI-powered learning assistant on student learning. A quantitative experiment was conducted in 2023 with 275 students (ages 14–20) from two middle schools and two high schools. The students were given a problem set on a previously unfamiliar mathematical topic for 90 min. The experimental group was able to ask questions to the AI learning assistant, while the control group used only keyword searches. According to t-test results, the experimental group in the advanced course showed a significant increase in performance. Consequently, the AI-powered learning assistant significantly improved the problem-solving and knowledge acquisition performance of advanced mathematics students in particular.
Visualizing abstract mathematical concepts and making these concepts easier to understand provide effective support for educational processes [24,25]. In this context, the tools provided by technology and artificial intelligence-based systems can bring significant innovations in mathematics teaching, while traditional teaching methods are foundational, they frequently fall short in making complex mathematical concepts accessible and engaging. This gap inspired the exploration of innovative solutions that use artificial intelligence (AI) and computer vision technologies to transform the way mathematical concepts are learned and taught.
With the above motivations, this paper presents a system that integrates artificial intelligence and computer vision approaches into mathematics education; thus, it significantly enhances students’ comprehension and interactive learning experience. In the proposed system, users can write mathematical operations and equations in their own handwriting, measure the accuracy of the results, and view the results graphically. Also, users can evaluate their own skills using randomly generated questions. Various algorithms have been developed for users who write in italicized script, achieving high-performance results. The system utilizes CNN networks and self-designed image processing algorithms to perform these operations.
This study contributes to the literature in terms of three ways:
- Integration of AI in education: A system that solves mathematical equations quickly, checks users’ results, and produces the function graph visually has been proposed. The system will support users in learning mathematics and performing complex operations efficiently.
- Self-designed Image processing Algorithms: The algorithms were developed to determine which equation the input characters belong to, as described in detail in the methodology section. These approaches can also be generalized to other problems that require image preprocessing.
- Hybrid usage of deep learning and rule-based method: Mathematical characters were first classified using CNN networks, then, using rule-based approaches, classification performance improved. These hybrid approaches can inspire other applications.
2. Related Works
2.1. Contour-Based Character Classification
A contour is a sequence of points representing a closed shape. Contour recognition is one of the preliminary steps of image processing that is frequently used for many tasks, such as object classification and segmentation. There are different contour recognition approaches presented in the literature for different tasks. In [26], a contour-based approach was used for handwriting recognition. In the study, line segmentation was performed to extract sentences, word segmentation was performed to extract words, and character segmentation was performed to extract letters one by one. For this purpose, segmentation was performed into contours by setting different kernel sizes. Then, classification was performed. In the experiments conducted on datasets collected from E-MNIST and UCI, 79.3% accuracy was obtained for E-MNIST and 93% for UCI. A CNN approach to detect contours was proposed in [27]. In the study, to cope with different sparsity levels of the contours, some priority pooling layers were used. The authors evaluated their method in EMNIST, and an approximately 96% accuracy score was obtained.
In the proposed study, handwritten characters are separated using contour detection. Each contour is detected as a separate character. Then, the algorithm continues with the next step.
2.2. Mathematical Assistant Systems
Although there are some mathematical assistant system studies in the literature, there are some gaps: In [28], a CNN-based mathematical expression solver has been developed. The study can solve basic mathematical equations and trigonometric functions. The proposed study differs by creating graphics of given functions, performing derivative and integral calculations, and coping with italic characters.
In [28], the user must upload an image that includes a mathematical calculation. The proposed system also supports this feature; on the other hand, it offers a second option that is more useful. In this option, the user can write the operation on a tablet, press the calculate button, and see the results in real time. In addition, the proposed system has the feature of finding, marking, and warning operational errors in an equation written by the user. Equations written in different closed shapes are evaluated locally within themselves; thus, different calculations can be made in many closed blocks on the same page. Also in [29,30], a handwritten-based calculator was developed using a CNN-based model and contour detection. Similarly, ref. [31] can solve handwritten mathematical expressions through a web-based interface by applying various techniques such as grayscale conversion, bit inversion, binary thresholding, and contour-based cropping. On the other hand, these studies can apply only one equation at a time. Different from this study, the proposed study can apply multiple equations simultaneously. Moreover, the proposed system can locally process the variable in different closed shapes. In [32], a method was applied to analyze handwritten physics symbols. First, a Java user interface was developed. Symbols were detected with a contour-based approach and classified with the CNN-KNN hybrid method. Different from this study, the proposed study focuses on mathematical equations, and it uses different technologies and features as mentioned above. Ref. [33] examines the potential of pre-trained Image-Language Models (VLMs) for recognizing children’s handwritten numbers and mathematical expressions. GPT-4V, LLaVA 1.5, and CogVLM were compared on a dataset of 251 images. The results showed that these models performed inadequately without fine-tuning or zero-instance learning. Children’s poor handwriting and erased expressions pose significant challenges for the models. Ref. [34] proposes a method called “PosFormer” that models the spatial relationships of mathematical symbols. PosFormer jointly optimizes the expression recognition and location recognition tasks. First, a “location forest” is defined, which represents the mathematical expression as a forest structure and assigns contextual location IDs to the symbols without requiring any additional annotation. Then, an implicit attention correction module is presented that enables more accurate focusing of the attention mechanism in the sequence-based solver. Experimental results show that PosFormer provides significant performance improvements over existing methods. Ref. [35] proposes a contrastive learning approach that combines handwritten and printed symbols with the same meaning. The method introduces an anchoring scheme to generate printed expression images corresponding to handwritten expressions. It then applies a contrastive learning approach called Semantic-NCE Loss, which matches printed and handwritten symbols with the same meaning. Experiments show that the method improves the recognition accuracy of handwritten expressions. The proposed mathematical assistant software system, which applies different methods from these studies, also presents a real-time working software prototype in addition to experimental studies.
3. Methodology
3.1. Character and Section Detection Algorithm
This algorithm was created to detect the “sections” in the given image. The “section” is a structure that the user wants to be independent of other statements. It is defined by drawing a closed area in the image. Each section contains one or more statements. “Statement” is a mathematical operation written by the user. All sections are considered completely independent and have no effect on another section.
As seen in Algorithm 1, the developed algorithm starts by detecting all contours in the image. Then, each detected contour is checked to see if it is a section. To determine a contour as a section, it is checked whether it contains other contours. If the relevant contour contains at least three contours, this indicates that the contour is a section. All contours in the section are added to an array. Then, this array is included in the section list. Thus, all sections on the page and the character contours within them are detected.
Finally, contours that do not belong to any section are added as a separate section. The last added section group represents the characters that the user does not place in a closed area and writes directly on the page.
After section detection, a section list and a contour list are obtained for each section. By starting a loop on the section list, all contours inside are classified using the self-structured CNN model. The character detection algorithm is given in Algorithm 2. The detailed architectural layer specifications of the proposed CNN model are presented in Table 1. Using this model and algorithm, the most probable characters for the relevant contours are determined.

Table 1.
Detailed Layer Information for the Proposed CNN Structure.
On the other hand, it is possible to convert the detected characters into different characters in the later stages. Moreover, in some cases, multiple characters are combined into a single character. The reason is that, because the proposed algorithm is contour-based, it is insufficient for detecting certain characters. For example, the “=” character can be considered: This character consists of 2 different contours, and both contours are classified as “-” characters. In the later stages of the proposed algorithm, the condition of 2 “-” characters overlapping is checked. Thus, 2 different “-” characters are converted into a single “=” character.
| Algorithm 1 Section Extraction Procedure |
|
| Algorithm 2 Character Detection Procedure |
|
3.2. Statement Detection Algorithm
This algorithm is designed to process one section group at a time. The characters in the section are processed and converted into statement groups. A statement represents a list with more than one character. The algorithm detects the relevant character groups for each written mathematical expression and stores them in separate lists, thereby determining the mathematical expression groups that the user intends to calculate. The statement detection algorithm is defined as the combination of the operator-based detection procedure in Algorithm 3 and the expansion and rotation correction procedure in Algorithm 4.
First, a loop starts on the characters in the section, and each character is checked to see if it represents a statement. In order to represent a character as a statement, it must be one of the predefined characters. These predefined characters are “=”, “Columnar”, and “Long Division” symbols. If the checked character is one of them, this character is added to the statement list. After all the characters are checked, we have the total number of statements in the section and the beginning character of each statement. This procedure is defined in Algorithm 3.
| Algorithm 3 Statement Operator Detection |
|
| Algorithm 4 Statement Expansion and Rotation Correction |
|
3.2.1. Slope Angle Calculation Algorithm
To enable accurate recognition of angled handwriting, the system calculates the slope angles of the predefined characters. For example, when the character “=” is detected, its slope relative to the x-axis in the 2D coordinate system is calculated. In this calculation, characters are processed contour-based.
In the case of the “=” character, the symbol consists of two contours. The leftmost and rightmost points of each contour are determined. Then, for each contour, the change in x and y coordinates between the two points is calculated. The slope angle for each contour is calculated by feeding these changes into the arctan function. Finally, because the character “=” consists of two contours, the average of the two slope angles is taken to calculate the slope angle for the relevant character. These operations are also given in Equations (1)–(4).
Step 1: Contour Detection
If a character consist of N contours, where each contour i has a leftmost and rightmost point denoted as:
Step 2: Coordinate Differences
For each contour, compute the change in x and y coordinates:
Step 3: Contour Slope Angle
The slope angle of each contour relative to the x-axis is calculated as:
Step 4: Character Slope Angle
If the character consists of multiple contours (e.g., the “=” character has two contours), the overall slope angle of the character is obtained by averaging the individual contour slopes:
After the beginning character of each statement is detected, the remaining characters need to be included in these statements. Therefore, a sorting algorithm is applied to the remaining characters. This algorithm detects the closest statement for each character. Then, it calculates its distance to that statement. The distance calculation operations are also given in Equations (5)–(11).
3.2.2. Distance Calculation
Step 1: Contour Bounding Box
A contour C be represented as a set of points.
with minimum and maximum coordinates along each axis defined as:
Step 2: Character Center
If the character has center coordinates:
Step 3: Scaling Factors
The horizontal and vertical scaling factors and are defined, which depend on the type of base character. is a numeric value dynamically selected from predefined values to decrease the x-axis distance between the contour and the character. Similarly, is a numeric value dynamically selected from predefined values to increase the y-axis distance between the contour and the character.
Step 4: Adjusted Character Position
The adjusted character coordinates are computed relative to the contour’s bounding box:
Step 5: Distance to Contour
Finally, the minimum distance d from the character to the contour is:
Then, all characters are sorted from smallest to largest according to this distance. After sorting, the system takes the required number of characters from the start of the remaining list and adds them to the nearest statements. This process continues until “intended characters” are included in a statement.
Then, the rotation angle operation starts. If a statement is rotated by more than 15 degrees, the CNN model cannot recognize it, even if the characters are correct, because it was not trained on such angles. This limitation arises because, when the angle factor is taken into account, there exist characters in the character pool that become indistinguishable. Examples include “1”, “/”, “\” and “-.”
Fortunately, in previous steps, it is calculated which statements need to be rotated in which direction and angle. The proposed algorithm identifies the statements to be rotated. Thus, it rotates only the regions of the image that belong to the related statements. The characters in these regions are re-detected, and the new statements replace with the old statements. However, the original image remains unchanged. These operations are only applied to accurately detect characters in slanted equations. This operation is shown in Algorithm 4.
In this stage, the “intended characters” phrase is important. Because, all detected characters are not always intentionally written for a mathematical operation by the user. For example, the user may have drawn lines on the page without realizing it, left small dots that they could not notice, or they may write a small note for themselves. Since proposed algorithm works contour-based, it classifies such lines and dots as a character and tries to include them in a statement. A filtering system is needed to prevent such situations from affecting the calculations and the correct operation of the system.
This filtering algorithm is used as a criterion to determine whether characters are included in statements. When the condition is met successfully, the candidate character is included in the statement and removed from the remaining character list. However, when the candidate character does not meet the condition successfully, it is directly removed from the remaining character list without being added to the statement.
The filtering algorithm works with 2 parameters. The first parameter is the statement character list to be checked. The second parameter is the candidate character to be added to the statement. The algorithm first starts by detecting the characters that are closest to the candidate character in the statement character list. Then, the contours of the detected character and the candidate character are enlarged by a certain amount. The smallest circle surrounding that contour is calculated separately. Then, it is checked whether the calculated circles have any intersection points on the page. If there is a point where the 2 circles intersect, the candidate character successfully passes this filter. However, if there is no point where the 2 circles intersect, this indicates that the candidate character is a character drawn by mistake or independently of mathematical operations.
Fixed values were used to enlarge the character contours. The closest character contour in the statement was enlarged four times, and the candidate character contour was enlarged three times. These scaling quantities were experimentally selected and produced successful results. The filtering algorithm is executed in Algorithm 4 through the invocation of the IS_THERE_ANY_CHARACTER_AROUND function.
3.3. Applying Predefined Rules
Since a contour-based method is used for character detection, it is not possible to detect all characters at once. To detect all characters correctly, predefined rules are needed. These rules help detect the intended characters by comparing their order, position, shape, and other properties.
After the proposed system detects all statements in the section, it applies a rule function to check the predefined rules and makes the necessary changes. This rule function evaluates each statement independently and applies the rules accordingly. It applies changes to the statement for each detected rule. These changes can sometimes involve character changes and altering the order of the characters in the statement. For example, if a dot appears between two numbers and is positioned at their mid-height, the rule function changes it into a multiplication sign. These conversion operations are necessary both for the correct understanding of mathematical expressions and for the Sympy library [36] to recognize the operations correctly.
In addition, since some special characters do not have a direct symbol equivalent, changes must be made in the relevant statement after such characters are detected. An example is the ‘Horizontal Division’ symbol. This symbol is initially classified as ‘-’. If other characters are detected above and below the rule function, it is accepted as a division sign, and the ‘-’ character is converted to the ‘/’ character. Additionally, the entire division operation is enclosed in parentheses, ensuring the operation’s priority.
3.4. Statement Solving Algorithm
Mathematical operations also include complex definitions such as unknowns, functions, derivatives, integrals, and trigonometric functions. In order to solve such complex structures, a capable system is required—one that can dynamically understand the text and deliver the correct solution. In the proposed system, the Sympy library is utilized to fulfill this requirement.
Since the system has reached the point where it can solve the equations, all the detected statements are converted into text format to enable mathematical processing. The resulting textual expressions are then classified into two distinct categories. The first category is called Defined Equations, and the second category is called Target Equations. These operations are shown in Algorithm 5.
Defined Equations represent the equations that have a value on both sides of the equation. When such equations are detected, two operations must be performed. These operations are information extraction and correctness check, respectively.
Information extraction involves extracting function definitions and variable definitions from the Defined Equations. It also involves saving these values so that the algorithm can use them in the next Defined Equations or Target Equations. Figure 1 includes two Defined Equations. The developed system will first process the equation with the fewest different variables. Since the equation with the fewest different variables is currently at the top, proposed algorithm will start with this equation. Processing this equation will yield the definition of the function . It will then use the determined function to calculate the next Defined Equation and calculate the unknowns A and B. Finding the values of definitions such as , A, and B is called Information Extraction.
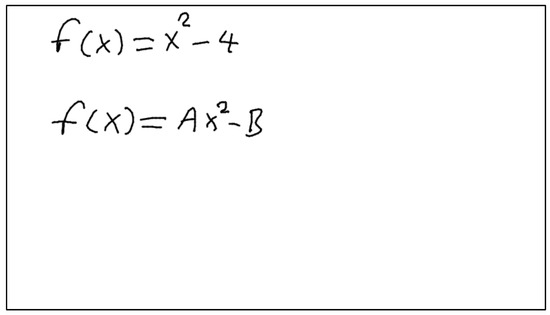
Figure 1.
Sample images to explain information extraction.
These values are then used both to calculate the correctness of the Defined Equation and to solve the Target Equations. In the correctness check part, each of the detected Defined Equation is solved again using the detected function and variable definitions. Also, the correctness check is performed by comparing the two sides of the equations. Due to this correctness check, the user’s errors can be detected, and the system can provide the correct answer as a suggestion.
Target Equations are used to express the equations that the user wants to calculate. When such equations are detected, the next step is to calculate the result of the equation using the detected function and variable definitions. These operations are defined in Algorithm 6.
Also, the user may want to calculate the graph of a mathematical expression. In such cases, the user needs to draw the mathematical expression in a predefined format. When the proposed algorithm detects the predefined format, it creates the graph of the relevant mathematical expression in the specified range, and the graph is saved to be returned as a result.
After the Defined Equation and Target Equations are processed by the algorithm, the system returns a response to the incoming request, and the algorithm ends.
| Algorithm 5 Statement Solving: Statement Parsing and Preparation |
|
| Algorithm 6 Statement Solving: Equation Solving and Output Generation |
|
3.5. Random Question Generation
Because the proposed system is designed to support education, a random question generation algorithm has also been created. This algorithm generates random questions based on predefined topics and predefined patterns for each topic and returns a solvable visual result. The initial question topics are ‘Basic’, ‘One Unknown’, ‘Two Unknown’, ‘Derivative’, ‘Integral’ and ‘Trigonometric’ and can be easily expanded. Furthermore, several question patterns are defined for each topic. When random questions are generated, a selection is made from these patterns, and numerical data and operators are randomly assigned. After the question format is created as text, it is written as plain text on a blank image. Some randomly generated questions are shown in Figure 2.
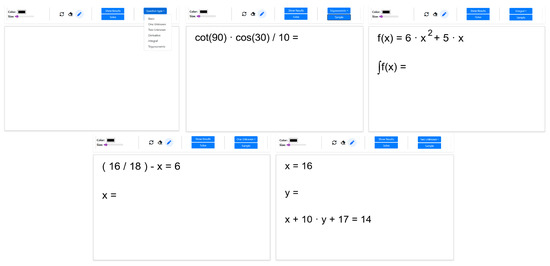
Figure 2.
Sample images produced with the application.
3.6. Data Storage Mechanism
The proposed system uses a CNN model to classify character images. EMNIST, HASYV2, and a self-created character dataset were used to train this CNN model. However, the CNN model needs more character data to create more general and accurate results. Therefore, a mechanism has been created to record the incoming data while the proposed system is running. This approach provides data for both proposed model and models used in other literature studies. With this mechanism, to create a rich character dataset in the long term is aimed.
The mechanism uses the infrastructure provided by the FastAPI framework to run a storage function. The developed API creates a “background task” that runs in the background just before returning a result. This independent process saves the incoming image data to the specified location in 2 different ways. First, the incoming image is saved as a .png file without any modification. Second, all characters in the same image are saved with their separate labels. In this way, both the original image is available when needed and a dataset that can be used directly in model training.
4. Experimental Results
4.1. Dataset and Data Preparation
Three different datasets, namely EMNIST [37], HASYv2 [38], and a self-collected dataset consisting of character images, were used for training the developed CNN model. The EMNIST dataset is derived from NIST Special Database 19 and is released under the CC0 (Public Domain) license, making it suitable for public usage. The HASYv2 dataset is available under the Creative Commons Attribution 4.0 International (CC BY 4.0) license, allowing use as long as proper attribution is provided. Initially, these datasets were applied to a filtering process to select the character images to be used for training. To ensure a balanced representation across classes, a maximum of 1500 samples per character were selected; if fewer samples were available for a character, all available samples were used.
After filtering, the selected images were split into training, validation, and test sets. Specifically, 20% of the samples for each character were randomly assigned to the validation set, while the remaining 80% were used for training. The test sets were constructed from the remaining images in EMNIST and HASYv2 datasets that were not included in the training or validation sets, ensuring that test samples were completely unseen during model development. All splits were shuffled to remove any ordering bias.
EMNIST dataset contains 28 × 28 digit and letter images. First, a filter was applied to these dataset to remove unwanted character images. For example, the number “1” was removed from the dataset because it was determined that the number “1” contained images very similar to the characters “/”, “I” and “l”, thus decreasing the accuracy of the model. Some number “1” character images detected as broken are shown in Figure 3.
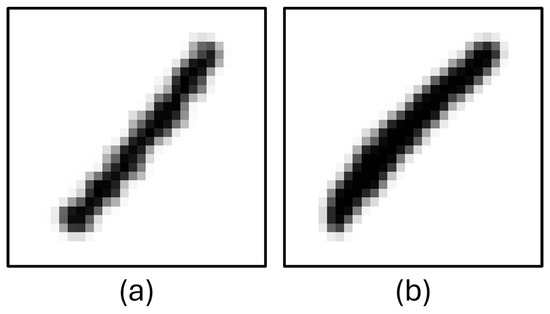
Figure 3.
Column (a) and column (b): ‘1’, character images from EMNIST.
HASYV2 dataset contains images of numbers, letters, and symbols. Although it contains a large number of mathematical symbols, only the necessary ones were used, and the rest were filtered out and excluded from the training. A similar problem encountered in the EMNIST dataset was detected in these dataset; therefore some letters and numbers were filtered out to increase the accuracy of the model. Some unclear characters in HASVY2 are shown in Figure 4.
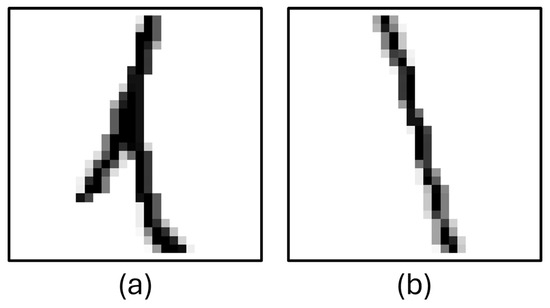
Figure 4.
Column (a): ‘L’, character image from HASYV2, column (b): ‘l’ character image from HASYV2.
The third dataset was created by the authors. It contains approximately 15 thousand character images. These character images were created based on the characters that are found in small numbers or not at all in the EMNIST and HASVY2 datasets. Some samples from these dataset are shown in Figure 5.
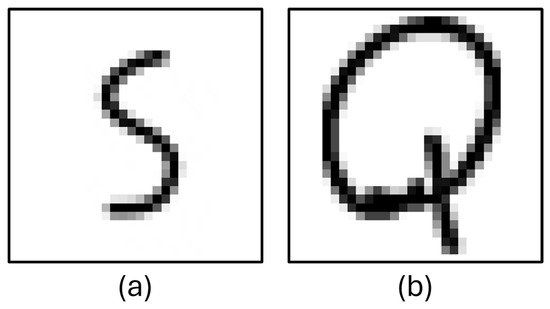
Figure 5.
Column (a): ‘S’, character image created by authors, column (b): ‘Q’ character image created by authors.
After all datasets were filtered, they were brought together for preprocessing and augmentation. First, all images were preprocessed and converted to binary format. Then, augmentation was applied to the images in binary format to increase the size of the dataset. Finally, the dataset was saved as a CSV file for use in training. Some samples are shown in Figure 6.
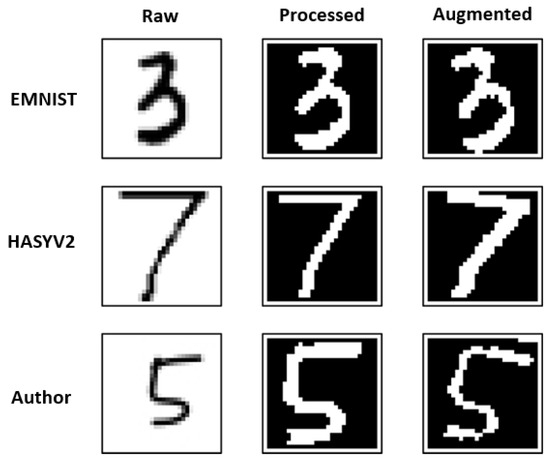
Figure 6.
Shows raw, processed and augmented data from each datasets.
4.2. Image Preprocessing
The preprocessing process starts with applying Gaussian Blur [39] to the raw image. This provides a smoother structure for the image. Then, the image is converted to a binary format using Adaptive Thresholding [40]. This is necessary for a more accurate contour detection. Then, the OpenCV [41] contour detection function is applied to the image in the binary format, and the relevant character contour is detected. The detected contour is transferred to a new image of the relevant character and is used to center it in the image and fix its size. Thus, all character images are converted to a format suitable for training. Some samples before and after preprocessing are shown in Figure 7.
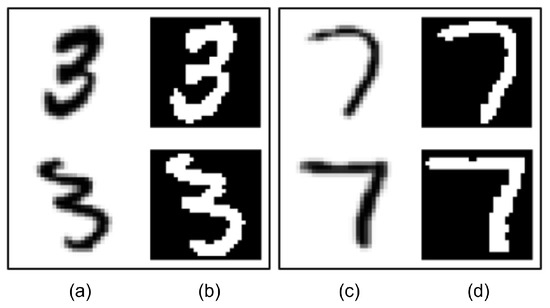
Figure 7.
Column (a) and column (c): original images, column (b) and column (d): images after preprocessing.
4.3. Image Augmentation
New images are created from these preprocessed character images using rotation and morphological operations. In the rotation process, characters are randomly rotated between −15 and +15 degrees. Erosion and dilation methods [42] are used in morphological operations. With these methods, character images are simulated as if they were written thicker or thinner, and the newly created images are saved. Some original images and their derivative forms with augmentation techniques are shown in Figure 8.
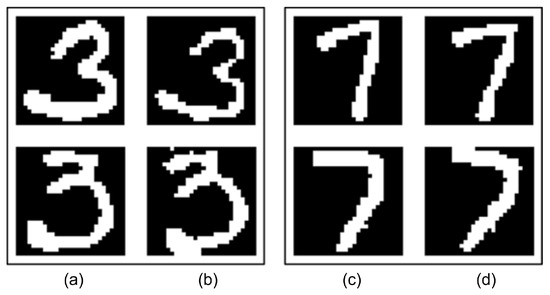
Figure 8.
Column (a) and column (c): preprocessed images, column (b) and column (d): augmented images.
4.4. CNN Model Training Results for Character Classification Task
Since CNN shows outstanding performance in many computer vision tasks [43,44,45,46], it is selected for the character detection task. The developed model uses 32 × 32 images as input and returns a probability for all defined classes as output. The proposed CNN model can classify 49 characters with a 97% accuracy score. These characters consist of numbers, letters, and some mathematical symbols. The hyperparameters employed during training are presented in Table 2, while the corresponding training loss and accuracy curves are illustrated in Figure 9, respectively.
Table 2.
Training Parameters Used in the Proposed Model.
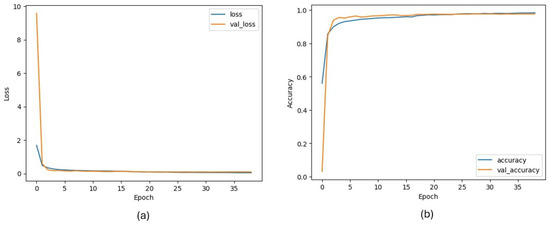
Figure 9.
Column (a): CNN model loss metric during training, column (b): CNN model accuracy metric during training.
In order to better show the model’s performance, some additional experiments have been performed across multiple test conditions. Table 3 summarizes the key metrics obtained from validation, unfiltered and filtered EMNIST/HASYv2 evaluations, as well as the character subsets used in the filtered experiments. Additionally, examples of misclassified samples are provided to offer visual insight into the error patterns and dataset-specific challenges.
Table 3.
Performance Metrics and Additional Evaluation Results.
4.5. Comparative Evaluation with Classical and Deep Learning Models
In order to justify the selection of the proposed CNN architecture, several comparative experiments were performed using traditional machine learning algorithms (KNN and SVM) as well as widely used deep learning models (MobileNetV2, ResNet50, ResNet50V2, VGG16, and VGG19). All models were trained under identical conditions on the same 32 × 32 binary character dataset. For evaluation, two different test configurations were used: the full (not filtered) set contains all 49 character classes, whereas the filtered version excludes a group of visually ambiguous characters—such as ‘1’, ‘I’, ‘S’, ‘n’, ‘L’, ‘F’, ‘f’, ‘D’, ‘2’, ‘Z’ in EMNIST and ‘1’, ‘I’, ‘S’, ‘n’, ‘[’, ‘]’, ‘9’, and the integral symbol in HASYv2—whose high visual similarity makes them particularly difficult to distinguish reliably. This separation enabled a fairer assessment of model robustness, especially in cases involving challenging character pairs that are inherently difficult even for human annotators.
The KNN experiments which is given in Table 4, showed that the best-performing configuration achieved a validation accuracy of 92% when using 30 PCA components with the Minkowski distance metric. However, generalization performance remained limited. On the full (not filtered) test sets, KNN achieved 63% accuracy on EMNIST and 67% on HASYv2, improving only moderately on the filtered sets (up to 90% and 82%, respectively). These results indicate that KNN struggles especially with fine-grained visual distinctions among similar characters.
Table 4.
KNN Model Evaluation Results.
SVM models performed better than KNN and demonstrated improved generalization. As shown in Table 5, the highest validation accuracy was obtained using the RBF kernel with 120 PCA components, reaching 95%. When applied to the filtered evaluation sets, SVM achieved up to 94% accuracy on EMNIST and 90% on HASYv2. However, performance dropped notably for the full character set, where accuracy remained around 65–70%, suggesting a difficulty in simultaneously separating multiple visually similar classes.
Table 5.
SVM Model Evaluation Results.
Deep learning models were tested to determine whether well-known general-purpose architectures could outperform the proposed CNN. The results were reported in Table 6. MobileNetV2 yielded relatively low performance, while ResNet-based models achieved moderate accuracy (up to 88% validation). VGG16 and VGG19 performed better, providing validation accuracies of 94–96% and reaching approximately 91% on filtered external datasets. Despite these improvements, their performance still decreased for the full 49-class evaluation.
Table 6.
Deep Learning Models Evaluation Results.
In contrast, the proposed CNN model achieved the best performance across all metrics and datasets as reported in Table 7. The model reached 97% validation accuracy, 97% accuracy on the filtered EMNIST and HASYv2 sets, and significantly higher accuracy on the full datasets compared to competing approaches (78% on not filtered HASYv2). This demonstrates that the proposed architecture provides a stronger balance between model complexity and feature extraction capability, enabling it to differentiate even difficult character groups more effectively than standard models.
Table 7.
Final Models Evaluation Results.
Overall, these results clearly show that although classical machine learning methods and generic deep architectures offer acceptable performance, the proposed CNN delivers the most consistent and accurate results. This validates its selection as the core component of the character recognition module in the developed system.
4.6. Final Character Classification Results
Although a classification is made using the CNN model on the contour images detected in the Character and Section detection algorithm, this does not show the final states of the detected characters. Because the detection of some characters can only be determined according to the types and positions of other characters around them. For example, “-” sign and “=” can be separated based on some different rules. Since all character images are converted to a 32 × 32 image before being classified, characters such as the horizontal division process and the “=” sign are initially classified as “-”, but after applying the rule function, the desired character can be understood. A sample image given to the proposed CNN model (Figure 10a) and, its results (Figure 10b) are shown in Figure 10.
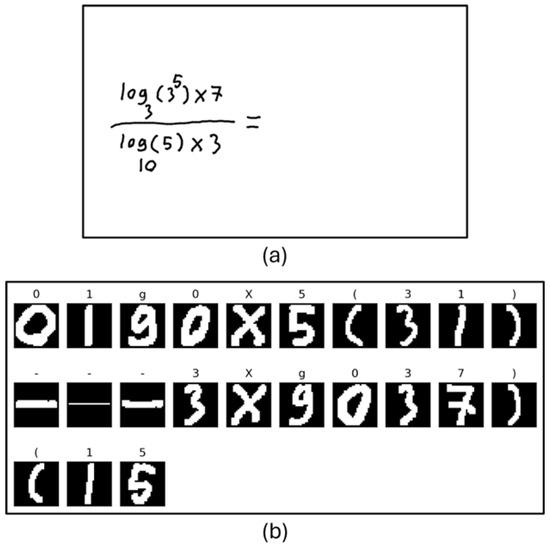
Figure 10.
(a): Input image given to system, (b): classification of CNN model from the extracted contour images.
When the character detection result in Figure 10 is examined, it is seen that the number 1 is detected instead of the letter “l” and the number 0 is detected instead of the letter “o”. This situation is related to the design of the system and the CNN model, but these incorrect detections do not prevent those characters from being detected correctly by the system. After the rule function is applied, it is seen that these characters are correctly converted to the letters “l” and “o”.
4.7. Section Detection Results
The purpose of the section detection algorithm is to separate the mathematical expressions in the image into groups and eliminate the interaction between the groups. This process allows the user to solve more than one independent problem at a time. All the user needs to do is enclose the mathematical expressions they want to solve together in a closed form. In this way, the proposed system understands the user’s intention and performs the calculations accordingly.
When Figure 11 is examined, it can be understood that the user clearly wants to solve 3 different independent problems. By default, if the user does not take any expressions in a closed area, the image itself is considered a section. When the user creates one or more sections, the sections created by the user are detected and removed from the default section. Thus, there are 3 different sections in Figure 11, including the default section. When the left image is processed by the system, a result similar to the right is produced. As can be seen, each problem is solved independently, and the relevant results are shown in the correct coordinates.
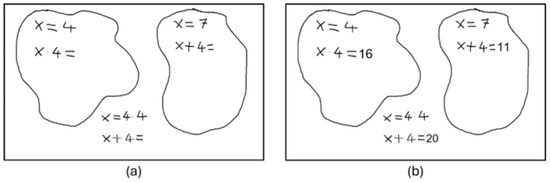
Figure 11.
Column (a): Input image given to system, column (b): Result image processed with the response returned from system.
4.8. Statement Detection Results
A new contour-based algorithm is proposed to perform statement detection after character and section detection. In Figure 12, the working process of this algorithm is visualized. Figure 12 shows how statements written by the user are detected step by step. In this figure, it is shown how statement detection is performed on an image that the developed system is very likely to encounter. The proposed algorithm starts with the input image and reaches the final result by adding new characters to the statements at each step.
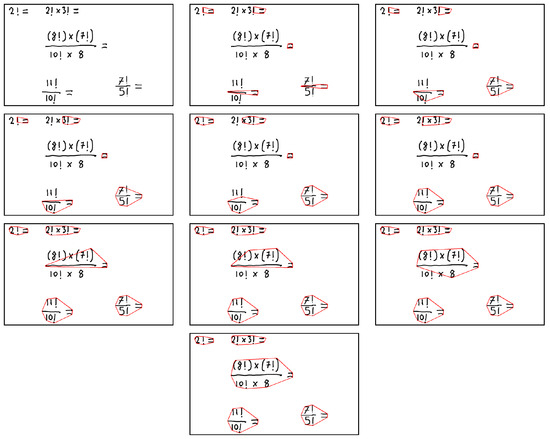
Figure 12.
Statement detection algorithm visual results. Each red circle represents a statement and all characters inside a circle represent the content of that statement.
4.9. System Results and Real-World Examples
The developed system performs two main tasks. First, to produce a result for the expressions that the user wants to calculate. Second, to check the correctness of the expressions defined by the user. Therefore, the proposed system detects all mathematical expressions in the image given as input, checks their correctness, calculates the desired values, and returns the detected errors and calculated results with their coordinates as a result.
Figure 13 is given as input to the system. As seen, there are 5 different mathematical expressions in the image. The user clearly wants these expressions to be calculated. In this case, the proposed system will detect these expressions, calculate the results and the coordinates where they will be displayed, and return the result in an appropriate format.
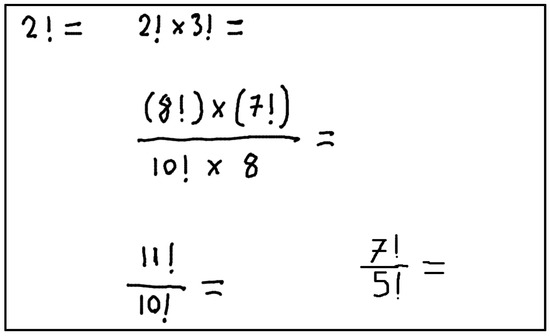
Figure 13.
Input image.
Figure 14 illustrates the system results drawn on the image for Figure 13. As seen, the proposed system has made all the calculations correctly in this sample and displayed the correct results in the correct coordinates.
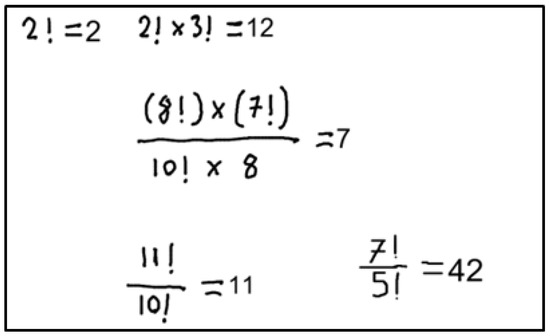
Figure 14.
Output image that shows correct answers for each expression.
Also, as mentioned above, the system has an error detection feature. In Figure 15, two operations are intentionally written incorrectly by the authors to observe how the proposed system will react. The system is expected to detect incorrect expressions.
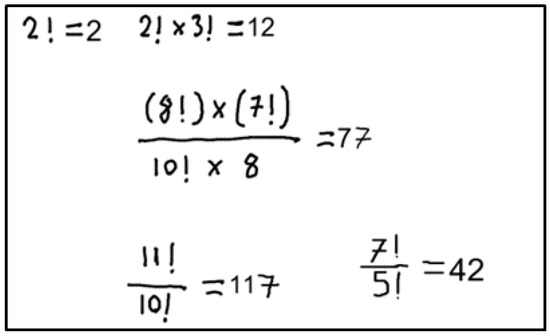
Figure 15.
Input image with wrong answers written by user.
When Figure 15 is given as input to the system, the following results in Figure 16 are obtained. After the system detects the incorrect mathematical expression, it calculates the quadrilateral coordinates that include the region where the incorrect results are written. The correct results of these expressions are also included in the response returned by the system.
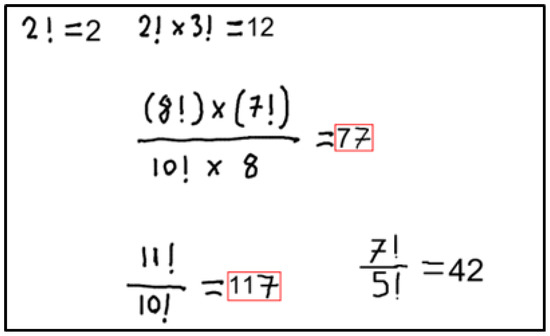
Figure 16.
Output image that shows wrong answers.
The developed system can calculate results, detect errors, and create graphs of mathematical expressions. Two examples of this process are shown in Figure 17.
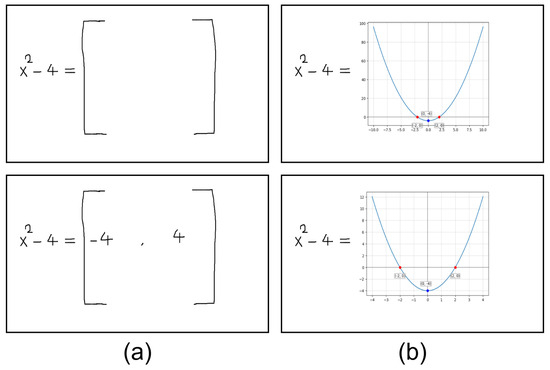
Figure 17.
Column (a): Input image given to the system, column (b): Final image drawn with the results that come from the system as a response.
In Figure 17a, there is only one mathematical expression, and the user wants to draw the graph of this expression. In such a case, the proposed system draws the graph on the x-axis between −10 and +10 using a default value field range. In Figure 17b, the user specifies the x-axis limits of the mathematical expression that is requested to graph. The system will detect the specified limit values and draw the graph accordingly.
To evaluate the system under real-world conditions, tests were conducted with 22 participants, resulting in the collection of 259 test images. Among these images, the system correctly detected and solved all equations in 227 cases, while 32 images contained at least one incorrectly detected equation. Thus, the overall success rate for the 259 test images was calculated as 87.64%.
Analysis of character-level detection performance revealed that 42 out of 4494 characters were misclassified, corresponding to a character recognition accuracy of 99.06%. Furthermore, among the 511 mathematical statements present in the test images, 33 were detected incorrectly, resulting in a statement-level accuracy of 93.54%. These results are summarized in Table 8.
Table 8.
Detection results for different data categories.
An analysis of the frequently misclassified characters revealed that the characters 9, 4, +, and 6 were correctly recognized at an average rate of approximately 95%, whereas the recognition accuracy for the remaining characters was close to 100%.
5. Discussion
5.1. Powerful Points
The developed system’s strengths include its ability to identify complex mathematical expressions, solve equations, verify their validity, and visualize functions. Using a hybrid rule-based and deep learning-based algorithms, a fast and highly accurate system has been developed. Furthermore, designing the system as an API and offering the developed features as a solution for external drawing applications is one of the factors that make the system most useful. Incorporating all these features distinguishes it from previous similar studies. To observe the system’s impact on users, 13 users were asked to use the system or (for younger age groups) watch it being used by another user. User comments are reported in a table in the Appendix A. As shown in the table, the vast majority of users had positive opinions about the system and expressed interest in it. It was concluded that students between the ages of 9 and 25, in particular, found the system easy to understand, informative, and entertaining.
5.2. Weak Points
The system is designed to detect mathematical expressions written on white, clean digital pages, and therefore, it cannot detect mathematical expressions found in complex images. Consequently, it is not directly applicable to mathematical content found in real-world images, such as photographs of handwritten notes or textbook pages captured under non-ideal conditions. When such images are processed, variations in lighting, shadows, background texture, and perspective distortions significantly reduce detection accuracy, often resulting in critical failures in the expression-recognition pipeline.
Owing to a filtering algorithm, non-mathematical characters and shapes can be tolerated to a certain extent, but errors can occur when these characters are close to mathematical expressions. In such cases, the filter may misinterpret parts of these shapes as valid characters, causing additional, unintended symbols to be included in the extracted mathematical statement. These incorrectly detected characters ultimately lead to invalid or inconsistent expressions that cannot be evaluated accurately.
Due to the contour-based approach, the system produces inaccurate results when multiple characters touch. Because the contours of the touching characters are detected as a single contour, and character classification is performed accordingly. To overcome this, methods must be developed to determine whether the detected contours are connected and, if so, to appropriately separate the contours.
Overall, these limitations indicate that while the system performs effectively under controlled, clean digital conditions, additional robustness is necessary for real-world applicability and for handling more complex visual inputs.
5.3. Comparison with Generative AI Approaches
Recent advancements in Generative AI (GenAI) systems, particularly large language models, have significantly expanded the capabilities of automated mathematical reasoning, while such models can handle a broad range of tasks, they typically require extensive computational resources, large-scale infrastructure, and high energy consumption. On the other hand, the system proposed in this study adopts a fundamentally different design philosophy centered on efficiency and decentralization. Its lightweight architecture enables operation with minimal computational cost and facilitates deployment across distributed or resource-constrained environments.
Moreover, each stage of the system is fully customizable, allowing seamless adaptation to pedagogical goals, domain-specific requirements, or analytical contexts—a level of flexibility that large GenAI systems do not inherently provide. These characteristics make our approach not only more sustainable but also more practical for real-time applications on a wide variety of devices. Consequently, while GenAI-based solutions offer powerful general-purpose capabilities, the proposed system provides a complementary direction focused on efficiency, adaptability, and scalability.
5.4. Comparison with Existing Studies and Systems
In order to show the place the proposed system within existing handwritten mathematical expression analysis tools, a comparative evaluation was conducted, as summarized in Table 9. The table includes both commercial and academic solutions and highlights their primary capabilities with respect to section-based local analysis, graph generation, and error detection or warning mechanisms.
In contrast to earlier studies such as Mathpix [47], Im2LaTeX [48], and traditional CNN–LSTM-based mathematical OCR systems, the proposed system goes beyond simple image-to-LaTeX conversion and introduces several novel capabilities that enable full-equation understanding and post-processing verification, while Mathpix focuses on highly accurate OCR and LaTeX generation and Im2LaTeX relies on sequence-to-sequence prediction without semantic validation; the proposed system incorporates section-based equation identification, which enables the model to isolate mathematical expressions from complex, multi-element images. Additionally, the system includes an adaptive rule-based correction module that automatically fixes structural inconsistencies (e.g., missing parentheses, malformed operators, or incomplete fraction structures) that conventional deep-learning models typically output without correction. Most importantly, unlike previous approaches, the proposed system interacts with SymPy, providing dynamic validation and symbolic execution of the recognized expressions. This allows the system to detect logical errors, verify symbolic correctness, and confirm the solvability of extracted equations—capabilities not offered by Mathpix, Im2LaTeX, or earlier CNN–LSTM pipelines. These features make the proposed system not only an OCR tool, but a mathematics-aware assistant capable of both understanding and validating mathematical content.
Current commercial tools such as MyScript Math offers robust formula recognition capabilities but operate on a single expression at a time and lack features such as section-based local evaluation or error-aware mechanisms, while academic approaches in the literature, particularly CNN-based or image-processing-based systems [26,28,30,31,32], contribute valuable insights—such as solving basic trigonometric functions, contour-based cropping strategies, or hybrid CNN-KNN classification; they generally do not support multi-region analysis, interactive feedback, or graphical visualization.
The proposed system provides three key features that have not been concurrently supported by previous work: (1) section-based local analysis, enabling users to write multiple independent mathematical expressions in separate regions on a single page; (2) graph generation, allowing users to visualize handwritten functions immediately; (3) error detection and warnings, improving user understanding and reducing misinterpretation of handwritten input.
This comparison demonstrates that the proposed approach fills a significant gap in the field by integrating expression recognition, validation, visualization, and multi-section analysis into a single lightweight framework. The system, therefore, represents a more comprehensive and flexible solution relative to existing commercial and academic alternatives.
Table 9.
Comparison of the Proposed System with Existing Studies and Tools *.
Table 9.
Comparison of the Proposed System with Existing Studies and Tools *.
| System/Study | Type | Section-Based Local Analysis | Graph | Error Detection | Notes |
|---|---|---|---|---|---|
| MyScript Math [49] | Commercial | X | ✓ | X | Section-based analysis and error warnings unavailable; operates on a single formula; limited support for italic characters. |
| CNN [28] | Academic | X | X | X | Solves basic equations and trigonometric functions; requires image upload; italic characters not recognized. |
| CNN-based approach [26,27] | Academic | X | X | X | Supports only single equations; no section-based evaluation. |
| Image processing approach [31] | Academic | X | X | X | Solves single handwritten equations using grayscale conversion, thresholding, and contour cropping. |
| CNN-KNN hybrid [32] | Academic | X | X | X | Designed for handwritten physics symbol classification; does not analyze mathematical expressions. |
| Proposed | Academic | ✓ | ✓ | ✓ | Users can perform multiple operations in different boxes on the same page; variables remain independent. |
* “✓” denotes feature availability, while “X” denotes absence of the feature.
5.5. Implication in Education
The system’s features are easily integrated with external systems, making it suitable for use in mathematics education, while this system functions as a simple assistant and digital calculator on its own, it is technically feasible for external systems to integrate the developed API to create more educational products. Therefore, it can be used for the development of gamified and educational systems.
The system can be integrated into online mathematics learning platforms and tablet-based classroom environments. It is anticipated that the system can be utilized in online mathematics learning platforms and tablet-based classroom environments. Due to its ability to generate solutions to complex problems, analyze student errors and provide feedback, and create random practice questions, it is well-suited for this type of environment. The user experience table presented in the Appendix A supports this idea. These experiences demonstrate the system’s potential to enrich learning experiences by integrating into existing digital learning ecosystems.
5.6. Future Directions
Mathematics is not just about basic operations and graphing. It is a vast discipline encompassing trigonometry, logic, and many other topics and concepts. Therefore, the fact that the current system is open to improvement and capable of incorporating many topics within this discipline is clear.
One fundamental limitation arises from the contour-based character detection approach. When two or more characters are drawn in close proximity or touch each other, their contours may merge and be incorrectly interpreted as a single character. Future research may focus on developing advanced segmentation or contour-partitioning methods capable of distinguishing overlapping or touching characters, thereby improving recognition robustness in more complex writing conditions.
In addition to these improvements, LLM-based algorithms can be used to make the system a complete assistant. LLM models can provide the most appropriate and informative answer to a question or a user error, enabling users to best overcome obstacles they encounter.
6. Conclusions
This study aimed to develop an interactive mathematical assistant system using artificial intelligence and computer vision to address challenges in mathematical education and research. The system was designed to integrate with drawing applications, providing functionalities such as handwritten character recognition, equation solving, and function visualization. The proposed solution offers an innovative approach to mathematics learning by combining SOTA technology with a user-centric design. The system was also analyzed with test images taken from 22 different people, and it was observed that it showed successful results. These findings show the potential of the proposed system to transform mathematical education and research. Its interactive capabilities make it suitable for a wide range of applications, from individual learning to institutional use.
Author Contributions
Method selection and literature survey, A.A. and G.Y.O.; software development and validation, A.A.; resources, A.A. and G.Y.O.; writing—original draft preparation, A.A.; writing—review and editing, G.Y.O.; visualization, A.A.; supervision, G.Y.O. All authors have read and agreed to the published version of the manuscript.
Funding
This project has been supported by The Scientific and Technological Research Council of Turkey (TÜBİTAK)-2209, Project Number: 1919B012415671.
Data Availability Statement
The data presented in this study are available in HASYv2 repository and the EMNIST repository accessed on 26 October 2025 at https://www.kaggle.com/datasets/guru001/hasyv2 and https://www.kaggle.com/datasets/crawford/emnist, reference number [37,38].
Conflicts of Interest
The authors declare no conflicts of interest.
Appendix A. User Evaluation Summary
This appendix presents a summary of the user evaluations collected during the usability study of the proposed system.
Table A1.
Summary of User Feedback with Bar-Based Satisfaction Scores.
Table A1.
Summary of User Feedback with Bar-Based Satisfaction Scores.
| User | Age | Status | Score | Comment |
|---|---|---|---|---|
| User 1 | 23 | Used | Liked using the system and found it helpful. | |
| User 2 | 21 | Used | Had a good experience; thought the tool worked well. | |
| User 3 | 45 | Used | Was happy with the system and found it useful. | |
| User 4 | 52 | Used | Had some trouble using the system; needs improvements. | |
| User 5 | 55 | Used | Did not fully enjoy the experience; found parts unclear. | |
| User 6 | 14 | Used | Enjoyed the tool and used it comfortably. | |
| User 7 | 48 | Used | Thought the system was okay but not necessary. | |
| User 8 | 50 | Used | Good experience; found the tool easy to understand. | |
| User 9 | 24 | Used | Liked the system; everything worked as expected. | |
| User 10 | 32 | Used | An average experience; some features could be better. | |
| User 11 | 10 | Just Saw | Loved the idea. | |
| User 12 | 12 | Just Saw | Very impressed and thought the idea was great. | |
| User 13 | 9 | Just Saw | Loved the idea. |
References
- Trung, D.N. Developing Abstracting and Generalizing Thinking for Middle School Students in Teaching the Topic of Equations and Non-Equations. Int. J. Soc. Sci. Hum. Res. 2024, 2383–2389, e2025194. [Google Scholar] [CrossRef]
- Zakariyah, S. Foundation Mathematics for Engineers and Scientists with Worked Examples; Routledge: London, UK, 2024. [Google Scholar] [CrossRef]
- Muller, R.H. The Role of Mathematics in Science. Anal. Chem. 1964, 36, 103A. [Google Scholar] [CrossRef]
- Langoban, M. What Makes Mathematics Difficult as a Subject for most Students in Higher Education? Int. J. Engl. Educ. 2020, 9, 214–220. [Google Scholar]
- Menon, V.; Chang, H. Emerging neurodevelopmental perspectives on mathematical learning. Dev. Rev. 2021, 60, 100964. [Google Scholar] [CrossRef]
- Abd Algani, Y.M. Solving Mathematics Anxiety, Lack of Confidence and Negative Attitude with Artificial Intelligence Models: Insights from Stakeholders. J. Math. Educ. Teach. Pract. 2024, 5, 89–100. [Google Scholar] [CrossRef]
- Li, Q.; Cho, H.; Cosso, J.; Maeda, Y. Relations Between Students’ Mathematics Anxiety and Motivation to Learn Mathematics: A Meta-Analysis. Educ. Psychol. Rev. 2021, 33, 1017–1049. [Google Scholar] [CrossRef]
- Gabriel, F.; Buckley, S.; Barthakur, A. The impact of mathematics anxiety on self-regulated learning and mathematical literacy. Aust. J. Educ. 2020, 64, 227–242. [Google Scholar] [CrossRef]
- Wang, B.; Peng, Y.; Cao, Z. How Chinese Undergraduate Students’ Perceptions of Assessment for Learning Influence Their Responsibility for First-Year Mathematics Courses. Mathematics 2024, 12, 274. [Google Scholar] [CrossRef]
- Tan, L.Y.; Hu, S.; Yeo, D.J.; Cheong, K.H. A Comprehensive Review on Automated Grading Systems in STEM Using AI Techniques. Mathematics 2025, 13, 2828. [Google Scholar] [CrossRef]
- Zhang, L. Comparison and Competition of Traditional and Visualized Secondary Mathematics Education Approaches: Random Sampling and Mathematical Models Under Neural Network Approach. Mathematics 2025, 13, 2793. [Google Scholar] [CrossRef]
- Bekiaris, E.; Panou, M.; Kalogirou, K. Ambient intelligence in driving simulation for training young drivers. In Proceedings of the Road Safety on Four Continents: 15th International Conference, Abu Dhabi, United Arab Emirates, 28–30 March 2010; Volume 15, pp. 645–652. [Google Scholar]
- Öztel, İ.; Öz, C. Traffic Education for Inexperienced Drivers with Virtual Driving Simulator. Sak. Univ. J. Comput. Inf. Sci. 2019, 2, 82–88. [Google Scholar] [CrossRef]
- Boboc, R.G.; Butilă, E.V.; Butnariu, S. Leveraging Wearable Sensors in Virtual Reality Driving Simulators: A Review of Techniques and Applications. Sensors 2024, 24, 4417. [Google Scholar] [CrossRef] [PubMed]
- Murtaza, M.; Ahmed, Y.; Shamsi, J.A.; Sherwani, F.; Usman, M. AI-Based Personalized E-Learning Systems: Issues, Challenges, and Solutions. IEEE Access 2022, 10, 81323–81342. [Google Scholar] [CrossRef]
- Masters, K. Artificial intelligence in medical education. Med. Teach. 2019, 41, 976–980. [Google Scholar] [CrossRef] [PubMed]
- Xu, Y.; Jiang, Z.; Ting, D.S.W.; Kow, A.W.C.; Bello, F.; Car, J.; Tham, Y.C.; Wong, T.Y. Medical education and physician training in the era of artificial intelligence. Singap. Med. J. 2024, 65, 159–166. [Google Scholar] [CrossRef] [PubMed]
- Baskaya, Y.H.; Yolcu, B.; Kaymak, Z.D.; Akyaman, S.; Turan, Z.; Çit, G. Effects of beef tongue and virtual reality in episiotomy training on self-efficacy and anxiety in midwifery students: Randomized controlled trial. Clin. Simul. Nurs. 2025, 107, 101817. [Google Scholar] [CrossRef]
- Demir-Kaymak, Z.; Turan, Z.; Çit, G.; Akyaman, S. Midwifery students’ opinions about episiotomy training and using virtual reality: A qualitative study. Nurse Educ. Today 2024, 132, 106013. [Google Scholar] [CrossRef] [PubMed]
- Çit, G.; Ayar, K.; Öz, C. A real-time virtual sculpting application by using an optimized hash-based octree. Turk. J. Electr. Eng. Comput. Sci. 2016, 24, 2274–2289. [Google Scholar] [CrossRef]
- Opesemowo, O.A.G. Artificial Intelligence in Mathematics Education: The Pros and Cons. In Encyclopedia of Information Science and Technology, 6th ed.; IGI Global: Palmdale, PA, USA, 2024; pp. 1–18. [Google Scholar] [CrossRef]
- He, Y.H. AI-driven research in pure mathematics and theoretical physics. Nat. Rev. Phys. 2024, 6, 546–553. [Google Scholar] [CrossRef]
- Kretzschmar, V.; Sailer, A.; Wertenauer, M.; Seitz, J. Enhanced Educational Experiences through Personalized and AI-based Learning. Int. J. Stud. Educ. 2024, 6, 191–209. [Google Scholar] [CrossRef]
- We Are Teachers Staff. 4 Strategies to Help Kids Understand Math Using Visualization. 2016. Available online: https://www.weareteachers.com/4-strategies-to-help-kids-understand-math-using-visualization/ (accessed on 26 April 2016).
- Rif’at, M.; Sudiansyah, S.; Imama, K. Role of visual abilities in mathematics learning: An analysis of conceptual representation. Al-Jabar J. Pendidik. Mat. 2024, 15, 87–97. [Google Scholar] [CrossRef]
- Narayan, A.; Muthalagu, R. Image Character Recognition using Convolutional Neural Networks. In Proceedings of the 2021 Seventh International Conference on Bio Signals, Images, and Instrumentation (ICBSII), Chennai, India, 25–27 March 2021; pp. 1–5. [Google Scholar] [CrossRef]
- Droby, A.; El-Sana, J. ContourCNN: Convolutional neural network for contour data classification. In Proceedings of the 2021 International Conference on Electrical, Computer, Communications and Mechatronics Engineering (ICECCME), Mauritius, 7–8 October 2021; pp. 1–7. [Google Scholar] [CrossRef]
- Patil, A.; Varma, T. Handwritten Mathematical Expression Solver using CNN. Int. J. Res. Appl. Sci. Eng. Technol. 2022, 10, 1205–1211. [Google Scholar] [CrossRef]
- Chebli, A. The Effect of Time Variables as Predictors of Senior Secondary School Students’ Mathematical Performance Department of Mathematics Education Freetown Polytechnic. Int. J. Innov. Sci. Res. Technol. 2024, 9, 606–612. [Google Scholar] [CrossRef]
- Nagaraju, S.P.; Munnangi, V.; Murari, W.; Nandika, S.; Munaganti, V. Handwritten Calculator Using Optical Character Recognition (OCR). Int. J. Sci. Res. Eng. Dev. 2025, 8, 1926–1933. [Google Scholar]
- Nandish, M.; Ananya, B.; Bhumika, H.C.; Dimple, N.; Darshan, H.Y. CNN based Recognition of Handwritten Mathematical Expression. Int. J. Res. Appl. Sci. Eng. Technol. 2025, 13, 2001–2006. [Google Scholar] [CrossRef]
- Kolte, U.; Naik, S.; Kumbhar, V. A CNN-KNN Based Recognition of Online Handwritten Symbols within Physics Expressions Using Contour-Based Bounding Box (CBBS) Segmentation Technique. J. Comput. Sci. 2024, 20, 783–792. [Google Scholar] [CrossRef]
- Pereira Júnior, C.; Rodrigues, L.; Costa, N.; Macario Filho, V.; Mello, R. Can VLM Understand Children’s Handwriting? An Analysis on Handwritten Mathematical Equation Recognition. In Artificial Intelligence in Education. Posters and Late Breaking Results, Workshops and Tutorials, Industry and Innovation Tracks, Practitioners, Doctoral Consortium and Blue Sky, Proceedings of the 25th International Conference, AIED 2024, Recife, Brazil, 8–12 July 2024; Olney, A.M., Chounta, I.A., Liu, Z., Santos, O.C., Bittencourt, I.I., Eds.; Springer: Cham, Switzerland, 2024; pp. 321–328. [Google Scholar]
- Guan, T.; Lin, C.; Shen, W.; Yang, X. PosFormer: Recognizing Complex Handwritten Mathematical Expression with Position Forest Transformer. In Computer Vision—ECCV 2024, Proceedings of the 18th European Conference, Milan, Italy, 29 September–4 October 2024; Leonardis, A., Ricci, E., Roth, S., Russakovsky, O., Sattler, T., Varol, G., Eds.; Springer: Cham, Switzerland, 2025; pp. 130–147. [Google Scholar]
- Lin, Z.; Li, J.; Dai, G.; Chen, T.; Huang, S.; Lin, J. Contrastive representation enhancement and learning for handwritten mathematical expression recognition. Pattern Recognit. Lett. 2024, 186, 14–20. [Google Scholar] [CrossRef]
- Sympy Documentation. Welcome to SymPy’s Documentation. 2025. Available online: https://docs.sympy.org/latest/index.html (accessed on 19 October 2025).
- Cohen, G.; Afshar, S.; Tapson, J.; Van Schaik, A. EMNIST: Extending MNIST to handwritten letters. IEEE Trans. Pattern Anal. Mach. Intell. 2017, 39, 2725–2739. [Google Scholar] [CrossRef]
- Thoma, M. The HASYv2 dataset. In Proceedings of the 25th International Conference on Pattern Recognition (ICPR), Beijing, China, 10–14 December 2017; pp. 1–6. [Google Scholar] [CrossRef]
- Tendilla, S.E.; Dumago, I.R.R.; Atienza, F.A.L.; Cortez, D.M.A. An Enhancement of Optical Character Recognition (OCR) Algorithm Applied in Translating Signages to Filipino. Proc. Int. Conf. Electr. Eng. Inform. 2024, 1, 32. [Google Scholar] [CrossRef]
- Akinbade, D.; Ogunde, A.O.; Odim, M.O.; Oguntunde, B.O. An Adaptive Thresholding Algorithm-Based Optical Character Recognition System for Information Extraction in Complex Images. J. Comput. Sci. 2020, 16, 784–801. [Google Scholar] [CrossRef]
- Bradski, G. The OpenCV Library. Dr. Dobb’s J. Softw. Tools 2000, 25, 120–123. [Google Scholar]
- Soille, P. Erosion and Dilation. In Morphological Image Analysis: Principles and Applications; Springer: Berlin/Heidelberg, Germany, 2004; pp. 63–103. [Google Scholar] [CrossRef]
- Yolcu, G.; Oztel, I.; Kazan, S.; Oz, C.; Bunyak, F. Deep learning-based face analysis system for monitoring customer interest. J. Ambient Intell. Humaniz. Comput. 2019, 11, 237–248. [Google Scholar] [CrossRef]
- Sahin, V.H.; Oztel, I.; Yolcu Oztel, G. Human Monkeypox Classification from Skin Lesion Images with Deep Pre-trained Network using Mobile Application. J. Med. Syst. 2022, 46, 79. [Google Scholar] [CrossRef] [PubMed]
- Oztel, I.; Yolcu Oztel, G.; Sahin, V.H. Deep Learning-Based Skin Diseases Classification using Smartphones. Adv. Intell. Syst. 2023, 5, 2300211. [Google Scholar] [CrossRef]
- Oztel, I. Ensemble Deep Learning Approach for Brain Tumor Classification Using Vision Transformer and Convolutional Neural Network. Adv. Intell. Syst. 2025, 7, 2500393. [Google Scholar] [CrossRef]
- Krizhevsky, A.; Sharang, J.; Team, M. Mathpix: A System for Recognizing Handwritten Mathematical Expressions. arXiv 2016, arXiv:1604.00788. [Google Scholar]
- Deng, Y.; Kanervisto, A.; Ling, J. Image-to-Markup Generation with Coarse-to-Fine Attention. In Proceedings of the 34th International Conference on Machine Learning (ICML), Sydney, Australia, 6–11 August 2017; pp. 980–989. [Google Scholar]
- Using Math Equations and Formulas—help.myscript.com. Available online: https://help.myscript.com/notes/create-content/math/ (accessed on 23 November 2025).


Disclaimer/Publisher’s Note: The statements, opinions and data contained in all publications are solely those of the individual author(s) and contributor(s) and not of MDPI and/or the editor(s). MDPI and/or the editor(s) disclaim responsibility for any injury to people or property resulting from any ideas, methods, instructions or products referred to in the content. |
© 2025 by the authors. Licensee MDPI, Basel, Switzerland. This article is an open access article distributed under the terms and conditions of the Creative Commons Attribution (CC BY) license (https://creativecommons.org/licenses/by/4.0/).