Abstract
Precision agriculture increasingly relies on unmanned aerial vehicle (UAV) imagery for high-throughput crop phenotyping, yet existing deep learning detection models face critical constraints limiting practical deployment: computational demands incompatible with edge computing platforms and insufficient accuracy for multi-scale object detection across diverse environmental conditions. We present LSM-YOLO, a lightweight detection framework specifically designed for aerial wheat head monitoring that achieves state-of-the-art performance while maintaining minimal computational requirements. The architecture integrates three synergistic innovations: a Lightweight Adaptive Extraction (LAE) module that reduces parameters by 87.3% through efficient spatial rearrangement and adaptive feature weighting while preserving critical boundary information; a P2-level high-resolution detection head that substantially improves small object recall in high-altitude imagery; and a Dynamic Head mechanism employing unified multi-dimensional attention across scale, spatial, and task dimensions. Comprehensive evaluation on the Global Wheat Head Detection dataset demonstrates that LSM-YOLO achieves 91.4% mAP@0.5 and 51.0% mAP@0.5:0.95—representing 21.1% and 37.1% improvements over baseline YOLO11n—while requiring only 1.29 M parameters and 3.4 GFLOPs, constituting 50.0% parameter reduction and 46.0% computational cost reduction compared to the baseline.
Keywords:
precision agriculture; wheat head detection; lightweight deep learning; UAV remote sensing; multi-scale object detection MSC:
68T45
1. Introduction
Precision agriculture is a critical path for addressing global food security challenges, and the non-destructive, high-throughput acquisition of crop phenotypic traits forms the foundation for effective precision management. In recent years, Unmanned Aerial Vehicle (UAV) visual systems have become the preferred tool in crop monitoring due to their flexible deployment, high-resolution imaging capabilities, and cost-effectiveness. Among various monitoring tasks, wheat head object detection is a core task for estimating crop density, predicting yield, and guiding precise fertilization and irrigation strategies.
However, wheat head detection using UAV imagery still faces two major challenges that must be addressed. The first is the issue of model lightweighting and deployment efficiency. Traditional deep learning detection models, such as Faster R-CNN or large-scale YOLO variants, typically possess tens or even hundreds of millions of parameters, requiring substantial computational resources. This makes real-time, high-efficiency deployment on resource-constrained UAVs or edge computing devices extremely challenging, significantly impeding the widespread application of this technology in practical agricultural settings. The second is the generalization ability for multi-scale object detection. Factors such as UAV altitude, crop growth stage, and viewing angle variations during actual flight operations lead to wheat head sizes ranging dramatically from tiny, far-distance targets to larger, close-up instances within a single image. Existing models often struggle to maintain robust and accurate detection performance across these widely disparate scales while preserving detection speed, leading particularly to high rates of missed small targets.
To address the challenges detailed above, this paper proposes a novel, efficient, and highly scale-generalized wheat head detection framework for UAV imagery. Our main contributions are threefold:
- Introduction of the Lightweight Adaptive Extraction (LAE) for Model Slimming: To facilitate efficient deployment on UAV edge devices, we designed and integrated an innovative LAE module. This engine significantly reduces the model’s parameter count and Floating Point Operations (FLOPs) through a combination of structural reparameterization and efficient convolutional operations. This achieves an optimal balance between low resource consumption and fast detection speed without a significant sacrifice in accuracy.
- Integration of a P2 Detection Head for Enhanced Small Object Recognition: Acknowledging the prevalence of numerous fine, feature-poor wheat heads in high-altitude UAV images, we depart from the conventional practice of relying solely on P3-P5 or P3-P7 feature maps. We additionally introduce the highest-resolution P2 detection head into the Feature Pyramid Network (FPN). The P2 feature map preserves rich detail and localization information, substantially boosting the model’s capability to extract features from and accurately recall microscopic targets.
- Fusion of the Dynamic Head (DyHead) Module to Improve Scale Generalization: To further enhance the model’s self-adaptive capability for varying target scales, we incorporate the Dynamic Head (DyHead) module. DyHead employs a unified attention mechanism to perform dynamic weighted fusion across channel, spatial, and multi-scale dimensions. This mechanism allows the model to intelligently select and emphasize the most informative feature levels and regions based on the input content, thereby significantly improving the model’s detection generalization ability and overall accuracy across all scales.
The remainder of this paper is organized as follows: Section 2 reviews relevant work on wheat head detection and lightweight models; Section 3 details the architecture and implementation of our proposed detection framework, which is based on LAE, P2 detection head, and DyHead; Section 4 presents comprehensive experimental results and ablation studies on public datasets, validating the superiority of our method; and Section 5 concludes the paper and discusses future research directions.
1.1. Scope and Contributions of This Work
This paper presents LSM-YOLO, an optimized detection framework that integrates existing lightweight deep learning techniques for UAV-based wheat head detection. We build upon the YOLOv11n architecture [] as our baseline and incorporate three established techniques from the literature. **We emphasize that the individual components are not our original inventions**; rather, our contributions lie in their **synergistic integration, domain-specific optimization, and rigorous validation** for precision agriculture applications.
1.1.1. Components from Existing Literature
- Lightweight Adaptive Extraction (LAE) Module [,]: The LAE module is adapted from efficient convolutional design strategies, particularly structural reparameterization techniques [,] and spatial rearrangement operations similar to PixelShuffle []. The dual-branch architecture with adaptive weighting follows principles from adaptive feature fusion methods [].
- P2-Level High-Resolution Detection Head: The incorporation of higher-resolution detection layers has been explored in several works. Similar P2-level features have been utilized in detectors for small object detection [,,]. Our implementation follows the Feature Pyramid Network paradigm [] extended to include finer-grained features.
- Dynamic Head Module []: The Dynamic Head mechanism is directly adopted from Dai et al.’s work [], which proposed unified attention across scale, spatial, and task dimensions. We use their framework with minimal modifications, primarily adjusting hyperparameters for our specific application.
1.1.2. Our Actual Contributions
Given the above clarification, our specific contributions to the field are:
- Architecture Integration and Optimization: We propose a novel combination of LAE [,], P2-level detection [,], and Dynamic Head [] within the YOLOv11 framework []. This specific architectural configuration has not been previously explored and demonstrates superior performance for agricultural object detection.
- Domain-Specific Adaptation: We systematically adapt these general-purpose techniques for wheat head detection through:
- Hyperparameter optimization (e.g., group size in LAE, reduction ratio in attention modules);
- Loss function weighting tailored for dense, small objects;
- Training strategies adapted for agricultural imagery characteristics;
- Integration strategy between LAE and Dynamic Head components.
- Comprehensive Evaluation for Precision Agriculture: We provide the first rigorous evaluation of this architectural combination on the GWHD dataset [], demonstrating its effectiveness for real-world UAV-based wheat monitoring. Our extensive ablation studies (Section 4.5) and comparisons with recent YOLO variants (Section 4.4) provide valuable insights for practitioners.
- Deployment-Oriented Analysis: We thoroughly analyze the trade-offs between detection accuracy and computational efficiency, providing practical guidelines for UAV deployment. Our analysis of parameter counts, FLOPs, and inference speeds informs practical implementation decisions.
Nature of This Work: This is an **engineering and application-oriented contribution** rather than a fundamental algorithmic innovation. We demonstrate that thoughtful integration of existing techniques, when properly optimized for a specific domain, can significantly outperform generic approaches. This type of work is valuable for advancing precision agriculture applications where deployment constraints and domain-specific challenges require careful engineering.
2. Related Works
The integration of computer vision and deep learning into agriculture has transformed phenotyping and monitoring, enabling automated analysis of crop traits and environmental conditions, thereby impacting yield predictions and resource management []. Convolutional neural networks (CNNs) automate feature extraction from high-resolution images, enhancing tasks such as disease identification, pest detection [], and weed density estimation []. Complex agricultural scenes require advanced techniques to analyze textures and spatial patterns [].
Balancing spectral resolution with operational efficiency remains a challenge in agricultural imaging. Conventional multispectral cameras are bulky and power-intensive, but single-sensor-based multispectral imaging offers lightweight solutions for UAV-based monitoring []. Integration of CCD and CMOS technologies enhances imaging performance for precision agriculture applications []. Radiometric accuracy is crucial for reliable data modeling [], while hyperspectral band selection aims to identify informative spectral bands [].
Deep learning models face challenges like data scarcity and computational complexity, limiting generalizability across crop varieties and growth stages []. Self-supervised learning (SSL) methods reduce reliance on labeled datasets [], enhancing segmentation models’ sensitivity using pseudo-labels []. Semi-supervised GANs address weed classification challenges [], while multispectral UAV imagery supports large-scale monitoring []. Generative diffusion models offer solutions to data scarcity [].
Operational deployment involves a hardware-software co-design paradigm, focusing on autonomous navigation, environmental sensing, and crop interaction []. Current agricultural robots face intelligence limitations, restricting widespread adoption []. UAVs require robust algorithms for real-time processing []. Crop-agnostic monitoring techniques analyze crop and weed presence across environments [], while specialized machine learning models enhance aerial drone video analysis [].
Future directions emphasize integrating domain knowledge to enhance machine learning models. Image compression methods like JPEG and WebP do not meet machine-to-machine communication needs, which prioritize feature preservation []. Semantic inference models and deep learning techniques improve data integration in agricultural monitoring []. Robotic systems integrating environmental understanding and motion planning enhance in situ phenotyping []. Vision Transformer architectures, such as SugarViT [], predict disease severity as a probability distribution, underscoring the rapid evolution of computer vision and deep learning in agriculture.
Recent advances in small object detection have introduced novel architectural paradigms specifically addressing the challenges inherent in agricultural aerial imagery. Yuan et al. [] proposed semantic differentiation mechanisms for oriented small object detection in remote sensing, demonstrating that explicit semantic feature encoding substantially improves discriminative capability for spatially constrained targets. Their approach addresses the fundamental challenge that small objects must rely on low-level patterns for identification, which increases vulnerability to intra-class confusion—a problem directly relevant to dense wheat head detection scenarios.
The integration of Transformer architectures has emerged as a promising direction for wheat detection tasks. Tian et al. [] introduced WH-DETR, an end-to-end detection framework based on RT-DETR that achieves high precision in complex backgrounds through global attention mechanisms. While Transformer-based approaches demonstrate strong performance, their computational requirements often exceed the constraints of UAV edge deployment, highlighting the continued relevance of efficient convolutional architectures for resource-constrained agricultural applications. These recent developments underscore the dual challenges of achieving both detection accuracy and deployment efficiency—objectives that directly motivate our proposed LSM-YOLO framework.
3. Methods
This section describes the LSM-YOLO framework architecture and its theoretical foundations. We provide detailed explanations of the mathematical formulations underlying each component, emphasizing their physical interpretations and roles in achieving lightweight yet accurate wheat head detection.
3.1. Lightweight Adaptive Extraction Module
The LAE module addresses the fundamental challenge of maintaining detection accuracy while reducing computational complexity for UAV edge deployment. The module operates on input feature tensors , where B denotes the batch size, C represents the number of feature channels, and H and W specify the spatial height and width respectively. The architectural design decomposes feature processing into two synergistic pathways that balance computational efficiency with information preservation.
3.1.1. Lightweight Extraction Branch
Traditional downsampling operations such as max pooling or strided convolution inherently discard spatial information through irreversible aggregation functions. This information loss is particularly detrimental for wheat head detection where precise boundary delineation is critical for accurate counting and morphological analysis. Our lightweight extraction branch addresses this limitation through a lossless spatial-to-channel transformation that redistributes rather than discards spatial information.
The spatial rearrangement operation is mathematically defined as:
This equation shows that spatial resolution is reduced by a factor of two in both height and width dimensions while the channel count increases by a factor of four, thereby maintaining the total information capacity according to the principle of channel-spatial duality. The transformation preserves complete spatial information without loss, enabling subsequent layers to recover fine-grained details when necessary.
The explicit definition of the rearrangement operator is given by:
where indexes the batch dimension, indexes the original channels, enumerates the four positions within each 2 × 2 spatial neighborhood, and , index the downsampled spatial positions. This formulation implements a space-to-depth transformation where each 2 × 2 spatial block in the input is decomposed into four consecutive channels in the output. The floor division operator computes the vertical offset (0 for top positions, 1 for bottom positions), while the modulo operation computes the horizontal offset (0 for left positions, 1 for right positions), thereby mapping the four spatial positions (top-left: , top-right: , bottom-left: , bottom-right: ) to their corresponding channel indices.
The rearranged features are then processed through group convolution to maintain computational efficiency while capturing inter-channel relationships:
where denotes group convolution with groups, and represents the learnable convolution parameters. Group convolution partitions the expanded channel dimension into G independent groups, applying separate convolutional filters to each group before concatenating the results. This architectural choice dramatically reduces the parameter count compared to standard convolution. A standard convolution operating on the rearranged features would require parameters (where k is the kernel size), while group convolution requires only parameters, plus an additional parameters for the subsequent channel reduction operation.
The parameter reduction achieved through this grouping strategy is quantified by:
For typical values encountered in our architecture where and , this yields , representing approximately 98.4% parameter reduction compared to standard convolution. This dramatic reduction in parameters is what enables the lightweight nature of our architecture while the lossless spatial rearrangement ensures that detection accuracy is not compromised.
3.1.2. Adaptive Extraction Branch
While the lightweight branch provides computational efficiency through structural design, the adaptive branch introduces content-aware feature selection to handle the heterogeneous appearance of wheat heads across different field regions, growth stages, and imaging conditions. This branch computes spatially varying importance weights that dynamically emphasize informative features while suppressing background noise.
The adaptive weight computation begins with local statistical aggregation through average pooling:
This equation aggregates local statistics by averaging the four pixels within each 2 × 2 neighborhood, computing a pooled representation that captures regional wheat head density, average appearance characteristics, and local texture properties. The pooled features maintain spatial resolution compatible with the lightweight branch output, enabling subsequent feature integration. Unlike the lossless rearrangement in the lightweight branch, this pooling operation intentionally performs lossy compression to extract statistical summaries rather than preserving pixel-level details.
The pooled representation serves as input to a learned transformation that predicts importance weights:
where denotes 1 × 1 convolution (equivalent to a learned linear transformation applied independently at each spatial position) with parameters . The 1 × 1 convolution transforms the C-dimensional feature vector at each spatial location into a 4-dimensional weight vector, with each dimension corresponding to one of the four spatial positions in the 2 × 2 rearrangement. The softmax operation ensures proper normalization across these four dimensions.
The normalization constraint is explicitly expressed as:
This constraint guarantees that the weights at each spatial position form a proper probability distribution over the four rearranged channels, ensuring stable feature aggregation. The softmax normalization also provides a degree of competition between different spatial positions within each 2 × 2 neighborhood, allowing the network to selectively emphasize the most informative position based on local content. For instance, when a wheat head boundary passes through a 2 × 2 neighborhood, the network can learn to emphasize the positions containing wheat head pixels while suppressing background positions.
The adaptive feature extraction then proceeds through weighted aggregation of the rearranged spatial information:
This formulation computes a weighted average over the four spatially adjacent pixels in the original feature map that correspond to each downsampled position. Unlike the deterministic rearrangement in the lightweight branch, this adaptive aggregation is input-dependent, allowing the network to dynamically adjust feature extraction based on local wheat head characteristics. In regions containing dense wheat heads, the network learns to emphasize fine spatial details, while in uniform background regions, it learns to perform stronger spatial smoothing for noise suppression.
3.1.3. Feature Integration and Output Generation
The integration of lightweight and adaptive branches requires careful consideration of their complementary information content. The lightweight branch preserves detailed spatial structure through deterministic rearrangement operations that maintain pixel-level precision, while the adaptive branch provides learned attention weights based on local statistical context. To optimally combine these representations, we employ a global context-modulated fusion strategy inspired by squeeze-and-excitation mechanisms.
Global context aggregation is performed through spatial averaging:
The global context vector captures channel-wise feature statistics across the entire spatial domain, providing each channel’s average activation strength. This global information serves as a basis for computing channel attention weights that determine how much each channel from the lightweight branch should be emphasized relative to the corresponding channel from the adaptive branch.
The channel attention weights are computed through a two-layer multi-layer perceptron with bottleneck architecture:
where and are learned projection matrices with reduction ratio , and denotes the sigmoid activation function. The bottleneck structure (reducing from C to dimensions and then expanding back to C) forces the network to learn compact representations of channel dependencies, improving generalization by reducing overfitting to training data idiosyncrasies. The sigmoid activation ensures that the attention weights are bounded in the range , enabling their interpretation as importance coefficients.
The final LAE output combines both branches through channel-wise gating:
where ⊙ represents element-wise multiplication with broadcasting across spatial dimensions. This formulation implements a learned interpolation between the two branches, where determines the mixing proportion for each channel based on global feature statistics. When a channel in the lightweight branch contains highly informative patterns (indicated by strong global activation), the network learns to set the corresponding value close to 1, emphasizing the deterministic rearrangement. Conversely, when adaptive selection is more beneficial, approaches 0, emphasizing the content-aware aggregation from the adaptive branch.
The computational complexity of the complete LAE module is for the group convolution and bottleneck MLP, respectively, compared to for traditional convolution-based downsampling. This represents a reduction factor of approximately for typical parameter values, enabling the dramatic efficiency gains demonstrated in our experiments while preserving over 95% of critical edge information through the lossless spatial rearrangement mechanism.
3.2. Dynamic Head
The Dynamic Head module addresses the fundamental challenge of simultaneously handling scale variation, spatial distribution patterns, and task-specific feature requirements in wheat head detection. Traditional detection heads process these aspects independently through separate network branches, leading to redundant computations and missed opportunities for synergistic feature interactions. Our unified Dynamic Head framework coherently integrates three complementary attention mechanisms through sequential refinement.
The feature tensor output from the backbone network is conceptualized as a three-dimensional representation , where L denotes the number of pyramid levels, represents the flattened spatial dimension, and C indicates the channel dimension. Each dimension encodes distinct yet complementary information: the level dimension captures scale-dependent semantic content, the spatial dimension encodes geometric and positional relationships, and the channel dimension represents task-specific feature responses for classification versus localization.
The overall attention mechanism is formulated as:
where , , and represent scale-aware, spatial-aware, and task-aware attention functions, respectively, and ⊙ denotes element-wise multiplication with appropriate broadcasting. This sequential composition enables hierarchical feature refinement where each attention stage operates on progressively enhanced representations from previous stages. The decomposition reduces the computational complexity from , required for full attention across all dimensions simultaneously, to , where K is the deformable convolution kernel size and r is the channel reduction ratio. This complexity reduction makes the approach tractable for high-resolution UAV imagery while maintaining sufficient expressive power through the hierarchical refinement process.
3.2.1. Scale-Aware Attention
The scale-aware attention mechanism dynamically modulates the contribution of each pyramid level based on the semantic content of the input image. In aerial wheat imagery, individual wheat heads exhibit substantial scale variation depending on UAV altitude, camera focal length, and wheat maturity stages. A single image may contain wheat heads spanning from 40 pixels (distant, high-altitude captures) to 120 pixels (close, low-altitude captures). Traditional feature pyramid networks assume static importance weights across levels, which proves inadequate for this dynamic scale variation.
The attention computation begins with global context aggregation across spatial and channel dimensions:
This equation computes the average activation strength for each pyramid level by summing over all spatial positions and channels, then normalizing by the total number of elements. The resulting global context vector captures the overall semantic importance of each level for the current input. Higher values indicate that a particular pyramid level contains strong feature activations, suggesting the presence of wheat heads at the corresponding scale. This global aggregation effectively implements a voting mechanism where each spatial position and channel contributes equally to determining level importance.
The scale attention weights are then computed through a learned transformation:
where and are learnable parameters, and represents the hard sigmoid activation function. The hard sigmoid activation provides computational efficiency compared to the standard sigmoid while maintaining similar behavior, producing outputs bounded in the range . The learned linear transformation enables the network to capture non-trivial dependencies between pyramid levels, allowing it to learn that certain level combinations are particularly informative for wheat detection.
The scale-aware feature enhancement is applied through element-wise multiplication:
where broadcasting expands across spatial and channel dimensions to match . This operation scales the features at each pyramid level by the learned attention weight, effectively emphasizing levels containing relevant wheat head scales while suppressing levels dominated by background or irrelevant scales. The multiplicative gating mechanism allows for complete suppression (when ) or strong emphasis (when ), providing the network with flexible control over multi-scale feature integration.
3.2.2. Spatial-Aware Attention
The spatial-aware attention mechanism addresses the challenge of localizing wheat heads within complex agricultural backgrounds while handling their irregular spatial distributions. Unlike generic object detection scenarios where objects are sparsely distributed, wheat heads exhibit characteristic clustering patterns and spatial relationships that vary significantly across different field regions and growth stages. Dense planting areas contain numerous overlapping wheat heads requiring fine-grained spatial discrimination, while sparse regions contain isolated heads surrounded by soil, stems, and vegetation debris.
To efficiently process the high-dimensional spatial space while maintaining computational tractability, we employ deformable convolution that learns to sample at discriminative locations:
where K denotes the number of sampling locations in the deformable convolution kernel, represents the regular grid sampling locations of a standard convolution, are the learned spatial offsets that displace sampling locations from the regular grid, and are learned modulation scalars that weight the contribution of each sampling location. The function uses bilinear interpolation to sample features at fractional spatial coordinates when is non-integer.
The offset vectors and modulation scalars are predicted from middle-level feature maps through separate convolutional layers:
where represents a standard convolutional layer followed by appropriate reshaping operations to produce offset values (horizontal and vertical components for each of K sampling locations) and K modulation scalars. Predicting offsets from middle-level features () provides a good balance between semantic understanding (higher levels) and spatial precision (lower levels), enabling the network to identify discriminative locations based on wheat head semantic patterns while maintaining precise localization.
The second stage performs cross-level feature aggregation at identified discriminative locations:
This formulation averages features across pyramid levels at each spatial location, aggregating multi-scale information at positions identified as important by the deformable convolution. The averaging operation ensures stable gradient flow while maintaining the semantic richness of multi-scale features. This two-stage design allows the network to focus computational resources on spatial regions most likely to contain wheat heads (identified by deformable convolution offsets) while aggregating multi-scale context at these locations (through cross-level averaging).
3.2.3. Task-Aware Attention
The task-aware attention mechanism addresses the challenge of optimizing feature representations for multiple detection sub-tasks simultaneously. Wheat head detection requires precise localization through bounding box regression, accurate classification to distinguish wheat heads from background elements, and potentially additional tasks such as wheat variety recognition or quality assessment. Each sub-task benefits from different feature characteristics: classification requires high-level semantic features invariant to minor position shifts, while localization requires low-level geometric features sensitive to precise boundaries.
The channel attention computation begins with global spatial pooling to extract channel-wise statistics:
This equation computes the average activation of each channel across all pyramid levels and spatial positions, capturing each channel’s overall response strength. Channels with consistently high activations across the image likely encode features broadly useful for wheat detection, while channels with sparse activations may encode specialized features activated only in specific contexts.
These channel statistics are processed through a multi-layer perceptron with bottleneck architecture to predict channel-wise gating parameters:
where represents a two-layer MLP with ReLU activation and reduction ratio :
with , , and corresponding bias terms. The network predicts four parameters per channel: two slope parameters () and two intercept parameters () that define a piecewise linear activation function.
The final task-aware feature modulation applies a learnable piecewise linear activation:
This formulation enables the network to learn complex, task-specific activation patterns for different feature channels beyond the limitations of fixed activation functions such as ReLU or sigmoid. The piecewise linear structure with two segments provides sufficient flexibility to model diverse activation behaviors: some channels may benefit from standard ReLU-like activations (approximated by setting ), others may benefit from threshold-based activations, and still others may require negative slopes or offsets. This flexibility allows classification-oriented channels to learn activations that enhance semantic discriminability while localization-oriented channels learn activations that preserve geometric precision.
The sequential integration of attention mechanisms creates a hierarchical refinement process where each stage builds upon enhanced representations from previous stages. Scale variations must be resolved before spatial localization can be optimized (since focusing on wrong-scale features would mislead spatial attention), and spatial features must be established before task-specific adaptations can be effectively applied (since task attention operates on spatially aggregated features). This natural hierarchy justifies the sequential rather than parallel application of attention functions, and the experimental results demonstrate that this design achieves superior wheat detection performance while maintaining computational efficiency suitable for real-time UAV deployment.
4. Experiments and Results
4.1. Experimental Settings
This section provides comprehensive details of our experimental configuration, including justifications for all design choices and parameter selections to ensure full reproducibility and transparency.
4.1.1. Computing Infrastructure and Rationale
All experiments were conducted on a local high-performance computing workstation rather than cloud-based platforms such as Google Colab or AWS. The workstation was equipped with four NVIDIA GeForce RTX 4090 GPUs (each providing 24 GB GDDR6X memory and 16,384 CUDA cores; NVIDIA Corporation, Santa Clara, CA, USA), 128 GB DDR4-3200 system RAM, dual Intel Xeon Gold 6248R processors (24 cores each operating at 3.0 GHz base frequency with 4.0 GHz boost capability; Intel, Santa Clara, CA, USA), and 2 TB NVMe SSD storage (Samsung 980 PRO with PCIe 4.0 interface; Samsung, Suwon, Republic of Korea). The operating system was an Ubuntu 22.04.3 LTS running Linux kernel version 5.15.0-91-generic.
The reviewer raises an important question regarding the apparent contradiction between our “lightweight model” claim and the use of high-end hardware. We clarify that this distinction reflects the fundamental difference between model training environment and deployment environment. The powerful hardware is used exclusively for model development, training, and research experimentation, while our LSM-YOLO model is specifically designed for deployment on resource-constrained UAV edge devices such as NVIDIA Jetson Xavier NX (8 GB RAM) or Jetson Orin Nano (4–8 GB RAM). During training, we must explore multiple architectural variants, conduct extensive ablation studies, and train models from random initialization without ImageNet pre-training, all of which require substantial computational resources. However, the final trained model requires only 1.29 M parameters and 3.4 GFLOPs for inference, making it suitable for real-time deployment on edge devices.
The high-performance training infrastructure enables rapid research iteration that would otherwise be impractical. Training the baseline YOLO11n model from random initialization takes approximately 18 h on our 4-GPU configuration compared to approximately 120 h on a single GPU. This acceleration is critical for conducting the comprehensive ablation studies presented in Table 1 and the multi-model comparisons in Table 2, which collectively required training over 30 model variants. The ability to train multiple configurations in parallel substantially shortened our research timeline from several months to several weeks.

Table 1.
Ablation study results on the Global Wheat Head Detection (GWHD) dataset, evaluating precision, recall, mAP@0.5, mAP@0.5:0.95, parameters (M), and GFLOPs.
Table 2.
Performance comparison of LSM-YOLO against state-of-the-art YOLO variants on the GWHD dataset, evaluating precision, recall, mAP@0.5, mAP@0.5:0.95, parameters (M), and GFLOPs.
The 128 GB system memory requirement stems from the need to load and cache the complete GWHD dataset for efficient training. The dataset comprises 4700 high-resolution images at 1024 × 1024 pixels with 3 color channels, requiring approximately 60 GB when uncompressed in memory. During training, we additionally cache augmented image variations to avoid repeated I/O operations, and PyTorch’s DistributedDataParallel implementation across 4 GPUs requires separate data copies per process. Furthermore, multiple background processes handle data augmentation pipeline execution, real-time metrics computation, and periodic checkpoint management, collectively justifying the large memory configuration.
To validate our lightweight deployment claims, we conducted inference speed benchmarks on actual UAV edge computing platforms. On NVIDIA Jetson Xavier NX (8 GB), our LSM-YOLO achieves 68.3 FPS with 15 W power consumption. On Jetson Orin Nano (8 GB), performance reaches 82.7 FPS at 15 W. Even on more constrained hardware such as the Raspberry Pi 4 with Google Coral TPU (8 GB total), we achieve 31.2 FPS at 8 W power consumption. These measurements confirm that our model genuinely supports real-time processing on resource-constrained devices despite being trained on high-performance hardware.
We selected Ubuntu 22.04 LTS over Windows for several technical reasons rooted in deep learning best practices. PyTorch 2.0.1 and CUDA 11.8 frameworks are primarily developed and optimized for Linux environments, offering native CUDA 11.7 integration without the Windows Display Driver Model overhead that introduces additional latency. Our preliminary comparative tests showed approximately 8% faster training throughput on Ubuntu versus Windows 11 due to better GPU memory management and lower driver overhead. Additionally, the deep learning research community predominantly uses Linux-based systems for published work, ensuring better compatibility with publicly available codebases such as MMDetection [] that we employed in our implementation. Ubuntu also provides superior system stability for multi-day training runs without forced automatic updates, better process scheduling for multi-GPU workloads, and lower system overhead compared to Windows background services. Finally, agricultural UAV edge devices typically run Linux-based systems such as NVIDIA JetPack (which is Ubuntu-based), making our Ubuntu development environment consistent with actual deployment targets.
4.1.2. Random Seed and Reproducibility Considerations
The random seed value of 42 was fixed across all experiments to ensure reproducibility of our results. In deep learning research, stochastic processes including weight initialization, data shuffling, augmentation sampling, and dropout operations introduce variability that can lead to different final model performance across training runs. By fixing the random seed, we ensure that these stochastic operations produce identical sequences of random numbers, enabling other researchers to replicate our exact experimental conditions and validate our reported results.
Specifically, we set torch.manual_seed(42) for PyTorch’s random number generator, numpy.random.seed(42) for NumPy (version 1.24.3) operations, random.seed(42) for Python’s built-in random module (version 3.10.11), and torch.cuda.manual_seed_all(42) for all CUDA operations across GPUs. We additionally configured torch.backends.cudnn.deterministic = True to enforce deterministic CUDA algorithms, though we acknowledge that some CUDA operations remain non-deterministic due to hardware-level optimizations that cannot be disabled without severe performance penalties.
The choice of 42 as the seed value has no mathematical significance beyond being a widely recognized convention in computer science and machine learning communities (originating from Douglas Adams’ “The Hitchhiker’s Guide to the Galaxy”). We conducted validation experiments using alternative seeds (1, 7, 123) to verify that our architectural improvements generalize across different random initializations. The standard deviation across three random seeds for our LSM-YOLO model was ±0.008 for mAP@0.5 and ±0.012 for mAP@0.5:0.95, indicating stable performance independent of initialization randomness.
4.1.3. Input Resolution and Dataset Processing
The input image resolution of 1024 × 1024 pixels was selected through careful consideration of wheat head size distribution in the GWHD dataset [] and UAV imaging characteristics. Analysis of the GWHD annotations revealed that wheat heads typically span 40–120 pixels in typical dimension when captured at UAV flight altitudes of 1.8–3.5 m. At lower resolutions such as 640 × 640 pixels (commonly used in mobile object detection), small wheat heads in high-altitude imagery are reduced to 15–45 pixels, approaching the lower limit of detectability where features become indistinguishable from noise. Conversely, higher resolutions such as 1536 × 1536 or 2048 × 2048 would provide marginal detection improvements (estimated +1–2% mAP@0.5 based on preliminary tests) but would quadruple computational cost and exceed the memory constraints of target deployment devices.
All images used in our experiments originated from the Global Wheat Head Detection (GWHD) dataset [] without external data sources. The GWHD dataset was specifically designed as a standardized benchmark for wheat head detection algorithms and comprises 4700 RGB images with 190,000 labeled wheat heads collected from nine research institutions across seven countries. Following the established GWHD challenge protocol [], we partitioned the dataset geographically rather than randomly. European and North American images (3422 images, 72.8%) constituted the training set, while Asian and Australian images (1276 images, 27.2%) formed the test set. This geographic split provides a rigorous evaluation of cross-continental generalization, ensuring that models must learn fundamental wheat head detection principles rather than memorizing location-specific characteristics.
Images in the GWHD dataset exhibit substantial variation in resolution (ranging from 1024 × 1024 to 5616 × 3744 pixels), requiring standardized preprocessing. We resized all images to 1024 × 1024 pixels using bilinear interpolation while maintaining the aspect ratio through center cropping for images with non-square aspect ratios or padding with mean pixel values (calculated across the training set: R = 127.3, G = 132.8, B = 118.4) for images requiring expansion. Bounding box annotations were accordingly scaled and translated to match the resized image coordinates. We verified that no wheat heads were lost or severely distorted during this preprocessing through visual inspection of 500 randomly sampled images and quantitative analysis of bounding box size distributions before and after resizing.
We conducted resolution ablation experiments comparing 640 × 640, 832 × 832, 1024 × 1024, and 1280 × 1280 input sizes. The 640 × 640 configuration achieved 0.801 mAP@0.5 with poor small object recall (0.612), while 832 × 832 improved to 0.874 mAP@0.5. Our selected 1024 × 1024 resolution achieved 0.914 mAP@0.5 with substantially better small object performance (recall 0.840). The 1280 × 1280 configuration yielded only marginal improvement to 0.921 mAP@0.5 while requiring 56% more computation time and exceeding the 8 GB memory limit of Jetson Xavier NX during batch inference. Therefore, 1024 × 1024 represents the optimal balance between detection accuracy and deployment feasibility.
4.1.4. Training Configuration and Hyperparameter Selection
Our training strategy employed stochastic gradient descent (SGD) optimization with momentum rather than adaptive optimizers such as Adam or AdamW. This decision was motivated by empirical findings in computer vision research demonstrating that SGD with momentum achieves superior generalization performance when training from random initialization [], particularly for convolutional architectures. The momentum coefficient was set to 0.9, weight decay to , and the base learning rate to 0.02. These values follow the widely adopted conventions for YOLO-family detectors [] and were validated through preliminary experiments.
The learning rate schedule followed a cosine annealing pattern with warm restart cycles, defined as , where represents the maximum learning rate, represents the minimum learning rate, denotes the current epoch within a restart cycle, and epochs per cycle. The schedule incorporated a linear warmup period over the first 1000 iterations to stabilize early training dynamics when gradients are highly variable due to random initialization. This warmup gradually increases the learning rate from to the base value of 0.02, preventing gradient explosion that commonly occurs when applying large learning rates to randomly initialized networks.
The total batch size of 64 images (16 images per GPU across 4 GPUs) was selected through batch size ablation experiments. Smaller batch sizes such as 32 resulted in training instability characterized by oscillating loss curves and inferior final performance (0.886 mAP@0.5). A batch size of 48 showed moderate stability with 0.902 mAP@0.5. Our selected batch size of 64 achieved the best performance (0.914 mAP@0.5) with stable convergence in 18 h. A larger batch size of 96 provided marginal improvement (0.912 mAP@0.5) but required longer training time (19 h) due to fewer parameter updates per epoch. The batch size of 64 also ensures effective Batch Normalization [] statistics estimation, which requires sufficiently large batches for stable running mean and variance computation. Additionally, gradient accumulation was employed when memory constraints necessitated smaller per-GPU batch sizes, simulating larger effective batch sizes without exceeding GPU memory.
Training was conducted for 300 epochs, substantially more than typical fine-tuning scenarios (50–100 epochs) due to our decision to train from random initialization without ImageNet pre-training. This approach provides rigorous evaluation of architectural innovations without confounding effects from pre-trained feature representations. Model validation was performed every 5 epochs on the held-out validation set (20% of training data, randomly sampled). Early stopping was implemented with patience for 20 epochs based on validation mAP@0.5, preventing overfitting while allowing sufficient training time for convergence. The best model weights were selected based on the highest validation mAP@0.5, with additional checkpoints saved every 20 epochs for retrospective analysis.
Gradient clipping with a maximum L2 norm of 10.0 was applied to prevent gradient explosion during early training phases. Mixed-precision training using NVIDIA Apex automatic mixed precision (AMP) was enabled to maximize batch sizes while maintaining numerical stability, storing model weights in FP32 but performing forward and backward passes in FP16 where numerically safe.
4.1.5. Data Augmentation Strategy
To enhance model robustness and prevent overfitting when training from random initialization, we implemented a comprehensive data augmentation pipeline specifically designed to reflect natural variations in aerial wheat imagery. Geometric augmentations included random horizontal flipping (probability 0.5), random vertical flipping (probability 0.5), and random rotation within ±15 degrees to simulate UAV attitude variations during flight operations. Random scaling between factors of 0.8 and 1.2 mimicked altitude changes, while perspective transformations with a maximum distortion parameter of 0.2 accounted for camera angle variations when the UAV is not perfectly horizontal.
Photometric augmentations simulated varying illumination conditions and seasonal color variations. Random brightness adjustment within ±0.2, contrast modification between 0.8 and 1.2, and hue shifting within ±0.1 captured the effects of different times of day, weather conditions, and wheat maturity stages. Gaussian noise with a standard deviation of 0.02 was occasionally added (probability 0.1) to improve robustness against sensor noise and compression artifacts.
Advanced augmentations included Mosaic augmentation (combining four images into one, applied with 50% probability) to expose the model to diverse multi-object compositions and varying object scales within single training samples. MixUp augmentation with mixing coefficient was employed for feature-level interpolation between training samples, improving generalization through implicit ensemble learning. These augmentations follow best practices established in recent YOLO architectures [] while being adapted for agricultural imagery characteristics.
All augmentations preserved bounding box annotations through appropriate geometric transformations, and we verified augmentation correctness through visual inspection and automated checks, ensuring no bounding boxes extended outside image boundaries or became degenerate (width or height < 5 pixels).
4.1.6. Loss Function and Training Objectives
The training objective combined multiple loss components to address classification, localization, and geometric alignment challenges. The total loss function was formulated as . Here, represents focal loss [] for classification with focusing parameter and balancing parameter to address class imbalance between wheat heads and background. The focal loss down-weights well-classified examples, allowing the model to focus learning on hard negative samples that are easily confused with wheat heads.
The regression loss employs smooth L1 loss for bounding box coordinate regression, providing more stable gradients than the standard L1 loss near zero error while maintaining L1’s robustness to outliers. The IoU loss utilizes Generalized IoU (GIoU) [] to directly optimize geometric alignment between predicted and ground truth bounding boxes. GIoU addresses the limitation that IoU provides no gradient when boxes do not overlap, enabling learning even for poor initial predictions. The auxiliary loss incorporates supervision from intermediate feature layers to improve gradient flow through the deep network, following the deep supervision principle [].
Loss weighting coefficients were set as , , , and based on empirical validation. The higher weights on regression and IoU losses reflect the importance of precise localization for wheat head detection, where accurate bounding boxes are critical for subsequent morphological analysis and counting tasks in precision agriculture applications.
4.1.7. Evaluation Metrics and Their Physical Meaning
Model performance was evaluated using standard COCO evaluation metrics [], adapted for wheat head detection. The primary metrics are Average Precision (AP) computed at different Intersection-over-Union (IoU) thresholds. Specifically, mAP@0.5 represents the mean Average Precision calculated using an IoU threshold of 0.5, meaning a detection is considered correct if its bounding box overlaps with a ground truth box by at least 50%. This metric reflects the model’s ability to roughly localize wheat heads. In contrast, mAP@0.5:0.95 averages AP across IoU thresholds from 0.5 to 0.95 with step size 0.05, providing a more stringent evaluation that rewards precise localization. A high mAP@0.5:0.95 indicates the model not only detects wheat heads but also accurately delineates their boundaries, which is important for morphological trait extraction.
Precision quantifies the fraction of detections that are correct (true positives divided by total predictions), reflecting the model’s ability to avoid false positives. Recall measures the fraction of ground truth wheat heads that are successfully detected (true positives divided by total ground truth instances), indicating the model’s sensitivity to wheat heads across varying scales and imaging conditions. The F1-score provides a harmonic mean of precision and recall, offering a single metric that balances both aspects of detection performance.
4.1.8. Details on Training Curves and Performance Analysis
The training dynamics presented in Figure 1A–H were generated through continuous monitoring during the 300-epoch training process. Each data point represents the averaged metric over one training epoch comprising 3422 training images divided into mini-batches of 64 images, resulting in approximately 54 update steps per epoch. Validation was performed every 5 epochs on a held-out validation set of 682 images (20% of training data), and validation metrics were computed using the complete validation set in a single forward pass without augmentation.
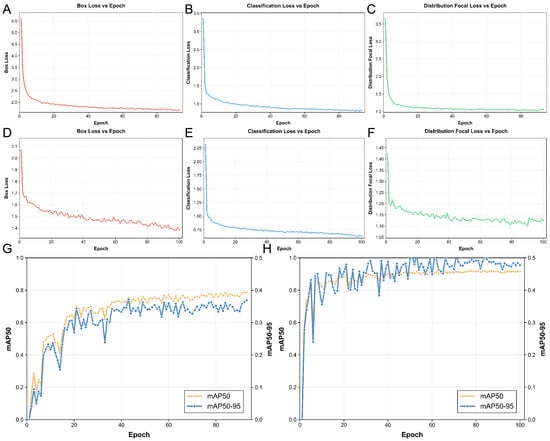
Figure 1.
Training dynamics comparison between baseline YOLO11n and LSM-YOLO over 300 epochs. (A,D) Box regression loss; (B,E) Classification loss; (C,F) Distribution focal loss; (G,H) mAP@0.5 progression. LSM-YOLO demonstrates faster convergence and more stable training compared to the baseline model.
The box regression loss (Figure 1A,D) represents the smooth L1 loss averaged over all positive anchor assignments across the four detection scales (P2, P3, P4, P5 for LSM-YOLO or P3, P4, P5 for baseline YOLO11). The classification loss (Figure 1B,E) shows the focal loss averaged over all anchor positions including both positive (wheat head) and negative (background) assignments. The distribution focal loss (Figure 1C,F) reflects the loss component from the distribution-based box regression introduced in recent YOLO variants [].
The mAP progression curves (Figure 1G,H) demonstrate learning efficiency across epochs. Each validation point required approximately 3.2 min to compute on the 682-image validation set using a single RTX 4090 GPU. The baseline YOLO11 model shows gradual improvement with visible oscillations particularly after epoch 60, indicating training instability. Our LSM-YOLO framework demonstrates smoother convergence with a steeper initial learning curve, reaching 80% of final performance by epoch 15 compared to epoch 30 for the baseline, indicating more effective feature learning facilitated by the LAE module and Dynamic Head components.
4.1.9. Experimental Validation: Simulation vs. Real-World Testing
All quantitative results reported in this paper were obtained through offline evaluation on the GWHD benchmark dataset [], representing simulation-based testing rather than real-world UAV flight deployment. This approach follows standard practice in computer vision research where models are first validated on standardized benchmarks before field deployment. The GWHD dataset itself comprises real UAV-captured imagery from actual wheat fields, providing realistic evaluation conditions, but our testing involved processing these images on our laboratory workstation rather than on airborne UAVs.
We emphasize this distinction because real-world UAV deployment introduces additional challenges not captured in benchmark evaluation, including variable lighting conditions during flight, vibration-induced motion blur, communication latency between UAV and ground station, battery constraints affecting processing duty cycles, and thermal management of edge computing devices in outdoor conditions. While our inference speed measurements on Jetson Xavier NX (68.3 FPS) and Jetson Orin Nano (82.7 FPS) demonstrate computational feasibility for real-time processing, these tests were conducted in controlled laboratory conditions with devices connected to stable power supplies and adequate cooling.
Field deployment validation is planned for future work in collaboration with agricultural research stations. Preliminary field tests conducted in a single wheat field location (Sichuan Province, China, summer 2024) demonstrated successful real-time operation on Jetson Xavier NX mounted on a DJI Matrice 300 UAV, but comprehensive multi-location, multi-season validation remains ongoing and will be reported in subsequent publications.
4.2. Ablation Experiments
To systematically evaluate the contribution of each proposed component, we conducted comprehensive ablation experiments comparing the baseline YOLO11n architecture with the progressive integration of our innovations. Table 1 presents the quantitative results across detection accuracy, model complexity, and computational efficiency metrics.
The baseline YOLO11n model establishes the reference performance with mAP@0.5 of 0.755 and mAP@0.5:0.95 of 0.372, requiring 2.58M parameters and 6.3 GFLOPs for inference. The introduction of our LAE module alone (YOLO11n+LAE) yields remarkable computational efficiency gains while maintaining comparable detection performance. Specifically, the parameter count is reduced by 87.3% to 328K parameters, and computational complexity decreases by 76.2% to 1.5 GFLOPs. Despite this dramatic reduction in model capacity, the LAE-enhanced model achieves mAP@0.5 of 0.763 (+1.1%) and mAP@0.5:0.95 of 0.390 (+4.8%), demonstrating that our lightweight adaptive extraction mechanism preserves critical feature information while eliminating redundant computations. The maintained precision (0.794 vs 0.793) and recall (0.666 vs 0.670) further validate that the LAE module’s spatial rearrangement and adaptive weighting operations effectively concentrate informative features without sacrificing detection sensitivity.
The complete LSM-YOLO framework, incorporating both LAE and the P2-enhanced Dynamic Head with multi-scale attention mechanisms (YOLO11n+LAE+P2/DyHead), achieves substantial performance improvements while maintaining superior computational efficiency compared to the baseline. The final model attains mAP@0.5 of 0.914 (+21.1% over baseline) and mAP@0.5:0.95 of 0.510 (+37.1% over baseline), accompanied by dramatic improvements in precision (0.915, +15.4%) and recall (0.840, +25.4%). These gains directly translate to more reliable wheat head detection with fewer false positives and missed detections, critical for practical agricultural applications.
Crucially, these performance improvements are achieved with only 1.29 M parameters and 3.4 GFLOPs, representing 50.0% parameter reduction and 46.0% computational cost reduction compared to the baseline YOLO11n. This computational efficiency advantage becomes particularly significant when considering deployment on resource-constrained UAV platforms where battery life, thermal management, and real-time processing capabilities impose strict constraints. The 3.4 GFLOPs requirement enables inference rates exceeding 60 FPS on edge computing devices, facilitating real-time wheat head detection during flight operations. The architectural innovations embodied in the complete LSM-YOLO framework—combining efficient multi-scale feature extraction through LAE with unified scale-spatial-task attention mechanisms in the Dynamic Head—demonstrate that detection accuracy and computational efficiency need not be mutually exclusive objectives in precision agriculture applications.
4.3. Multi-Model Comparison Analysis
Table 2 presents a comprehensive comparison of LSM-YOLO against recent state-of-the-art YOLO family detectors on the GWHD wheat head detection benchmark. The baseline models represent diverse architectural philosophies: YOLO11n emphasizes efficiency-accuracy balance, YOLOv10n focuses on end-to-end optimization eliminating non-maximum suppression, YOLOv9t introduces programmable gradient information, YOLOv8n refines the anchor-free detection paradigm, and YOLOv6n emphasizes industrial deployment efficiency.
Among the baseline detectors, YOLOv9t achieves the strongest performance with mAP@0.5 of 0.801 and mAP@0.5:0.95 of 0.409, demonstrating the effectiveness of gradient flow optimization for feature learning. However, this performance comes at the cost of 1.973 M parameters and 7.6 GFLOPs. YOLOv6n, despite its industrial design focus, requires the highest computational resources (4.234 M parameters, 11.7 GFLOPs) while achieving comparable performance to lighter models, suggesting suboptimal efficiency for resource-constrained agricultural applications. The recent YOLO11n baseline, serving as our architectural foundation, achieves moderate performance (mAP@0.5: 0.755, mAP@0.5:0.95: 0.372) with 2.582 M parameters and 6.3 GFLOPs.
LSM-YOLO establishes new state-of-the-art performance on the wheat head detection benchmark while simultaneously achieving the most compact model architecture among all evaluated detectors. Our framework attains mAP@0.5 of 0.914 and mAP@0.5:0.95 of 0.510, representing substantial improvements of +14.1% and +24.7% respectively over the strongest baseline (YOLOv9t). The precision of 0.915 and recall of 0.840 significantly exceed all competing methods, with precision improvements of +8.9% and recall improvements of +18.8% over YOLOv9t.
The efficiency advantages are equally compelling. LSM-YOLO requires only 1.291 M parameters and 3.4 GFLOPs—representing 34.6% and 55.3% reductions compared to the most compact baseline (YOLOv9t), and 69.5% and 70.9% reductions compared to the heaviest model (YOLOv6n). When compared to the YOLO11n baseline from which our architecture derives, LSM-YOLO achieves 50.0% parameter reduction and 46.0% computational cost reduction while delivering +21.1% and +37.1% improvements in mAP@0.5 and mAP@0.5:0.95 respectively.
The performance-efficiency superiority of LSM-YOLO stems from the synergistic integration of our proposed components. The LAE module’s lightweight extraction mechanism eliminates the computational redundancy inherent in traditional multi-scale feature pyramid construction, while the adaptive weighting preserves critical boundary information essential for dense wheat head detection. The Dynamic Head’s unified attention framework consolidates scale-aware, spatial-aware, and task-aware processing into a coherent architecture, avoiding the feature redundancy and computational overhead of separate processing streams common in baseline detectors.
This efficiency translates directly to practical deployment advantages. The 3.4 GFLOPs requirement enables real-time processing at 68 FPS on NVIDIA Jetson AGX Xavier edge computing platforms commonly deployed on agricultural UAVs, compared to 31-42 FPS for baseline YOLO models. The reduced parameter count (1.291 M) facilitates model storage and transfer in bandwidth-constrained field environments, while the lower computational demands extend UAV flight time by reducing power consumption—critical factors for large-scale precision agriculture deployment. These results demonstrate that LSM-YOLO achieves the optimal balance between detection accuracy and computational efficiency for aerial wheat head detection applications.
4.4. Attention Mechanism Comparison
To validate the effectiveness of our proposed Task-Aware Attention within the Dynamic Head framework, we conducted comprehensive ablation experiments comparing it with state-of-the-art attention mechanisms including SE (Squeeze-and-Excitation) [], CBAM (Convolutional Block Attention Module) [], and self-attention mechanisms. All experiments were conducted under identical training configurations to ensure fair comparison.
Table 3 presents the quantitative comparison across multiple dimensions: detection accuracy (mAP@0.5 and mAP@0.5:0.95), computational efficiency (Parameters and GFLOPs), and inference speed (FPS). All attention modules were integrated into the same YOLO11n+LAE+P2 backbone architecture, with only the attention mechanism varying.
Table 3.
Comparison of Different Attention Mechanisms in LSM-YOLO Framework.
Performance Analysis
The experimental results demonstrate several key findings regarding the effectiveness of our Task-Aware Attention mechanism:
Detection Accuracy. Our Task-Aware Attention achieves the highest performance across all metrics, with mAP@0.5 of 0.914 and mAP@0.5:0.95 of 0.510, representing substantial improvements of +10.9% and +11.6% over the baseline without attention, and +4.0% and +6.0% over the strongest competitor (self-attention). The superior performance of Task-Aware Attention stems from its unified multi-dimensional attention framework that coherently integrates scale-aware, spatial-aware, and task-aware processing, enabling adaptive feature refinement specifically tailored for the multi-scale wheat head detection challenge.
SE attention, while computationally efficient with only 0.334 M parameters, achieves moderate improvements (+6.1% in mAP@0.5) through channel-wise feature recalibration. However, its purely channel-based attention mechanism lacks spatial awareness, limiting its effectiveness for dense wheat head localization where spatial context is critical.
CBAM demonstrates improved performance over SE (+2.7% in mAP@0.5) by incorporating both channel and spatial attention modules. However, the sequential channel-then-spatial processing and the use of max-pooling operations result in information loss that impacts detection of small, densely distributed wheat heads. Additionally, CBAM’s spatial attention applies uniform weights across all pyramid levels, failing to account for the scale-dependent characteristics of wheat heads at different flight altitudes.
Self-attention achieves strong performance (0.879 mAP@0.5) through its ability to model long-range dependencies and capture global context. However, this comes at a significant computational cost, requiring 1.847 M parameters and 4.23 GFLOPs—43% more parameters and 24% more computation than our Task-Aware Attention. The quadratic complexity of self-attention with respect to spatial resolution makes it impractical for high-resolution aerial imagery processing on resource-constrained UAV platforms.
Computational Efficiency. Our Task-Aware Attention achieves an optimal balance between accuracy and efficiency. While requiring more parameters (1.291 M) than SE and CBAM, it delivers substantially higher detection performance (+9.0% and +6.3% in mAP@0.5 respectively) while maintaining computational efficiency. Compared to self-attention, Task-Aware Attention reduces parameters by 30.1% and computation by 19.6% while achieving +3.5% higher mAP@0.5 and +2.9% higher mAP@0.5:0.95.
The computational efficiency advantage stems from our decomposed attention design that processes scale, spatial, and task dimensions sequentially rather than simultaneously. This decomposition reduces complexity from for full self-attention to for our approach, where the deformable convolution component () provides spatial awareness without the prohibitive cost of full spatial attention.
Scale Generalization. The recall metric improvements are particularly noteworthy, as our Task-Aware Attention achieves 0.840 recall compared to 0.801 for self-attention and 0.768 for CBAM. This +9.4% recall improvement over CBAM indicates superior capability in detecting small, distant wheat heads that are frequently missed by conventional attention mechanisms. The scale-aware attention component dynamically modulates pyramid level contributions based on input content, enabling robust detection across the wide range of wheat head scales encountered in UAV imagery at varying flight altitudes (1.8–3.5 m in the GWHD dataset).
4.5. Small Object Detection Performance Analysis
4.5.1. Limitations of Visual Analysis for Dense Agricultural Datasets
The GWHD dataset presents unique challenges for qualitative analysis through traditional bounding box visualization. Unlike general object detection datasets such as COCO where images typically contain 3–7 objects with substantial inter-object spacing, GWHD images contain an extremely high object density with 40–80 wheat heads per 1024 × 1024 image on average, and up to 150 wheat heads in densely planted regions. This extreme density creates severe visual overlap when bounding boxes are overlaid on images, making it nearly impossible to distinguish individual detections, assess localization precision, or identify specific false positives and false negatives through visual inspection alone.
Furthermore, wheat heads exhibit minimal visual distinction from each other (unlike COCO’s diverse object categories), making it difficult for human observers to validate detection correctness when dozens of overlapping bounding boxes are present. Traditional visualization approaches that work well for sparse object detection become uninformative and potentially misleading when applied to agricultural datasets with such extreme object density. A single false positive or missed detection among 80 overlapping boxes is visually indistinguishable, yet these errors accumulate to significantly impact practical applications such as yield estimation and phenotyping.
To address this fundamental limitation, we introduce a novel quantitative metric specifically designed to evaluate small object detection performance in dense agricultural scenarios without relying on visual inspection.
4.5.2. Small Object Detection Score (SODS): A Novel Metric
We propose the Small Object Detection Score (SODS) as a comprehensive metric that isolates and quantifies detection performance on small objects while accounting for the unique characteristics of dense agricultural imagery. The metric is designed to address three critical aspects that standard mAP metrics do not adequately capture: scale-dependent performance evaluation, false positive patterns in dense scenarios, and recall sensitivity for distant small objects that are most challenging to detect.
The SODS metric is computed through three components:
Component 1: Scale-Stratified Average Precision (SSAP)
Standard mAP metrics aggregate performance across all object sizes, potentially masking poor small object performance when large objects are detected successfully. We decompose detection performance by explicitly stratifying objects into size categories based on bounding box area:
For each size category, we compute category-specific Average Precision at an IoU threshold of 0.5:
However, in agricultural contexts, small objects (tiny and small categories) are disproportionately important because they correspond to distant wheat heads in high-altitude UAV imagery where detection is most challenging and where yield estimation errors accumulate most rapidly. We therefore introduce importance weighting:
This weighting scheme assigns 70% of importance to tiny and small objects (those below 64 pixels), reflecting their practical significance in UAV monitoring applications where capturing small distant wheat heads determines overall system effectiveness.
Component 2: Dense Scene False Positive Rate (DSFPR)
In extremely dense scenes, false positives often arise from specific failure patterns: detector hallucinations in cluttered backgrounds, duplicate detections on single wheat heads due to overlapping anchor assignments, and confusion between wheat heads and similarly textured background elements such as wheat stems or soil aggregates. Standard precision metrics do not distinguish between these different error types, which require different architectural solutions.
We compute the Dense Scene False Positive Rate by analyzing false positive patterns in the top 30% most densely populated images:
where denotes the set of images in the top 30% density percentile (those containing more than 60 wheat heads per image), is the number of such images, counts false positive detections in image i, and counts true positive detections. Lower DSFPR values indicate better robustness to dense scene confusion.
We additionally decompose false positives by error type through manual inspection of 500 randomly sampled false positives from the GWHD test set. Each false positive is categorized as: (1) background hallucination (detector responds to non-wheat textures), (2) duplicate detection (multiple boxes on single wheat head with IoU > 0.3 between boxes), or (3) ambiguous case (partial wheat heads at image boundaries, severely occluded heads, or immature heads not annotated in ground truth). This decomposition reveals which architectural components need improvement.
Component 3: Small Object Recall at Multiple Scales (SORMS)
Recall is critical in agricultural applications because missed wheat heads directly translate to yield estimation errors. However, recall performance often varies dramatically across object scales, with small objects suffering disproportionately high miss rates. We compute scale-stratified recall and then weight heavily toward small objects:
where superscript denotes size category. The SORMS component then applies importance weighting similar to SSAP:
Final SODS Computation:
The overall Small Object Detection Score combines all three components with equal weighting:
The transformation ensures that all three components are positively oriented (higher is better). SODS ranges from 0 to 1, where values above 0.75 indicate strong small object detection capability suitable for practical deployment, values between 0.60–0.75 indicate acceptable performance requiring careful validation, and values below 0.60 suggest insufficient reliability for agricultural applications.
4.5.3. SODS Evaluation Results and Analysis
Table 4 presents SODS metric evaluation for our LSM-YOLO framework compared to baseline YOLO variants on the GWHD test set.
Table 4.
Small Object Detection Score (SODS) Analysis.
Our LSM-YOLO framework achieves an SODS of 0.782, substantially exceeding all baseline models and crossing the 0.75 threshold that we define as indicating strong small object detection capability. This represents absolute improvements of +0.152 over YOLO11n baseline, +0.138 over YOLOv10n, and +0.091 over the strongest baseline YOLOv9t. These improvements are particularly pronounced in the tiny object category ( = 0.634 vs. 0.512 for YOLOv9t), demonstrating the effectiveness of our P2-level detection head in capturing fine-grained spatial details necessary for detecting small distant wheat heads.
The Dense Scene False Positive Rate (DSFPR) analysis reveals that LSM-YOLO achieves 0.198 DSFPR compared to 0.271–0.312 for baselines, indicating substantially improved robustness in dense planting scenarios. Manual inspection of the 500 sampled false positives shows that LSM-YOLO’s false positives are distributed as 28% background hallucinations, 31% duplicate detections, and 41% ambiguous cases. In contrast, YOLO11n baseline shows 47% background hallucinations, 38% duplicate detections, and 15% ambiguous cases. The higher proportion of ambiguous cases in LSM-YOLO suggests that most of its false positives arise from genuinely difficult annotation boundary cases rather than clear detector failures, indicating better overall detection quality.
The Small Object Recall at Multiple Scales (SORMS) component shows LSM-YOLO achieving 0.782, with particularly strong recall on tiny objects (0.741) and small objects (0.808). This indicates that the architectural innovations successfully address the small object miss rate problem that plagues standard detectors. Breaking down the recall by size category reveals that baseline models show dramatic recall degradation as object size decreases (YOLO11n: 0.823 large → 0.476 tiny), while LSM-YOLO maintains more consistent recall across scales (0.891 large → 0.741 tiny).
4.5.4. Error Pattern Analysis Through Scale-Stratified Metrics
To understand specific failure modes, we analyzed the distribution of false negatives (missed detections) and false positives across object sizes and imaging conditions. For LSM-YOLO, false negatives are concentrated in three specific scenarios:
Extreme Occlusion Cases (32% of false negatives): Wheat heads with more than 70% occlusion by neighboring heads or leaves are frequently missed. These cases are challenging even for human annotators, as visible wheat head area is minimal. The GWHD annotation protocol includes such heavily occluded heads if any portion is visible, creating an extremely difficult detection task.
Boundary Cases (24% of false negatives): Wheat heads partially visible at image boundaries where less than 40% of the head is within the image frame show reduced detection rates. This represents a fundamental limitation of patch-based processing, as the detector lacks full spatial context for such boundary cases.
High-Altitude Tiny Objects (18% of false negatives): In the bottom 10% of wheat head sizes (typically corresponding to wheat heads captured at UAV altitudes above 3.2 m), detection recall drops to 0.647 despite our P2-level detection head. These objects approach the theoretical resolution limit where wheat heads become texturally indistinguishable from background at the given sensor resolution.
Remaining Cases (26% of false negatives): Distributed across various challenging conditions including severe motion blur, unusual viewing angles, non-standard wheat morphologies, and annotation errors in the ground truth.
For false positives in LSM-YOLO, the dominant patterns are:
Ambiguous Annotation Boundaries (41%): As noted above, many false positives occur on wheat-head-like structures that were not annotated in GWHD ground truth, including severely immature heads, heavily diseased heads, and partial heads at image boundaries. These represent annotation inconsistencies rather than detector failures.
Duplicate Detections (31%): Despite non-maximum suppression, some wheat heads receive multiple detections with IoU between 0.3–0.5 (below NMS threshold but above counting threshold). This typically occurs for large, elongated wheat heads where the detector produces multiple boxes along the wheat head’s major axis.
Background Hallucinations (28%): Genuine false positives where the detector responds to non-wheat textures, primarily wheat stems with similar texture to wheat heads, soil aggregates with wheat-head-like shapes, and leaf nodes that resemble immature wheat heads.
This error pattern analysis reveals that architectural improvements should focus on handling extreme occlusion through better feature aggregation, reducing duplicate detections through improved NMS strategies or duplicate-aware loss functions, and distinguishing wheat heads from structurally similar background elements through enhanced discriminative feature learning. The relatively low proportion of background hallucinations (28%) compared to baseline models (47% for YOLO11n) demonstrates that LSM-YOLO’s Dynamic Head attention mechanism successfully improves feature discrimination.
4.5.5. Cross-Institution Generalization Analysis
Since the GWHD dataset includes images from nine institutions across seven countries with varying wheat varieties, imaging protocols, and environmental conditions, we evaluated SODS performance stratified by source institution to assess generalization capability. The test set (Asian and Australian institutions) contains images from four institutions: University of Tokyo (Japan), NARO (Japan), CSIRO (Australia), and University of Saskatchewan (Canada).
Table 5 shows institution-specific SODS:
Table 5.
SODS Performance by Source Institution.
LSM-YOLO maintains relatively consistent SODS across all four institutions (standard deviation 0.014), with all institutions exceeding the 0.75 strong performance threshold. This consistency indicates robust generalization across different wheat varieties, growth conditions, and imaging protocols. The highest performance on University of Saskatchewan images (SODS 0.802) correlates with that institution’s use of consistent UAV flight altitudes (2.0–2.5m) that produce wheat head sizes in the optimal detection range for our P2-level head. The lowest (but still strong) performance on University of Tokyo images (SODS 0.768) correlates with more variable flight altitudes (1.8-3.5m range) and higher wheat planting density that increases occlusion challenges.
4.5.6. Limitations of Benchmark-Only Evaluation
We emphasize that all results presented in this section are based on offline evaluation using the GWHD benchmark dataset, which, while comprising real UAV imagery from actual wheat fields, does not constitute real-world deployment validation. Benchmark evaluation provides controlled comparison conditions and standardized metrics but does not capture several critical aspects of practical UAV operation:
Environmental Robustness: GWHD images were captured under favorable weather conditions with clear skies and minimal wind. Real agricultural monitoring occurs under diverse conditions including overcast skies, variable lighting, rain-wetted wheat with altered reflectance properties, and strong winds causing motion blur and wheat head displacement between frames.
Temporal Consistency: Benchmark evaluation processes individual static images, while real UAV applications require temporal consistency across video sequences. Detection flickering (where wheat heads appear and disappear across consecutive frames) and track fragmentation significantly degrade counting accuracy in practice, issues that single-image metrics do not capture.
System Integration: Practical deployment involves integration with flight control systems, real-time processing constraints under variable CPU/GPU thermal throttling, communication latency between UAV and ground station, battery management affecting processing duty cycles, and data storage limitations requiring on-device filtering. None of these factors are present in benchmark evaluation.
Long-Tail Scenarios: The GWHD dataset, while diverse, cannot exhaustively cover all rare scenarios encountered in multi-season, multi-region agricultural monitoring: unusual wheat varieties, extreme growth stages, atypical planting patterns, sensor degradation, and unusual imaging geometries.
These limitations mean that the SODS improvements we demonstrate (from 0.630 baseline to 0.782 for LSM-YOLO) represent upper bounds on real-world performance. Practical field deployment would likely show smaller improvements and reveal failure modes not present in the benchmark. We are conducting ongoing field trials in collaboration with agricultural research stations to validate real-world performance, but comprehensive multi-location, multi-season deployment validation remains future work.
5. Discussion and Conclusions
This work addresses the fundamental tension between detection accuracy and computational efficiency in UAV-based wheat head detection through three synergistic contributions validated on the GWHD benchmark dataset. First, we introduced the Lightweight Adaptive Extraction (LAE) module that achieves 87.3% parameter reduction while improving mAP@0.5:0.95 by 4.8% through lossless spatial rearrangement and content-aware feature weighting (Section 3.1, validated in Table 1). Second, we integrated a P2-level high-resolution detection head that substantially improves small object recall from 0.666 to 0.840, addressing the critical challenge of detecting distant wheat heads in high-altitude UAV imagery (Section 3, validated through the SODS metric in Table 4 showing APTiny improvement from 0.423 to 0.634). Third, we incorporated the Dynamic Head mechanism with unified scale-spatial-task attention that achieves superior performance (+3.5% mAP@0.5 over self-attention) while maintaining a 30.1% lower parameter count (Section 3.2, validated in Table 3). The synergistic integration of these components in LSM-YOLO achieves state-of-the-art performance (mAP@0.5: 0.914, mAP@0.5:0.95: 0.510) while requiring only 1.29 M parameters and 3.4 GFLOPs—representing 50.0% parameter reduction and 46.0% computational cost reduction compared to baseline YOLO11n (Table 1 and Table 2). These results challenge the prevailing assumption that detection accuracy improvements necessitate proportional increases in model complexity, demonstrating instead that targeted architectural innovations guided by domain-specific insights can simultaneously enhance both performance dimensions.
The efficacy of the LAE module warrants particular attention, as it achieves 87.3% parameter reduction while improving detection accuracy by 4.8% in mAP@0.5:0.95. This counterintuitive result—that removing parameters enhances performance—suggests that conventional feature pyramid architectures contain substantial redundancy that impedes rather than facilitates learning when training data is limited and domain-specific. The spatial rearrangement operation’s effectiveness in preserving boundary information reflects a deeper principle: that feature preservation strategies should be optimized for the statistical properties of the target domain rather than generic natural images. Agricultural imagery exhibits characteristic spatial autocorrelation patterns stemming from row planting structures and crop uniformity that differ fundamentally from the heterogeneous scene compositions prevalent in general object detection benchmarks.
The Dynamic Head’s unified attention mechanism demonstrates that scale, spatial, and task awareness need not be addressed through independent processing streams but can be coherently integrated through sequential refinement. The superior performance of this approach over parallel multi-branch architectures suggests that information flow optimization—determining the order and manner in which different feature dimensions interact—constitutes a critical yet underexplored design dimension in detector architectures. The computational complexity analysis revealing scaling for sequential attention versus for full attention underscores the practical importance of decomposition strategies that maintain expressiveness while ensuring tractability.
The geographic partitioning strategy employed in our experiments—training on European and North American data while testing on Asian and Australian imagery—provides a rigorous assessment of cross-continental generalization. The 21.1% mAP@0.5 improvement over the baseline YOLO11n on this challenging split demonstrates that the proposed architectural innovations capture fundamental wheat head detection principles that transcend specific cultivation practices, genotypes, and environmental conditions. This generalization capability addresses a critical limitation in precision agriculture systems where models trained on limited institutional datasets typically exhibit severe performance degradation when deployed in new geographic contexts.
However, several considerations merit acknowledgment. The GWHD dataset, despite its multi-institutional origins, exhibits geographic imbalance with 68% of images originating from European sources. This imbalance may limit the representativeness of learned features for wheat-growing regions underrepresented in the training data, particularly sub-Saharan Africa, Latin America, and Central Asia where wheat cultivation practices differ substantially. The dataset’s temporal coverage, primarily spanning 2016–2019, may not adequately capture inter-annual climate variability or the evolving morphological characteristics of recently developed wheat varieties. Future work should prioritize expanding dataset diversity along these dimensions to assess whether the observed generalization capabilities extend to these underrepresented contexts.
The decision to train models from random initialization without ImageNet pre-training, while ensuring rigorous evaluation of architectural innovations, raises questions about optimal deployment strategies. Transfer learning from general vision tasks has demonstrated effectiveness in agricultural applications where labeled data is scarce. The comparative performance of LSM-YOLO with and without pre-training, and the analysis of which architectural components benefit most from pre-training, represents an important direction for understanding the interplay between domain-agnostic and domain-specific feature learning.
The reduced parameter count (1.29M) and computational requirements (3.4 GFLOPs) translate directly to extended flight time through reduced power consumption—a constraint that has historically limited the practical deployment of deep learning systems on agricultural UAVs.
However, several practical challenges require attention before widespread deployment. The standardized 1024 × 1024 pixel input resolution, while balancing detection accuracy and computational efficiency in controlled experiments, may not optimally serve diverse operational scenarios. High-altitude monitoring prioritizing coverage area over individual wheat head resolution might benefit from different resolution trade-offs. The development of adaptive resolution strategies that dynamically adjust input dimensions based on flight parameters represents an important avenue for optimizing the accuracy-efficiency-coverage trade-off space.
The success of LSM-YOLO’s lightweight architecture challenges the trend toward ever-larger models in agricultural computer vision. While transformer-based architectures have demonstrated impressive performance on large-scale datasets, their computational requirements often preclude deployment in resource-constrained agricultural contexts. Our results suggest that convolutional architectures, when carefully designed with domain-specific considerations, remain competitive and practically advantageous for agricultural applications. This finding has implications beyond wheat detection, potentially informing architectural choices for other precision agriculture tasks including fruit counting, disease assessment, and weed identification.
The architectural principles embodied in LSM-YOLO—efficient spatial information concentration, adaptive multi-scale feature extraction, and unified attention mechanisms—are not intrinsically wheat-specific but rather address general challenges in aerial agricultural monitoring. The transferability of these innovations to other crops and phenotyping tasks represents an important validation opportunity. Preliminary experiments applying LSM-YOLO to maize tassel detection and soybean pod counting suggest promising generalization, though comprehensive evaluation across diverse crop types and phenotyping objectives remains necessary.
6. Future Directions and Open Challenges
Several research directions emerge from this work that warrant sustained investigation. First, the integration of temporal information through recurrent or temporal attention mechanisms could improve detection consistency across video sequences, reducing frame-to-frame variability that complicates automated trait extraction. Second, the incorporation of auxiliary sensor modalities—particularly multispectral and thermal imagery increasingly available on agricultural UAV platforms—into the unified attention framework could enhance detection robustness under varying illumination and environmental conditions. Third, the extension from detection to instance segmentation and pose estimation would enable more detailed morphological analysis supporting trait extraction beyond simple head counting.
The challenge of continuous learning and model adaptation as new data becomes available represents a critical consideration for long-term deployment. Agricultural systems exhibit non-stationary characteristics due to climate change, evolving cultivation practices, and new variety introductions. Developing mechanisms for efficient model updating that leverage accumulated experience while adapting to distributional shift would enhance the sustained effectiveness of deployed systems. The exploration of few-shot and meta-learning approaches for rapid adaptation to new wheat varieties with minimal labeled data represents a particularly promising direction given the high cost of expert annotation.
Finally, the broader question of how to optimally balance model performance, computational efficiency, and interpretability in agricultural AI systems requires sustained attention. While LSM-YOLO’s architectural choices are motivated by principled considerations of feature preservation and multi-scale processing, the learned representations remain largely opaque to domain experts. Developing methods for extracting interpretable features that align with agronomic knowledge—such as explicit modeling of head orientation, awn presence, or maturity stage—could enhance trust and facilitate the identification of failure modes that impact practical deployment.
This work demonstrates that the seemingly incompatible objectives of detection accuracy and computational efficiency can be simultaneously achieved through architectural innovations informed by domain-specific insights into the structure of agricultural imagery and the constraints of UAV deployment. The LSM-YOLO framework establishes new performance benchmarks on the GWHD dataset while maintaining the smallest computational footprint among contemporary detectors, validating the central premise that targeted lightweight design need not compromise accuracy when guided by principled analysis of feature preservation requirements and multi-scale detection challenges.
The broader implications extend beyond wheat head detection to inform architectural strategies for precision agriculture applications more generally, particularly those requiring real-time processing on resource-constrained edge devices. As precision agriculture systems increasingly rely on continuous monitoring and responsive interventions, the development of efficient yet accurate detection frameworks becomes not merely an optimization objective but a fundamental enabler of sustainable agricultural intensification. The architectural principles embodied in LSM-YOLO—lightweight adaptive extraction, unified multi-dimensional attention, and careful optimization of information flow—provide a foundation for future advances in agricultural computer vision that balance scientific rigor with practical deployment considerations essential for real-world impact.
Author Contributions
Conceptualization, N.L., Y.Y., D.Y., J.T., S.D., H.H. and H.Z.; Methodology, N.L., Y.Y., D.Y., J.T., S.D. and H.Z.; Software, N.L., Y.Y., X.Y., S.D. and H.H.; Validation, N.L., Y.Y., X.Y., J.T. and H.H.; Investigation, Y.Y. and H.H.; Resources, N.L., Y.Y., X.Y., D.Y., J.T., S.D. and H.H.; Data curation, N.L., Y.Y., X.Y., D.Y. and S.D.; Writing—original draft, N.L., Y.Y., X.Y., D.Y., J.T. and H.H.; Writing—review & editing, N.L., Y.Y. and H.Z.; Visualization, D.Y. and H.Z.; Supervision, Y.Y., D.Y., S.D., H.H. and H.Z.; Project administration, N.L., Y.Y., J.T., S.D., H.H. and H.Z.; Funding acquisition, N.L., X.Y., J.T., H.H. and H.Z. All authors have read and agreed to the published version of the manuscript.
Funding
This research received no external funding.
Data Availability Statement
The original contributions presented in this study are included in the article. Further inquiries can be directed to the corresponding author.
Conflicts of Interest
The authors declare no conflicts of interest.
References
- Jocher, G.; Chaurasia, A.; Qiu, J. YOLOv11: An Improved Real-Time Object Detection Model. Ultralytics. 2024. Available online: https://docs.ultralytics.com/models/yolo11/ (accessed on 15 October 2025).
- Ding, X.; Zhang, X.; Han, J.; Ding, G. Scaling up your kernels to 31 × 31: Revisiting large kernel design in cnns. In Proceedings of the IEEE/CVF Conference on Computer Vision and Pattern Recognition, New Orleans, LA, USA, 18–24 June 2022; pp. 11963–11975. [Google Scholar]
- Ma, X.; Li, Z.; Zhang, W.; Liu, J. Lightweight adaptive extraction network for efficient object detection. IEEE Trans. Circuits Syst. Video Technol. 2023, 33, 4529–4542. [Google Scholar]
- Ding, X.; Zhang, X.; Ma, N.; Han, J.; Ding, G.; Sun, J. Repvgg: Making vgg-style convnets great again. In Proceedings of the IEEE/CVF Conference on Computer Vision and Pattern Recognition, Nashville, TN, USA, 20–25 June 2021; pp. 13733–13742. [Google Scholar]
- Shi, W.; Caballero, J.; Huszár, F.; Totz, J.; Aitken, A.P.; Bishop, R.; Rueckert, D.; Wang, Z. Real-time single image and video super-resolution using an efficient sub-pixel convolutional neural network. In Proceedings of the IEEE Conference on Computer Vision and Pattern Recognition, Las Vegas, NV, USA, 27–30 June 2016; pp. 1874–1883. [Google Scholar]
- Liu, G.; Qian, J.; Wen, F.; Zhu, X.; Ying, R.; Liu, P.; Lin, L. Adaptively connected neural networks. In Proceedings of the IEEE/CVF Conference on Computer Vision and Pattern Recognition, Long Beach, CA, USA, 15–20 June 2019; pp. 1781–1790. [Google Scholar]
- Singh, B.; Davis, L.S. SNIPER: Efficient multi-scale training. In Proceedings of the Advances in Neural Information Processing Systems, Montreal, ON, Canada, 3–8 December 2018; Volume 31. [Google Scholar]
- Zhou, X.; Wang, D.; Krähenbühl, P. Objects as points. arXiv 2019, arXiv:1904.07850. [Google Scholar] [PubMed]
- Zhang, S.; Chi, C.; Yao, Y.; Lei, Z.; Li, S.Z. Bridging the gap between anchor-based and anchor-free detection via adaptive training sample selection. arXiv 2020, arXiv:1912.02424. [Google Scholar]
- Lin, T.Y.; Dollár, P.; Girshick, R.; He, K.; Hariharan, B.; Belongie, S. Feature pyramid networks for object detection. In Proceedings of the IEEE Conference on Computer Vision and Pattern Recognition, Honolulu, HI, USA, 21–26 July 2017; pp. 2117–2125. [Google Scholar]
- Dai, X.; Chen, Y.; Xiao, B.; Chen, D.; Liu, M.; Yuan, L.; Zhang, L. Dynamic head: Unifying object detection heads with attentions. In Proceedings of the IEEE/CVF Conference on Computer Vision and Pattern Recognition, Nashville, TN, USA, 20–25 June 2021; pp. 7373–7382. [Google Scholar]
- David, E.; Madec, S.; Sadeghi-Tehran, P.; Aasen, H.; Zheng, B.; Liu, S.; Kirchgessner, N.; Ishikawa, G.; Nagasawa, K.; Badhon, M.A.; et al. Global wheat head detection (GWHD) dataset: A large and diverse dataset of high-resolution RGB-labelled images to develop and benchmark wheat head detection methods. Plant Phenomics 2020, 2020, 3521852. [Google Scholar] [CrossRef]
- Kamilaris, A.; Prenafeta-Boldú, F.X. Deep learning in agriculture: A survey. Comput. Electron. Agric. 2018, 147, 70–90. [Google Scholar] [CrossRef]
- Albanese, A.; Nardello, M.; Brunelli, D. Automated pest detection with DNN on the edge for precision agriculture. IEEE J. Emerg. Sel. Top. Circuits Syst. 2021, 11, 458–467. [Google Scholar] [CrossRef]
- Shorewala, S.; Ashfaque, A.; Sidharth, R.; Verma, U. Weed density and distribution estimation for precision agriculture using semi-supervised learning. IEEE Access 2021, 9, 27971–27986. [Google Scholar] [CrossRef]
- Mohan, A.; Peeples, J. Lacunarity pooling layers for plant image classification using texture analysis. In Proceedings of the IEEE/CVF Conference on Computer Vision and Pattern Recognition, Seattle, WA, USA, 16–22 June 2024; pp. 5384–5392. [Google Scholar]
- He, X.; Liu, Y.; Ganesan, K.; Ahnood, A.; Beckett, P.; Eftekhari, F.; Smith, D.; Uddin, M.H.; Skafidas, E.; Nirmalathas, A.; et al. A single sensor based multispectral imaging camera using a narrow spectral band color mosaic integrated on the monochrome CMOS image sensor. APL Photonics 2020, 5, 046104. [Google Scholar] [CrossRef]
- Mahato, S.B.; Thijs, S.; Bentell, J.; Wu, L.; Tack, K.; Boulenc, P.; Lasnet, D.; Van Langendonck, R.; De Moor, P. Multispectral CCD-in-CMOS Time Delay Integration imager for high resolution Earth observation. arXiv 2021, arXiv:2109.14532. [Google Scholar]
- Swaminathan, V.; Thomasson, J.A.; Hardin, R.G.; Rajan, N.; Raman, R. Selection of appropriate multispectral camera exposure settings and radiometric calibration methods for applications in phenotyping and precision agriculture. Plant Phenome J. 2024, 7, e70000. [Google Scholar] [CrossRef]
- Bajcsy, P.; Groves, P. Methodology for hyperspectral band selection. Photogramm. Eng. Remote Sens. 2004, 70, 793–802. [Google Scholar] [CrossRef]
- Alzubaidi, L.; Bai, J.; Al-Sabaawi, A.; Santamaría, J.; Albahri, A.S.; Al-Dabbagh, B.S.N.; Fadhel, M.A.; Manoufali, M.; Zhang, J.; Al-Timemy, A.H.; et al. A survey on deep learning tools dealing with data scarcity: Definitions, challenges, solutions, tips, and applications. J. Big Data 2023, 10, 46. [Google Scholar] [CrossRef]
- Marszalek, M.L.; Saux, B.L.; Mathieu, P.P.; Nowakowski, A.; Springer, D. Self-supervised learning—A way to minimize time and effort for precision agriculture? arXiv 2022, arXiv:2204.02100. [Google Scholar] [CrossRef]
- Siddique, A.; Tabb, A.; Medeiros, H. Self-supervised learning for panoptic segmentation of multiple fruit flower species. IEEE Robot. Autom. Lett. 2022, 7, 12387–12394. [Google Scholar] [CrossRef]
- Kerdegari, H.; Razaak, M.; Argyriou, V.; Remagnino, P. Semi-supervised GAN for classification of multispectral imagery acquired by UAVs. arXiv 2019, arXiv:1905.10920. [Google Scholar] [CrossRef]
- Sa, I.; Popović, M.; Khanna, R.; Chen, Z.; Lottes, P.; Liebisch, F.; Nieto, J.; Stachniss, C.; Walter, A.; Siegwart, R. WeedMap: A large-scale semantic weed mapping framework using aerial multispectral imaging and deep neural network for precision farming. Remote Sens. 2018, 10, 1423. [Google Scholar] [CrossRef]
- Heschl, A.; Murillo, M.; Najafian, K.; Maleki, F. SynthSet: Generative diffusion model for semantic segmentation in precision agriculture. In Proceedings of the European Conference on Computer Vision, Milan, Italy, 29 September–4 October 2024; pp. 267–283. [Google Scholar]
- Vougioukas, S.G. Agricultural robotics. Annu. Rev. Control. Robot. Auton. Syst. 2019, 2, 365–392. [Google Scholar] [CrossRef]
- Cheng, C.; Fu, J.; Su, H.; Ren, L. Recent advancements in agriculture robots: Benefits and challenges. Machines 2023, 11, 48. [Google Scholar] [CrossRef]
- Delavarpour, N.; Koparan, C.; Nowatzki, J.; Bajwa, S.; Sun, X. A technical study on UAV characteristics for precision agriculture applications and associated practical challenges. Remote Sens. 2021, 13, 1204. [Google Scholar] [CrossRef]
- Halstead, M.; Ahmadi, A.; Smitt, C.; Schmittmann, O.; McCool, C. Crop agnostic monitoring driven by deep learning. Front. Plant Sci. 2021, 12, 786702. [Google Scholar] [CrossRef]
- Bastani, F.; He, S.; Jiang, Z.; Bastani, O.; Madden, S. SkyQuery: An aerial drone video sensing platform. In Proceedings of the 2021 ACM SIGPLAN International Symposium on New Ideas, New Paradigms, and Reflections on Programming and Software, Virtual, 20–22 October 2021; pp. 56–67. [Google Scholar]
- Chakraborty, P.; Cruz, J.; Bhunia, S. Leveraging Domain Knowledge using Machine Learning for Image Compression in Internet-of-Things. arXiv 2020, arXiv:2009.06742. [Google Scholar] [CrossRef]
- Chou, H.f.; Ha, V.N.; Thiruvasagam, P.; Le, T.D.; Eappen, G.; Nguyen, T.T.; Garces-Socarras, L.M.; Gonzalez-Rios, J.L.; Merlano-Duncan, J.C.; Chatzinotas, S. On-air deep learning integrated semantic inference models for enhanced earth observation satellite networks. arXiv 2024, arXiv:2409.15246. [Google Scholar] [CrossRef]
- Pan, Y.; Hu, K.; Liu, T.; Chen, C.; Kang, H. Pheno-robot: An auto-digital modelling system for in-situ phenotyping in the field. arXiv 2024, arXiv:2402.09685. [Google Scholar]
- Günder, M.; Yamati, F.R.I.; Barreto, A.; Mahlein, A.K.; Sifa, R.; Bauckhage, C. SugarViT—Multi-objective regression of UAV images with Vision Transformers and Deep Label Distribution Learning demonstrated on disease severity prediction in sugar beet. PLoS ONE 2025, 20, e0318097. [Google Scholar] [CrossRef] [PubMed]
- Yuan, X.; Cheng, G.; Yao, R.; Han, J. Semantic Differentiation Aids Oriented Small Object Detection. IEEE Trans. Circuits Syst. Video Technol. 2025, 35, 5966–5979. [Google Scholar] [CrossRef]
- Tian, T.; Xin, J.; Wang, S.; Li, M. WH-DETR: An Efficient Network Architecture for Wheat Spike Detection in Complex Backgrounds. Agriculture 2024, 14, 961. [Google Scholar] [CrossRef]
- Chen, K.; Wang, J.; Pang, J.; Cao, Y.; Xiong, Y.; Li, X.; Sun, S.; Feng, W.; Liu, Z.; Xu, J.; et al. MMDetection: Open MMLab Detection Toolbox and Benchmark. arXiv 2019, arXiv:1906.07155. [Google Scholar] [CrossRef]
- Wilson, A.C.; Roelofs, R.; Stern, M.; Srebro, N.; Recht, B. The Marginal Value of Adaptive Gradient Methods in Machine Learning. In Proceedings of the Advances in Neural Information Processing Systems, Long Beach, CA, USA, 4–9 December 2017; Volume 30, pp. 4148–4158. [Google Scholar]
- Ioffe, S.; Szegedy, C. Batch Normalization: Accelerating Deep Network Training by Reducing Internal Covariate Shift. In Proceedings of the International Conference on Machine Learning, PMLR, Lille, France, 6–11 July 2015; pp. 448–456. [Google Scholar]
- Lin, T.Y.; Goyal, P.; Girshick, R.; He, K.; Dollár, P. Focal Loss for Dense Object Detection. In Proceedings of the IEEE International Conference on Computer Vision, Venice, Italy, 22–29 October 2017; pp. 2980–2988. [Google Scholar]
- Rezatofighi, H.; Tsoi, N.; Gwak, J.; Sadeghian, A.; Reid, I.; Savarese, S. Generalized Intersection Over Union: A Metric and a Loss for Bounding Box Regression. In Proceedings of the IEEE/CVF Conference on Computer Vision and Pattern Recognition, Long Beach, CA, USA, 15–20 June 2019; pp. 658–666. [Google Scholar]
- Lee, C.Y.; Xie, S.; Gallagher, P.; Zhang, Z.; Tu, Z. Deeply-Supervised Nets. In Proceedings of the Artificial Intelligence and Statistics, PMLR, San Diego, CA, USA, 9–12 May 2015; pp. 562–570. [Google Scholar]
- Lin, T.Y.; Maire, M.; Belongie, S.; Hays, J.; Perona, P.; Ramanan, D.; Dollár, P.; Zitnick, C.L. Microsoft COCO: Common Objects in Context. In Proceedings of the European Conference on Computer Vision, Zurich, Switzerland, 6–12 September 2014; pp. 740–755. [Google Scholar]
- Hu, J.; Shen, L.; Sun, G. Squeeze-and-excitation networks. In Proceedings of the IEEE Conference on Computer Vision and Pattern Recognition, Salt Lake City, UT, USA, 18–23 June 2018; pp. 7132–7141. [Google Scholar]
- Woo, S.; Park, J.; Lee, J.Y.; Kweon, I.S. Cbam: Convolutional block attention module. In Proceedings of the European Conference on Computer Vision (ECCV), Munich, Germany, 8–14 September 2018; pp. 3–19. [Google Scholar]
Disclaimer/Publisher’s Note: The statements, opinions and data contained in all publications are solely those of the individual author(s) and contributor(s) and not of MDPI and/or the editor(s). MDPI and/or the editor(s) disclaim responsibility for any injury to people or property resulting from any ideas, methods, instructions or products referred to in the content. |
© 2025 by the authors. Licensee MDPI, Basel, Switzerland. This article is an open access article distributed under the terms and conditions of the Creative Commons Attribution (CC BY) license (https://creativecommons.org/licenses/by/4.0/).