You are currently viewing a new version of our website. To view the old version click .
Mathematics
  • Feature Paper
  • Article
  • Open Access

19 November 2025

Deep Learning-Enhanced Iterative Modified Contrast Source Method for Electromagnetic Imaging in Half-Space

,
,
,
and
1
Department of Electrical and Computer and Engineering, Tamkang University, Tamsui 251301, Taiwan
2
School of Engineering, San Francisco State University, San Francisco, CA 94117-1080, USA
*
Author to whom correspondence should be addressed.

Abstract

This paper presents a hybrid inversion framework that integrates a physics-informed iterative algorithm with a deep learning-based refinement strategy to address the electromagnetic inverse scattering problem of a uniaxial object buried in lossy half-space environments. Specifically, an Iterative Modified Contrast Scheme (IMCS) is developed to accelerate convergence and produce stable initial estimates, yielding improved performance compared to conventional contrast source methods. These estimates are subsequently refined by U-Net architecture, thereby enhancing the image quality of the reconstructed dielectric targets. Numerical simulations demonstrate that the proposed framework achieves robust and high-fidelity reconstructions of buried high-contrast dielectric objects, even in the presence of 20% additive Gaussian noise.

1. Introduction

In the past, iterative algorithms incorporating regularization techniques were widely employed to address electromagnetic inverse scattering problems. However, these methods are often closely tied to the design of loss functions, resulting in time-consuming computations and limited efficiency. With the rapid advancement of science and technology, Artificial Intelligence (AI) has emerged as a prominent research area and has been extensively applied to electromagnetic imaging, offering novel solutions to longstanding limitations in traditional algorithms.
Electromagnetic imaging (EMI) utilizes electromagnetic waves to probe the internal structures of objects. It is widely applied in medical imaging technologies such as Magnetic Resonance Imaging (MRI), X-ray, and Computed Tomography (CT) scans to visualize internal tissues and bones. In geoscience, ground-penetrating radar is used to detect subsurface layers. EMI also plays a vital role in industrial Non-Destructive Testing (NDT) and security screening. The most commonly used image reconstruction techniques are traditional optimization-based iterative algorithms [1,2,3,4,5,6,7,8,9,10,11,12,13,14,15], which aim to improve computational efficiency and convergence in solving nonlinear and multiple scattering problems. In contrast, deep learning-based methods integrate neural network architectures with electromagnetic theory to enhance reconstruction accuracy and significantly accelerate the computational process [15,16,17,18,19,20,21,22,23,24,25,26,27,28,29,30,31,32,33,34,35]. In 2020, Qin et al. proposed a microwave breast imaging approach incorporating prior ultrasound information, which significantly improved the reconstruction accuracy and stability of the Contrast Source Inversion (CSI) method [1]. Later on, Wei improved the computational efficiency of the Born Iteration Method (BIM) and Distorted BIM (DBIM) by replacing matrix inversion with vector multiplication using a modified forward-solver [2]. In 2022, Zhang et al. introduced group sparsity regularization into the contrast source formulation to enhance domain sparsity and improve inversion quality [3]. In 2023, Sun proposed a cross-correlated CSI algorithm that achieves faster convergence and a lower computational cost in homogeneous background media [4]. Chiu applied the Whale Optimization Algorithm (WOA) and Spotted Hyena Optimizer (SHO) to improve image quality and efficiency in half-space conductor imaging tasks in 2023 [5]. Recent studies have explored variants of the Rytov method, multi-scale differential integration, subspace-warped iterative solvers, and hybrid regularization strategies, all aiming to improve convergence speed, reconstruction stability, and imaging resolution [6,7,8,9,10,11,12,13,14,15]. To enhance computational efficiency, Li et al. proposed a complex-valued CNN that does not require iteration and improves stability and generalization in 2019 [16]. In 2020, Xiao et al. introduced a fast 3D inversion scheme combining Born approximation with U-Net for better performance in layered media [17]. In 2021, Zhou et al. improved this framework to address both 2D and 3D scattering problems [18]. In 2022, Chiu et al. combined Dominant Current Scheme (DCS) with a backpropagation strategy to generate initial reconstructions, which were then refined using U-Net [19]. In the same year, Xu et al. proposed a scalable cascaded network to decouple inversion into linear transformation and multiresolution stages [20]. In 2023, Ma et al. employed total variation regularization in deep networks to enhance edge reconstruction and suppress background artifacts [21].
Further developments include CNNs optimized with structural similarity loss functions and multi-frequency data [22], hybrid forward–inverse networks with transceiver-invariant modules [23], and the application of Modified Contrast Scheme (MCS) for imaging uniaxial objects [18]. In 2023, Topbaş developed a moment method tailored for cylindrical scatterers in half-space environments [24]. In 2024, Chiu et al. designed an AI framework that integrates Generative Adversarial Networks (GANs) and a Self-Attention GAN (SAGAN) to enhance coarse and detailed reconstruction in half-space domains [25]. Additionally, Yao et al. proposed a conditional GAN-based architecture to address high-contrast, structurally complex scenarios [26]. Chiu et al. further introduced a physics-informed U-Net for high-resolution imaging of uniaxial dielectric objects [27]. Q. Lv implemented GANs with data completion mechanisms to address limited-aperture reconstruction [28]. Du et al. also applied Swin Transformers with attention blocks to extract multi-scale features in heterogeneous backgrounds in the same year [29]. In 2025, Du et al. proposed a globally perceptive physics-informed network to improve model generalization and consistency [30]. Xing et al. developed VBIM-Net, a variational Born iterative network with encoder–decoder architecture for nonlinear problems [31]. Maricar et al. presented Attention-U-Net with skip connections and spatial attention for improved millimeter-wave image reconstruction [32]. Li et al. provided a systematic review of deep learning developments in electrical tomography [15]. Huang et al. proposed a meta-learning-assisted untrained network capable of fast adaptation with limited data [33]. Wang et al. introduced the Polytechnic University of the Philippines (PUP)-Net, a 3D U-Net with polarization fusion for high-quality imaging in sparse array environments in 2025 [34]. The main contributions of this paper are summarized below:
  • This paper proposes an iterative Modified Contrast Source (MCS) formulation for the electromagnetic inverse scattering of uniaxial anisotropic objects buried in a half-space. The MCS serves as a physics-driven inversion algorithm that iteratively updates the contrast source to reconstruct the permittivity distribution from scattered-field data. This work presents the first complete derivation of the iterative MCS equations extended to half-space boundary conditions and applicable to both TE and TM polarizations. The proposed formulation focuses on establishing a rigorous mathematical framework that ensures physical consistency and theoretical completeness in modeling anisotropic scattering within layered media.
  • The proposed MCS–U-Net hybrid reconstruction framework is the first integration of an iterative MCS model with a U-Net architecture for the electromagnetic imaging of uniaxial objects buried in a half-space. The iterative MCS provides physically consistent initialization, while the U-Net refines image details. Numerical results clearly articulate how the initial physics-driven estimate benefits from data-driven refinement. Extensive simulations conducted under various dielectric contrasts and Gaussian noise levels (5–20%) demonstrate that the proposed method achieves superior reconstruction accuracy and computational efficiency compared to iterative CSI and iterative DCS approaches.
  • Compared to traditional methods such as CSI and DCS, MCS utilizes an improved contrast update mechanism that dynamically adjusts the contrast function during iterations, enabling faster convergence and more accurate initial estimates. These advantages make MCS particularly effective for imaging high-contrast and multi-layered targets in complex environments.
  • To address the intrinsic ill-posedness under noisy and limited-view conditions, this study incorporates a data-driven approach based on deep learning, which complements physical modeling by learning nonlinear mappings from coarse initial reconstructions to high-quality permittivity distributions. The proposed hybrid strategy not only accelerates convergence and reduces computational cost, but also demonstrates strong noise immunity, leading to improved reconstruction robustness and stability.
  • Compared with the method proposed in [18], the MCS–U-Net technique presented in this work more effectively addresses contrast information in layered media by a more accurate initial guess obtained from iterative MCS and better distinguishes targets within multi-layered structures, making it particularly suitable for the detection of buried objects.
This paper is organized as follows. Section 2 introduces the forward problem and the MCS formulation. Section 3 describes the proposed U-Net architecture and training procedure. Section 4 presents the numerical results. Section 5 concludes the study.
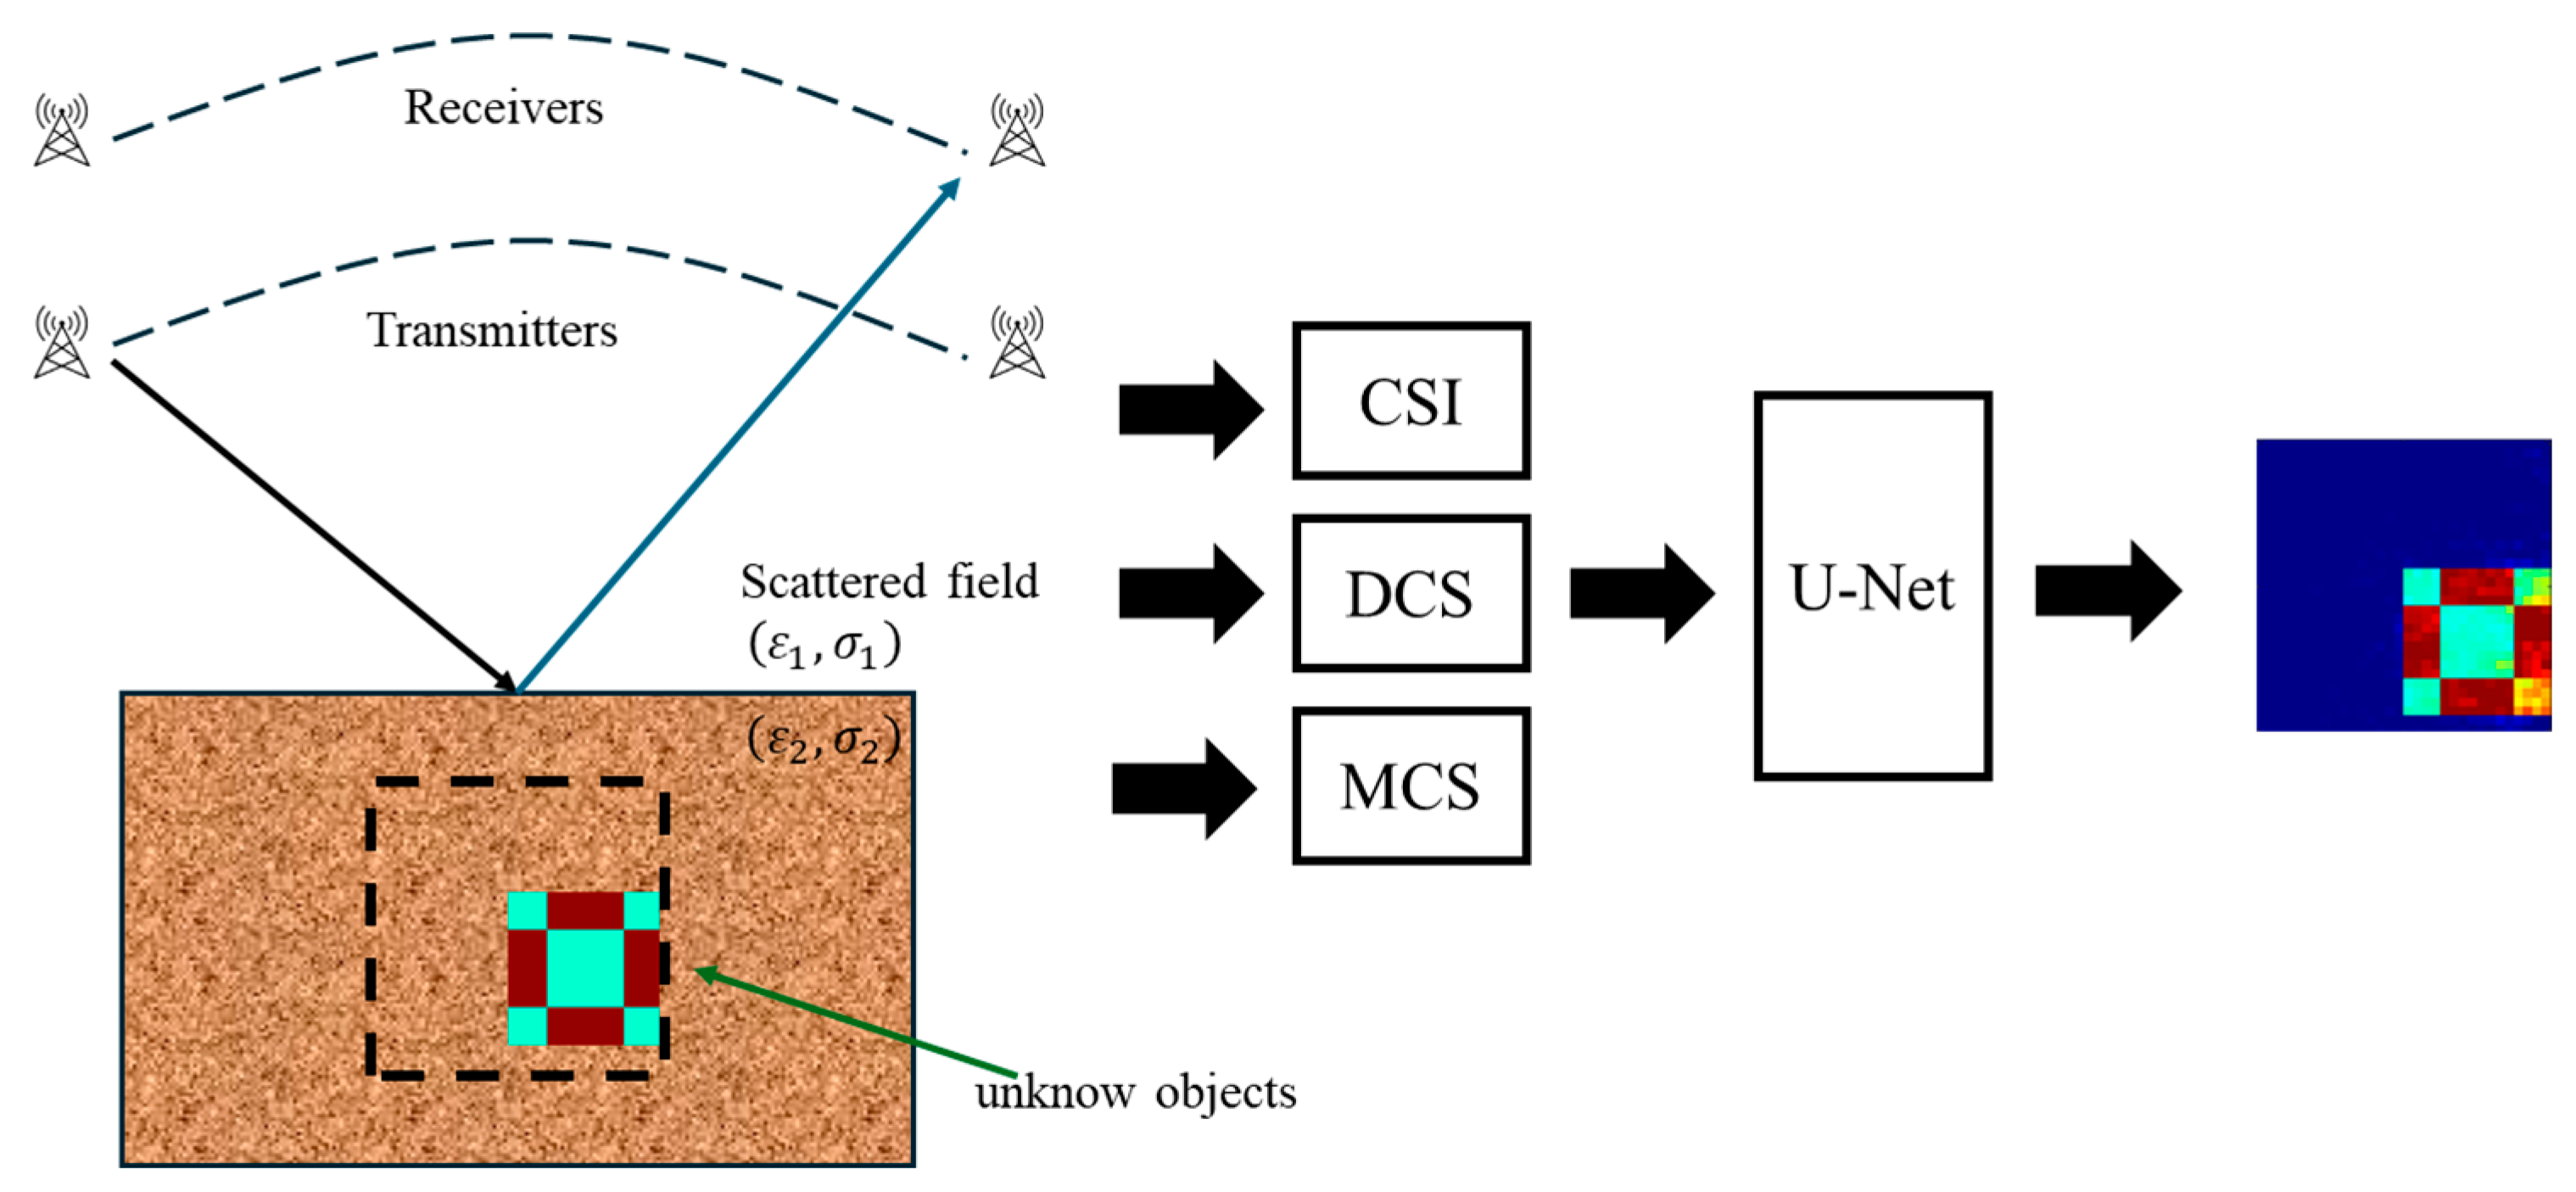
Figure 1 illustrates the proposed electromagnetic imaging framework. Antennas are used to transmit and receive microwave signals for the detection of unknown targets embedded within a lossy half-space environment. The scattered field data are initially processed using one of three iterative reconstruction algorithms—CSI, DCS, or the proposed MCS—to produce a coarse estimate of the permittivity distribution. This preliminary image is subsequently refined by a U-Net architecture to enhance structural integrity and contrast, ultimately yielding a high-resolution reconstruction of the electromagnetic profile.
Figure 1. Sensing and reconstruction architecture. The black arrows represent the incident wave, and the blue arrows represent the reflected wave.

2. Theory

A theoretical framework is proposed in this paper to describe the interaction of electromagnetic waves with dielectric objects embedded in a lossy half-space. The primary focus is on the mathematical modeling of both the forward and inverse scattering problems, which are essential for reconstructing subsurface permittivity distributions. The physical scenario assumes a two-dimensional domain, where an unknown-shaped dielectric target is buried beneath a half-space interface. The analysis distinguishes between Transverse Magnetic (TM) and Transverse Electric (TE) polarization modes, under which different components of the electric and magnetic fields dominate.
To establish the forward scattering problem, we begin with Maxwell’s equations and derive integral formulations by incorporating the induced current model and the half-space Green’s function. These formulations are then discretized to facilitate numerical implementation. In this research, we address the inverse scattering problem, aiming to retrieve the shape and permittivity of the scatterer from measured scattered field data. The three iterative schemes, namely CSI, DCS, and MCS, are analyzed in detail in the following sections. Each scheme is derived separately for TM and TE modes to capture polarization-specific interactions and reconstruction strategies.
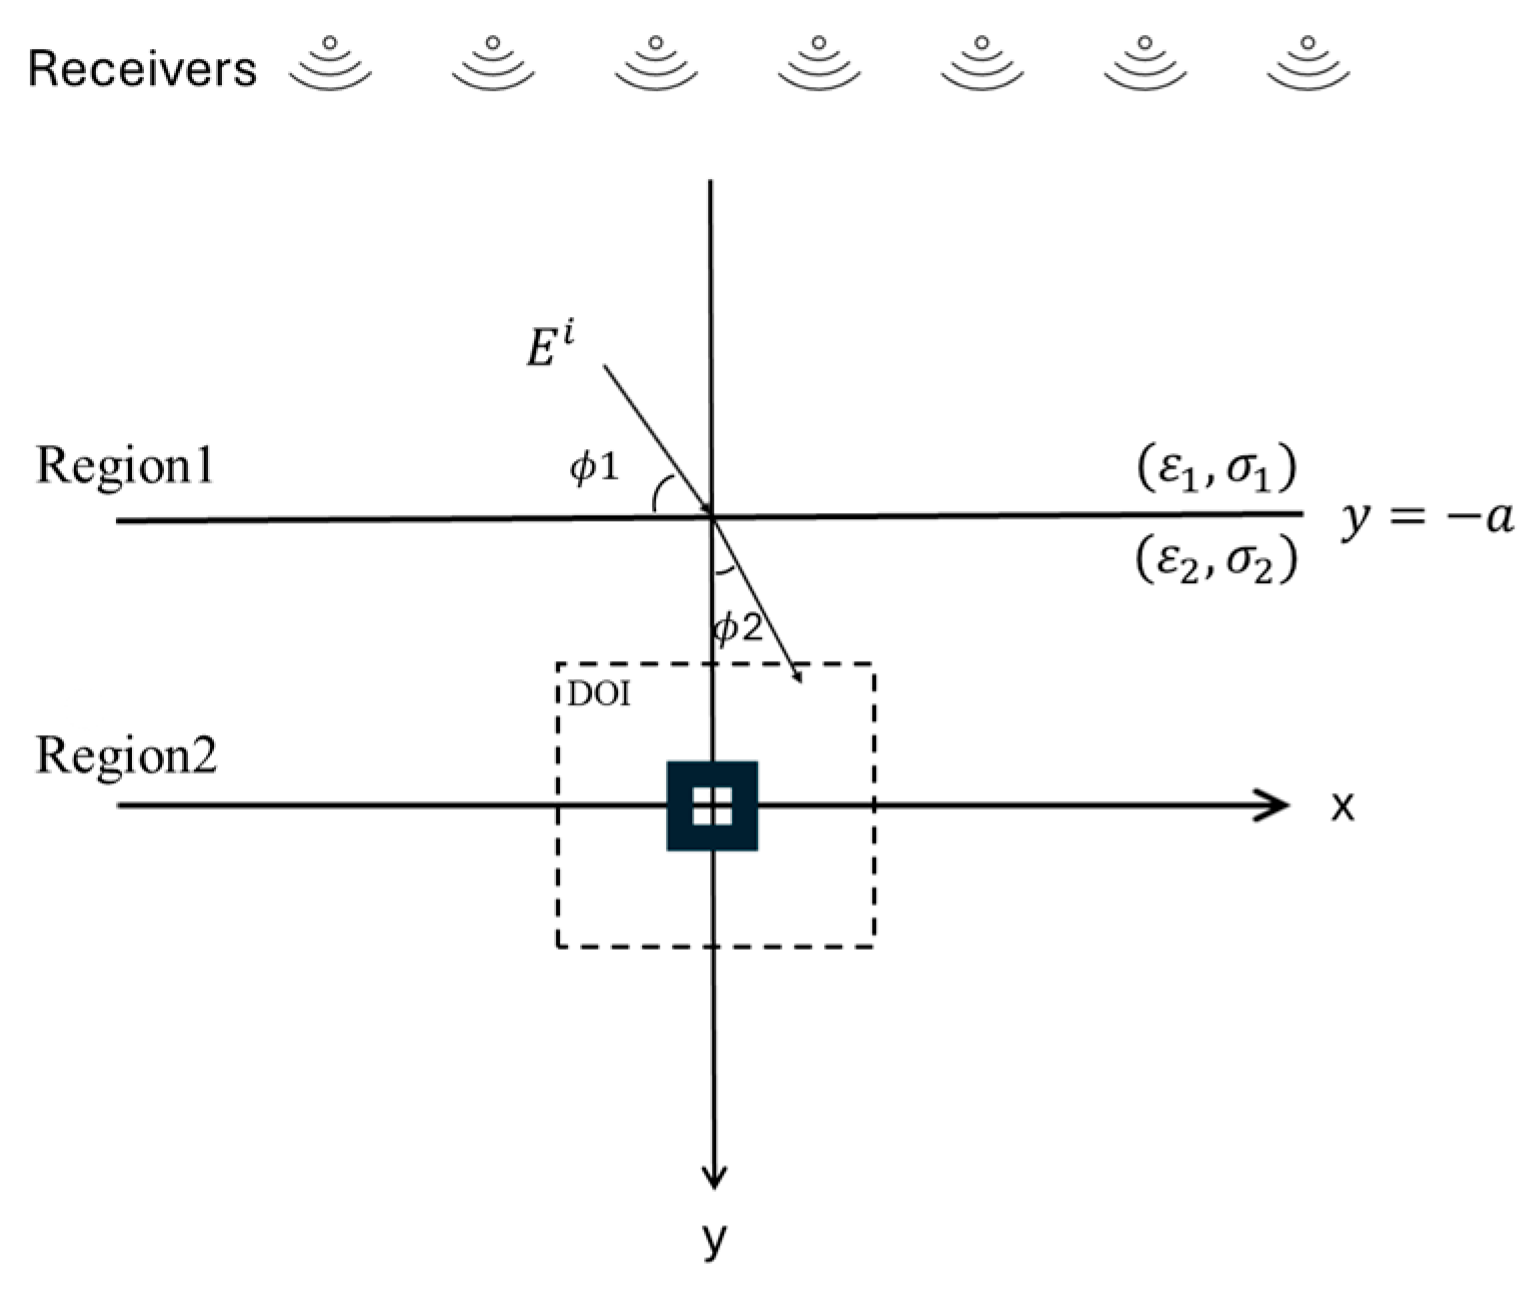
Figure 2 depicts a uniaxial dielectric object buried in a lossy half-space, which can conduct electricity but has a certain resistance. The cross sections of the object are assumed to be infinitely extended along the z-axis. There are two regions in this space, Region 1 and Region 2, where the dielectric coefficient and conductivity are ( ε 1 , σ 1 ) and ( ε 2 , σ 2 ) , respectively. The magnetic permeability in each region is the same as in free space as μ 0 , which means that we only consider non-magnetic materials. The incident wave is assumed to be time-harmonic, meaning that its behavior in time can be expressed as a sinusoidal function e j ω t with an angle of incidence ϕ 1 . The relative permittivity tensors ε ̿ r are as follows:
ε ̿ r = ε x x , y 0 0 0 ε y x , y 0 0 0 ε z x , y x y z
Figure 2. Schematic diagram of a 2D dielectric object embedded in a half-space.
It is worth noting that although the general tensor-form permittivity is used in the formulation, this study focuses on the uniaxial case, where the permittivity components along the x- and y-directions are identical ( ε   =   ε ) . In this study, the objects are assumed to be infinitely extended along the z-axis, and the reconstruction is performed on their two-dimensional cross sections.

2.1. Direct Problems

In the TM mode, the incident electric field is polarized along the z-direction, and the magnetic field lies in the x–y plane. The physical setup assumes the scatterer is invariant along the z-axis, allowing the problem to be treated in two dimensions. The time-harmonic incident field can be expressed as a plane wave of the following form:
E ¯ r = E x , y z ^ = E 1 x , y = e j k 1 x sinϕ 1 + y + a cos ϕ 1 + R 1 T M e j k 1 x sinϕ 1 y + a cosϕ 1 , y a E 2 x , y = T T M e j k 2 x sinϕ 2 + y + a cosϕ 2 , y > a
where k 1 , k 2 is the free-space wavenumber and ϕ 1 , ϕ 2 is the angle of incidence. R 1 T M = η 2 c o s 1 η 1 c o s 2 η 2 c o s 1 + η 1 c o s 2 and T T M = 2 η 2 cos ϕ 1 η 2 cos ϕ 1 + η 1 cos ϕ 2 represent the reflection and transmission coefficients, respectively. Where η 1 = μ 0 ε 1 j σ 1 / ω , η 2 = μ 0 ε 2 j σ 2 / ω . CSI, DCS, and MCS are used to simulate the forward scattered field in TM mode in this paper. The total field E z t o t can be divided into the incident field E z i plus scattered field E z s , and the scattered field can be expressed as an integral evaluated at any observation point r.
E z t o t r ¯ = E z i x , y + s G r ¯ , r ¯ ' k 2 2 ε z r ¯ ' 1 E z t o t r ¯ ' d s '
E z s r ¯ = s G r ¯ , r ¯ ' k 2 2 ε z r ¯ ' 1 E z t o t r ¯ ' d s '
where G r ¯ , r ¯ ' is the two-dimensional half-space Green’s function. ε r r ¯ ' is the relative dielectric constant.
2 + k 1 2 G r , r ' = δ r r '
G x , y ; x ' , y ' = G 1 x , y ; x ' , y ' , y a G 2 x , y ; x ' , y ' = G f x , y ; x ' , y ' + G s x , y ; x ' , y ' , y a
G 1 x , y ; x ' , y ' = 1 2 π j γ 1 + γ 2 e j γ 1 y + a e j γ 2 y ' + a e j α x x ' d α
G f x , y ; x ' , y ' = j 4 H 0 2 k 2 x x ' 2 + y y ' 2
G s x , y ; x ' , y ' = 1 2 π j 2 γ 2 γ 2 γ 1 γ 2 + γ 1 e j γ 2 y + 2 a + y ' e j α x x ' d α
G 1 x , y ; x ' , y ' = G ¯ ¯ D 2 D   ,   G 2 x , y ; x ' , y ' = G ¯ ¯ s 2 D
The induced current I r = τ E z t o t . After further discretizing the integral equation, the incident field can be expressed in matrix form:
E z i = G 1 τ U E z t o t
E z s = G 2 I r
Letting U denote the identity matrix, where τ n n = ε z r ¯ 1 , [ G 1 ] and [ G 2 ] are as follows:
G 1 m n = j π k 2 a n 2 J 1 k 2   a n H 0 2 k 2 ρ m n k 2 2 · G s x m , y m ; x n , y n π   a n 2 , m n j 2 π k 2   a n H 1 ( 2 ) k 2   a n 2 j k 2 2 · G s x m , y m ; x n , y n π   a n 2 , m = n
G 2 m n = k 2 2 · G 1 x m , y m ; x n , y n π   a n 2
where π a n 2 denotes the area d x × d y of the n-th equivalent cell. a n denotes the equivalent radius. In other words, d x × d y = π   a n 2 .
Compared with conventional CSI and DCS methods, the MCS approach introduces two position-dependent tuning factors, β z r and R z ( r ) , into the forward scattering model to characterize the physical interactions between the scatterer and the background medium more accurately. Specifically, β z ( r ) serves to compensate for field attenuation and propagation effects introduced by the half-space Green’s function, while R z ( r ) modulates the coupling strength between the contrast function and the total electric field. By doing so, the resulting induced current distribution more closely reflects the actual physical behavior. This formulation enhances the model’s stability and computational accuracy, particularly in high-contrast or multi-layer heterogeneous environments, and mitigates numerical instabilities associated with strong coupling effects.
In addition, MCS is also considered as another forward scattering modeling method in the TM mode. The incident field is shown in (2). The relationship between the contrast function β z ( r ) and the induced current I ( r ) in MCS is expressed as follows:
β z ( r ) I ( r ) = R ( r ) β z ( r ) I ( r ) + R z ( r ) E i ( r ) + D G 1 r , r ' I r ' r ' ,   for   r   D
The improved contrast R z ( r ) = β z ( r ) τ z m n β z ( r ) τ z m n + 1 1 is multiplied on the left and right sides of (9). In high-contrast or layered dielectrics, the coupling between the electric field and the contrast is nonlinear and evident, leading to dispersion or artifacts in conventional models. Multiplying R z ( r ) can be regarded as introducing an a priori contrast strength tuning function, so that the induced currents can reflect the variations of the real physical scene more accurately.
E z s = G 2 I ( r )
It is important to note that in this formulation, the scattered field differs from those in the CSI and DCS methods due to the inclusion of the additional scaling factors β z ( r ) and R z ( r ) in the definition of the induced current I ( r ) . In the TE mode, the electric field lies entirely in the x–y plane, while the magnetic field is directed along the z-axis. As in the TM case, the incident wave is assumed to be a time-harmonic wave propagating in a two-dimensional half-space, and can be expressed in the following form:
E i ( x , y ) = E 1 x , y = x ^ cos ϕ 1 + y ^ sin ϕ 1 e j k 1 x sin 1 + y + a cos 1 + x ^ cos ϕ 1 + y ^ sin ϕ 1 R 1 T E e j k 1 x sin 1 y + a cos 1 , y a E 2 x , y = x ^ cos ϕ 2 + y ^ sin ϕ 2 η 2 η 1 T T E e j k 2 x sin 2 + y + a cos 2 , y > a
R 1 T E = η 1 c o s 1 η 2 c o s 2 η 1 c o s 1 + η 2 c o s 2 and T T E = 2 η 1 c o s 1 η 2 c o s 2 + η 1 c o s 1 represent the reflection and transmission coefficients, respectively. Where η 1 = μ 0 ε 1 j σ 1 / ω , η 2 = μ 0 ε 2 j σ 2 / ω .
In order to simulate the forward scattered field in TE mode, CSI and DCS are used in this paper, where the total field E x t o t E y t o t can be divided into the incident field E x i E y i and the scattered field E x s E y s . The total field can be expressed as an integral form at any observation point r:
E x t o t r = 2 x 2 + k 0 2 s G r , r ' ε x r ' 1 E x t o t r ' d s ' 2 x y s G r , r ' ε y r ' 1 E y t o t r ' d s ' + E x i r
E y t o t r = 2 x y s G r , r ' ε x r ' 1 E x t o t r ' d s ' 2 y 2 + k 0 2 s G r , r ' ε y r ' 1 E y t o t r ' d s ' + E y i r
The induced current I x I y   = τ x 0 0 τ y E x t o t E y t o t . The scattered fields are derived as follows:
E x s r = 2 x 2 + k 0 2 s G r ¯ , r ¯ ' ε x r ¯ ' 1 E x t o t r ¯ ' d s ' 2 x y s G r ¯ , r ¯ ' ε y r ¯ ' 1 E y t o t r ¯ ' d s '
E y s r = 2 x y s G r ¯ , r ¯ ' ε x r ¯ ' 1 E x t o t r ¯ ' d s ' 2 y 2 + k 0 2 s G r ¯ , r ¯ ' ε y r ¯ ' 1 E y t o t r ¯ ' d s '
where G r ¯ , r ¯ ' is the two-dimensional Green’s function and ε x r ¯   ,   ε y r ¯ are the relative dielectric constants. After further discretizing of the integral equation, the incident field can be expressed in matrix form:
E x i E y i = G 3 G 4 G 4 G 5 τ x 0 0 τ y U 0 0 U E x t o t E y t o t
E x s E y s = G 6 G 7 G 7 G 8 τ x 0 0 τ y E x t o t E y t o t
where τ x n n = ε x r ¯ 1 , τ y n n = ε y r ¯ 1 , and ρ m n = x m x n 2 + y m y n 2 . G 3 G 4 G 4 G 5 and G 6 G 7 G 7 G 8 are as follows:
G 3 m n = 2 G s x , y ; x n , y n x 2 x = x m y = y m Δ S n + G s x m , y m ; x n , y n k 2 2 Δ S n + j π a n J 1 k 2 a n 2 ρ m n 3 k 2 ρ m n y m y n 2 H 0 2 k 2 ρ m n + x m x n 2 y m y n 2 H 1 2 k 2 ρ m n , m n 2 G s x , y ; x n , y n x 2 x = x m y = y m Δ S n + G s x m , y m ; x n , y n k 2 2 Δ S n + j 4 π k 2 a n H 1 2 k 2 a n 4 j , m = n
G 4 m n = 2 G s x , y ; x n , y n x y x = x m y = y m Δ S n + j π a n J 1 k 2 a n 2 ρ m n 3 x m x n y m y n 2 H 1 2 k 2 ρ m n k 2 ρ m n H 0 2 k 2 ρ m n , m n 0 , m = n
G 5 m n = 2 G s x , y ; x n , y n y 2 x = x m y = y m Δ S n + G s x m , y m ; x n , y n k 2 2 Δ S n + j π a n J 1 k 2 a n 2 ρ m n 3 k 2 ρ m n x m x n 2 H 0 2 k 2 ρ m n + y m y n 2 x m x n 2 H 1 2 k 2 ρ m n , m n 2 G s x , y ; x n , y n y 2 x = x m y = y m Δ S n + G s x m , y m ; x n , y n k 2 2 Δ S n + j 4 π k 2 a n H 1 2 k 2 a n 4 j , m = n
G 6 m n = 2 G 1 x , y ; x n , y n x 2 x = x m y = y m Δ S n + G 1 x m , y m ; x n , y n k 2 2 Δ S n
G 7 m n = 2 G 1 x , y ; x n , y n x y x = x m y = y m Δ S n
G 8 m n = 2 G 1 x , y ; x n , y n y 2 x = x m y = y m Δ S n + G 1 x m , y m ; x n , y n k 2 2 Δ S n
In addition, MCS is also considered as another forward scattering modeling method in the TE mode. The incident field is shown in (20). The relationship between the contrast function β ( r ) and the induced current I x I y in MCS is expressed as follows:
β x 0 0 β y U 0 0 U R x 0 0 R y I x I y = R x 0 0 R y E x i E y i + G 3 G 4 G 4 G 5 I x I y
The improved contrast R x ( r ) =   β x r τ x m n β x r τ x m n + 1 1 and R y ( r ) =   β y r τ y m n β y r τ y m n + 1 1 are multiplied on the left and right sides of (21).
E x s E y s = G 6 G 7 G 7 G 8 I x I y
It is important to note that in this formulation, the scattered field differs from those in the CSI and DCS methods due to the inclusion of the additional scaling factors β x 0 0 β y and R x 0 0 R y in the definition of the induced current I x I y .

2.2. CSI Inverse Scattering Theory

In the TM case, the incident field E ¯ i and scattered field E ¯ s are known. We need to find ε r . The objective function is defined as follows:
f I ¯ 1 , I ¯ 2 , I ¯ N i C S I _ T M = p = 1 N i [ U ] τ n G ¯ ¯ D 2 D · I ¯ p τ n E ¯ p i 2 E ¯ p i 2 + G ¯ ¯ s 2 D · I ¯ p E ¯ p s 2 E ¯ p s 2
N i represents the total number of incident waves. Equation (21) differentiates I ¯ p to obtain the gradient of f( I ¯   f ). g ¯ p , n is calculated as follows.
g ¯ p , n C S I _ T M = G ¯ ¯ s 2 D H · G ¯ ¯ s 2 D · I ¯ p E ¯ p s E ¯ p s 2 + [ U ] τ n G 1 H · [ I ] τ n G ¯ ¯ D 2 D · I ¯ p τ n E ¯ p i E ¯ p i 2
Defining the search direction,
ρ ¯ p , n C S I _ T M = g ¯ p , n C S I _ T M + R e [ g ¯ p , n C S I _ T M g ¯ p , n 1 C S I _ T M H g ¯ p , n C S I _ T M ] g ¯ p , n 1 C S I _ T M 2 ρ ¯ p , n 1 C S I _ T M
where p represents the p -th incidence and n represents the n-th iteration. Re extracts the real part and H represents the Hermitian operator. I ¯ p iterations are updated as follows:
I ¯ p , n C S I _ T M = I ¯ p , n 1 C S I _ T M + p , n C S I _ T M ρ ¯ p , n C S I _ T M
d p , n is the step size:
p , n C S I _ T M = ρ ¯ p , n C S I _ T M H · g ¯ p , n / G ¯ ¯ s 2 D · ρ ¯ p , n C S I _ T M 2 E ¯ p s 2 + [ U ] τ n G ¯ ¯ D 2 D · ρ ¯ p , n C S I _ T M 2 E ¯ p i 2
First, we calculate the total current Equation (24) at the n-th iteration, followed by the total electric field. Iterations are as follows:
E ¯ p , n t C S I _ T M = E ¯ p i + G ¯ ¯ D 2 D I ¯ p , n C S I _ T M
From I ¯ p , n C S I _ T M = τ E ¯ p , n t C S I _ T M , we obtain the following:
τ n C S I _ T M   = p = 1 N i I ¯ p , n C S I _ T M · E ¯ p , n t C S I _ T M * p = 1 N i E ¯ p , n t C S I _ T M 2
* denotes the conjugate operation.
Similarly, in the TE case, the incident field E x i E y i and scattered field E x s E y s are known. We need to find ε r . The objective function is defined as follows:
f I x 1 I y 1   , I x 2 I y 2   , I x N i I y N i   C S I T E p = 1 N i U τ x 0 0 τ y G 3 G 4 G 4 G 5 · I x   p I y   p τ x 0 0 τ y E x i p E y i p 2 E x i p E y i p 2 + G 6 G 7 G 7 G 8 · I x   p I y   p E x s p E y s p 2 E x s p E y s p 2
Equation (36) differentiates I x   p I y   p to obtain the gradient of f ( I ¯ f ) .   g ¯ p , n is calculated as follows:
g ¯ ¯ x   p , n g ¯ ¯ y   p , n C S I _ T E = [ U ] τ x 0 0 τ y G 3 G 4 G 4 G 5 H · [ U ] τ x 0 0 τ y G 3 G 4 G 4 G 5 · I x p I y p τ x 0 0 τ y E x i p E y i p E x   p i E y   p i 2 + G 6 G 7 G 7 G 8 H · G 6 G 7 G 7 G 8 · I x   p I y   p E x   p s E y   p s E x   p s E y   p s 2
Defining the search direction,
ρ x , p , n ρ y , p , n C S I _ T E = g x p , n   g y p , n C S I _ T E + R e g x p , n   g y p , n C S I _ T E g x p , n 1     g y p , n 1 C S I _ T E H g x p , n   g y p , n C S I _ T E g x p , n 1   g y p , n 1 C S I _ T E 2 ρ x p , n 1 ρ y p , n 1 C S I _ T E
where p represents the p -th incidence and n represents the n-th iteration. I ¯ p d iterations are updated as follows:
I x   p , n I y   p , n C S I _ T E = I x   p , n 1 I y   p , n 1 C S I _ T E + p , n C S I _ T E ρ x , p , n ρ y , p , n C S I _ T E
d p , n is the step size:
p , n C S I _ T E = ρ x , p , n ρ y , p , n C S I _ T E H · g x p , n   g y p , n C S I _ T E U 0 0 U τ x 0 0 τ y G 3 G 4 G 4 G 5 · ρ x , p , n ρ y , p , n C S I _ T E 2 E x   p i E y   p i 2 + G 6 G 7 G 7 G 8 · ρ x , p , n ρ y , p , n C S I _ T E 2 E x   p s E y   p s 2
First, we calculate the total current at the n-th iteration, followed by the total electric field.
E x , p , n t E y , p , n t C S I _ T E = E x , p i E y , p i + G 3 G 4 G 4 G 5 I x   p , n I y   p , n C S I _ T E
From I x   p , n I y   p , n C S I _ T E = τ x 0 0 τ y E x , p , n t E y , p , n t C S I _ T E , we obtain the following:
τ x τ y ( n ) C S I _ T E = p = 1 N i I x   p , n I y   p , n C S I _ T E · E x , p , n t E y , p , n t C S I _ T E * p = 1 N i E x , p , n t E y , p , n t C S I _ T E 2

2.3. DCS Inverse Scattering Theory

In the TM case, the incident field E ¯ i and scattered field E ¯ s are known, and we need to find ε r . Here, the induced current is split into I ¯ = I ¯ P d + I ¯ P a and the primary current plus the secondary current. The primary current is I ¯ d = n = 1 L m u ¯ n H E ¯ s σ n v ¯ n , i = 1 L m . The above expression represents the inverse estimation of the induced current I ¯ d by projecting the scattered field E ¯ s onto the left singular vectors u ¯ n via Singular Value Decomposition (SVD) of the Green function. H represents the Hermitian operator. By weighing the right singular vectors v ¯ n according to the projection coefficients and singular values, a least-squares approximation of the solution is obtained. σ n corresponds to the n-th singular value and represents the associated energy intensity in that direction. L m denotes the adjustment parameter. We define the objective function of the secondary current I ¯ P a :
f I ¯ 1 a , I ¯ 2 a , I ¯ N i a D C S _ T M = p = 1 N i [ U ] τ n G ¯ ¯ D 2 D · I ¯ p a τ n E ¯ p i 2 E ¯ p i 2 + G ¯ ¯ s 2 D · I ¯ p a + G 2 · I ¯ p d E ¯ p s 2 E ¯ p s 2
N i represents the total number of incident waves. Equation (35) differentiates I ¯ p a to obtain the gradient of f( I ¯ a f ). g ¯ p , n is calculated as follows.
g ¯ p , n D C S _ T M = G 2 H · G 2 · I ¯ p a + G 2 · I ¯ p d E ¯ p s E ¯ p s 2 + [ U ] τ n G 1 H · [ U ] τ n G 1 · I ¯ p a τ n E ¯ p i E ¯ p i 2
Defining the search direction,
ρ ¯ p , n D C S _ T M = g ¯ p , n D C S _ T M + R e g ¯ p , n D C S _ T M g ¯ p , n 1 D C S _ T M H g ¯ p , n D C S _ T M g ¯ p , n 1 D C S _ T M 2 ρ ¯ p , n 1 D C S _ T M
where p represents the p -th incidence and n represents the n-th iteration. I ¯ p a is updated as follows:
I ¯ p , n a D C S _ T M = I ¯ p , n 1 a D C S _ T M + d p , n D C S _ T M ρ ¯ p , n D C S _ T M
d p , n D C S _ T M is the step size:
d p , n D C S _ T M = ρ ¯ p , n D C S T M H · g ¯ p , n D C S T M G 2 · ρ ¯ p , n D C S T M 2 E ¯ p s 2 + I τ n G 1 · ρ ¯ p , n D C S T M 2 E ¯ p i 2
First, we calculate the total current at the n-th iteration, followed by the total electric field.
I ¯ p , n a D C S _ T M = I ¯ d + I ¯ p , n a D C S _ T M
E ¯ p , n t D C S _ T M = E ¯ p i + G 1 I ¯ p , n a D C S _ T M
From I ¯ p , n a D C S _ T M = τ E ¯ p , n t D C S _ T M , we obtain the following:
τ n D C S _ T M = p = 1 N i I ¯ p , n a D C S _ T M · E ¯ p , n t D C S _ T M * p = 1 N i E ¯ p , n t D C S _ T M 2
In the TE case, the incident field E x i E y i and scattered field E x s E y s are known, and we need to find ε r . Here, the induced current is split into I x I y   = I x d I y d + I x a I y a and the primary current plus the secondary current. The primary current is I x d I y d = n = 1 L e u ¯ j H E x s E y s σ e v x s v y s , i = 1 L e . The above expression represents the inverse estimation of the induced current I x d I y d by projecting the scattered field E x s E y s onto the left singular vectors u ¯ j via SVD of the Green function. H represents the Hermitian operator. By weighing the right singular vectors v x s v y s according to the projection coefficients and singular values, a least-squares approximation of the solution is obtained. σ e corresponds to the n-th singular value and represents the associated energy intensity in that direction. L e denotes the adjustment parameter.
The objective function is defined as follows:
f I x 1 d I y 1 d , I x 2 d I y 2 d , I x N i d I y N i d D C S _ T E = p = 1 N i [ U ] τ x 0 0 τ y G 3 G 4 G 4 G 5 · I x d p I y d p τ x 0 0 τ y E x i p E y i p 2 E x i p E y i p 2 + G 6 G 7 G 7 G 8 · I x d p I y d p E x s p E y s p 2 E x s p E y s p 2
Equation (51) differentiates I x   p a I y   p a to obtain the gradient of f( I ¯ a f ). g ¯ p , n is calculated as follows.
g ¯ ¯ x   p , n g ¯ ¯ y   p , n D C S _ T E = [ U ] τ x 0 0 τ y G 3 G 4 G 4 G 5 H · [ U ] τ x 0 0 τ y G 3 G 4 G 4 G 5 · I x d p I y d p τ x 0 0 τ y E x i p E y i p E x   p i E y   p i 2 + G 6 G 7 G 7 G 8 H · G 6 G 7 G 7 G 8 · I x   p a I y   p a E x , p s E y , p s E x   p s E y   p s 2
Defining the search direction,
ρ x , p , n ρ y , p , n D C S _ T E = g ¯ ¯ x   p , n g ¯ ¯ y   p , n D C S _ T E + R e g ¯ ¯ x   p , n g ¯ ¯ y   p , n D C S _ T E g ¯ ¯ x   p , n 1 g ¯ ¯ y   p , n 1 D C S _ T E H g ¯ ¯ x   p , n g ¯ ¯ y   p , n D C S _ T E g ¯ ¯ x   p , n 1 g ¯ ¯ y   p , n 1 D C S _ T E 2 ρ x p , n 1 ρ y p , n 1 D C S _ T E
where p represents the p -th incidence and n represents the n-th iteration. I ¯ p a iterations are updated as follows:
I x   p , n a I y   p , n a D C S _ T E = I x   p , n 1 a I y   p , n 1 a D C S _ T E + d p , n D C S _ T E ρ x , p , n ρ y , p , n D C S _ T E
d p , n is the step size:
d p , n D C S _ T E = ρ x , p , n ρ y , p , n D C S _ T E H g ¯ ¯ x   p , n g ¯ ¯ y   p , n D C S _ T E U τ x 0 0 τ y G 3 G 4 G 4 G 5 · ρ x , p , n ρ y , p , n D C S _ T E 2 E x   p i E y   p i 2 + G 6 G 7 G 7 G 8 · ρ x , p , n ρ y , p , n D C S _ T E 2 E x   p s E y   p s 2
First, we calculate the total current at the n-th iteration, followed by the total electric field.
I x   p , n I y   p , n D C S _ T E = I x   p d I y   p d D C S _ T E + I x   p , n a I y   p , n a D C S _ T E
E x , p , n t E y , p , n t D C S _ T E = E x , p i E y , p i + G 3 G 4 G 4 G 5 I x   p , n I y   p , n D C S _ T E
From I x   p , n I y   p , n D C S _ T E = τ x 0 0 τ y E x , p , n t E y , p , n t D C S _ T E , we obtain the following:
τ x τ y D C S _ T E = I x   p , n I y   p , n D C S _ T E · E x , p , n t E y , p , n t D C S _ T E * E x , p , n t E y , p , n t D C S _ T E 2

2.4. MCS Inverse Scattering Theory

In the TM case, the incident field E ¯ i and scattered field E ¯ s are known, and we need to find ε r . Here, the induced current is split into I ¯ = I ¯ P d + I ¯ P a and the primary current plus the secondary current. The primary current is I ¯ d = n = 1 L m u ¯ n H E ¯ s σ n v ¯ n , i = 1 L m . H represents the Hermitian operator. The objective function is defined as follows:
f I ¯ 1 a , I ¯ 2 a , I ¯ N i a , R ¯ ¯ M C S _ T M   = p = 1 N i A ¯ ¯ · I ¯ p a + B ¯ p 2 E ¯ p i 2 + G 2 · I ¯ p a + G 2 · I ¯ p d E ¯ p s 2 E ¯ p s 2
A ¯ ¯ = d i a g β ¯ d i a g R ¯ · d i a g β ¯ + G 1
B ¯ p = d i a g β ¯ · I ¯ p d d i a g R ¯ · d i a g β ¯ · I ¯ p d + G 1 · I ¯ p d + E ¯ p i
Equation (60) differentiates I ¯ p a to obtain the gradient of f ( I ¯ a f ) .   g ¯ p , n is calculated as follows.
I ¯ p , n a = I ¯ p , n 1 a + d p , n ρ ¯ p , n
d p , n is the step size:
p , n = ρ ¯ p , n H · g ¯ p , n / G ¯ ¯ s 2 D · ρ ¯ p , n 2 E ¯ p s 2 + A ¯ ¯ · ρ ¯ p , n 2 E ¯ p i 2
Substituting d i a g β ¯ · I ¯ = d i a g R ¯ · d i a g β ¯ · I ¯ + E ¯ i + G ¯ ¯ s 2 D I ¯ to Equation (51) and differentiating against R ¯ ,
d i a g R ¯ = p = 1 N i d i a g β ¯ · I ¯ + E ¯ i + G ¯ ¯ D 2 D I ¯ H · d i a g β ¯ · I ¯ / d i a g β ¯ · I ¯ + E ¯ i + G ¯ ¯ D 2 D I ¯ 2
First, we calculate the total current at the n-th iteration, followed by the total electric field and R ¯ n . R ¯ n denotes the contrast source term at the n-th iteration.
I ¯ p , n = I ¯ d + I ¯ p , n a
E ¯ p , n t = E ¯ p i + G ¯ ¯ D 2 D I ¯ p , n d
R ¯ n m = j I ¯ p , n · β ¯ · β ¯ I ¯ p , n + E ¯ p , n t * β ¯ I ¯ p , n + E ¯ p , n t 2
At the n-th iteration of R ¯ n , we obtain the following:
τ m , n = R m , n β β R m , n
In the TE case, the incident field E x i E y i and scattered field E x s E y s are known, and we need to find ε r . Here, the induced current is split into I x I y   = I x d I y d + I x a I y a and the primary current plus the secondary current. The primary current is I x d I y d =   v x s v y s · u ¯ j H E x s E y s σ e . The objective function is defined as follows:
f I x 1 a I y 1 a , I x 2 a I y 2 a , I x N i a I y N i a , R x 0 0 R y = p = 1 N i A ¯ ¯ 2 · I x a p I y a p + B ¯ 2 p 2 E x i p E y i p 2 + G 6 G 7 G 7 G 8 · I x a p I y a p + G 6 G 7 G 7 G 8 · I x d p I y d p E x s p E y s p 2 E x s p E y s p 2
A ¯ ¯ 2 = β x 0 0 β y R x 0 0 R y β x 0 0 β y + G 3 G 4 G 4 G 5
B ¯ 2 p = β x 0 0 β y · I x d I y d R x 0 0 R y β x 0 0 β y · I x d I y d + G 3 G 4 G 4 G 5 · I x d I y d + E x i E y i
Equation (66) differentiates I x   p a I y   p a to obtain the gradient of f ( I ¯ a f ) .   g ¯ p , n is calculated as follows:
g ¯ ¯ x   p , n g ¯ ¯ y   p , n = A ¯ ¯ 2 H · A ¯ ¯ 2 · I x   p a I y   p a + B ¯ 2 p E x   p i E y   p i 2 + G 6 G 7 G 7 G 8 H · G 6 G 7 G 7 G 8 · I x   p a I y   p a + G 6 G 7 G 7 G 8 · I x   p d I y   p d E x   p s E y   p s E x   p s E y   p s 2
Defining the search direction,
ρ x , p , n ρ y , p , n = g ¯ ¯ x p , n   g ¯ ¯ y p , n + R e [ g x p , n   g y p , n g x p , n 1   g y p , n 1 H g x p , n   g y p , n ] g x p , n 1   g y p , n 1 2 ρ x p , n 1 ρ y p , n 1
where p represents the p -th incidence and n represents the n-th iteration. I ¯ p a iterations are updated as follows:
I x   p , n a I y   p , n a = I x   p , n 1 a I y   p , n 1 a + d p , n ρ x p , n ρ y p , n
d p , n is the step size:
p , n = ρ x , p , n ρ y , p , n H · g ¯ ¯ x p , n   g ¯ ¯ y p , n / A ¯ ¯ 2 · ρ ¯ p , n 2 E x   p i E y   p i 2 + G 6 G 7 G 7 G 8 · ρ ¯ p , n 2 E x   p s E y   p s 2
Substituting β x 0 0 β y   · I x I y   =   R x 0 0 R y   β x 0 0 β y   · I x I y   + R x 0 0 R y   E x i E y i + G 3 G 4 G 4 G 5 I x I y to Equation (66) and differentiating against R ¯ ,
R x 0 0 R y = p = 1 N i β x 0 0 β y · I x I y + E x i E y i + G 3 G 4 G 4 G 5 I x I y H · β x 0 0 β y · I x I y / β x 0 0 β y · I x I y + E x i E y i + G 3 G 4 G 4 G 5 I x I y 2
First, we calculate the total current at the n-th iteration, followed by the total electric field and R ¯ n . R ¯ n denotes the contrast source term at the n-th iteration.
I x , p , n I y , p , n = I x , p d I y , p d + I x , p , n a I y , p , n a
E x , p , n t E y , p , n t = E x , p i E y , p i + G 3 G 4 G 4 G 5 I x , p , n I y , p , n
R x , n R y , n m = j β x 0 0 β y · I x , p , n I y , p , n · β x 0 0 β y I x , p , n I y , p , n + E x , p , n t E y , p , n t * β x 0 0 β y I x , p , n I y , p , n + E x , p , n t E y , p , n t 2
At the n-th iteration of R ¯ n , we obtain the following:
τ x τ y m , n =   R x R y m , n β x β y β x β y · R x R y m , n

3. U-Net

CNNs have proven to be highly effective for image processing by leveraging multi-layer feature extraction and handling large-scale datasets. These networks have revolutionized various computer vision tasks, including image classification, object detection, and semantic segmentation. Architecturally, CNNs consist of convolutional layers to extract spatial features, pooling layers for down-sampling, and fully connected layers for final decision-making. The strength of CNNs lies in their ability to learn hierarchical feature representations—initial layers capture low-level features such as edges and textures, while deeper layers identify high-level structures such as shapes, objects, or regions of interest.
Recent advancements, including transfer learning, data augmentation, and the development of sophisticated architectures such as ResNet, EfficientNet, and MobileNet, have further enhanced CNN performance and generalization capabilities across diverse domains. Nevertheless, deep learning models typically require extensive computational resources and often struggle with generalization when the available data exhibit large variations or limited coverage. This challenge is particularly pronounced in scientific imaging domains, where obtaining abundant and well-labeled data is difficult. Consequently, improper regularization or network tuning may lead to overfitting and unstable reconstructions.
In the context of electromagnetic inverse scattering, the growing problem complexity and the intrinsic ill-posedness under noisy and limited-view conditions necessitate architectures that can both denoise and enhance physical structures. To this end, the U-Net architecture is employed to refine the images generated by physics-based inversion methods (CSI, DCS, and MCS), enabling simultaneous noise suppression, structural preservation, and quantitative feature enhancement in the reconstructed permittivity distributions.
U-Net is a convolutional neural network originally proposed for biomedical image segmentation and has since been widely adopted for various inverse imaging and electromagnetic reconstruction problems. It is characterized by a symmetric encoder–decoder structure with skip connections between corresponding layers to preserve spatial details that may otherwise be lost during down-sampling. The integration of U-Net into the electromagnetic reconstruction pipeline provides a well-balanced trade-off between accuracy, computational efficiency, and model interpretability, making it a robust foundation for quantitative imaging tasks.
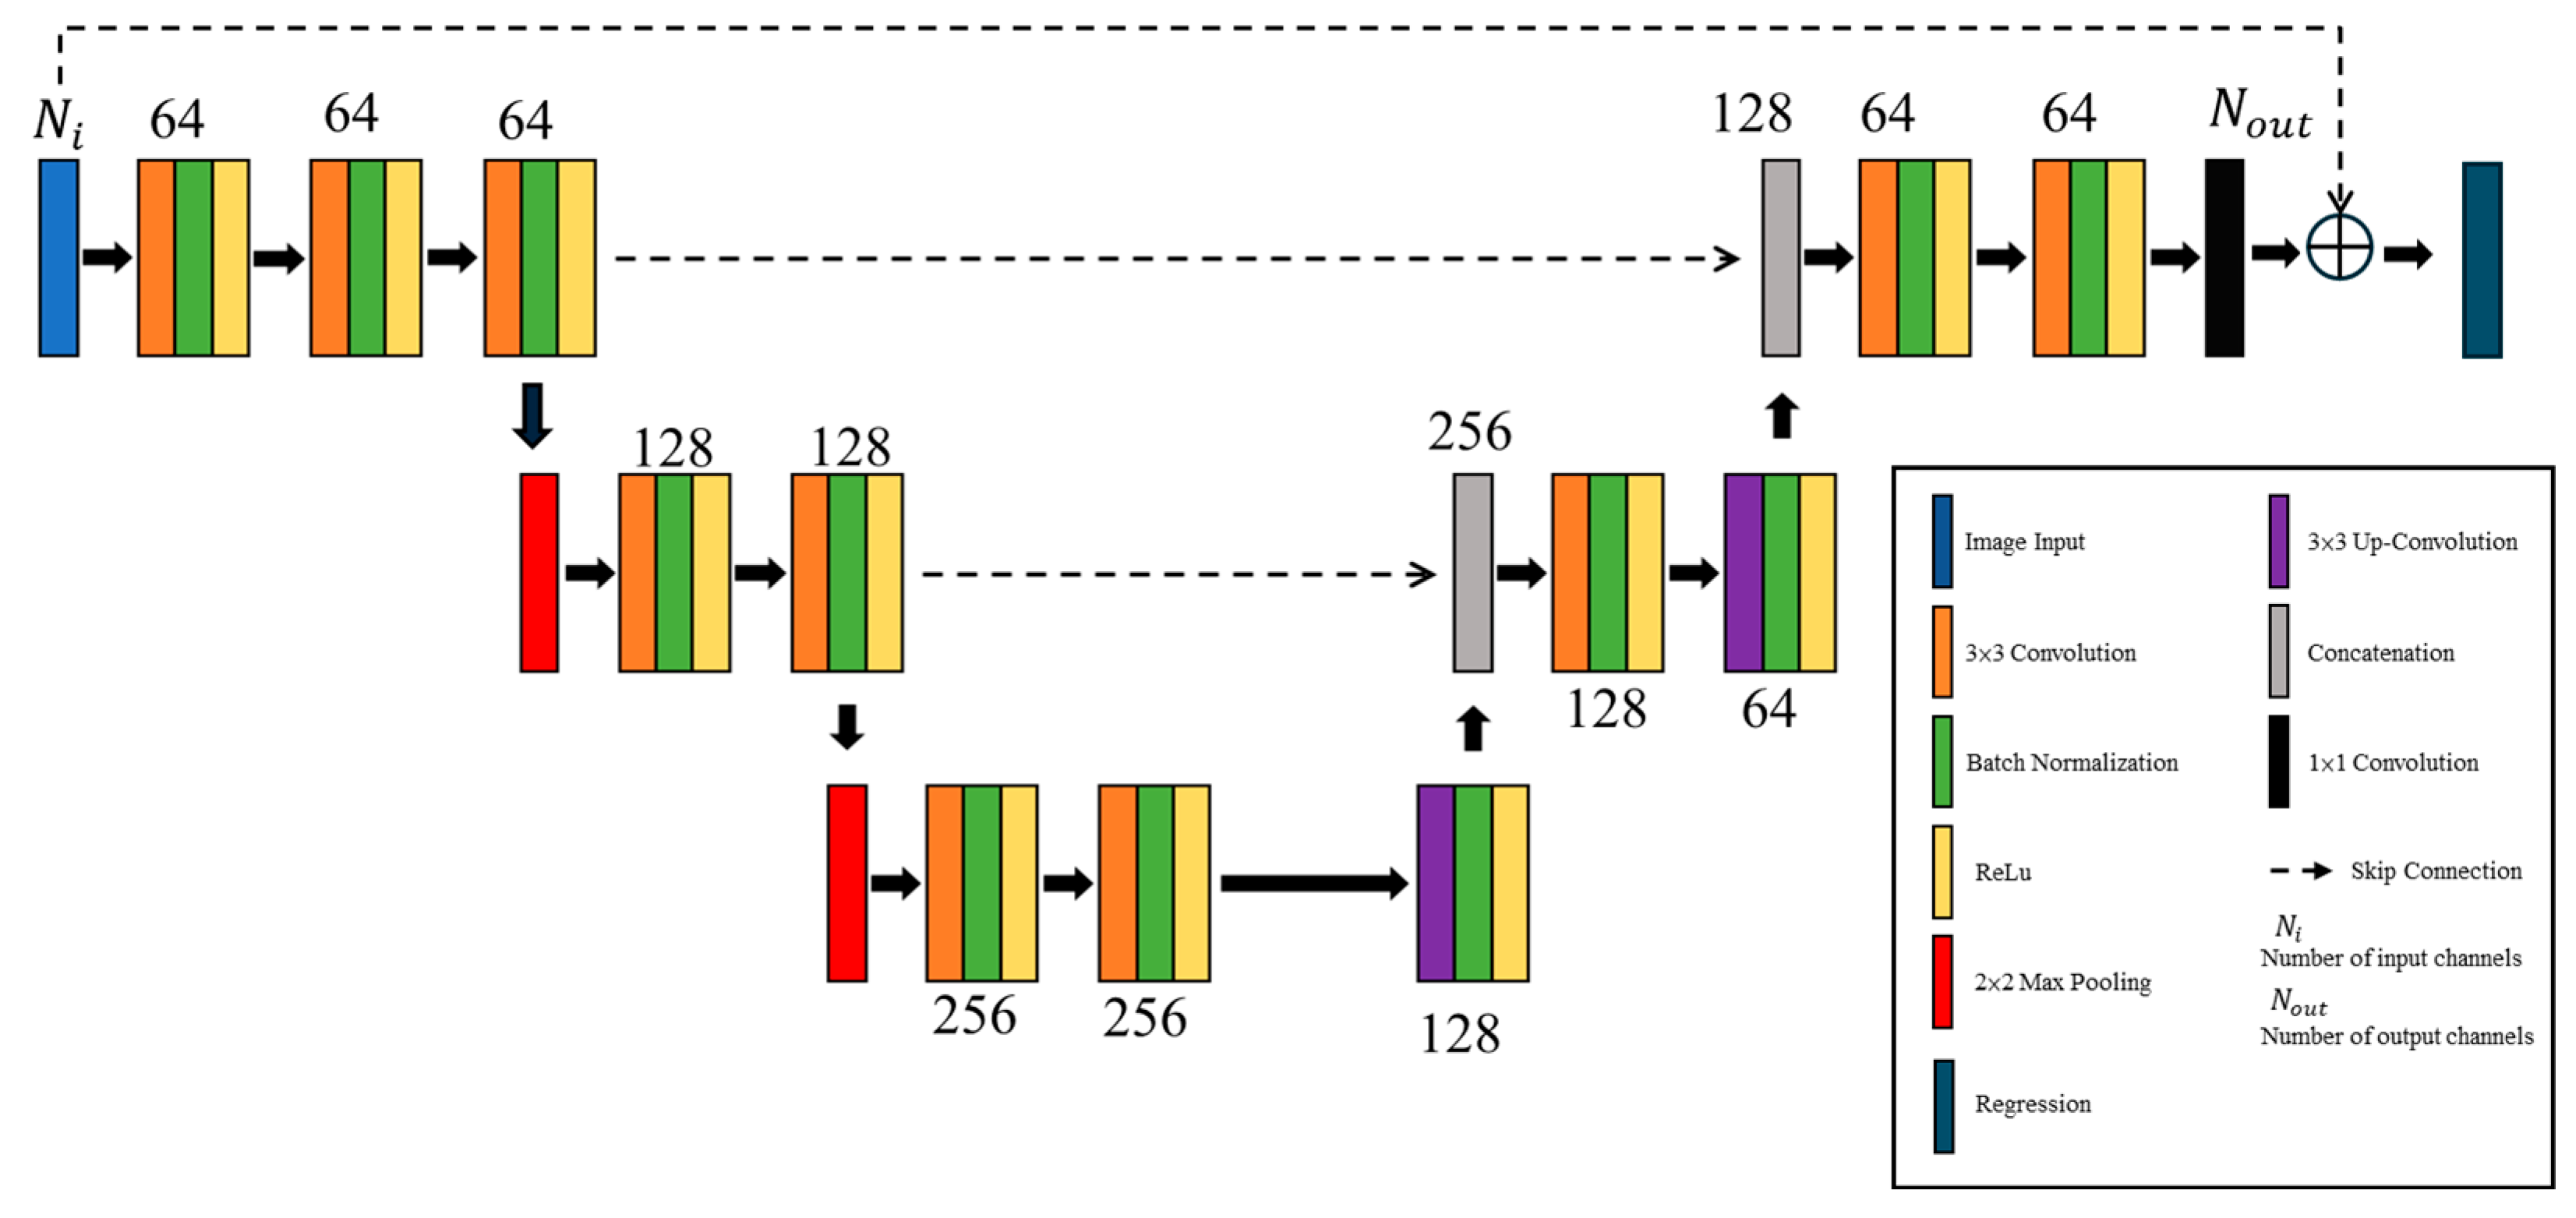
As illustrated in Figure 3, the U-Net architecture consists of two main paths:
Figure 3. U-Net architecture.
  • The input feature map is passed through a sequence of 3 × 3 convolutional layers with channel sizes of 64, 128, and 256, each followed by batch normalization and a ReLU activation. Max-pooling layers of size 2 × 2 are used to down-sample the spatial dimensions while increasing the feature depth, thereby compressing spatial information into a more abstract latent representation. This hierarchical feature extraction allows the network to capture both local fine-grained patterns and global contextual dependencies, forming a compact yet informative encoding of the input field distribution.
  • The decoder mirrors the encoder and performs up-sampling using 3 × 3 transposed convolutions (also known as up-convolutions) to progressively restore the spatial resolution. Each up-sampling block is concatenated with the corresponding encoder feature map through skip connections, facilitating the recovery of fine structural and boundary details. The lowest layer contains 256 feature channels, and the final 1 × 1 convolution maps the reconstructed features to a continuous-valued permittivity distribution, enabling quantitative electromagnetic imaging.
The minimization formula for the dielectric constant ε r by U-Net is as follows:
Ω ε ̿ r M ε ̿ r F + Λ ε ̿ r
where Ω are the U-net architectures, ε ̿ r M is the initial image by CSI, DCS, and MCS, ε ̿ r is the ground truth, and F signifies the Frobenius norm. Λ denotes the regularization function.

Advantages of the Proposed Deep Learning Framework

The integration of U-Net into the electromagnetic reconstruction pipeline offers several significant advantages:
  • The symmetric encoder–decoder structure enables U-Net to capture both global contextual features and local fine-scale variations, which are critical for accurately delineating complex permittivity distributions.
  • The skip connections retain high-frequency spatial components lost during down-sampling, allowing the decoder to reconstruct detailed spatial structures with high fidelity.
  • By stacking multiple convolutional and ReLU layers, the network effectively approximates nonlinear mappings between the input and output fields, thereby modeling multiple-scattering effects that are difficult to express analytically.
  • Thanks to parameter sharing and hierarchical feature encoding, U-Net can be efficiently trained even when only a limited number of labeled samples are available—an essential property for electromagnetic problems with constrained simulation data.
  • Unlike classification-based architectures with discrete outputs, U-Net performs pixel-wise regression, which is inherently compatible with continuous-valued quantities such as relative permittivity or conductivity.

4. Simulation Results and Numerical Analysis

This chapter deals with the simulation results and numerical analysis. We create a simulation model for the numerical analysis of scattering from dielectric objects buried in a half-space. The dielectric constant ε 2 of the half-space is 2.56, the burial depth is 0.2 m, and the incident wave frequency is 3 GHz. Our goal is to reconstruct the distribution of the relative dielectric constants of these objects. Considering that the scattered field may involve noise in real measurements, we add appropriate levels of noise into the simulation environment for investigation. The training process adopts an initial learning rate of 1 × 10 3 , with a total of 200 epochs. To improve convergence, the learning rate is reduced by a factor of 0.1 every 70 epochs. The Adam optimizer and root mean squared error loss function were used, with a batch size of eight. We utilized the obtained CSI, MCS, and DCS images to create the neural network database, each consisting of permittivity distributions and corresponding scattered-field data generated under multiple frequencies and random noise levels to enhance generalization. The dataset was divided into 80% training data, 10% validation data, and 10% testing data, randomly selected to avoid bias. To quantitatively evaluate the reconstruction performance of the trained networks, we define the Structural Similarity Index (SSIM) as follows:
S S I M = 2 μ y ~ μ y + C 1 2 σ y ~ y + C 2 μ y ~ 2 + μ y 2 + C 1 σ y ~ 2 + σ y 2 + C 2
The Normalized Root Mean Square Error (NRMSE) is defined as follows:
N R M S E = 1 M t i = 1 M t ε r i ε r α i F ε r i F

4.1. TM Case

In this simulation, the dielectric constants are set at six. A total of 32 transmitters and 32 receivers are deployed with different Gaussian noise. Assuming that the scatterers have 10 different dielectric coefficient distributions and can be located at any of 50 distinct positions in the field of interest, a total of 500 images (10 × 50) are generated. The dataset is divided into 80% for training and the remaining 20% for testing. The initial images are evaluated using 10 iterations of CSI, three iterations of DCS, and three iterations of MCS with U-Net.

4.1.1. Dielectric Coefficient at Six, with Different Noise for TM Case

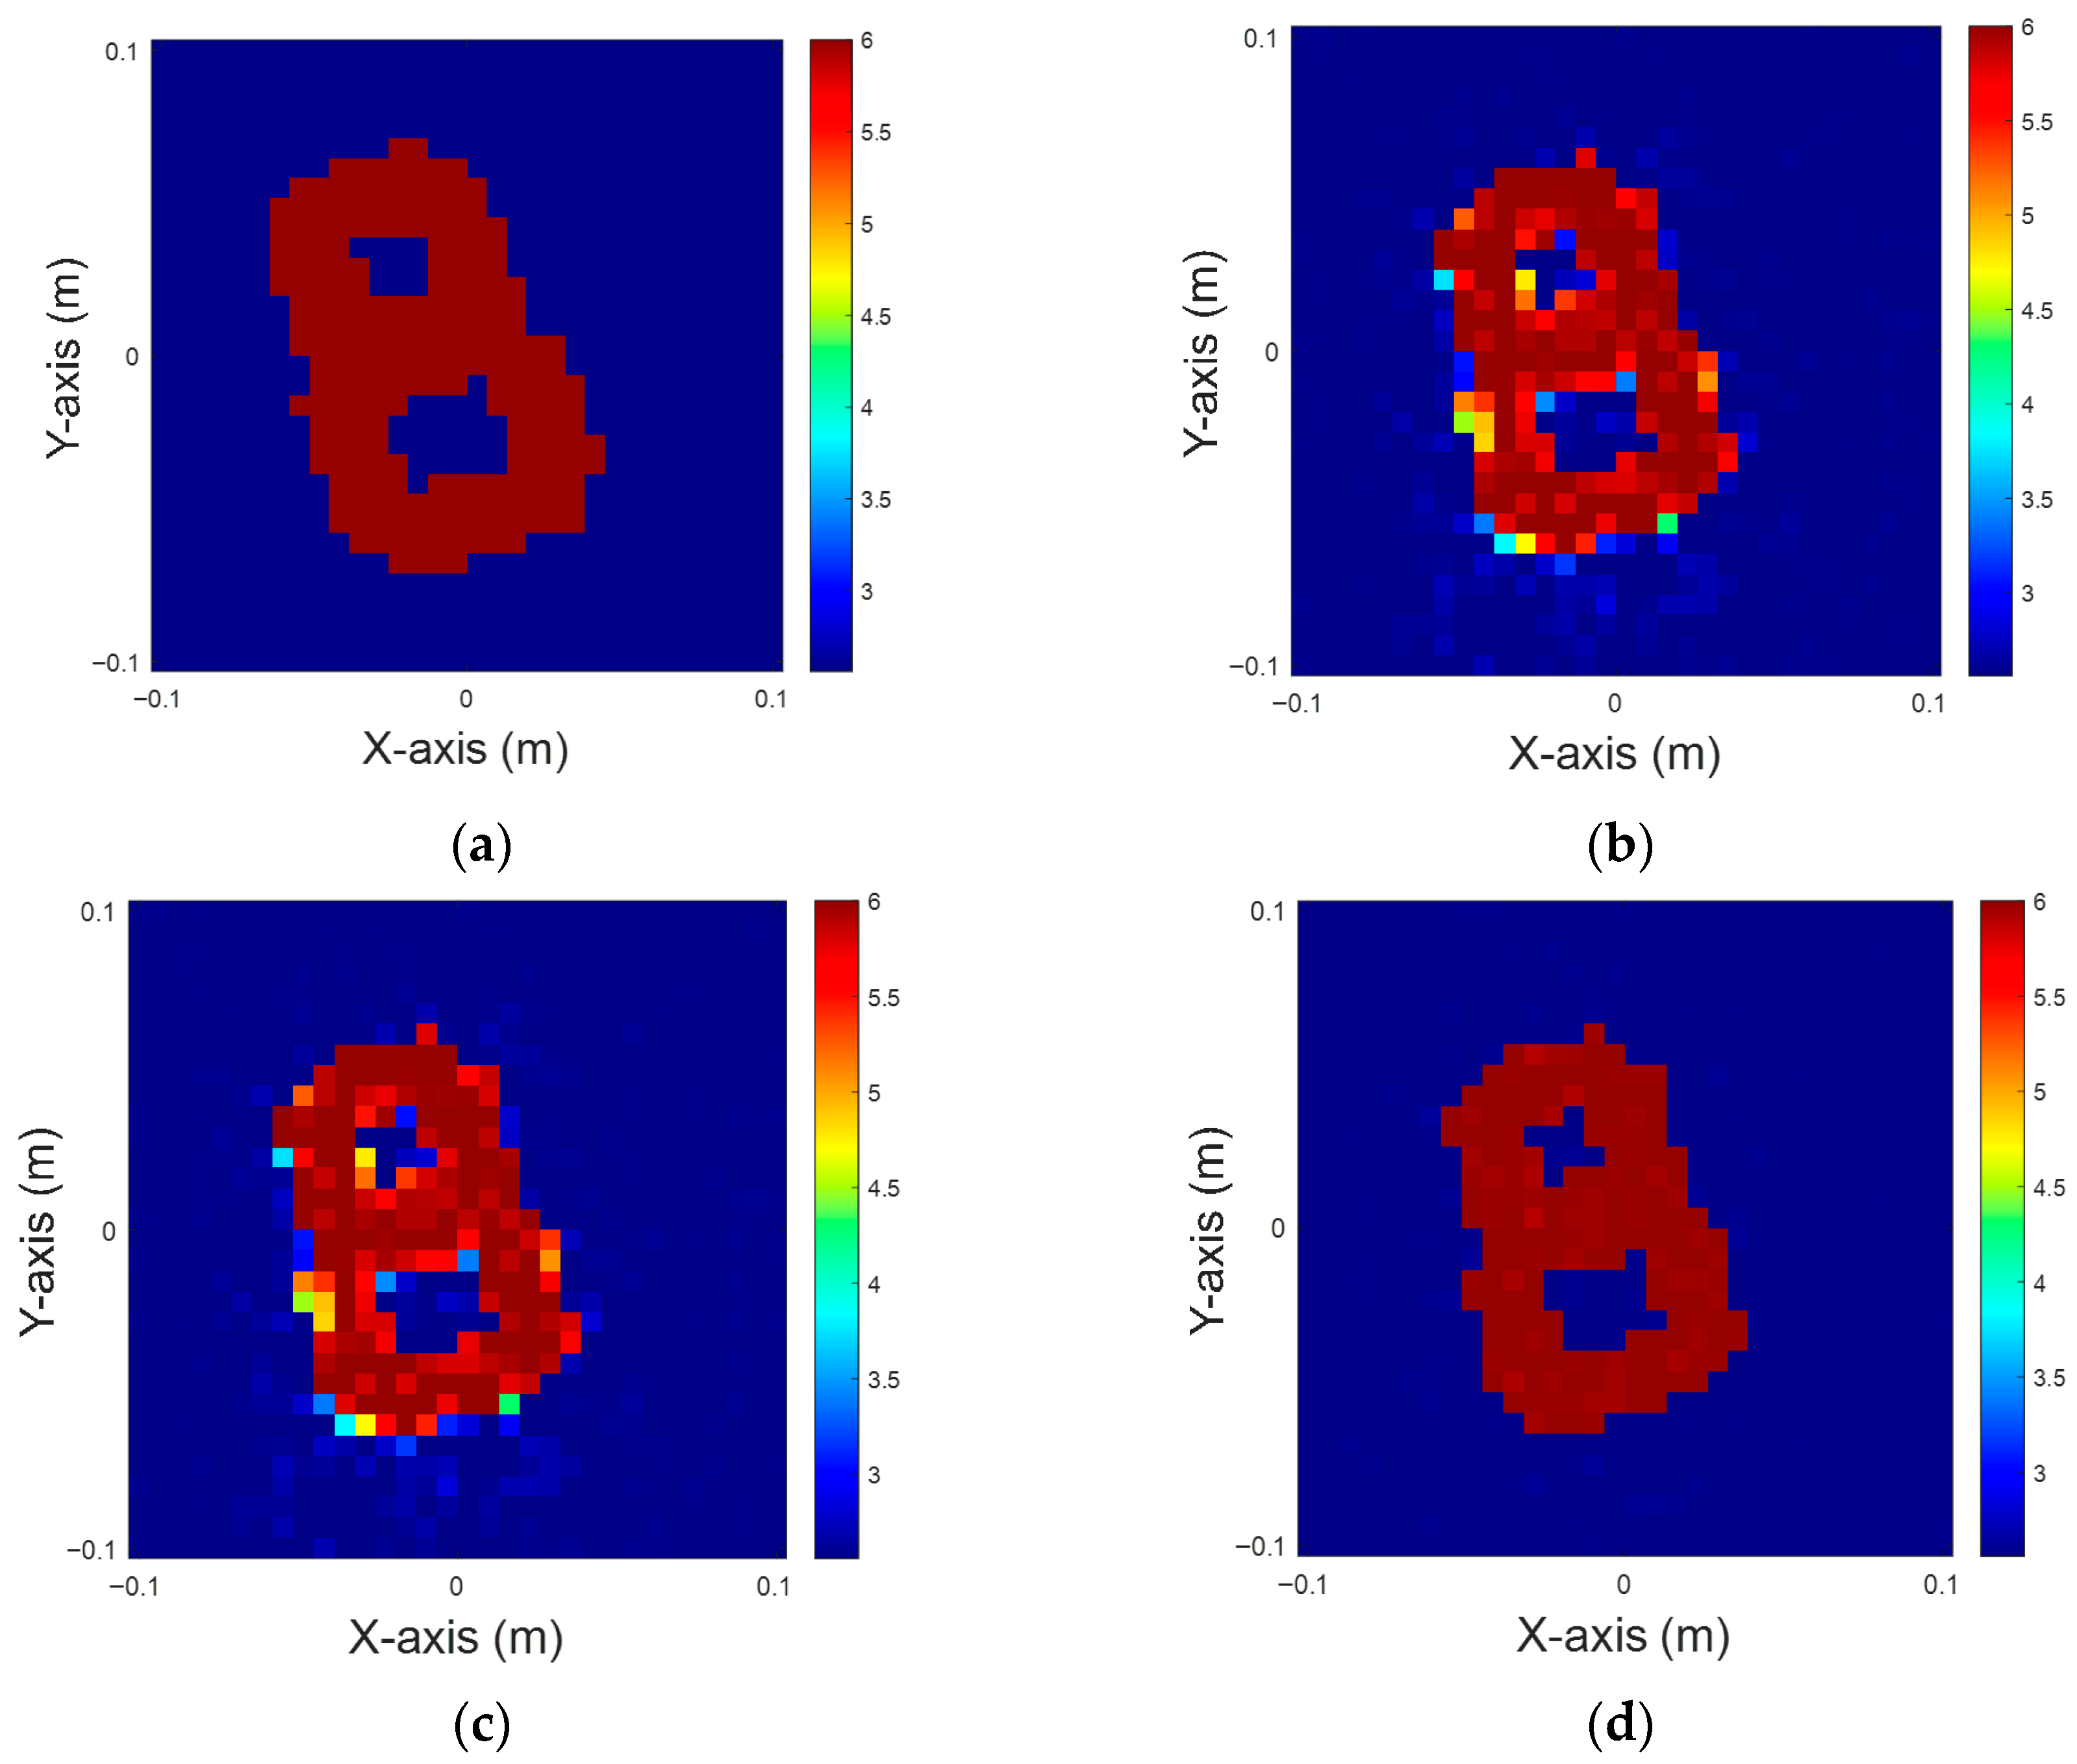
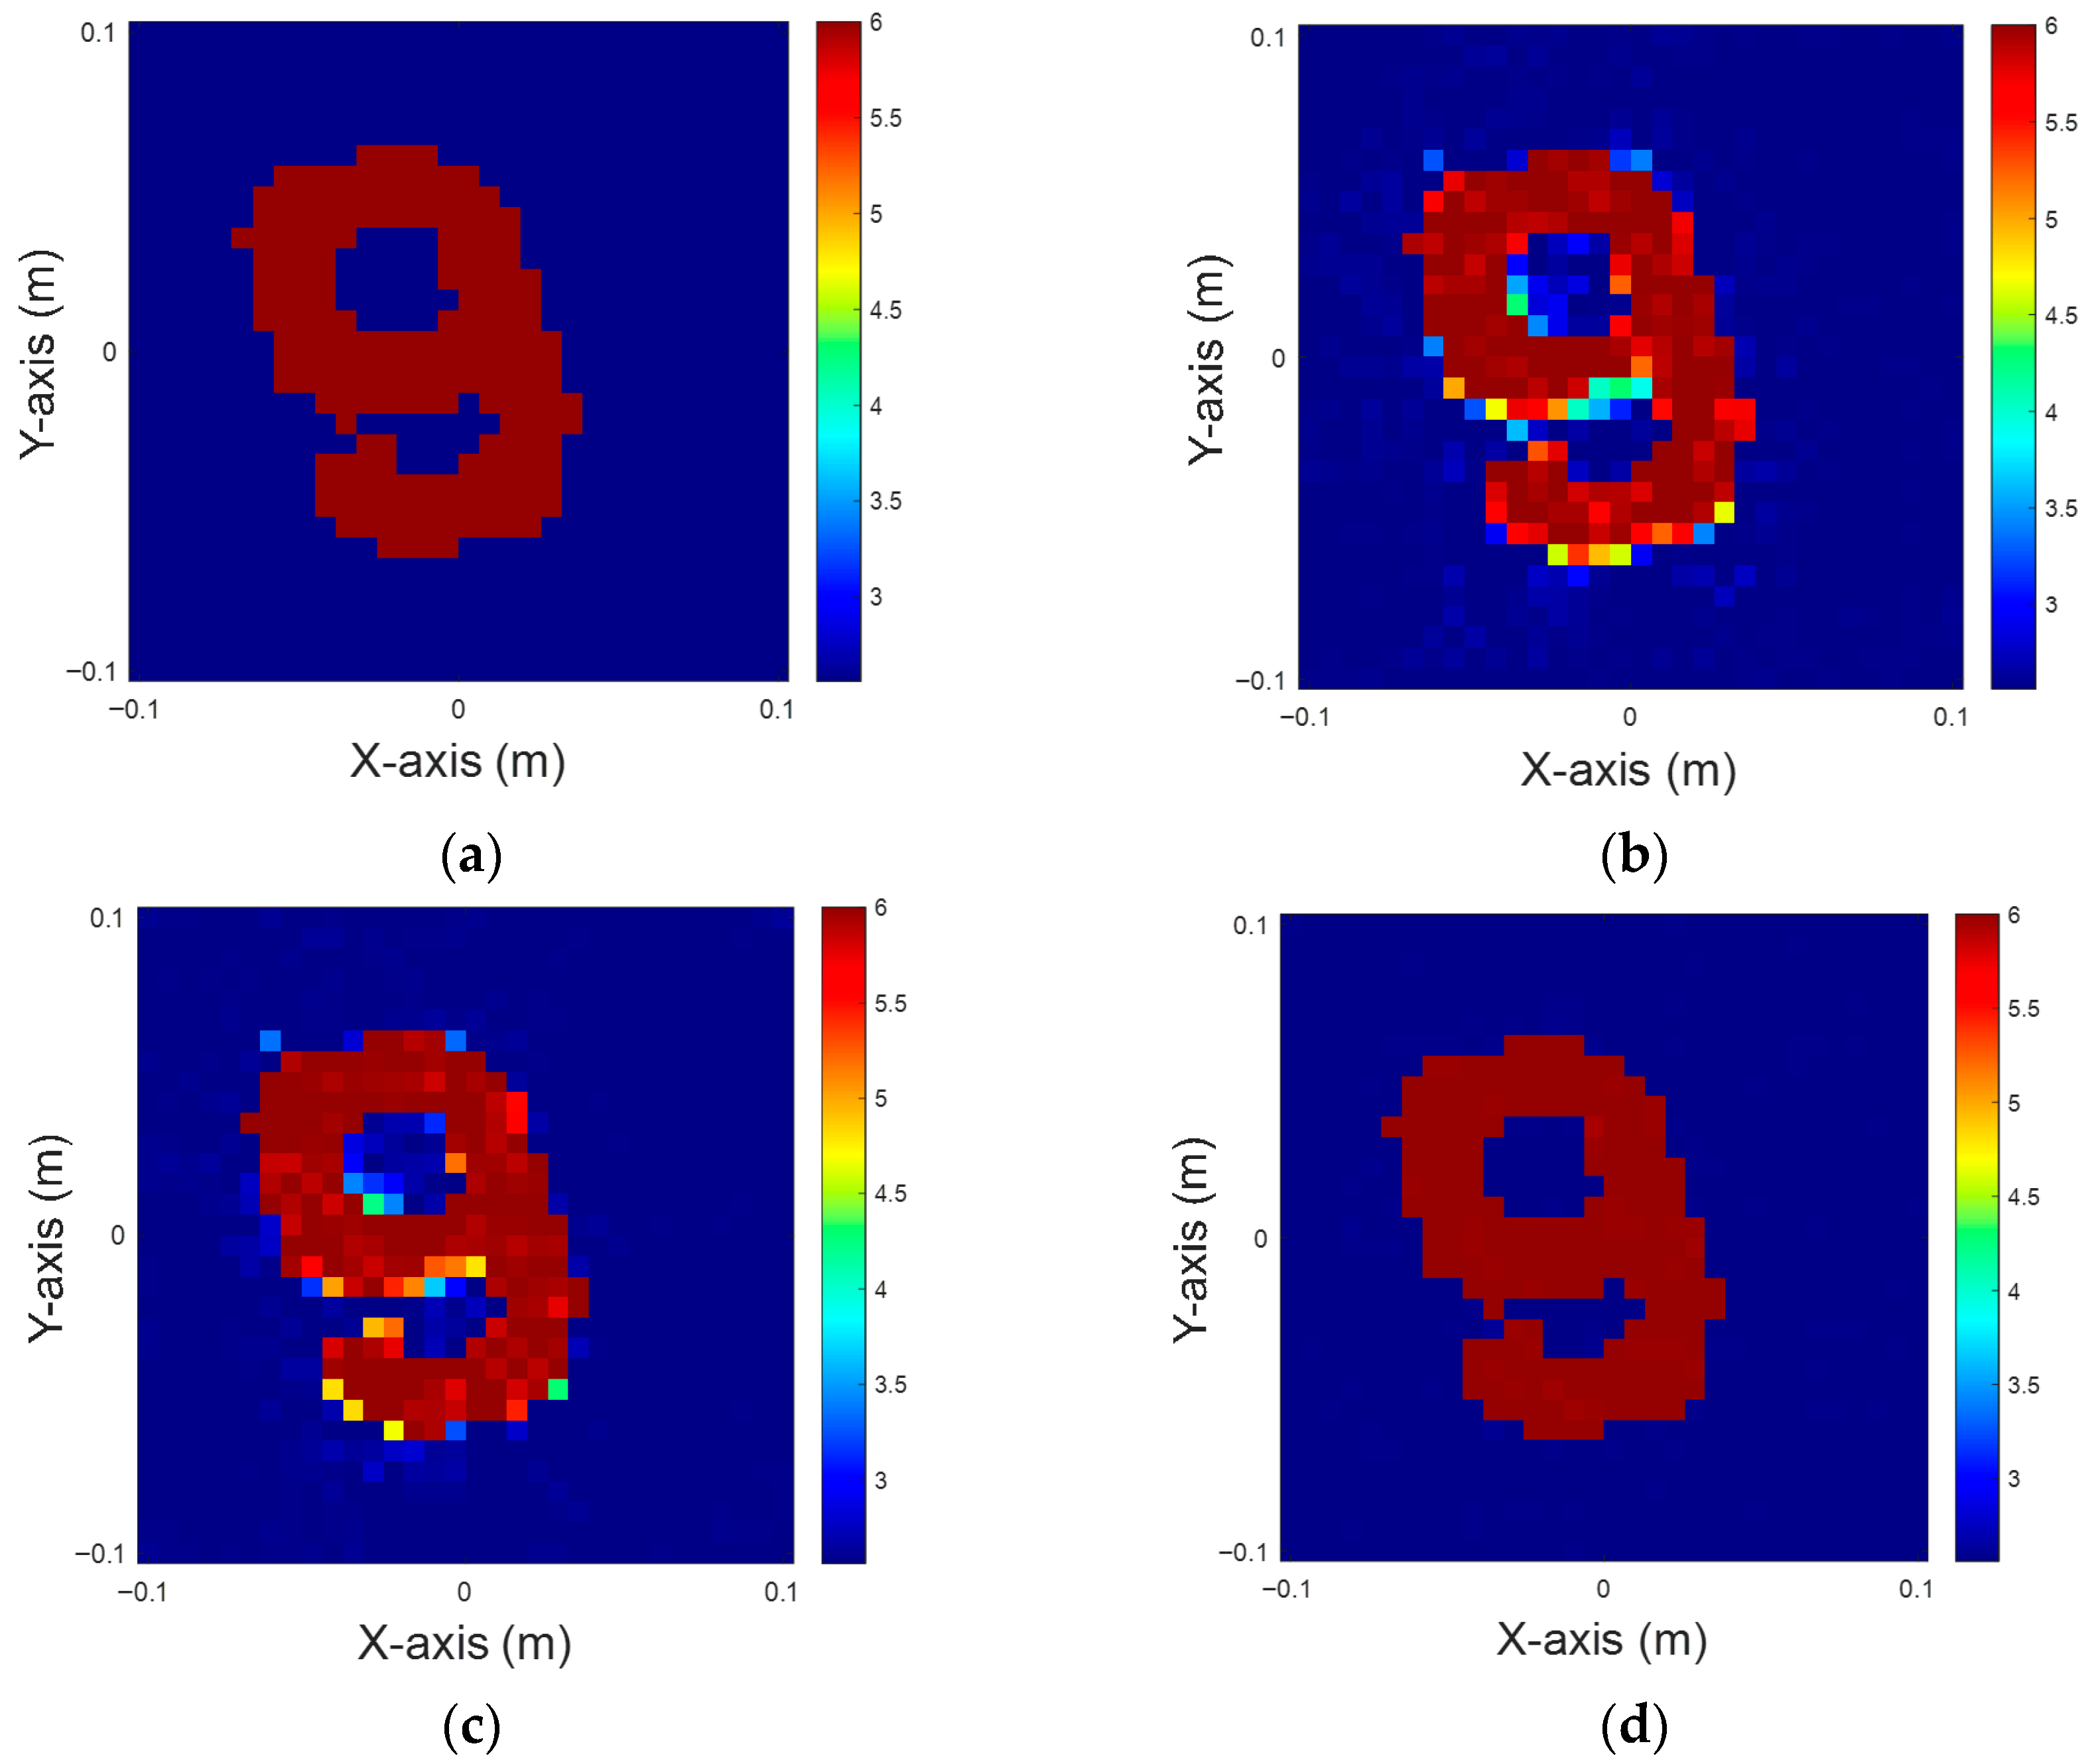
The recovered images for the 5% noise simulation are shown in Figure 4. Table 1 gives the corresponding NRMSEs and SSIMs of the restored images. According to our observation, all three methods can roughly restore the structure of the original digit “8”. However, the result of CSI with U-Net in Figure 4b shows more noises and blurred edges, which results in a lack of clarity of the target contour, while the result of DCS with U-Net in Figure 4c shows a slight improvement, although some reconstruction errors remain. In contrast, the initial image generated by MCS and further processed by U-Net in Figure 4d can reconstruct the complete contour and internal structure more accurately, and significantly reduce the influence of noise, which is closer to the ground truth shown in Figure 4a. Simulations indicate that the combination of MCS and U-Net provides better reconstruction quality and stability.
Figure 4. Dielectric coefficient at six, with 5% noise. (a) Ground truth. (b) CSI, 10 iterations with U-Net. (c) DCS, three iterations with U-Net. (d) MCS, three iterations with U-Net.
Table 1. NRMSE and SSIM for dielectric constants at six, with 5% noise.
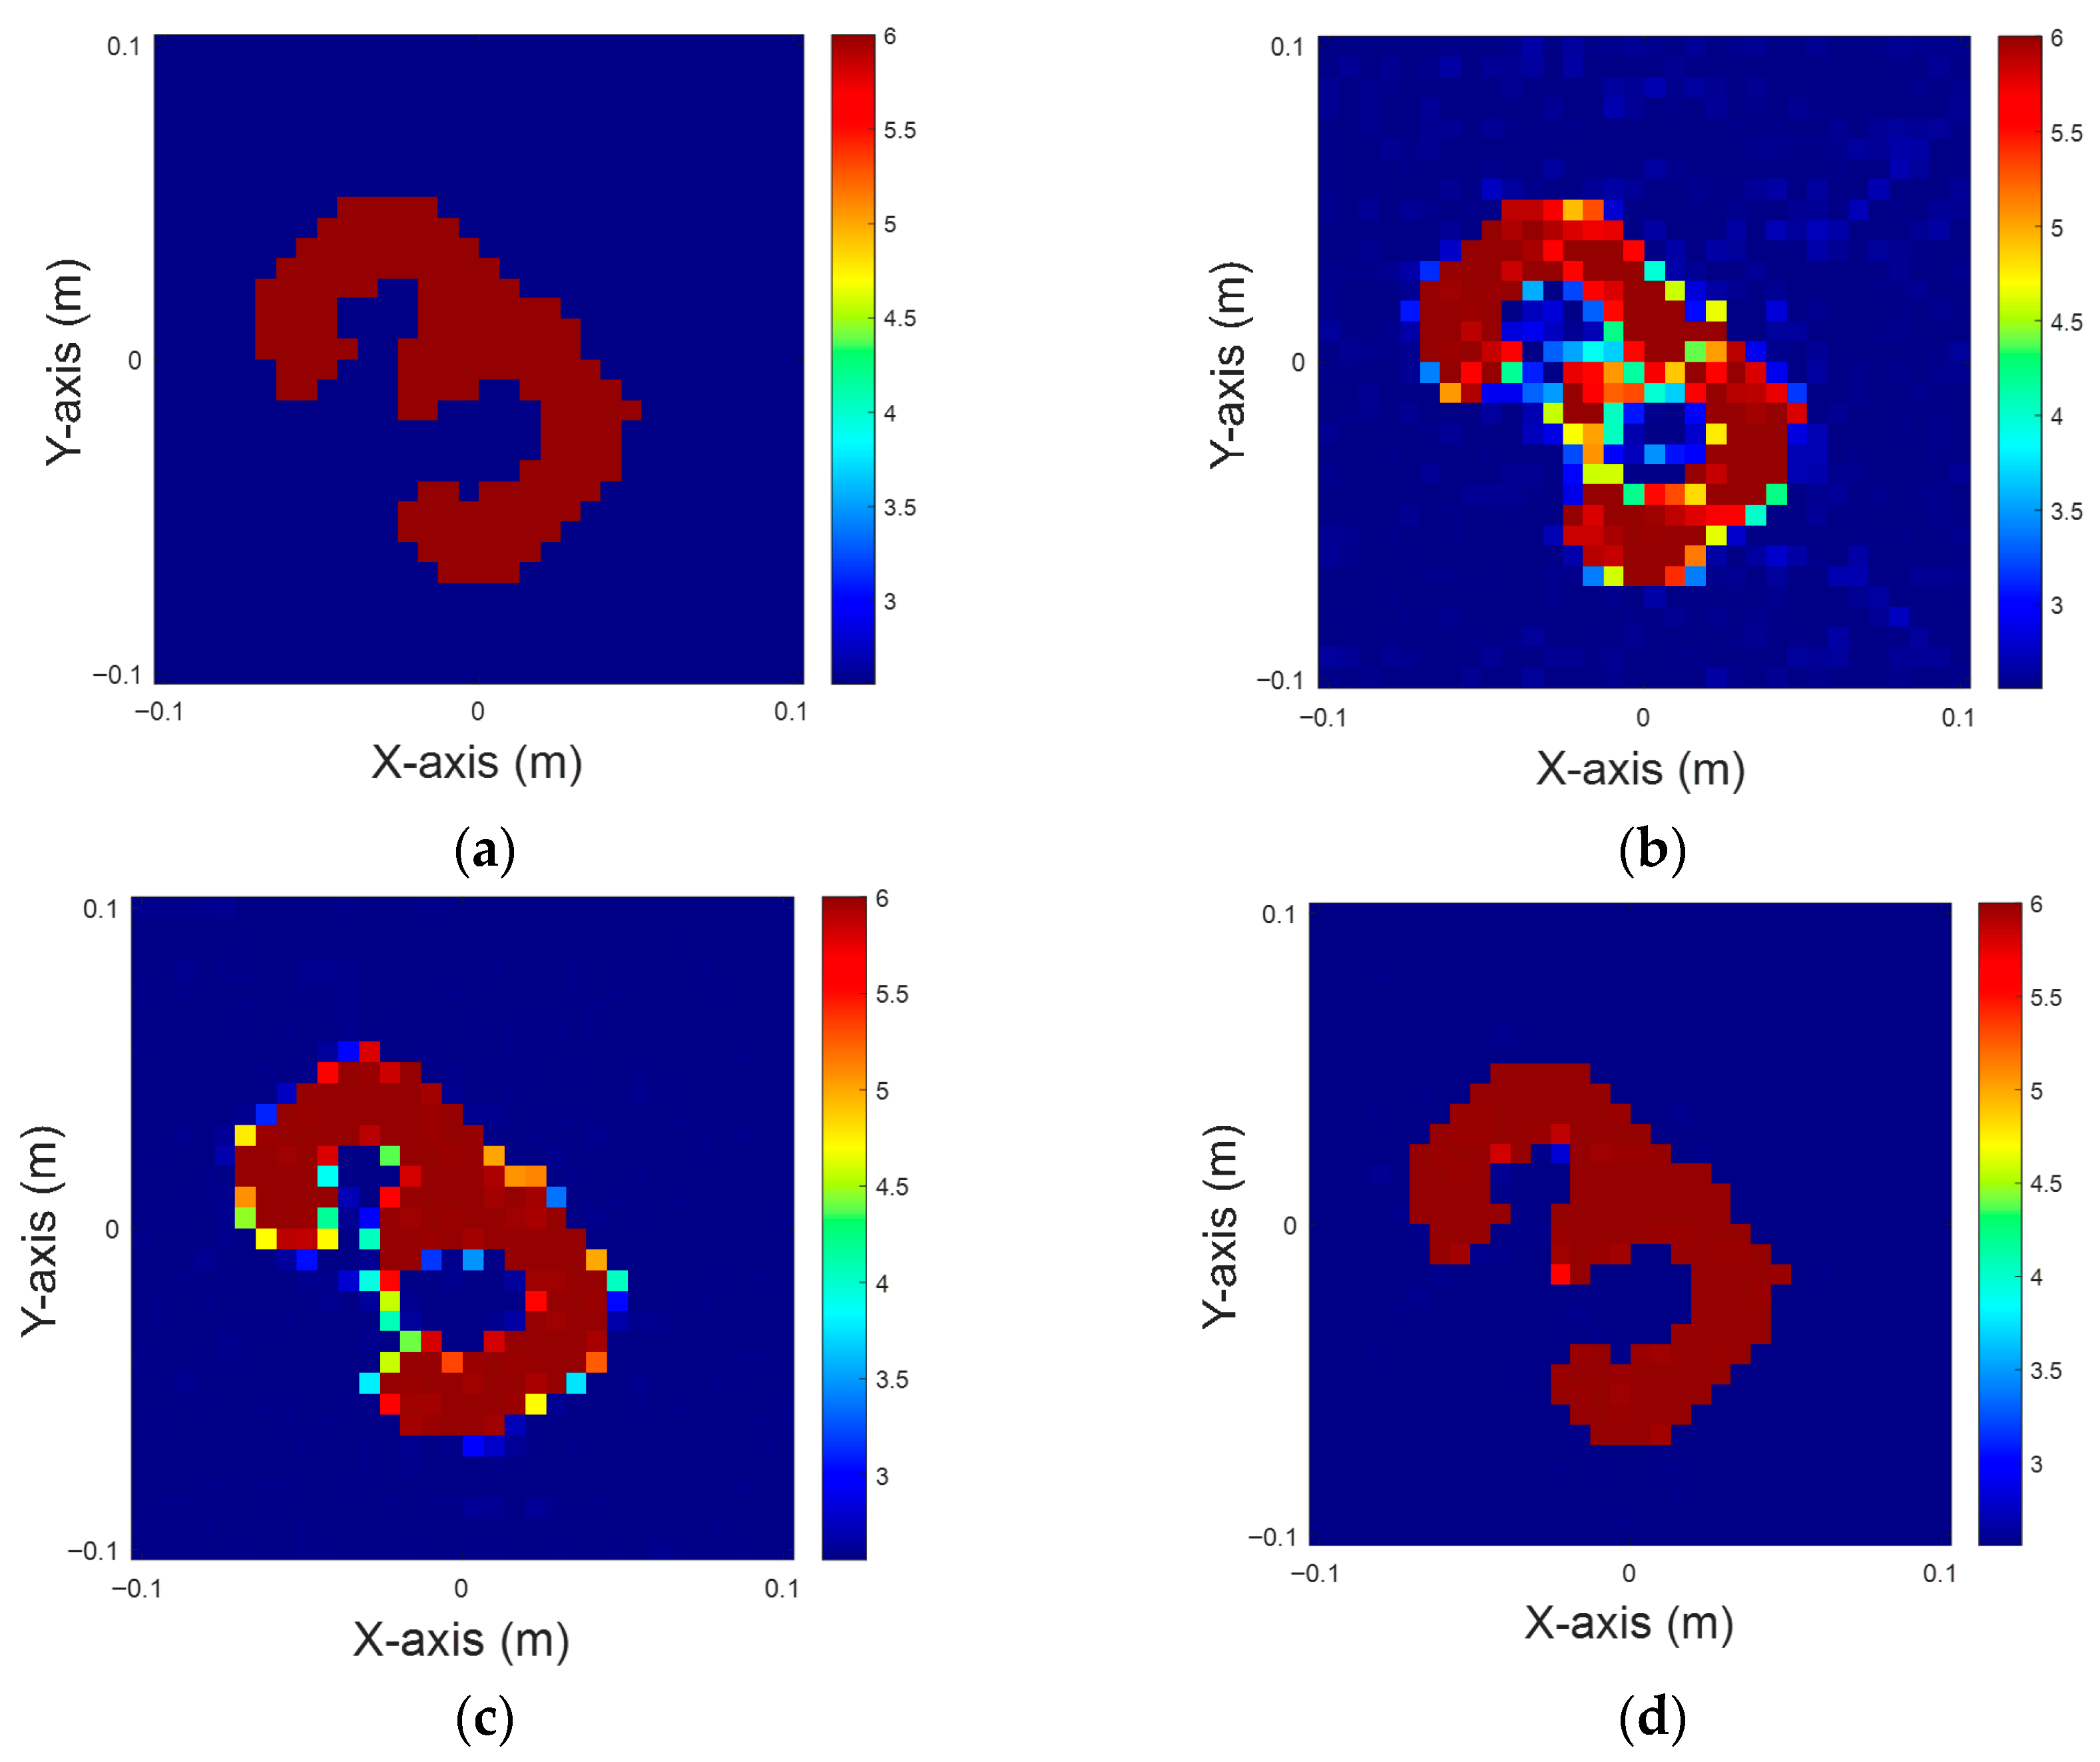
In this simulation, noise is increased to 10%. It is observed that under 10% Gaussian noise interference, the proposed methods are still able to reconstruct the main structure of the target roughly. As shown in Figure 5b, the CSI reconstruction using U-Net is more susceptible to noise, with blurred edges and obvious distortion of the internal structure. However, the image from DCS with U-Net in Figure 5c remains relatively stable, with a clearer overall contour, although there are some localized noises and discontinuities at the edges. In contrast, the reconstruction result of MCS combined with U-Net in Figure 5d shows the best performance in terms of image continuity and noise suppression, which not only recovers the complete digital contour, but also effectively preserves the details of the internal structure of the target. The NRMSEs and SSIMs of the recovered images are shown in Table 2.
Figure 5. Dielectric coefficient at six, with 10% noise. (a) Ground truth. (b) CSI, 10 iterations with U-Net. (c) DCS, three iterations with U-Net. (d) MCS, three iterations with U-Net.
Table 2. NRMSE and SSIM for a dielectric constant at six, with 10% noise for TM case.
The following simulation involves 15% noise. It is observed that the image reconstruction quality of each method is significantly degraded with the addition of 15% Gaussian noise. The result of combining CSI with U-Net in Figure 6b shows significant noise and reconstruction errors, with the target contour severely deformed and the internal structure almost unrecognizable. The reconstructed image from DCS with U-Net in Figure 6c shows a slight improvement, where some digit shapes are barely recognizable; however, the result still lacks details and has unclear boundaries. In contrast, MCS with U-Net in Figure 6d maintains a more stable reconstruction under this high noise condition. The overall contour and dielectric distribution are still recognizable, although there are some blurring and distortions in the image. The NRMSEs and SSIMs of the recovered images are presented in Table 3.
Figure 6. Dielectric coefficient at six, with 15% noise. (a) Ground truth. (b) CSI, 10 iterations with U-Net. (c) DCS, three iterations with U-Net. (d) MCS, three iterations with U-Net.
Table 3. NRMSE and SSIM for a dielectric constant at six, with 15% noise for TM case.
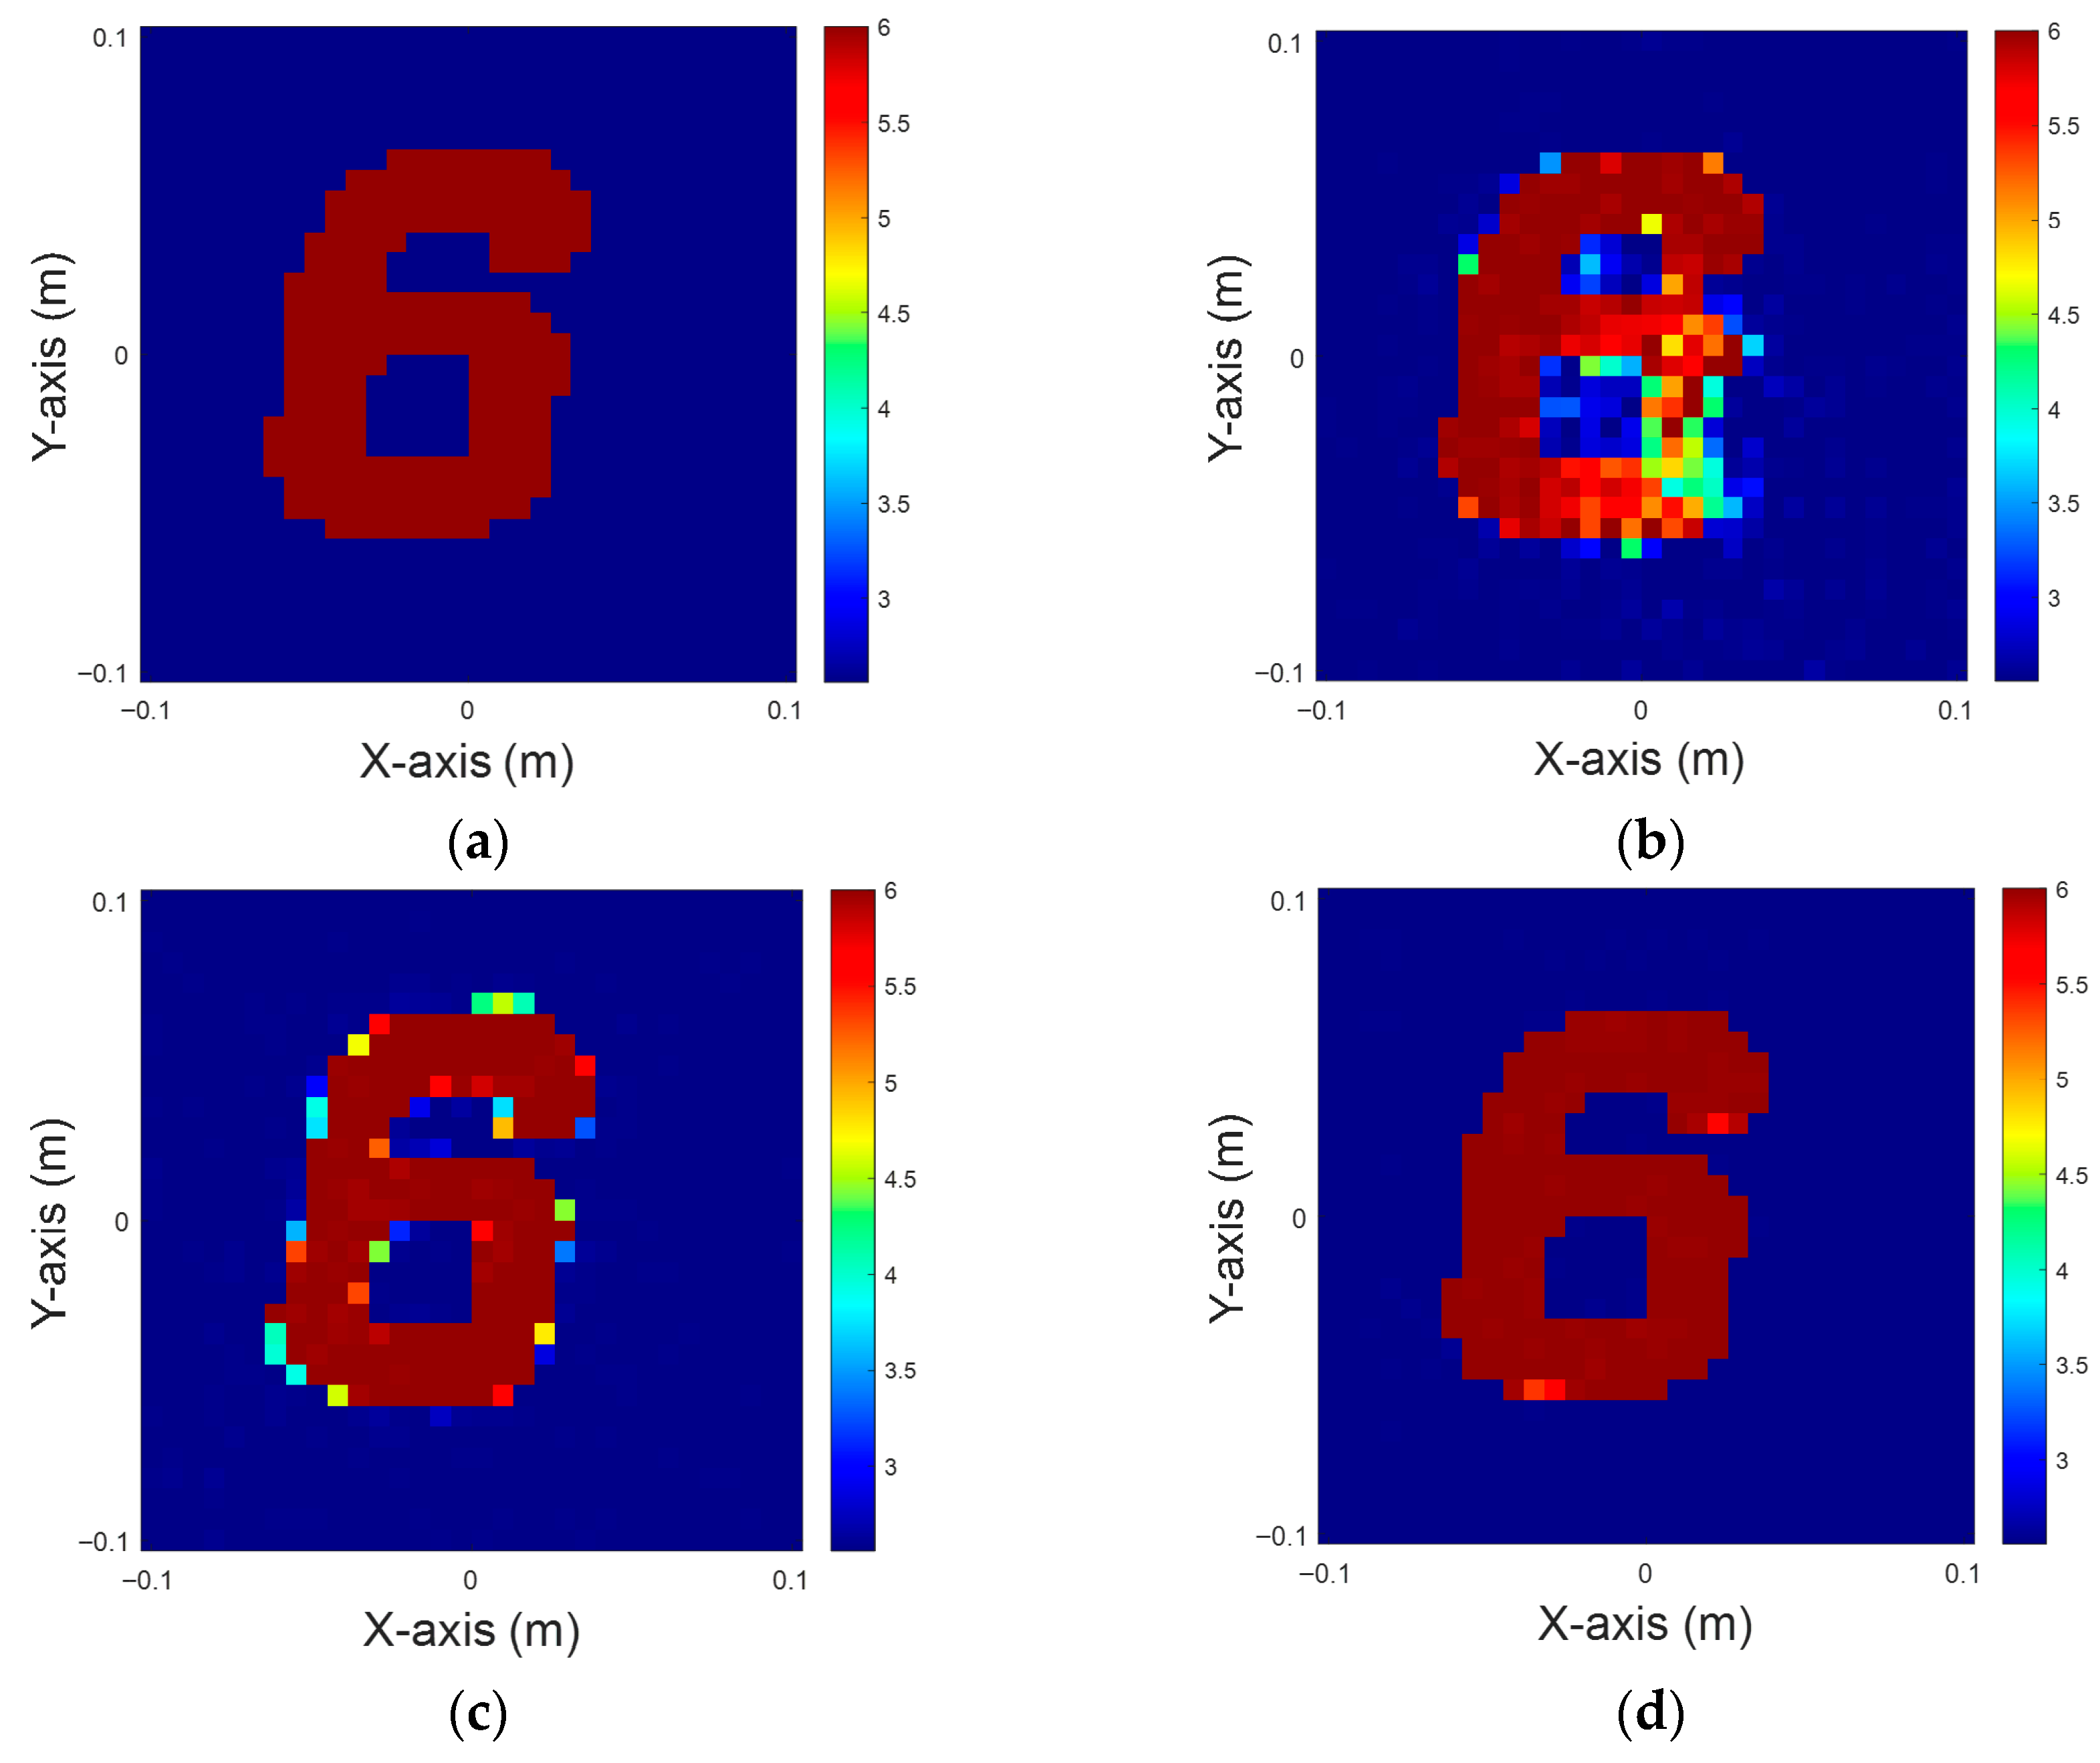
The noise level is raised to 20% in this simulation for further evaluation. It is observed that the reconstruction quality is significantly affected under the extreme condition of up to 20% Gaussian noise. The reconstruction result using CSI and U-Net in Figure 7b shows severe distortion and noise disturbance, with a large number of erroneous reconstructed areas in the image, making the shape of the original digit “6” almost unrecognizable. The shape of the original digit “6” is also hardly recognizable in the image shown in Figure 7c, which is reconstructed from DCS using U-Net. Although some of the contours can be recognized, the edges of the image are fragmented and some detail is lost. In contrast, MCS with U-Net, as shown in Figure 7d, demonstrates relatively stable reconstruction capability even under high noise and retains the outer contour and inner structure more completely, which exhibits a closer match to the true distribution displayed in Figure 7a. The NRMSEs and SSIMs of the recovered images are presented in Table 4.
Figure 7. Dielectric coefficient at six, with 20% noise. (a) Ground truth. (b) CSI, 10 iterations with U-Net. (c) DCS, three iterations with U-Net. (d) MCS, three iterations with U-Net.
Table 4. NRMSE and SSIM for a dielectric constant at six, with 20% noise for TM case.
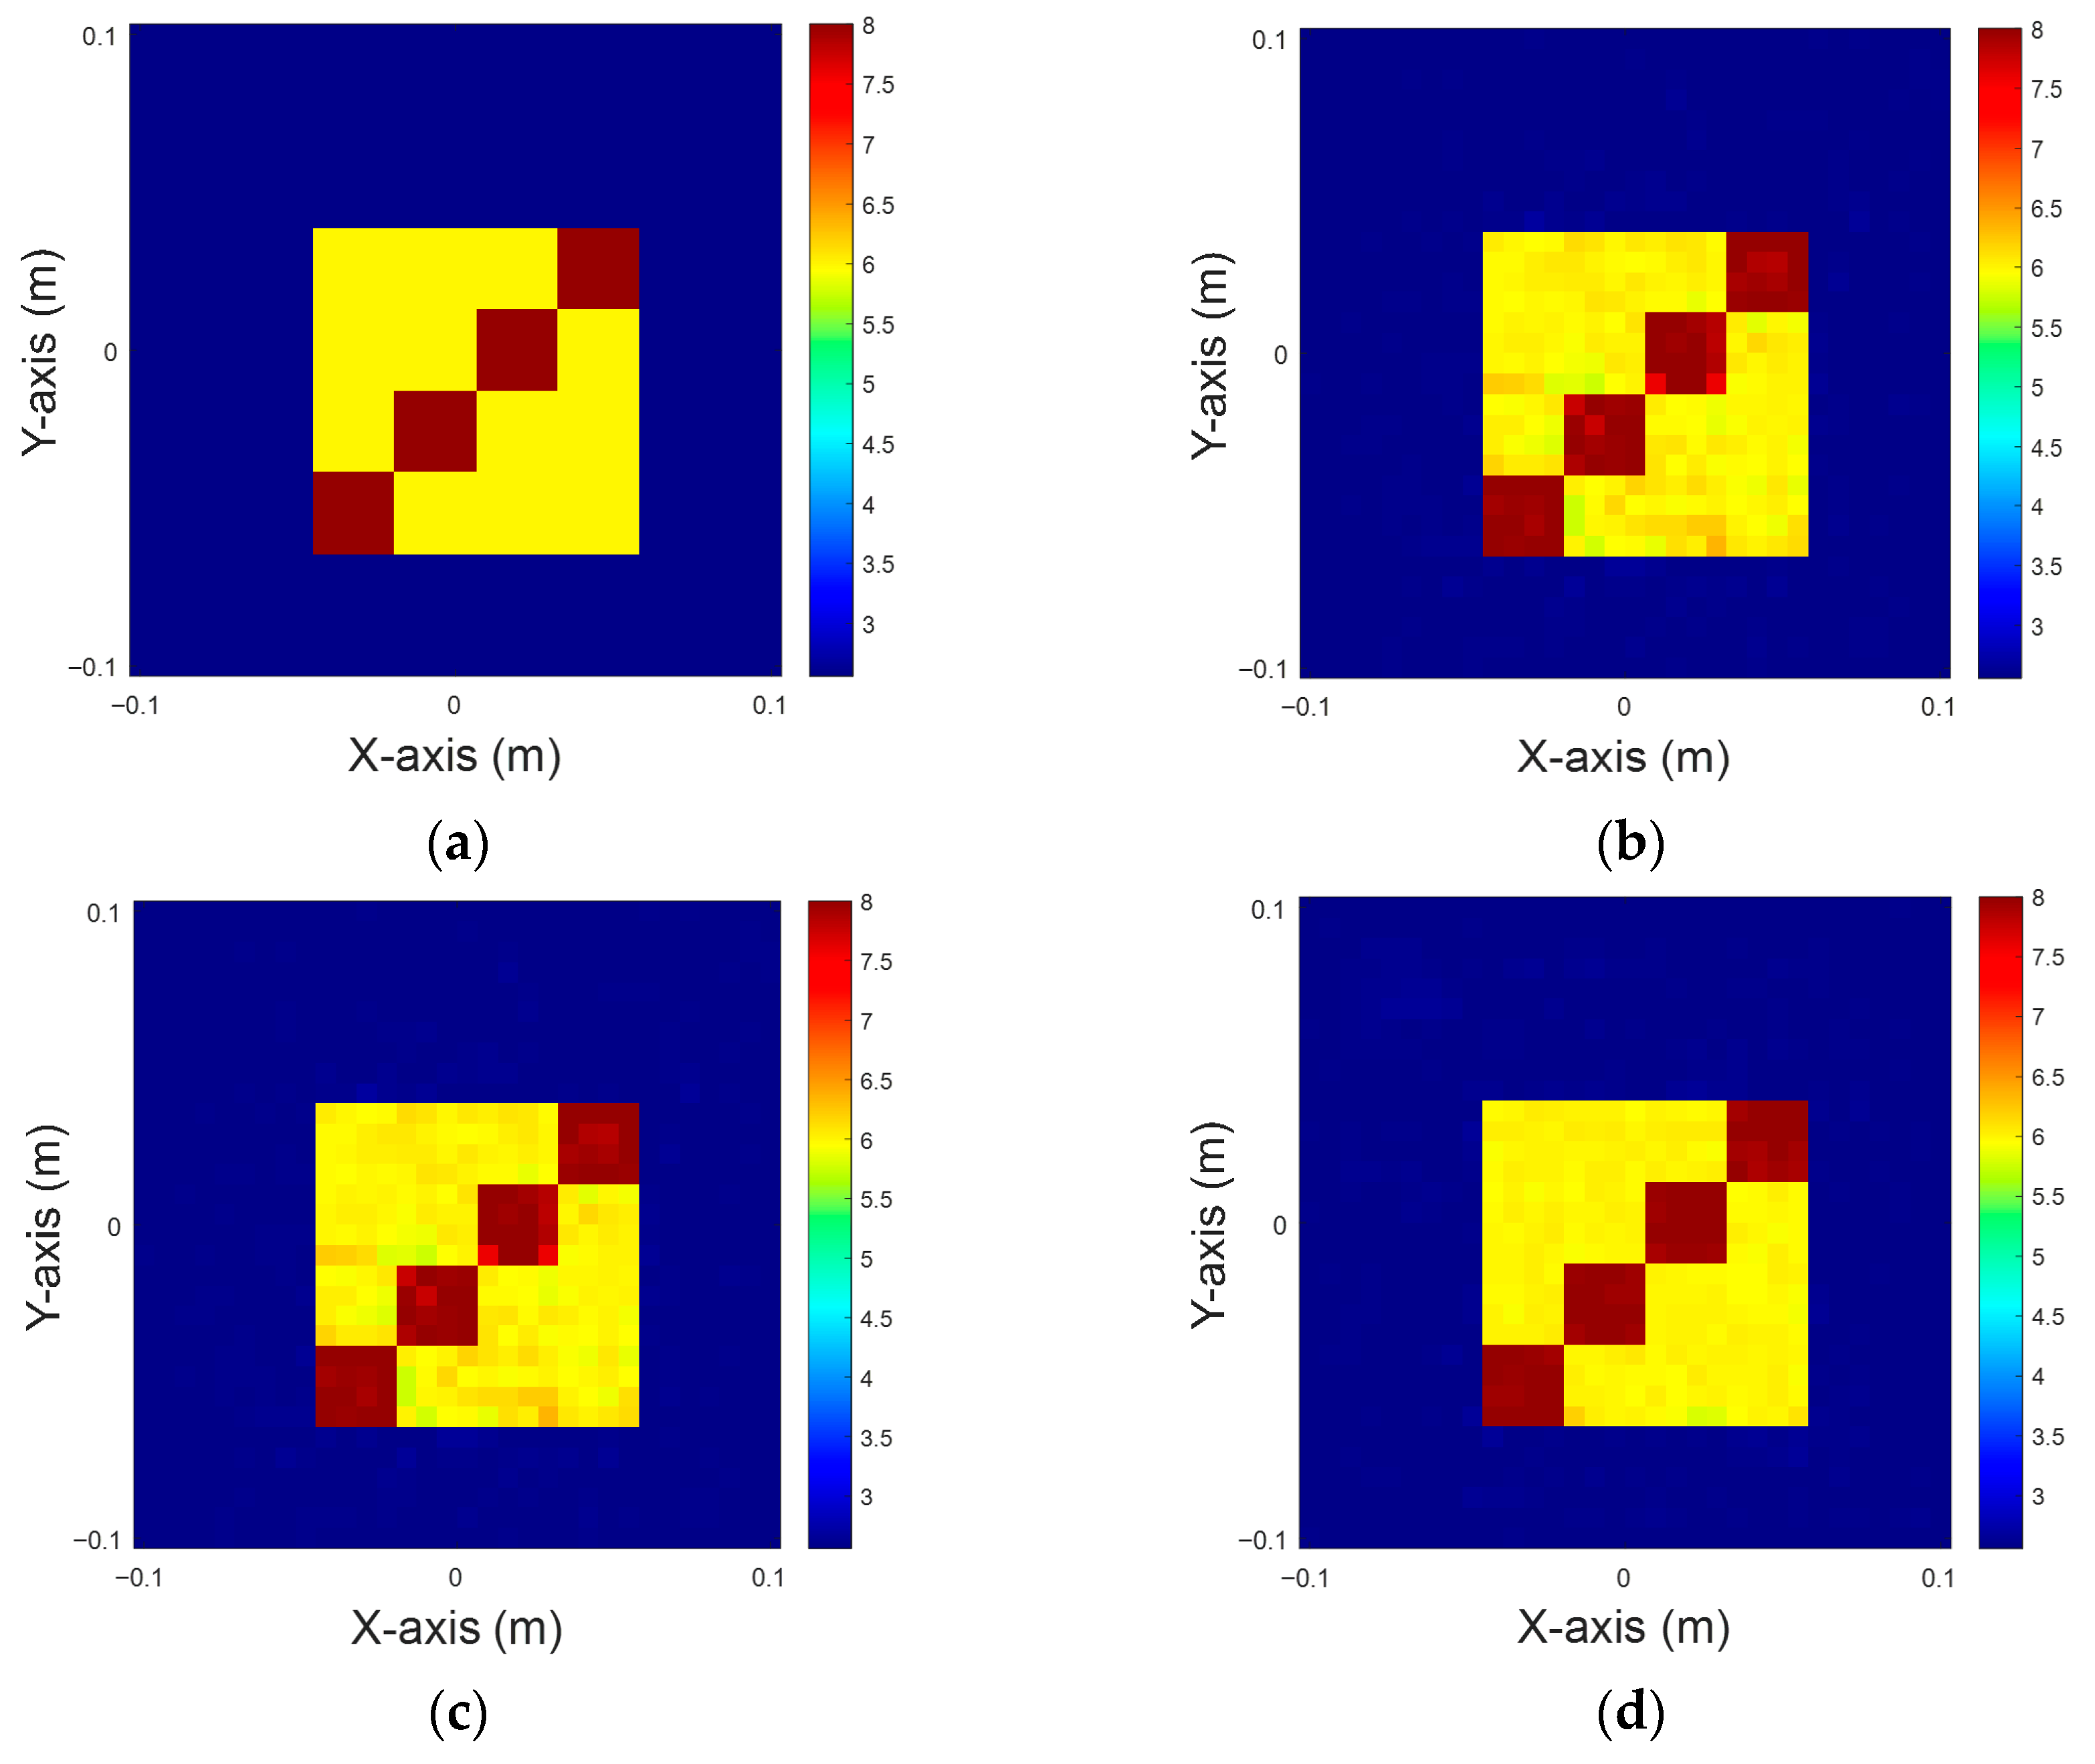
In the following scenarios, we attempt to compare three methods—CSI, DCS, and MCS—each combined with U-net, to reconstruct more complex dielectric distributions in the TM case. The dielectric constants are distributed between 4 and 6, 6 and 8, and 8 and 10. A total of 32 transmitters and 32 receivers are deployed with 5% Gaussian noise each. Assuming that the scatterers have 10 different dielectric coefficient distributions, and they can be located at any 50 different positions in the domain of interest. In total 500 images (10 × 50) are used for each context. The dataset is divided into 80% for training and 20% for testing. The initial images are evaluated using 10 iterations of CSI, three iterations of DCS, and three iterations of MCS, each further combined with U-Net.

4.1.2. Dielectric Constant Between 4 and 10, with 5% Noise for TM Case

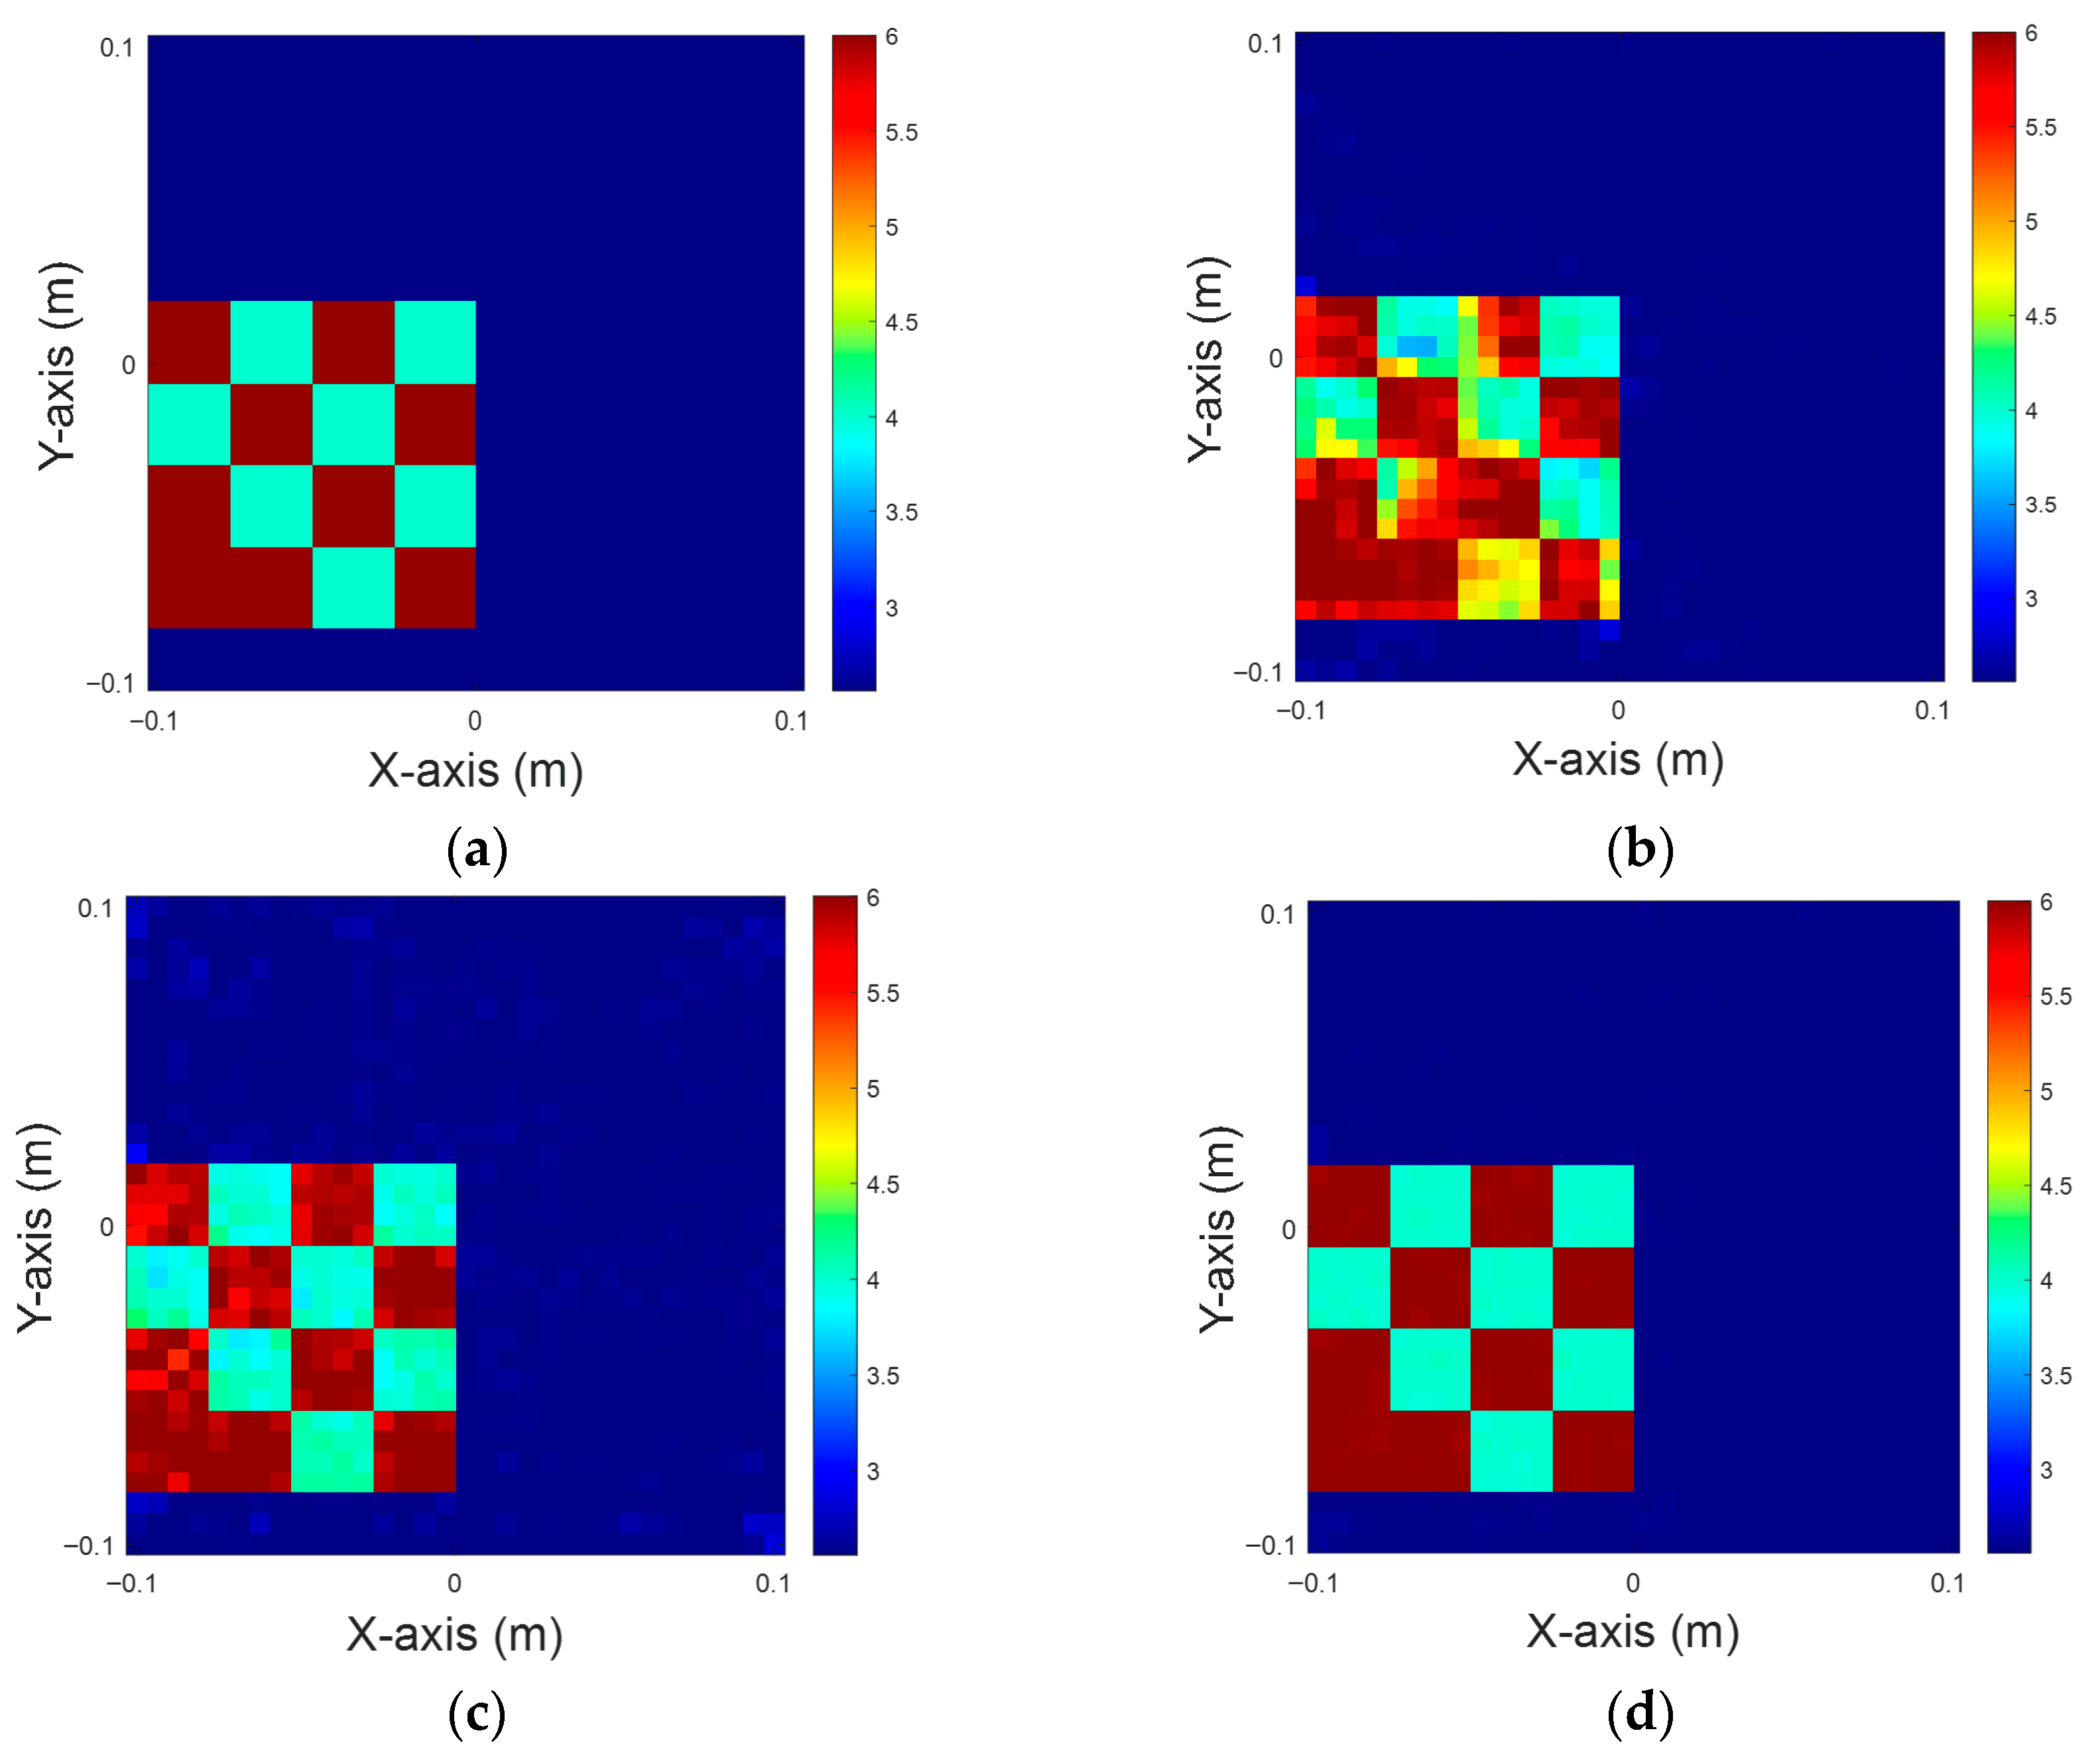
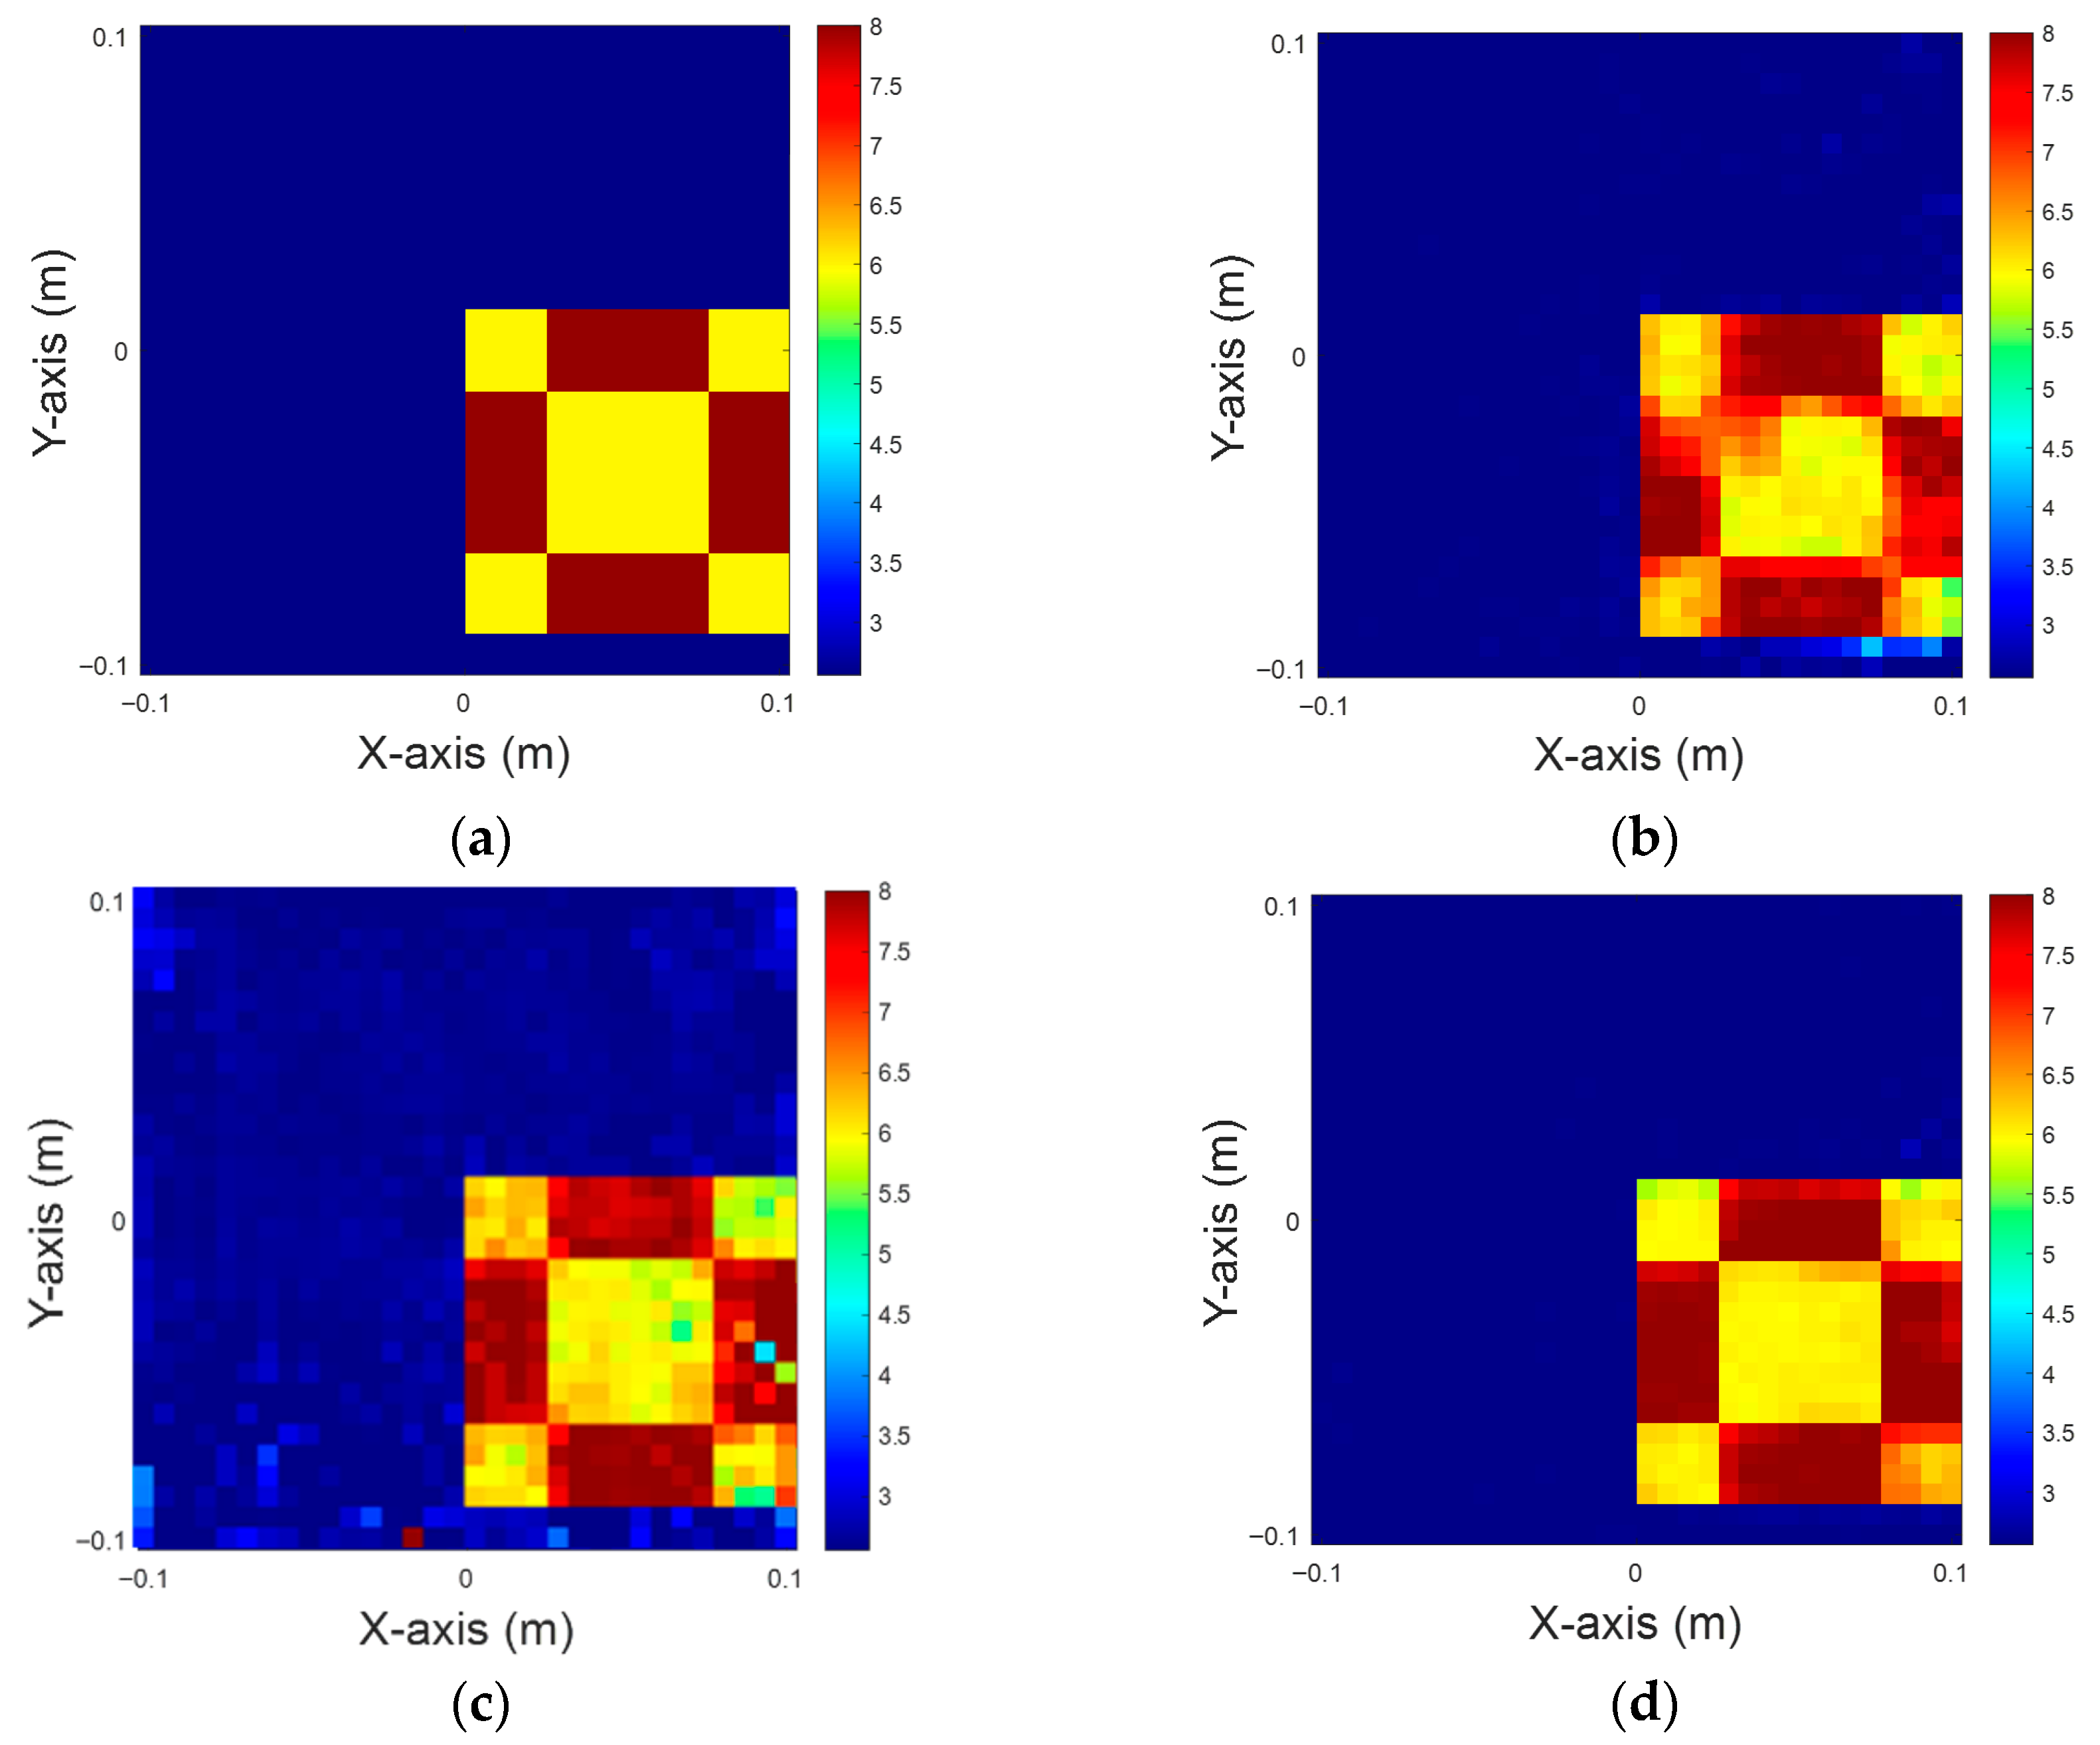
It is observed that the performance of the three methods varies significantly when reconstructing more complex dielectric distributions. The result of CSI combined with U-Net, as shown in Figure 8b, contains substantial noise and distortion, which obscure the original checkerboard structure and hamper its recognition. While the DCS with U-Net, as shown in Figure 8c, reconstructs some structural features, it still suffers from significant noise interference and contains many erroneous blocks in the image. In contrast, the MCS with U-Net in Figure 8d performs the best in maintaining a clear checkerboard pattern and restoring the details of the dielectric changes. The NRMSEs and SSIMs of the recovered images are shown in Table 5.
Figure 8. Dielectric constant between four and six, with 5% noise for TM case. (a) Ground truth. (b) CSI, 10 iterations with U-Net. (c) DCS, three iterations with U-Net. (d) MCS, three iterations with U-Net.
Table 5. NRMSE and SSIM for a dielectric constant between four and six, with 5% noise for TM case.
It is observed that the performance differences among the methods in reconstructing the high-contrast target become increasingly pronounced with the addition of 10% Gaussian noise. The result of CSI with U-Net, as shown in Figure 9b, is seriously affected by the noise, which not only has blurred boundaries, but also exhibits clear misclassifications and artifacts. While the result of DCS with U-Net displayed in Figure 9c better captures the major structural block distributions, the detailed restoration is still insufficient, and the range of the dielectric constants shows significant deviations from the expected range. In contrast, MCS with U-Net, as shown in Figure 9d, can recover the distribution of high and low dielectric regions more accurately, and the overall shape and dielectric values are similar to that of the real case given in Figure 9a, demonstrating the method’s stability and accuracy under high contrast and moderate noise conditions. The NRMSEs and SSIMs of the recovered images are shown in Table 6.
Figure 9. Dielectric constant between six and eight, with 5% noise for TM case. (a) Ground truth. (b) CSI, 10 iterations with U-Net. (c) DCS, three iterations with U-Net. (d) MCS, three iterations with U-Net.
Table 6. NRMSE and SSIM for a dielectric constant between six and eight, with 5% noise for TM case.
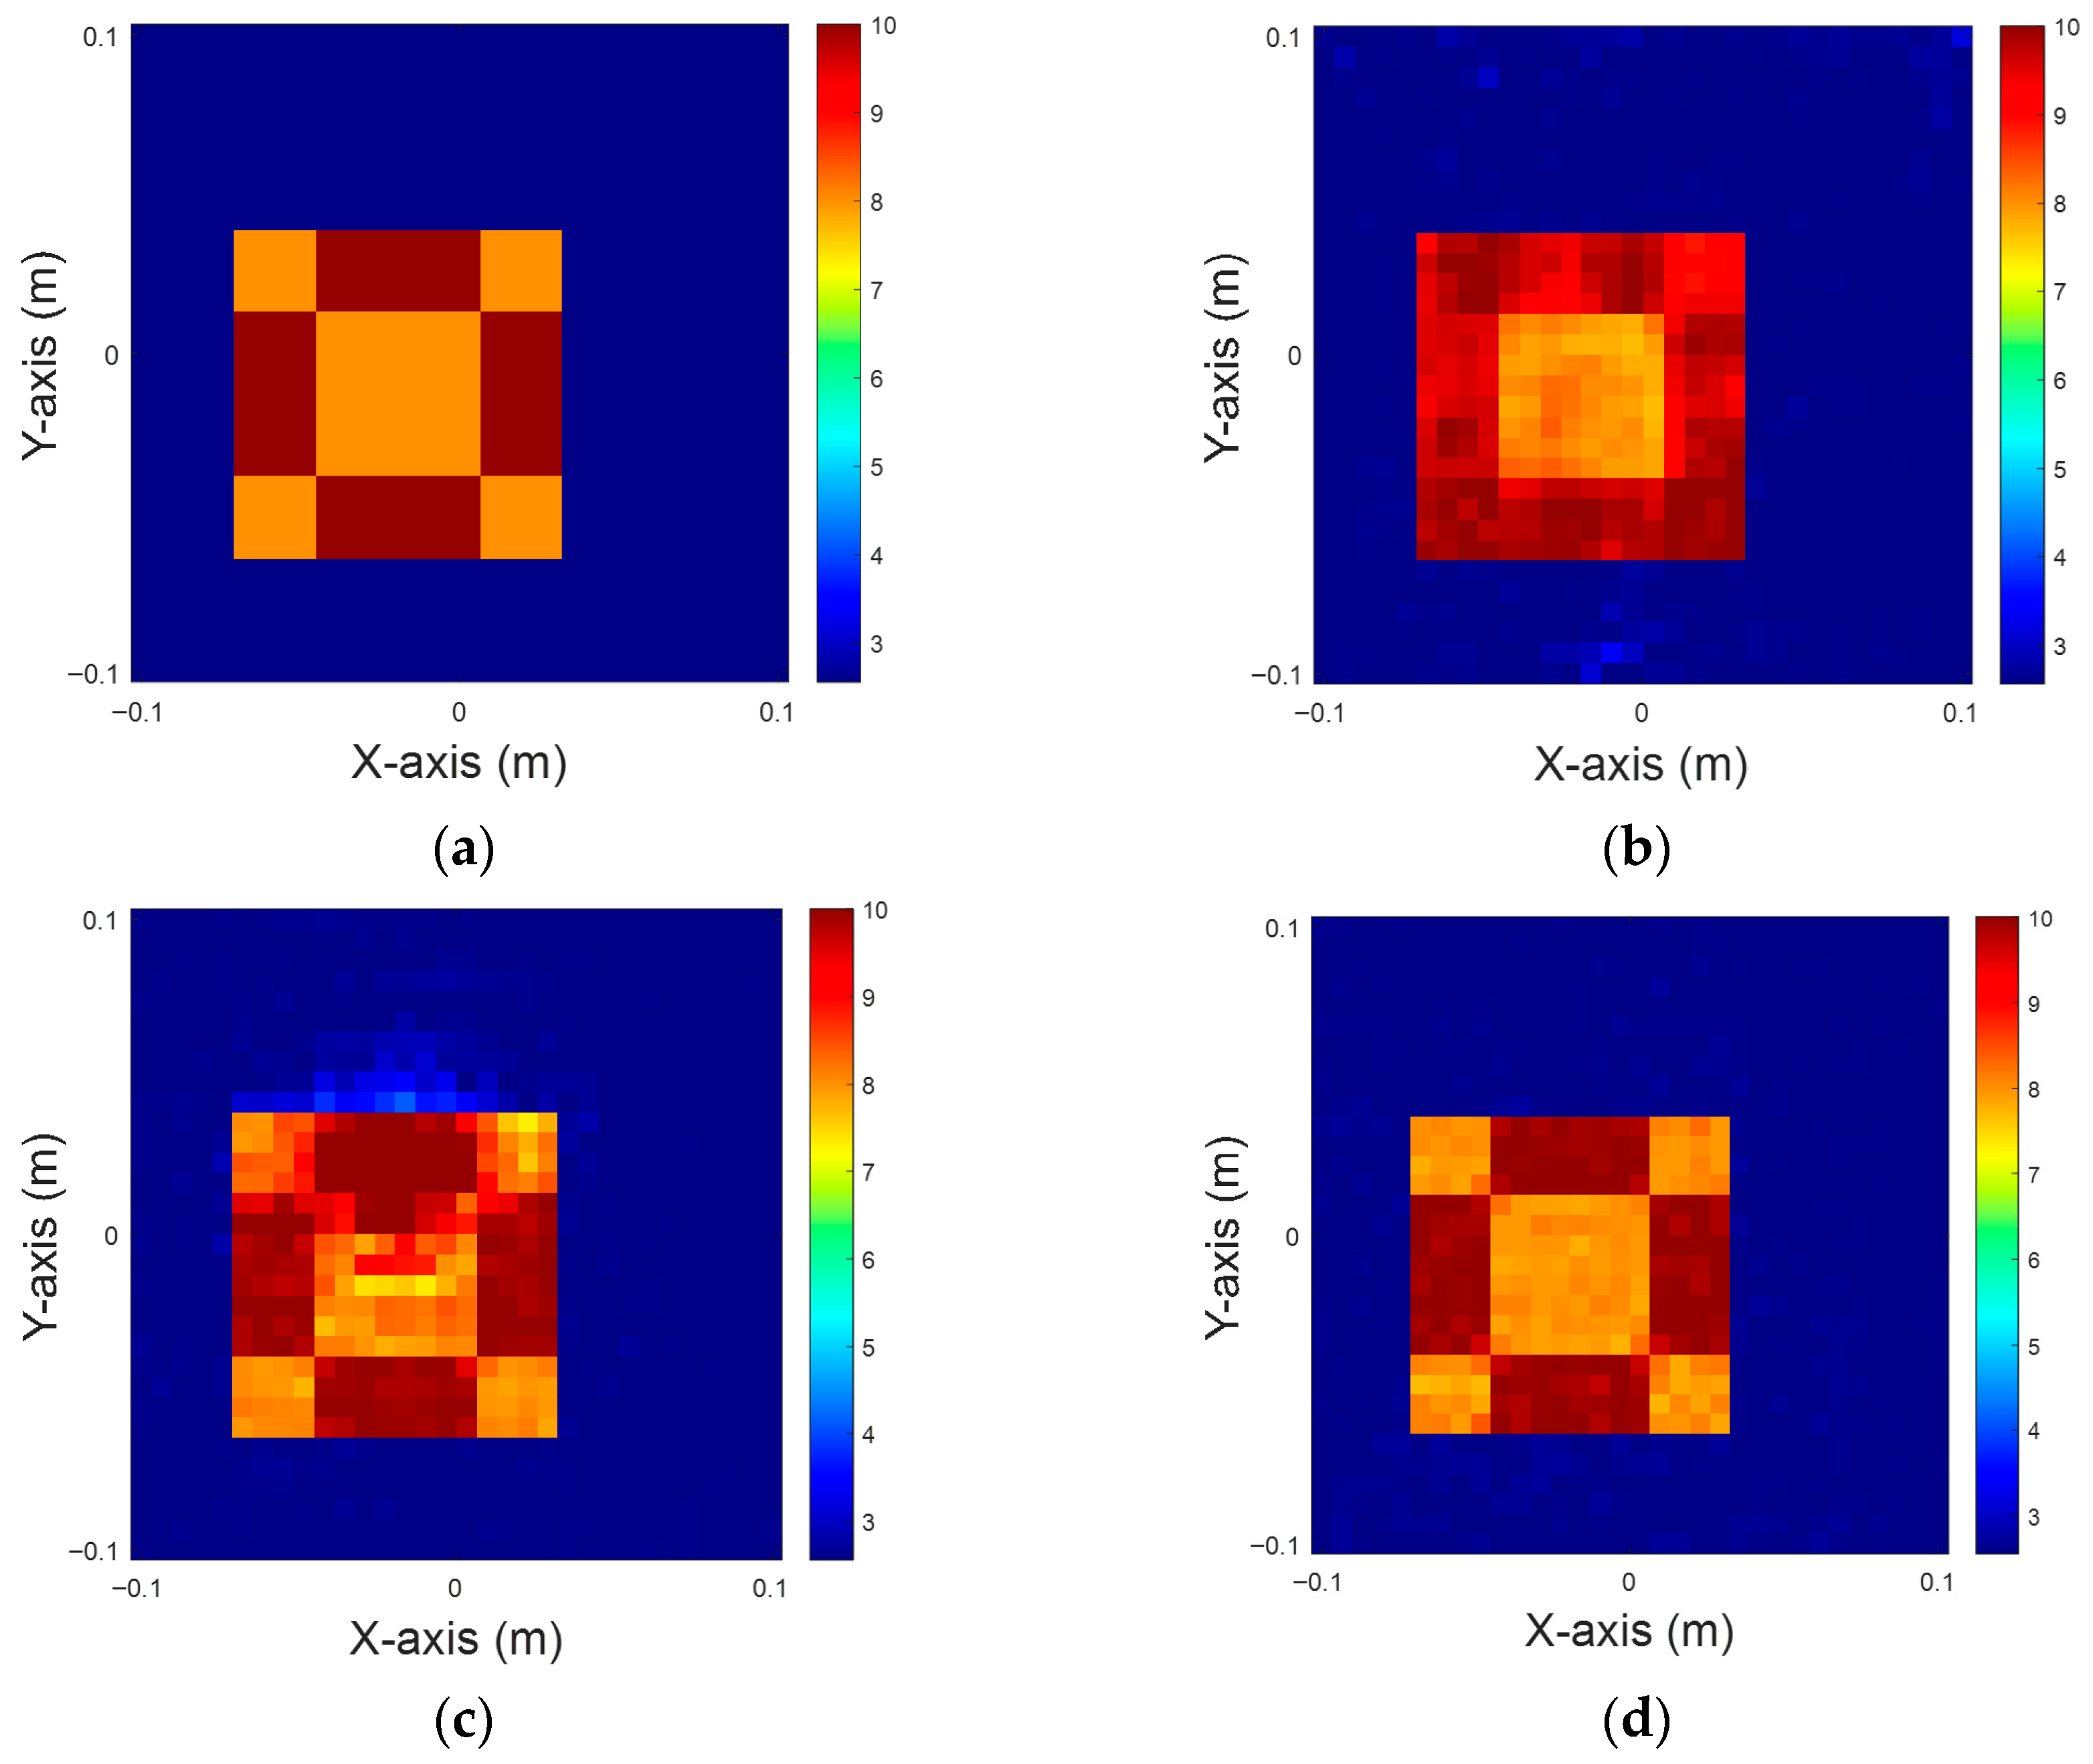
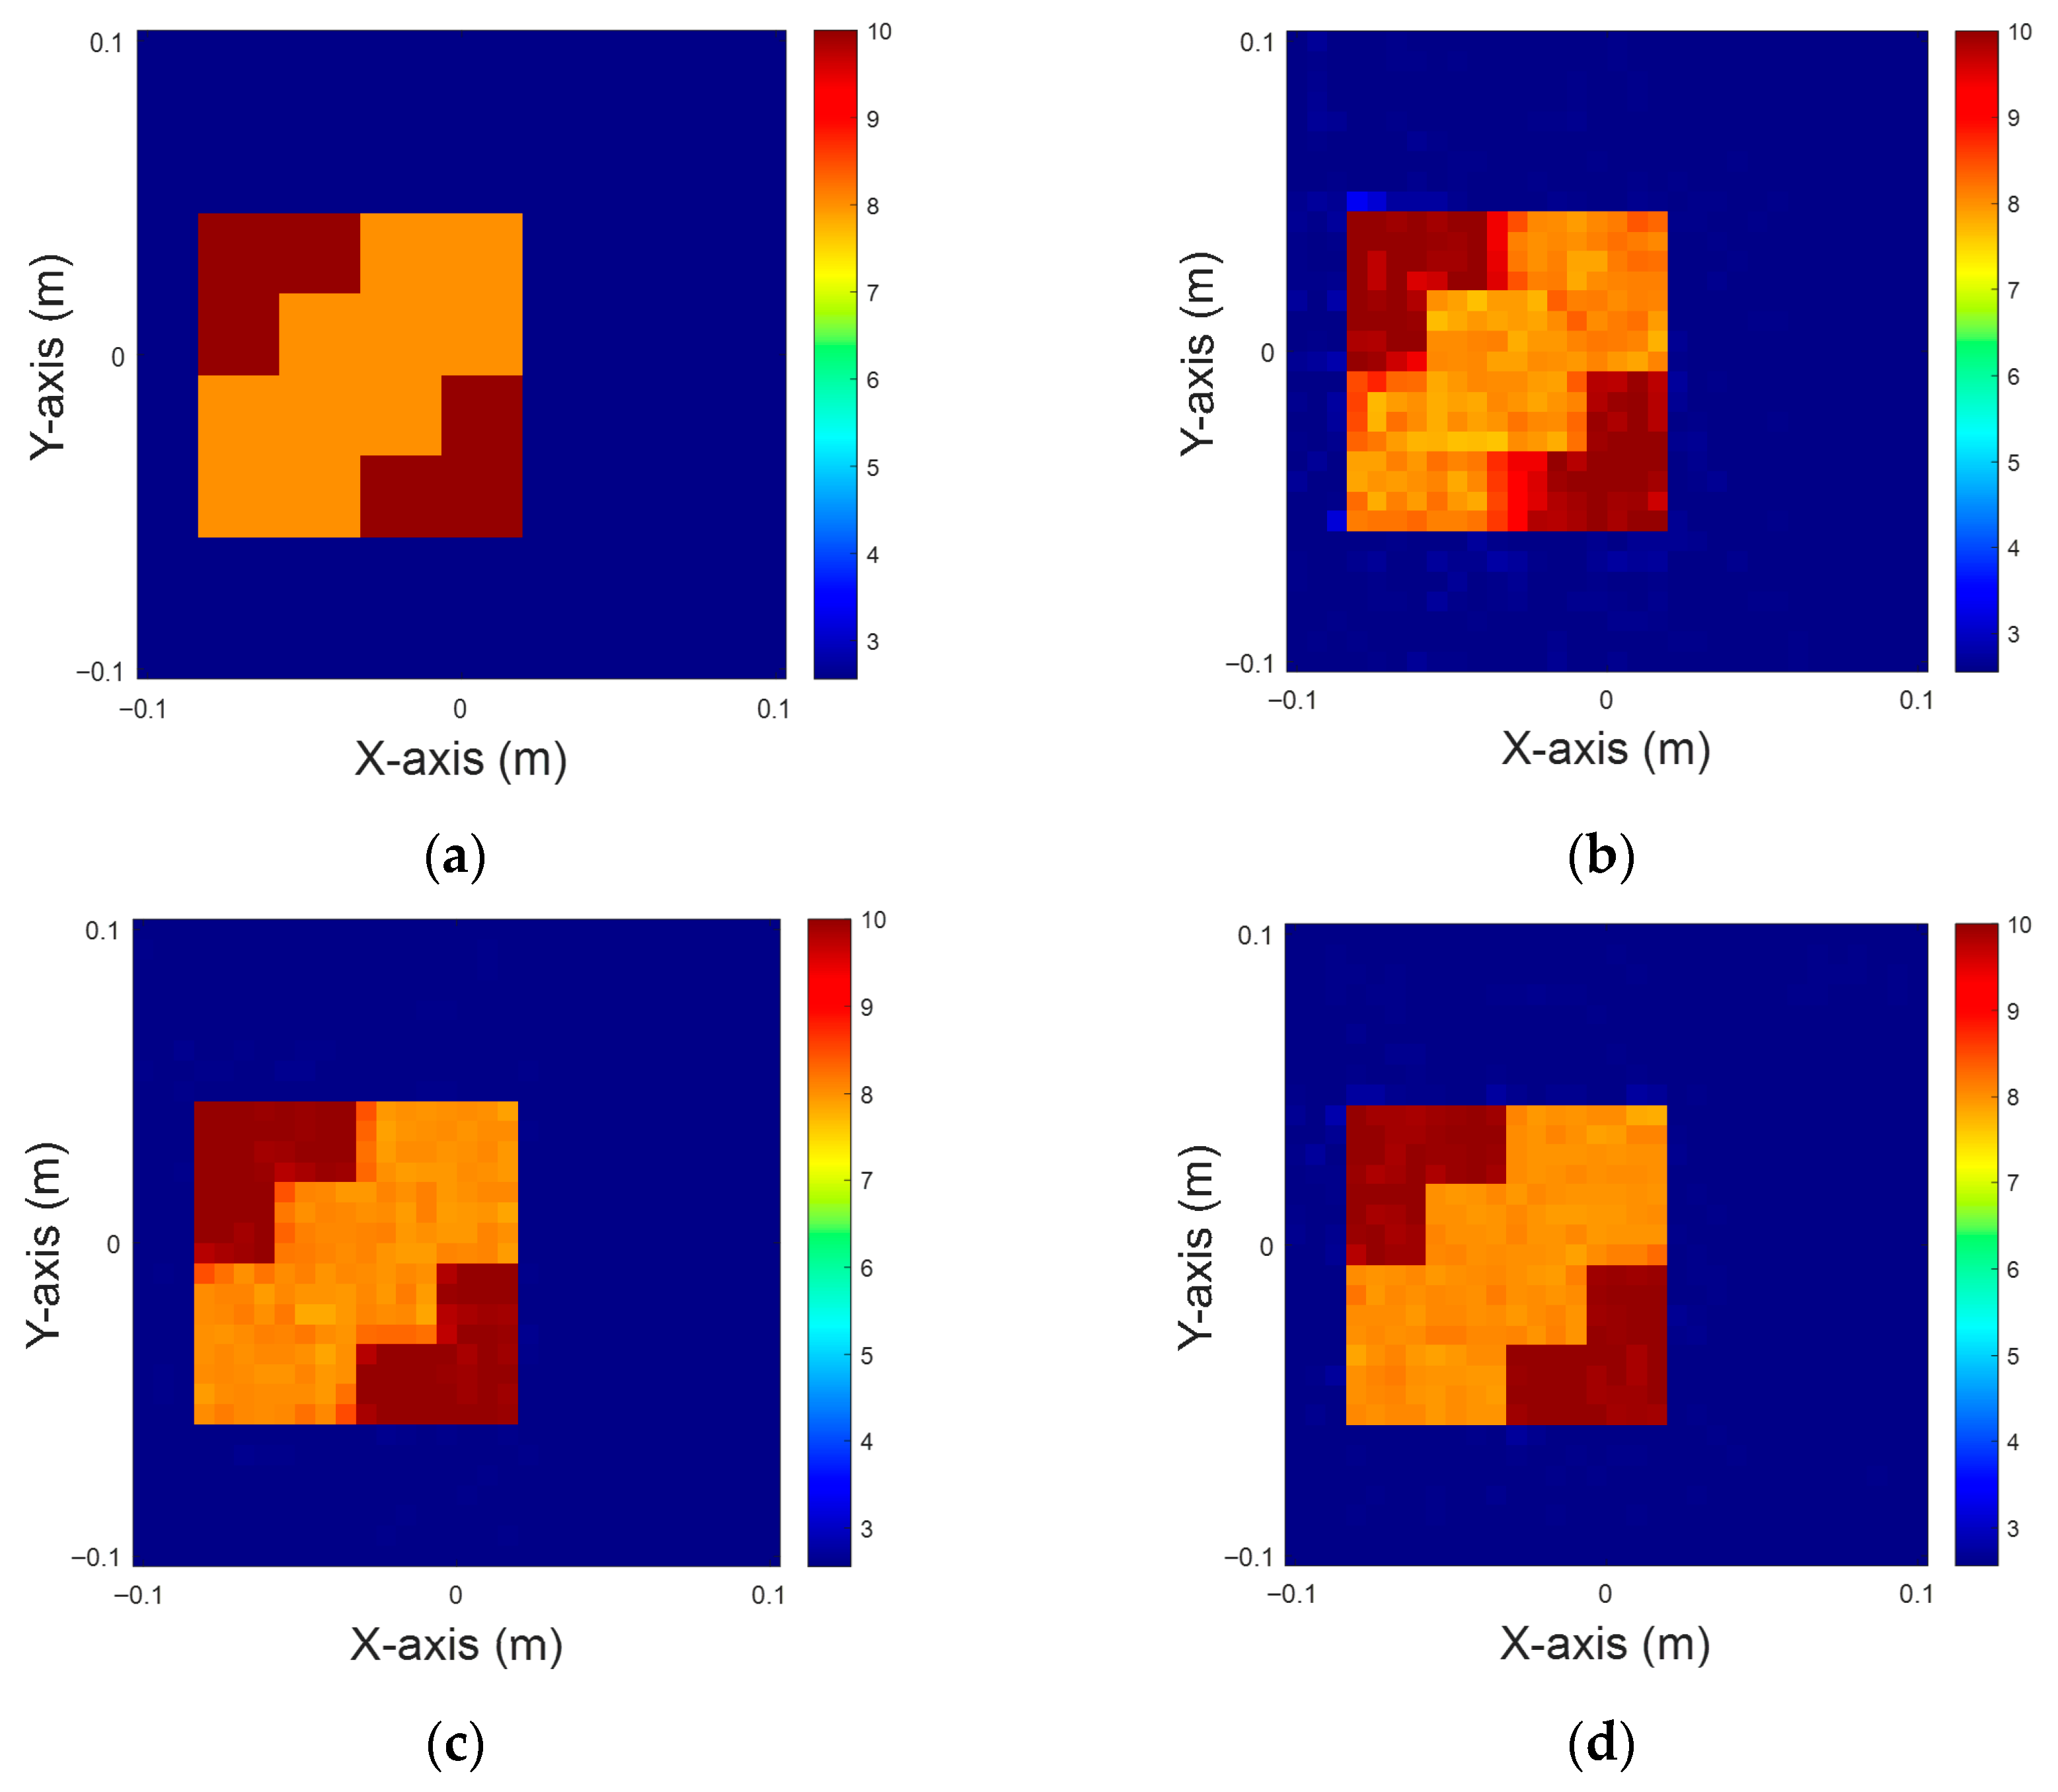
It is observed that under high-contrast conditions, with dielectric coefficients ranging from 8 to 10, and 5% Gaussian noise, the reconstruction performance of each method differs significantly. CSI with U-Net, as illustrated in Figure 10b, exhibits significant deviations in the reconstruction result, with blurred target boundaries and distortion in the center region with low values. While the reconstruction result of DCS with U-Net displayed in Figure 10c can recognize part of the contours, the reconstruction of the high-dielectric region remains incoherent, with noticeable artifacts and structural distortions. In contrast, the reconstructed image from MCS combined with U-Net shown in Figure 10d demonstrates better shape preservation and more accurate dielectric values. This method not only preserves the shape of both the core and boundary distributions, but also effectively distinguishes the high- and low-dielectric regions, closely resembling the ground truth image shown in Figure 10a. The corresponding NRMSEs and SSIMs of the recovered images are presented in Table 7.
Figure 10. Dielectric constant between 8 and 10, with 5% noise for TM case. (a) Ground truth. (b) CSI, 10 iterations with U-Net. (c) DCS, three iterations with U-Net. (d) MCS, three iterations with U-Net.
Table 7. NRMSE and SSIM for a dielectric constant between 8 and 10, with 5% noise for TM case.

4.1.3. Dielectric Constant Between Four and Six, with Different Noise for TM Case

The following section provides the TM case simulation results for a dielectric constant between four and six, with 5%, 10%, 15%, and 20% noise, respectively.
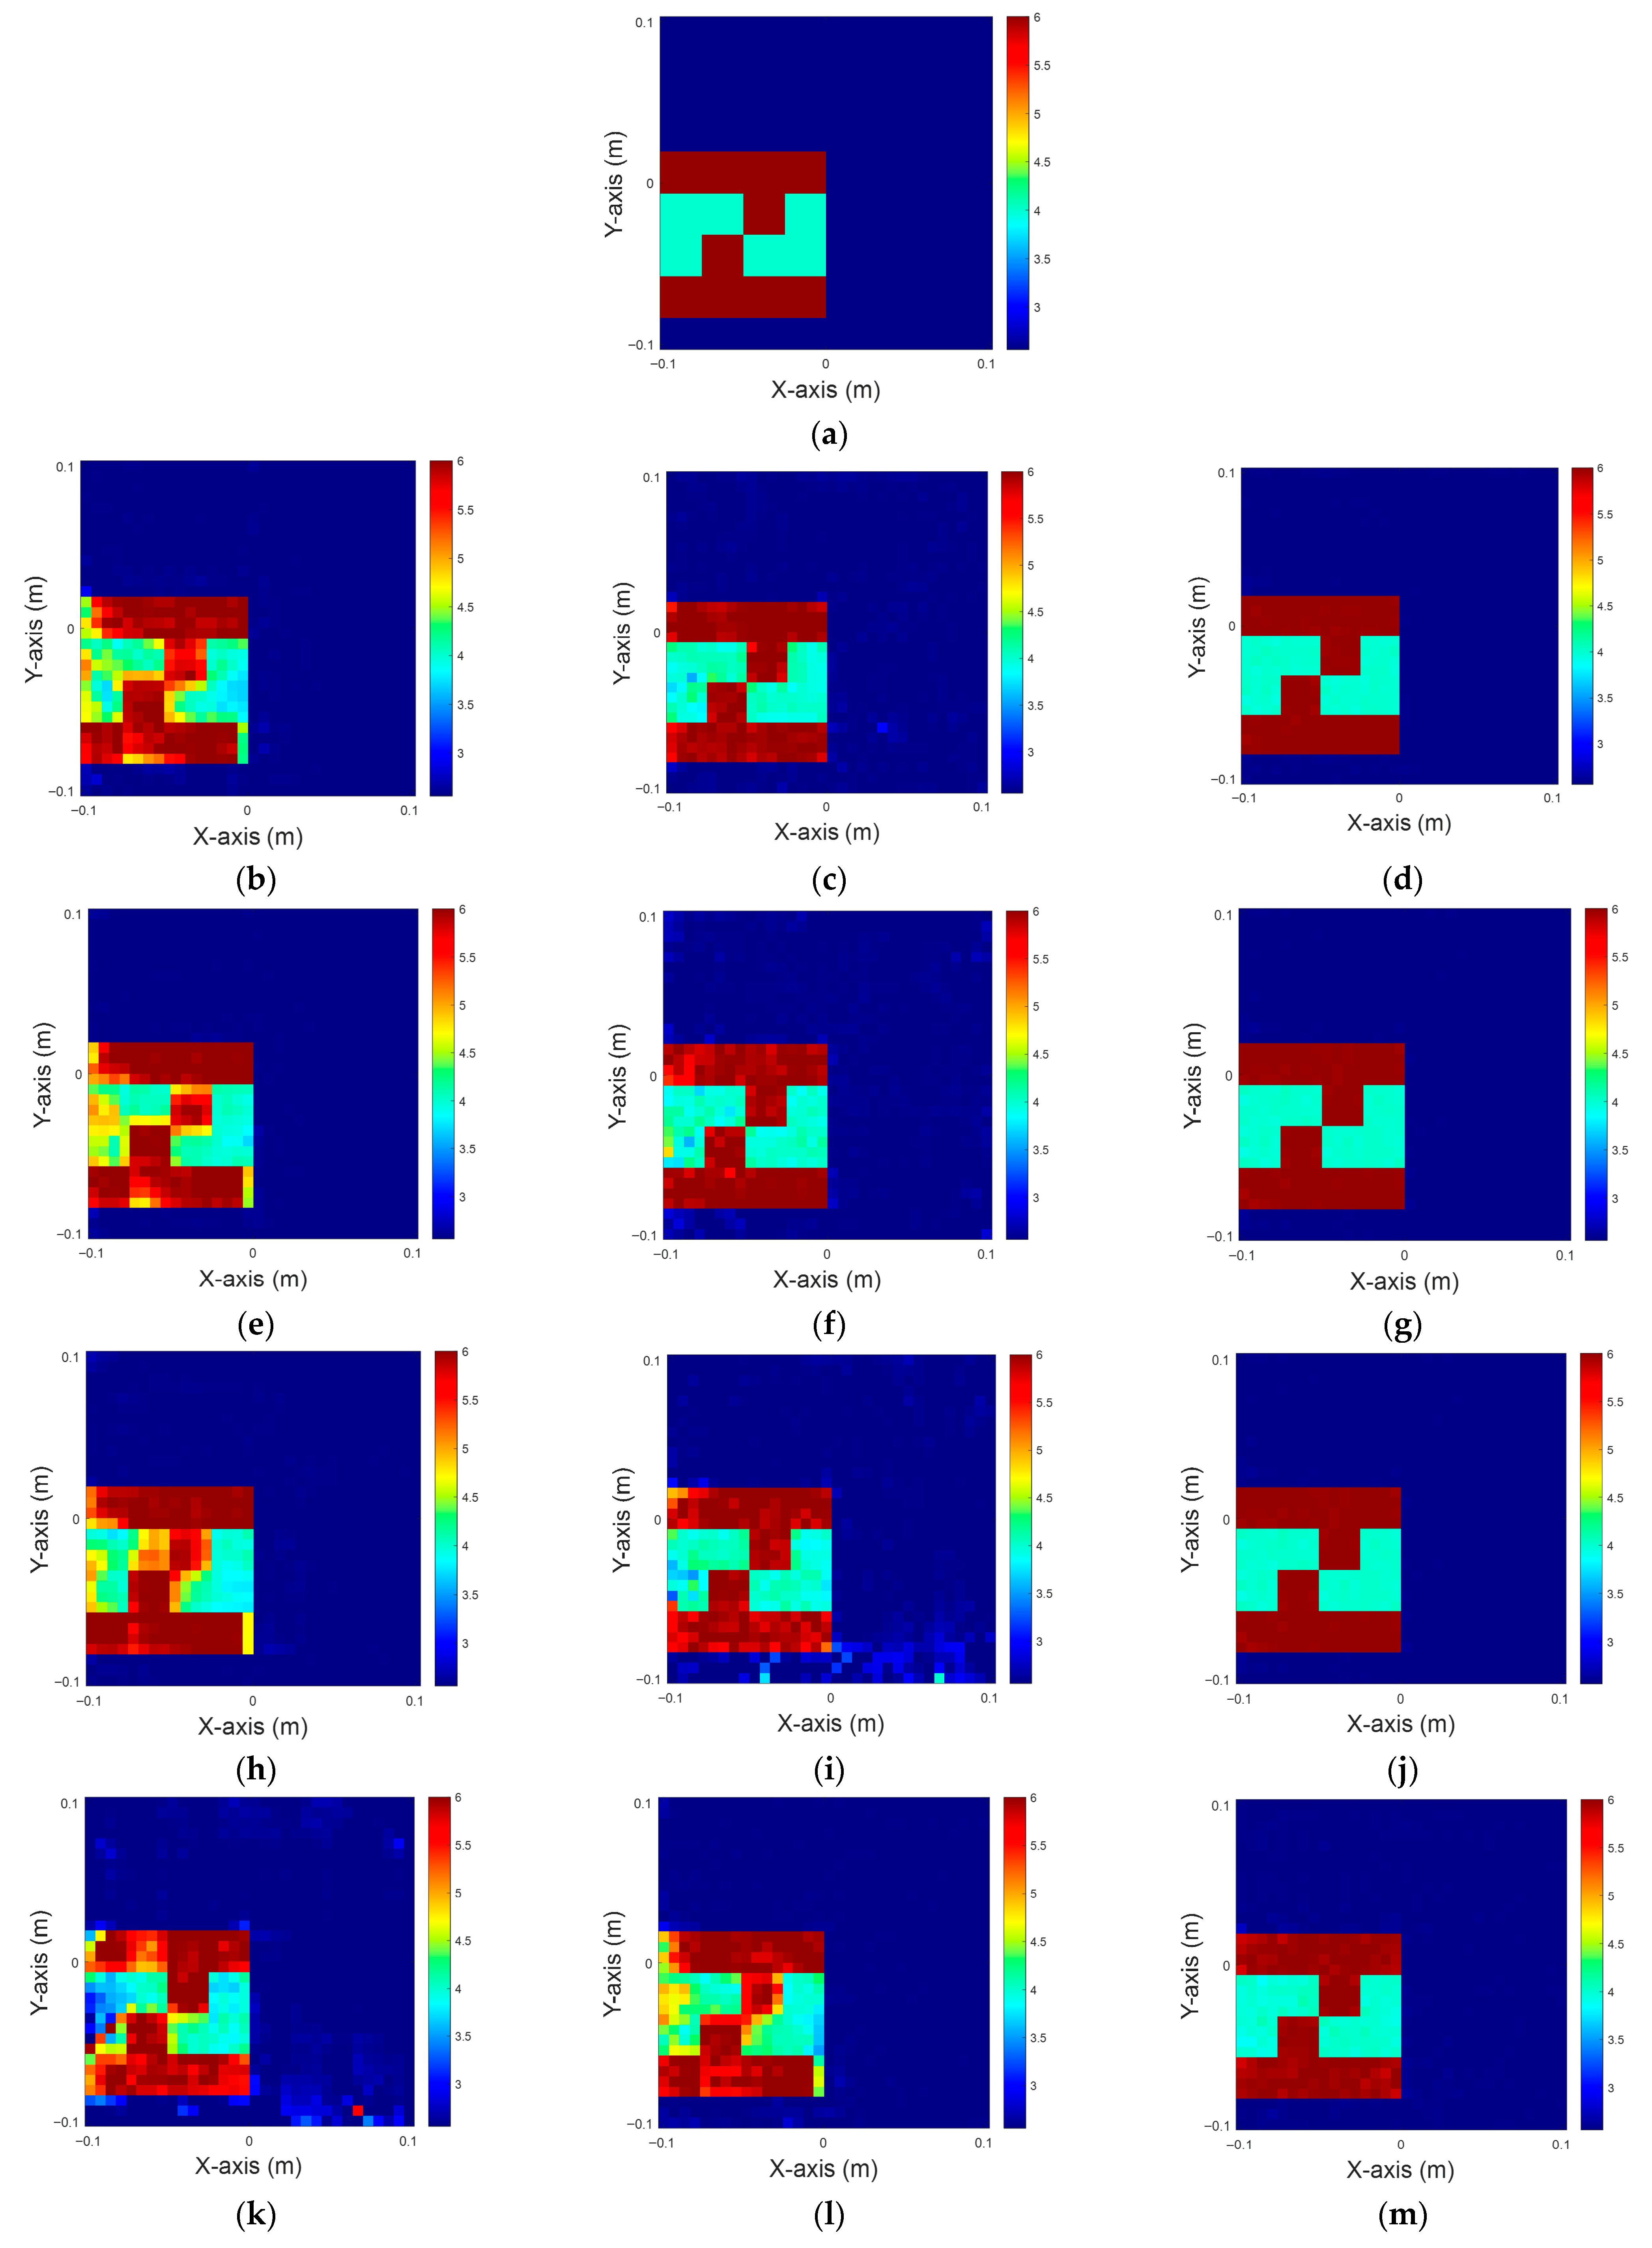
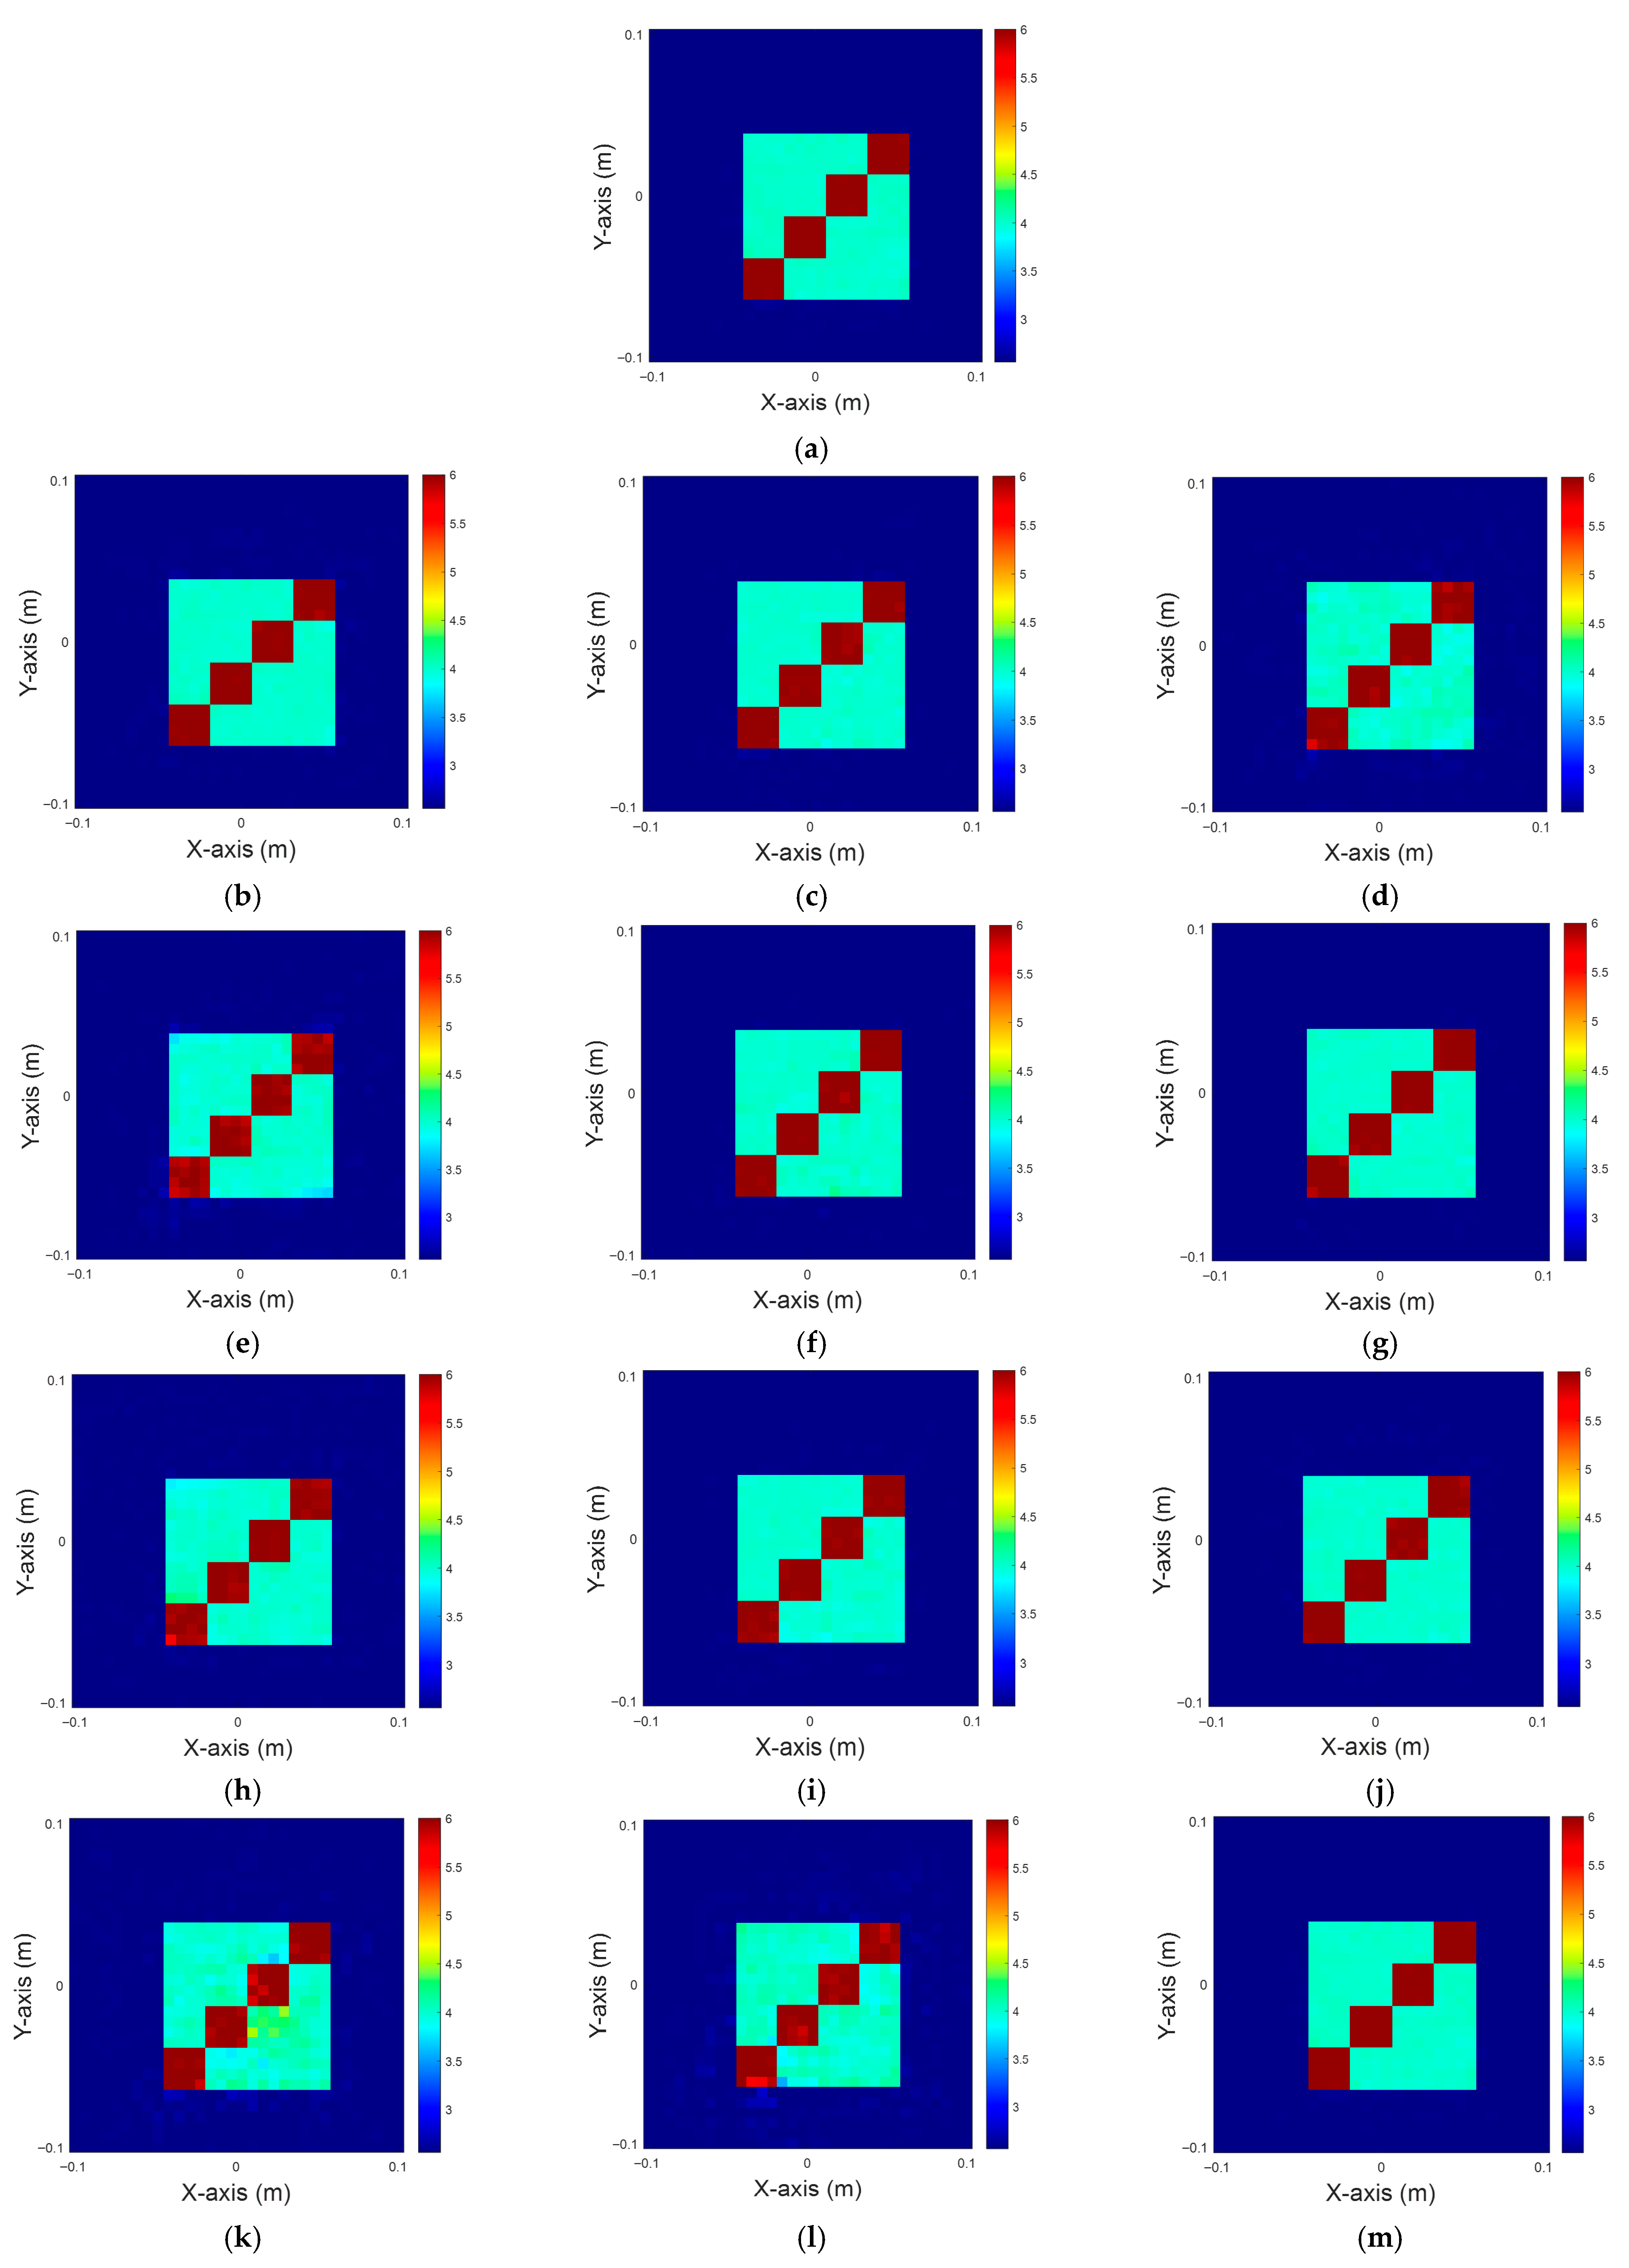
It is observed that the image reconstruction quality of each method shows a significant degradation as the Gaussian noise level increases from 5% to 10%, 15%, and 20% for dielectric coefficient distributions between four and six. For the reconstruction results of CSI combined with U-Net, as shown in Figure 11b,e,h,k, although the main contours remain recognizable at 5% noise, the results gradually show blurring, deformation, and artifacts as the noise level increases. While the reconstruction results of DCS combined with U-Net, as shown in Figure 11c,f,i,l, can maintain a relatively stable structure under low and medium noise levels, local errors and boundary distortions are also generated at high noise levels. In contrast, MCS combined with U-Net, as illustrated in Figure 11d,g,j,m, exhibits the best structural recovery and noise immunity in all noise scenarios. Even under 20% Gaussian noise, the reconstructed image still preserves similar geometrical features and dielectric value distributions as in Figure 11a. This finding indicates that MCS combined with deep learning models not only possesses excellent initial estimation capability, but also effectively enhances robustness and image quality. Table 8 provides the NRMSEs and SSIMs of the recovered images.
Figure 11. Dielectric constant between four and six for TM case. (a) Ground truth; (bd) 5% noise; (eg) 10% noise; (hj) 15% noise; (km) 20% noise.
Table 8. NRMSE and SSIM for dielectric constants between four and six, with different noise levels for TM case.

4.2. TE Case

In this simulation, the dielectric constants are set at six. A total of 32 transmitters and 32 receivers are deployed with different Gaussian noise. Assuming that the scatterers have 10 different dielectric coefficient distributions and can be located at any of 50 different positions in the field of interest, a total of 500 images (10 × 50) are generated. The dataset is divided into 80% for training and 20% for testing. The initial images are evaluated using 10 iterations of CSI, three iterations of DCS, and three iterations of MCS with U-Net.

4.2.1. Dielectric Coefficient at Six, with Different Noise for TE Case

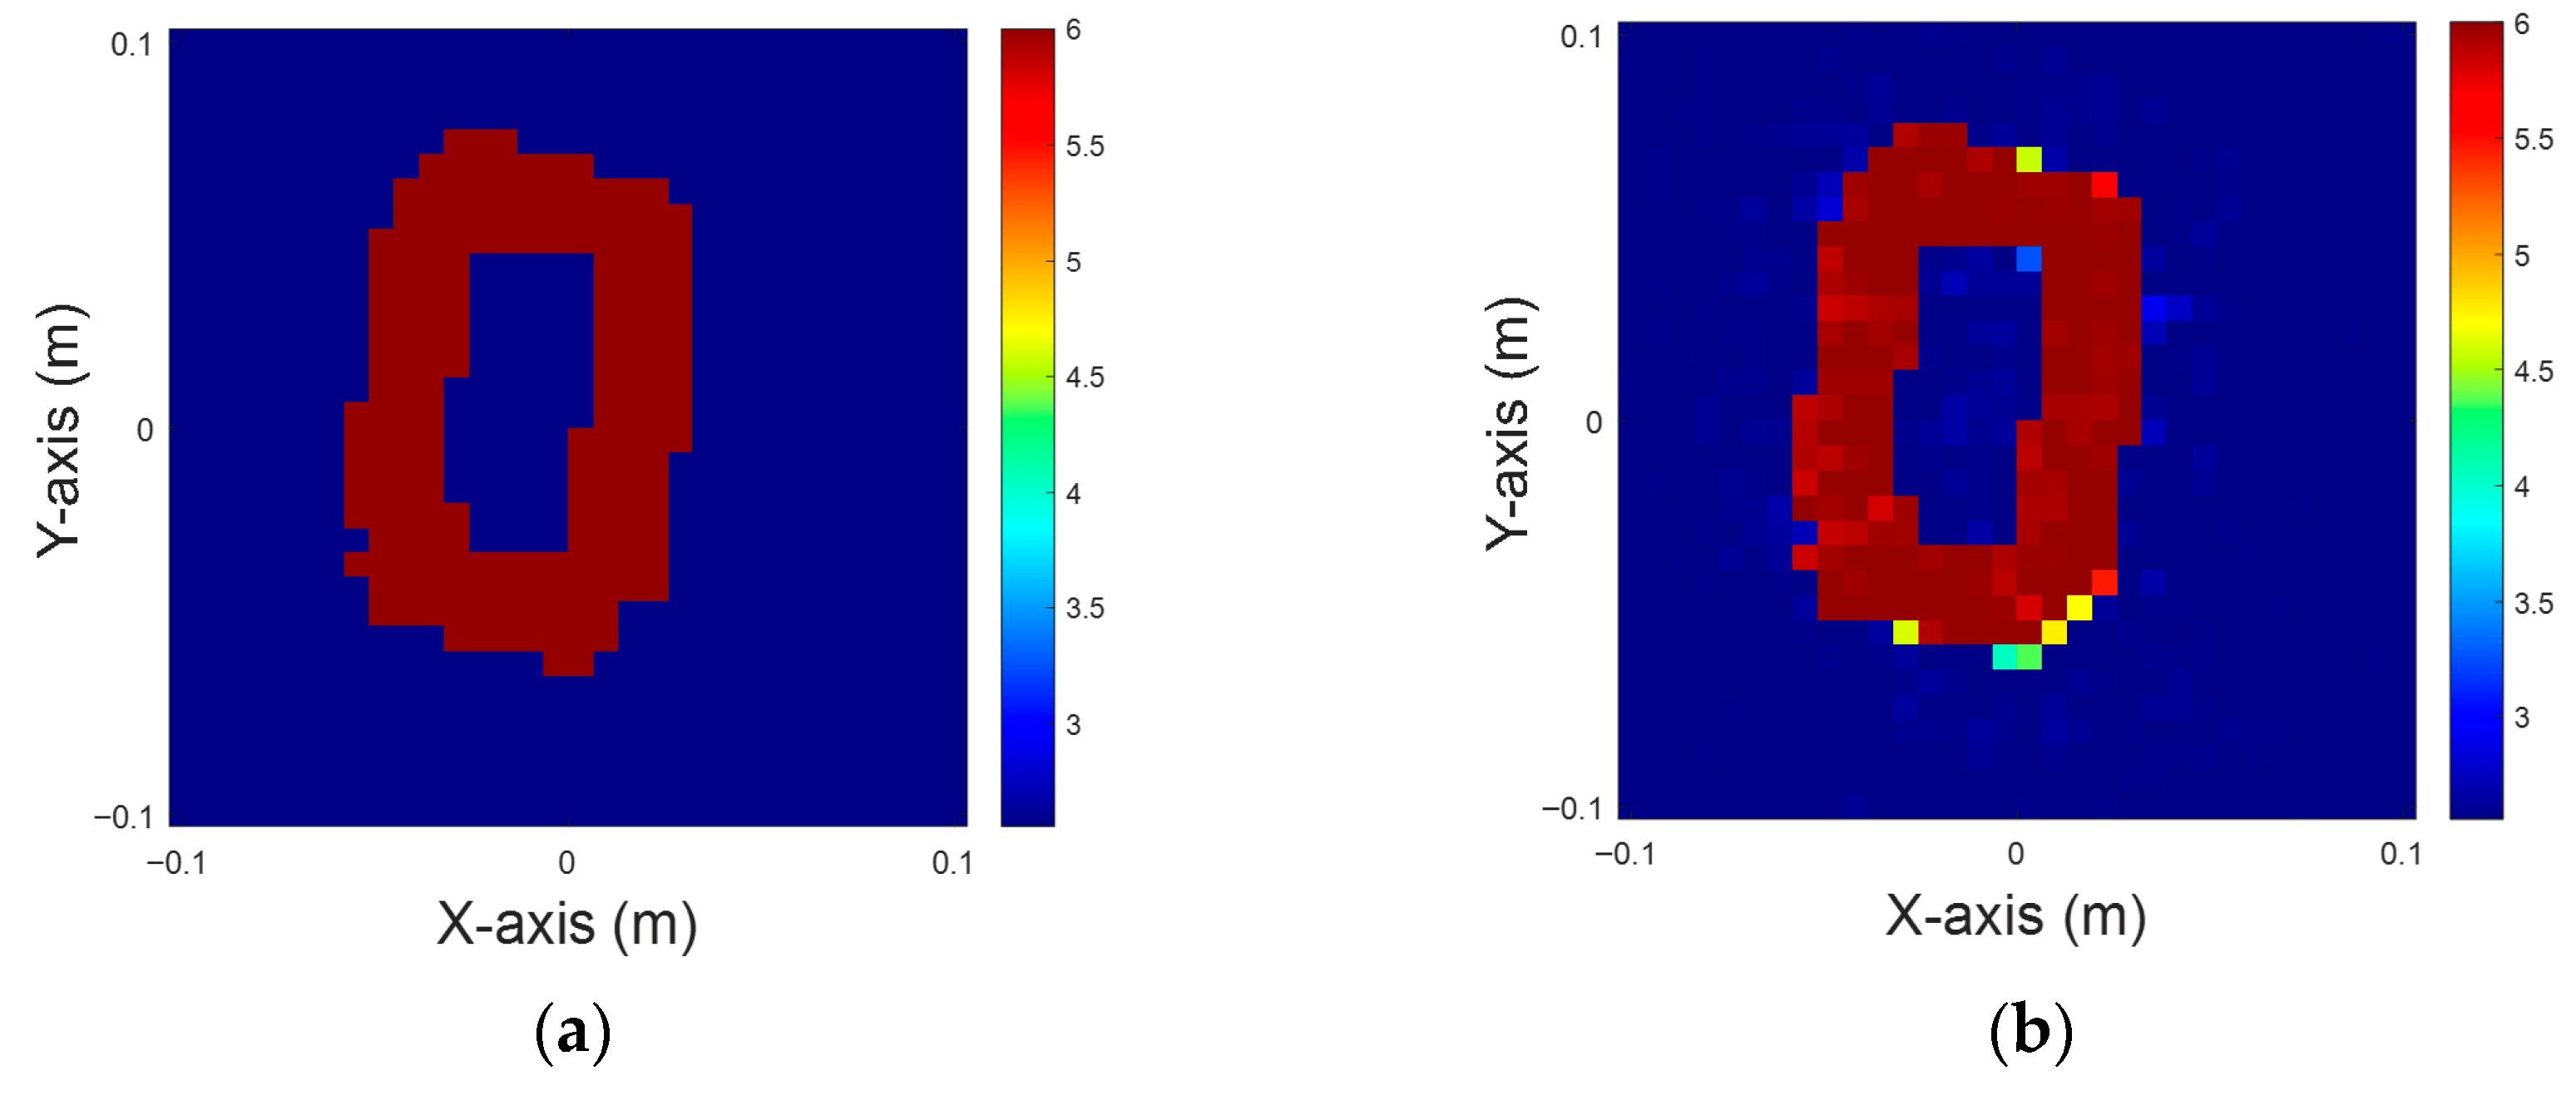
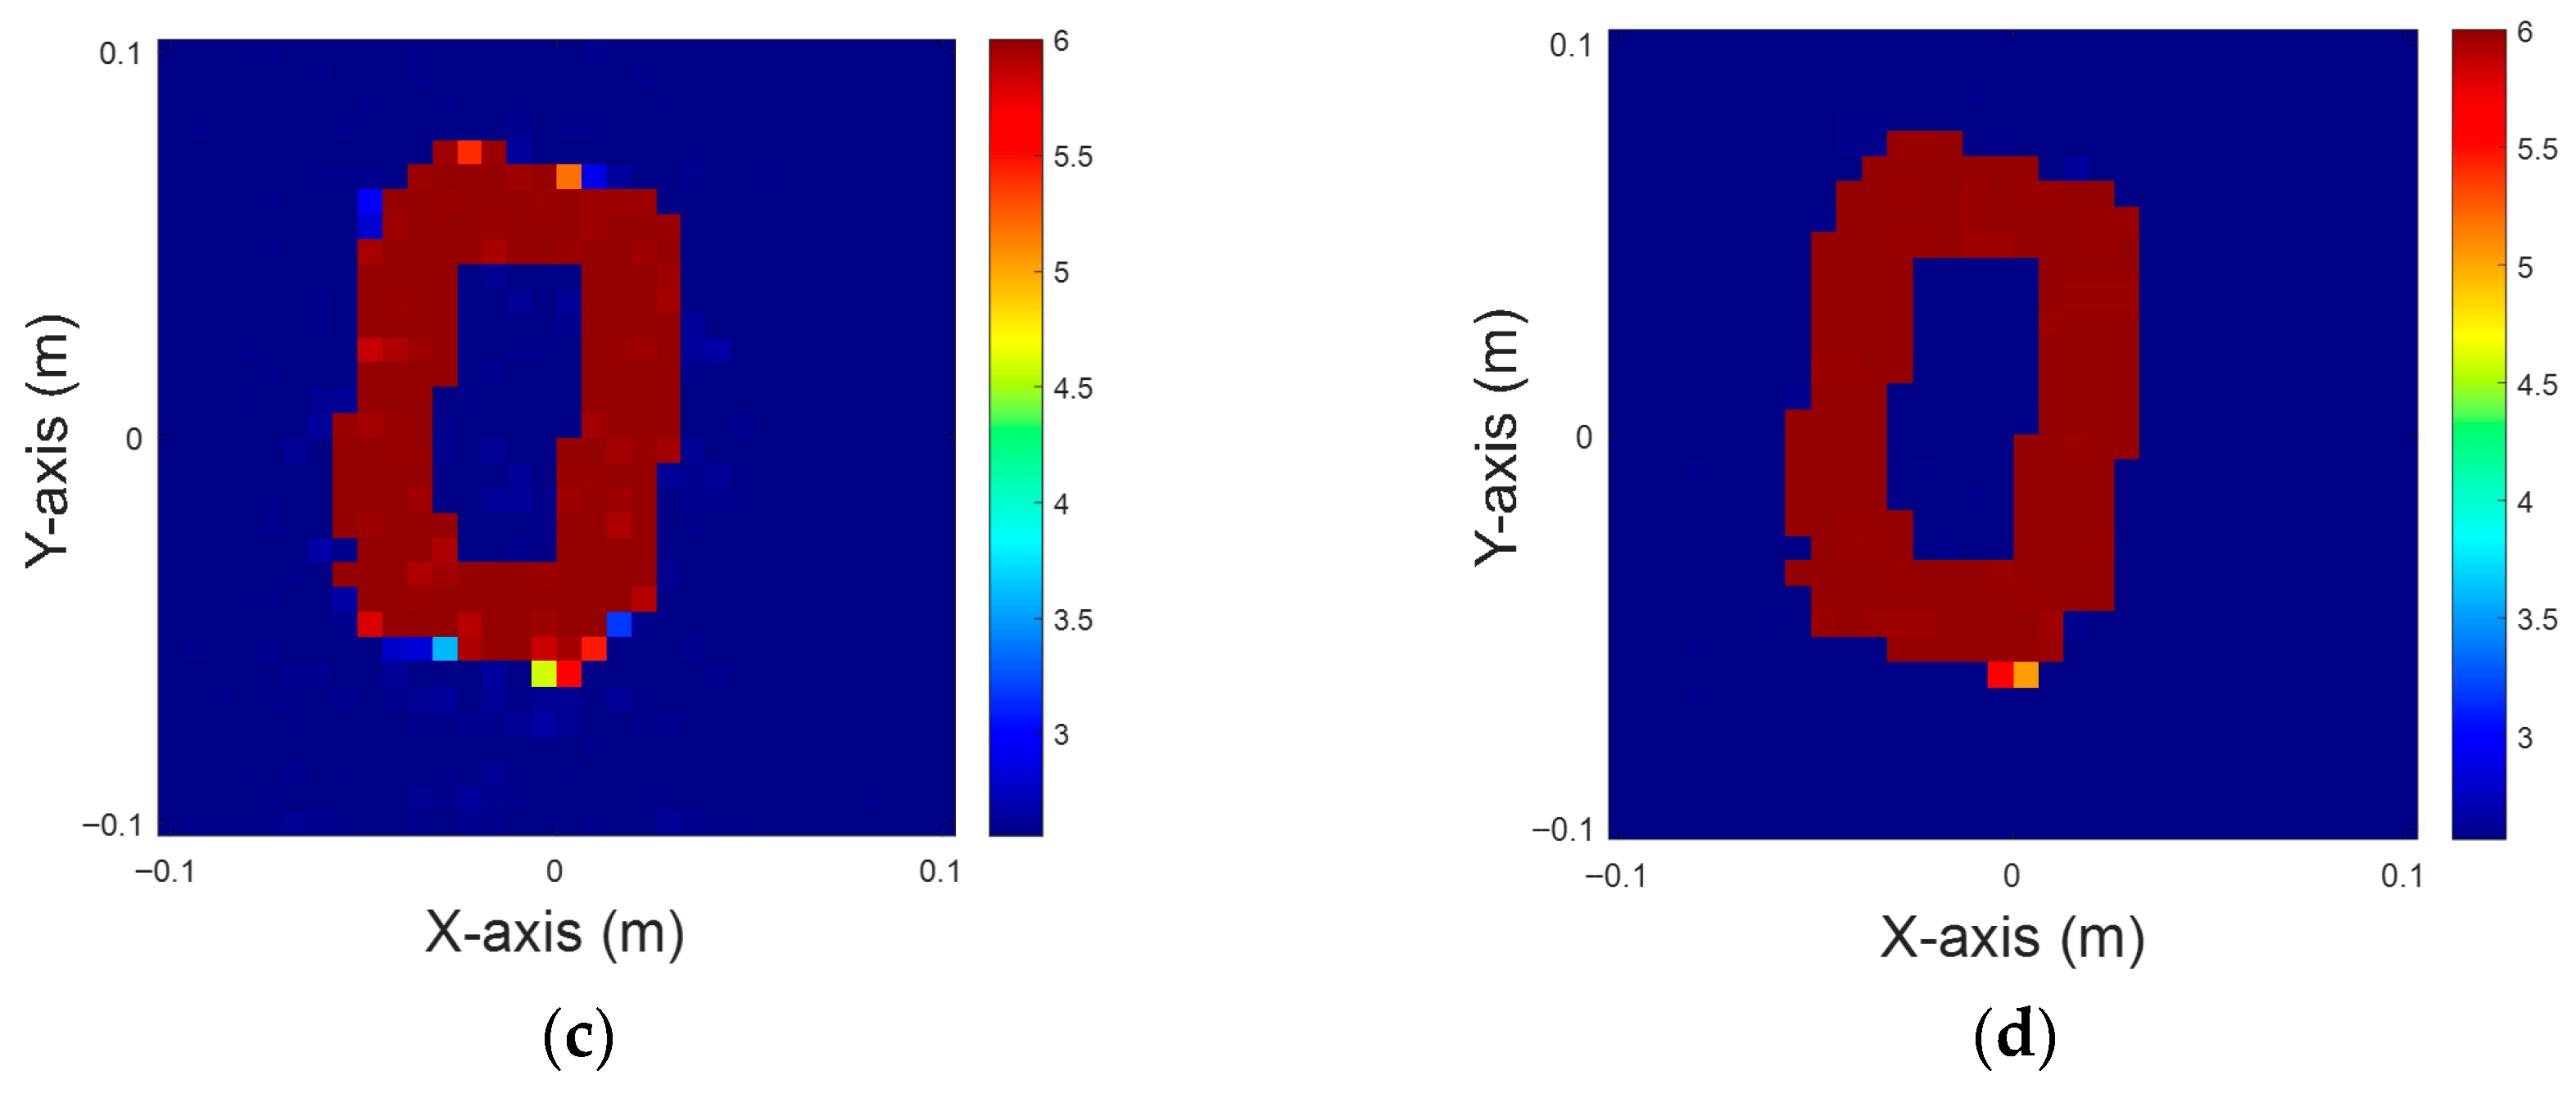
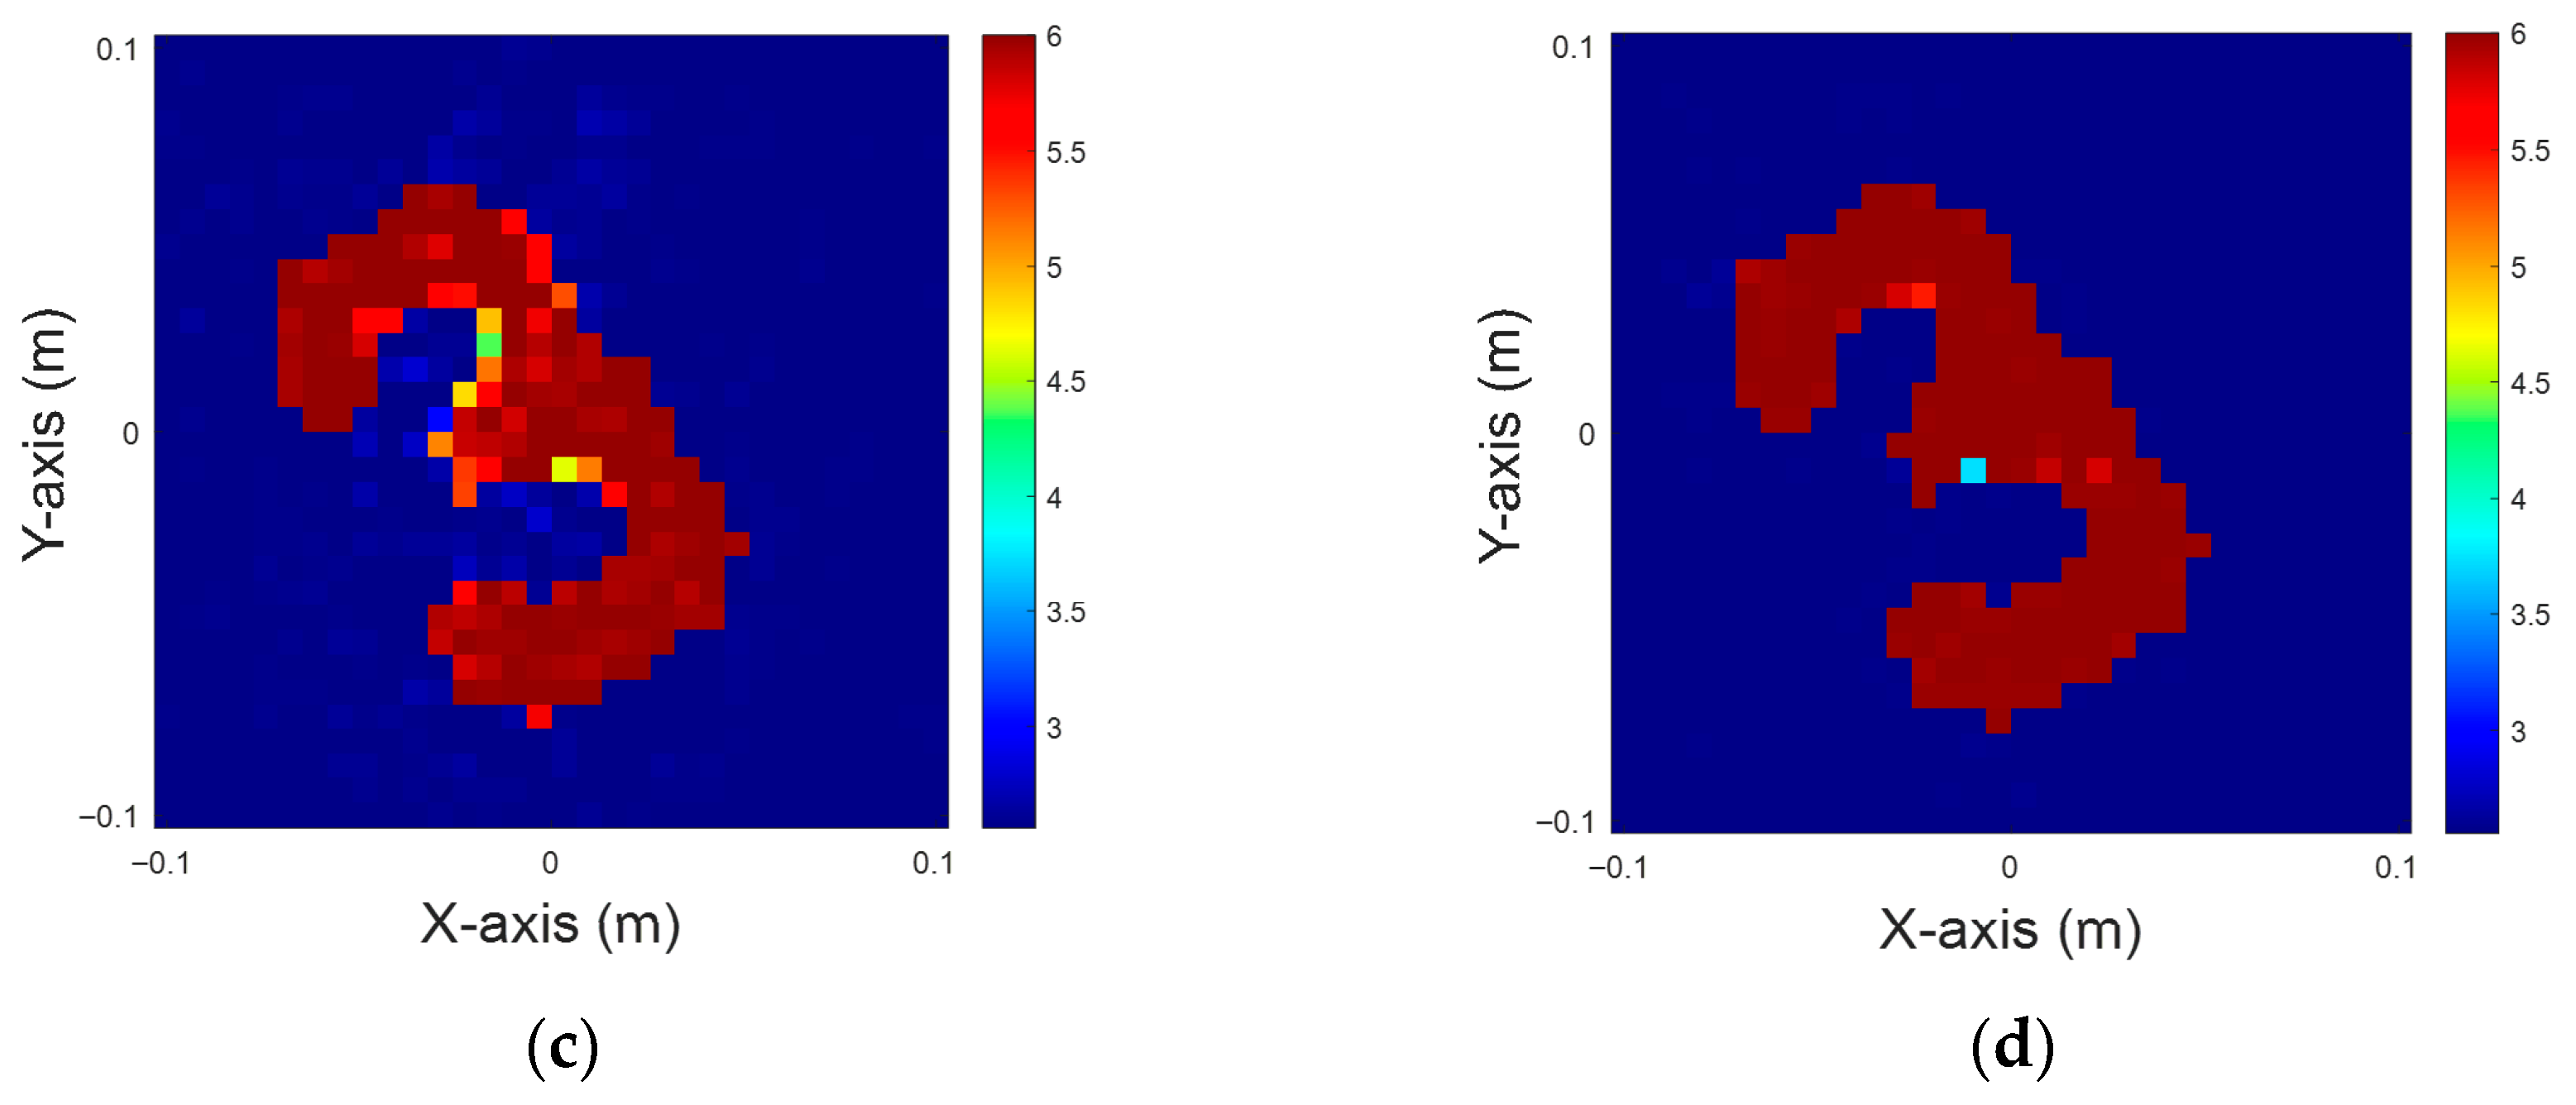
The recovered images are shown in Figure 12. Table 9 provides the NRMSEs and SSIMs for the dielectric constant at six with 5% noise. Based on the results, it can be observed that all three methods can roughly restore the basic structure of the digit “0”. However, the reconstruction result of CSI with U-Net, as shown in Figure 12b, has blurred edges and increased noise, resulting in a lack of clarity of the target contour. While the reconstruction result of DCS with U-Net, as illustrated in Figure 12c, shows some errors and noise, it still represents an improvement over CSI. In contrast, the initial image generated by MCS after three iterations and corrected by U-Net, as shown in Figure 12d, not only preserves a clear contour and a complete internal structure, but also significantly reduces the impact of noise, resulting in a reconstruction that better resembles the ground truth image shown in Figure 12a. Table 9 provides the NRMSEs and SSIMs of the recovered images.
Figure 12. Dielectric constant at six, with 5% noise for TE case. (a) Ground truth. (b) CSI, 10 iterations with U-Net. (c) DCS, three iterations with U-Net. (d) MCS, three iterations with U-Net.
Table 9. NRMSE and SSIM for a dielectric constant at six, with 5% noise for TE case.
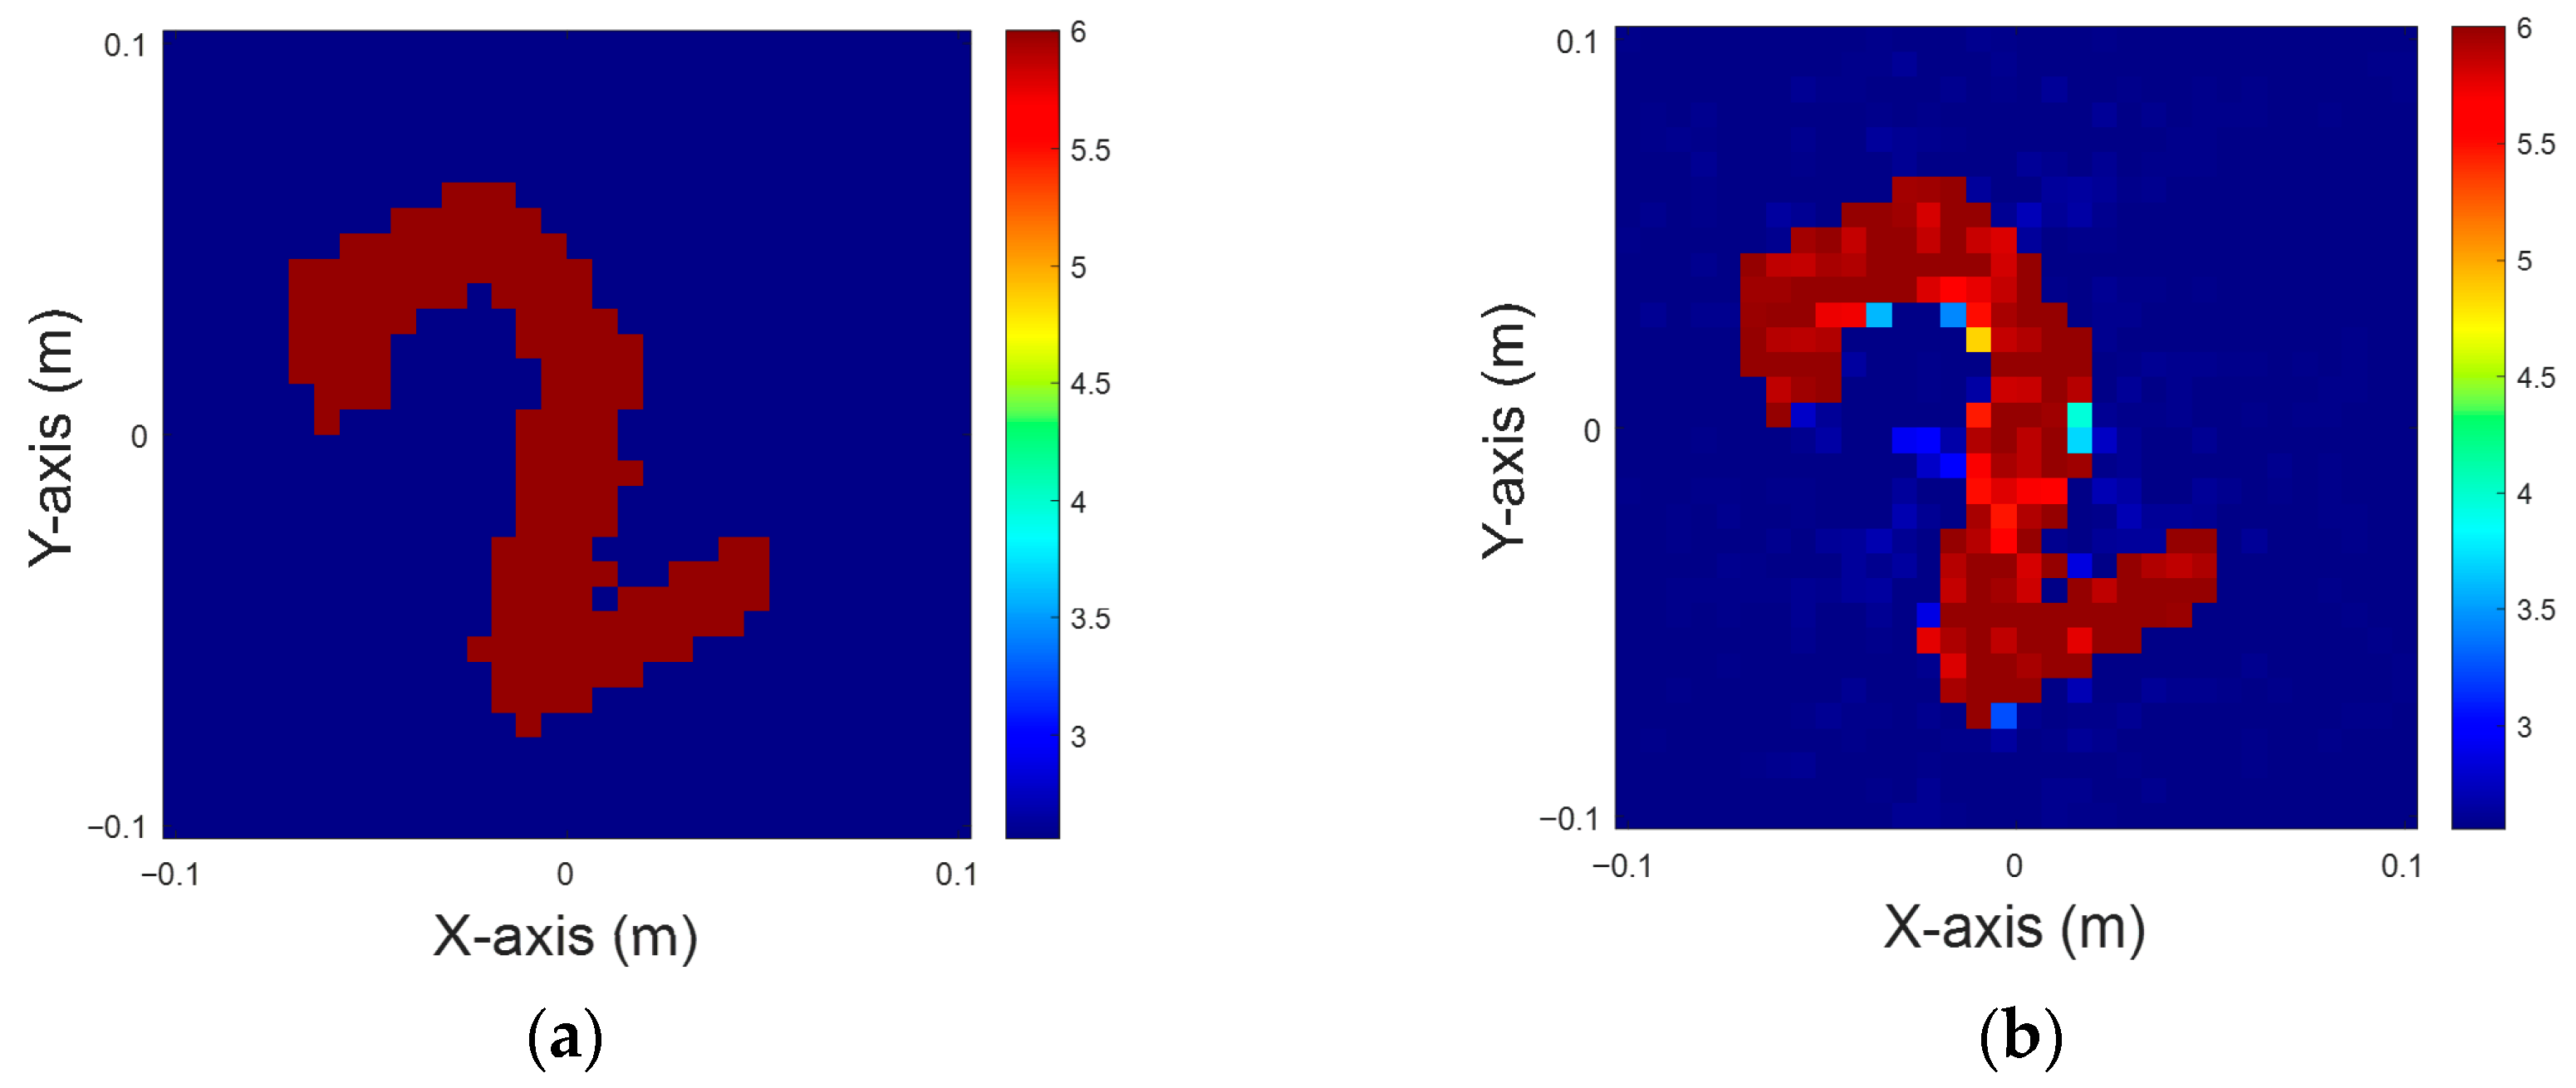
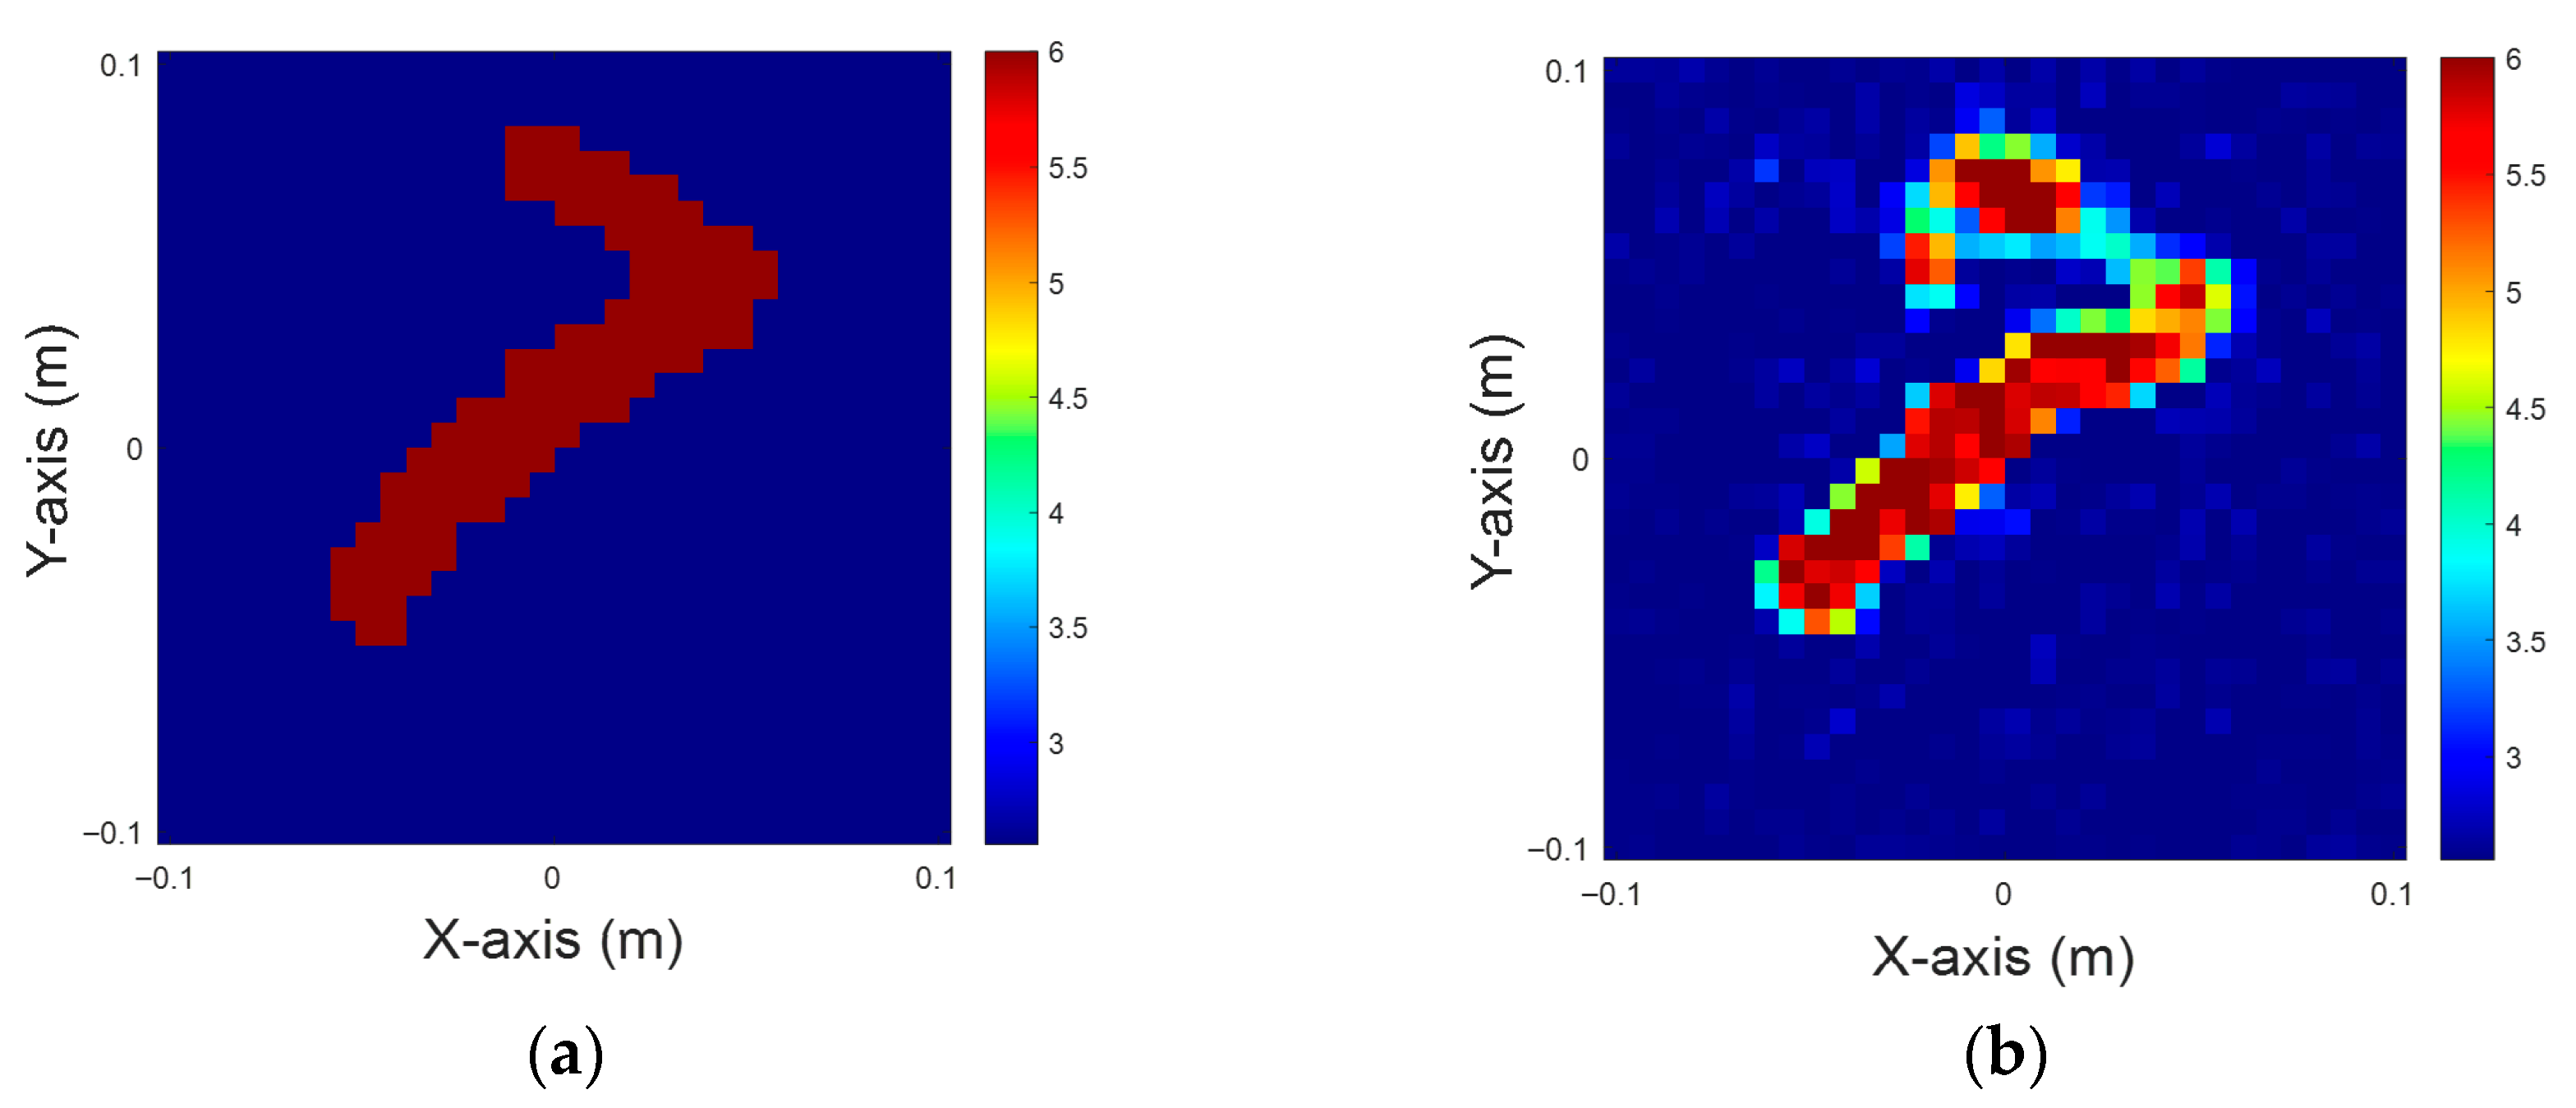
Table 10 presents the NRMSE and SSIM metrics of the reconstructed images with 10% noise at a dielectric constant of six. It can be observed that all methods manage to reconstruct the main outline of the digit “2” under 10% Gaussian noise. However, in Figure 13b, the result of CSI combined with U-Net is more affected by noise, leading to blurred edges and a distorted internal structure. In Figure 13c, the reconstructed image of DCS combined with U-Net is more stable. Although the outer contour is relatively clear, there are still problems of noise interference and discontinuity of the edges in some parts of the reconstructed image. In contrast, Figure 13d shows that the result of MCS combined with U-Net performs well in terms of image continuity and noise suppression. This approach not only clearly restores the digital contour, but also preserves the details of the internal structure, which is more in line with the true distribution shown in Figure 13a.
Table 10. NRMSE and SSIM for a dielectric constant at six, with 10% noise for TE case.
Figure 13. Dielectric constant at six, with 10% noise for TE case. (a) Ground truth. (b) CSI, 10 iterations with U-Net. (c) DCS, three iterations with U-Net. (d) MCS, three iterations with U-Net.
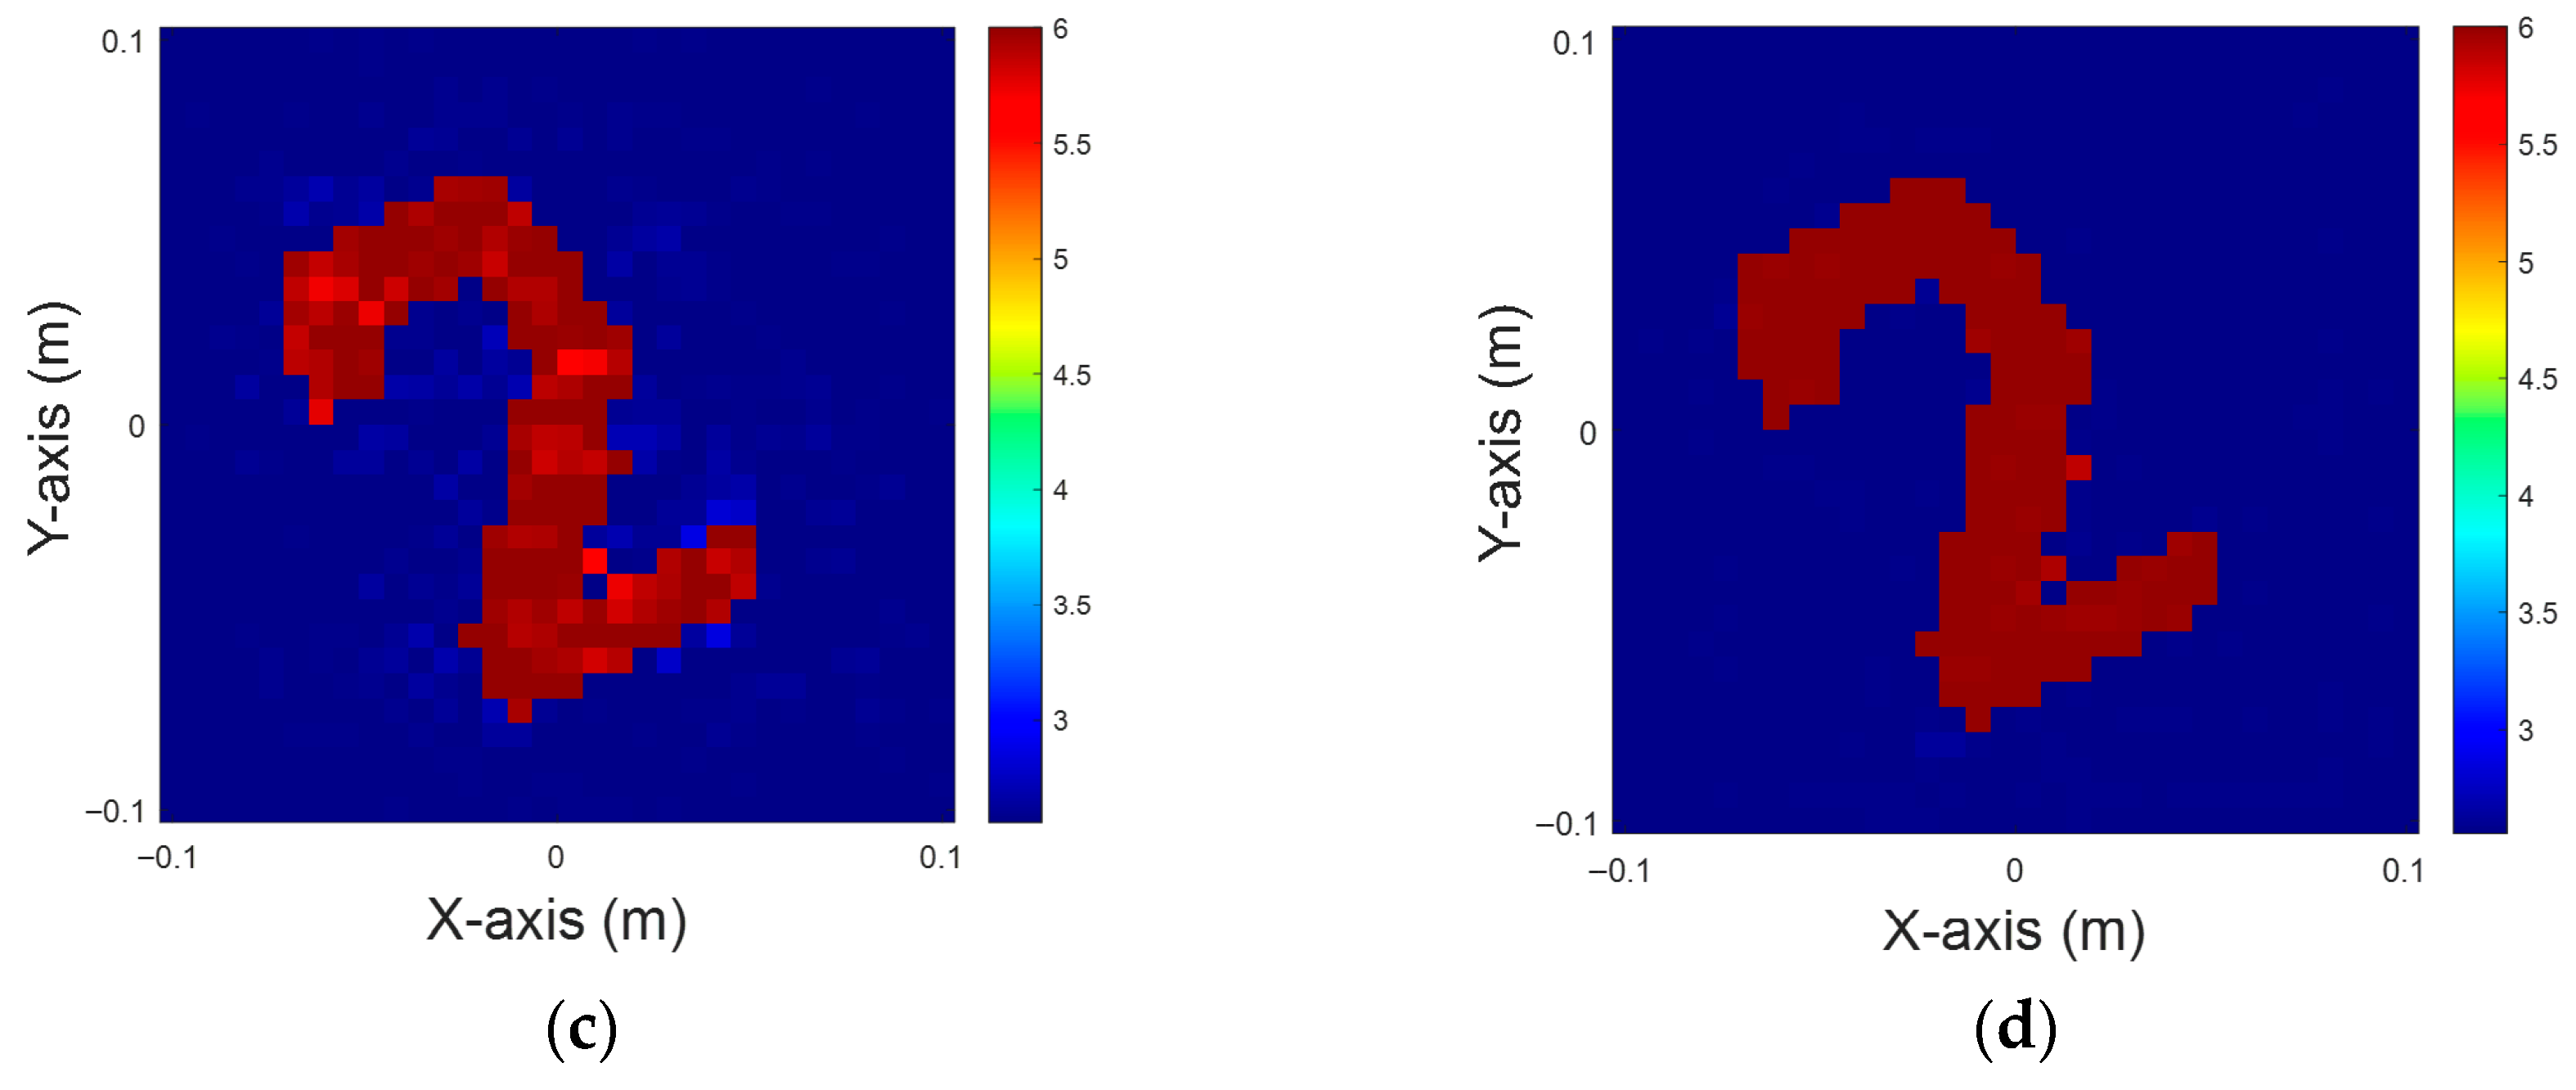
In this study, CSI, DCS, and MCS are evaluated as initial inputs to the U-Net. It is observed that the reconstruction quality of each method degrades significantly when the noise level exceeds 15%. The CSI reconstruction combined with U-Net in Figure 14b is the most severely affected by noise, which not only produces a large number of erroneous reconstructions, but also deforms the shape of the target so much that the internal structure is almost unrecognizable. In contrast, the U-Net reconstruction based on DCS, in Figure 14c, shows a slight improvement in recognizing parts of the digit’s contour. Nevertheless, it still lacks detailed information, resulting in blurred and discontinuous boundaries. Figure 14d shows that the U-Net reconstruction using MCS still exhibits relatively stable reconstruction capability under a high-noise environment. Although the image edges are slightly blurred and the details are distorted in some parts of the image, the overall shape and dielectric distribution are still recognizable and closely match the original distribution. The corresponding NRMSEs and SSIMs of the recovered images are presented in Table 11.
Figure 14. Dielectric constant at six, with 15% noise for TE case. (a) Ground truth. (b) CSI, 10 iterations with U-Net. (c) DCS, three iterations with U-Net. (d) MCS, three iterations with U-Net.
Table 11. NRMSE and SSIM for a dielectric constant at six, with 15% noise for TE case.
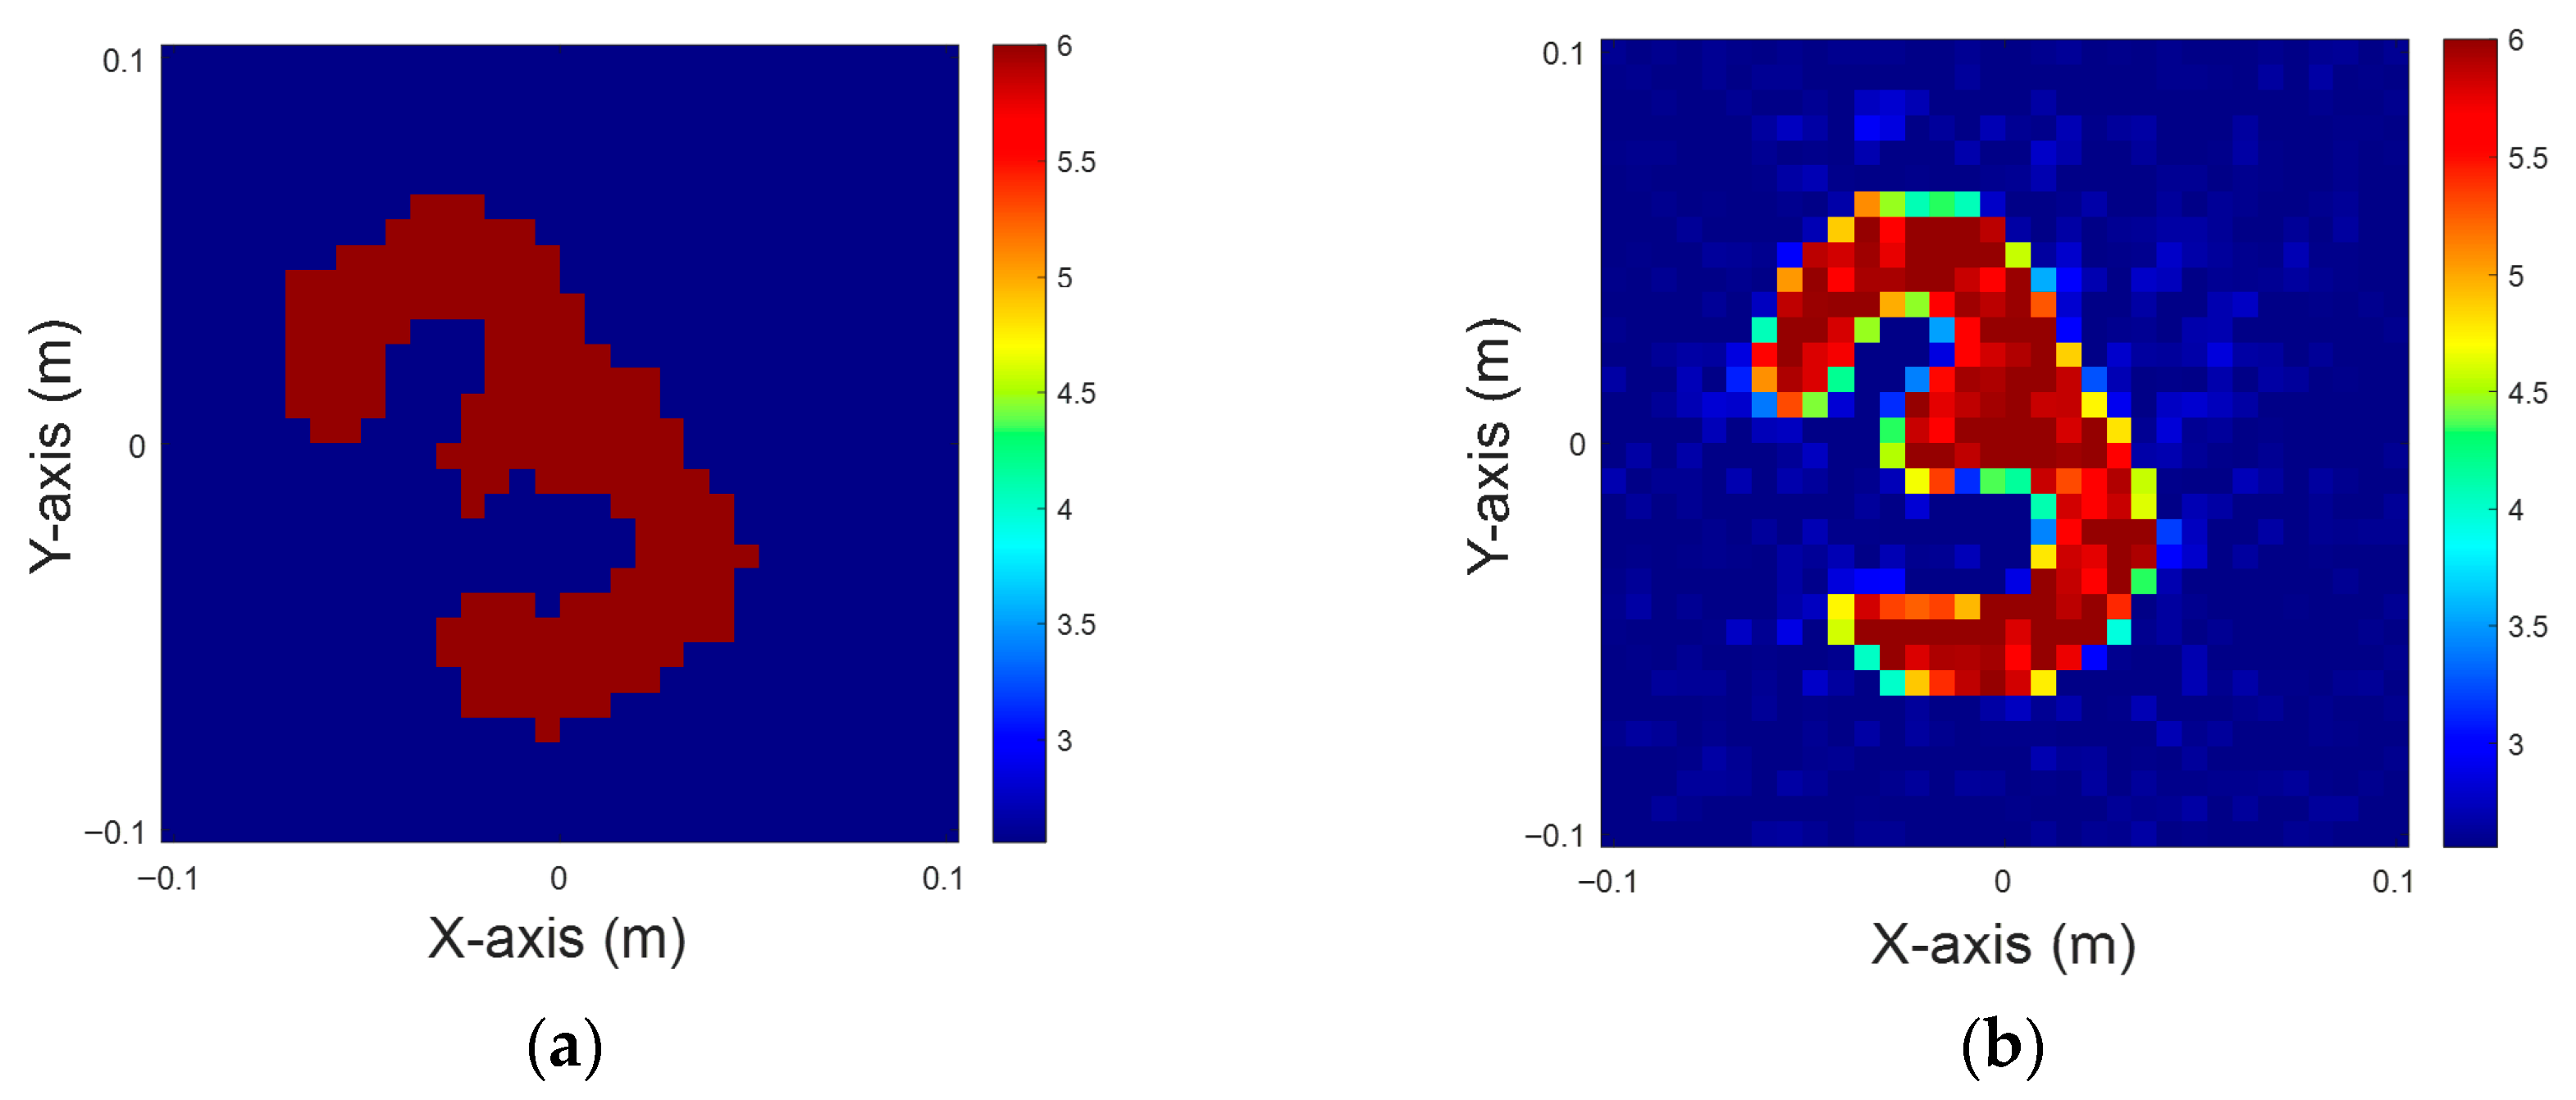
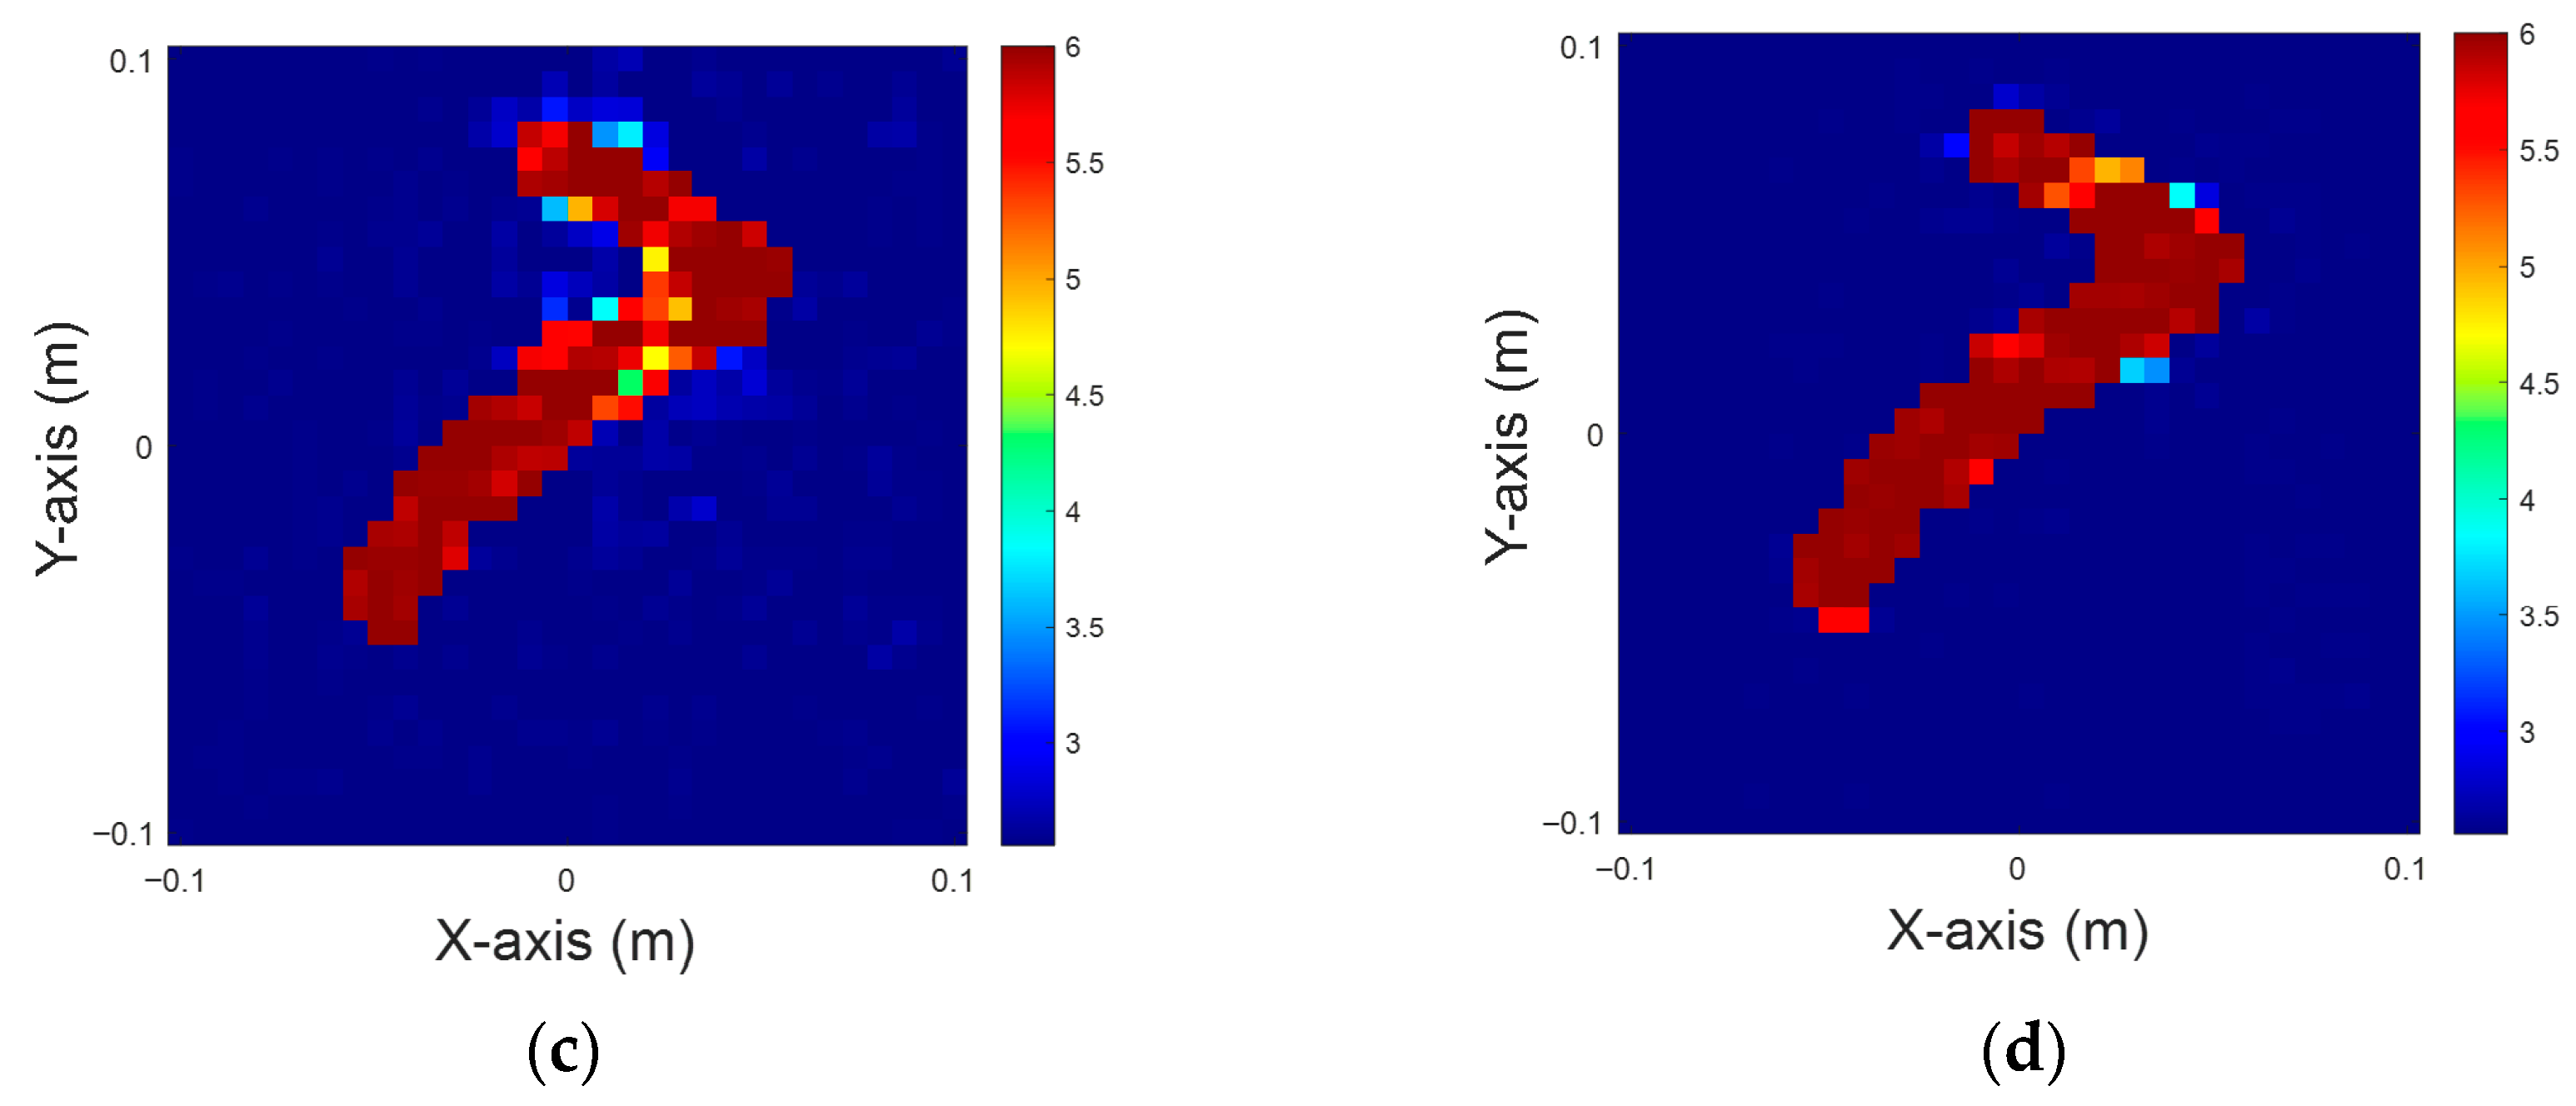
The NRMSE and SSIM metrics of the recovered images are given in Table 12. It is observed that the reconstruction quality is significantly affected under the extreme condition of up to 20% Gaussian noise. The reconstruction result using CSI and U-Net in Figure 15b shows severe distortion and noise disturbance, with a large number of erroneous reconstructed areas in the image, making the shape of the original digit “7” almost unrecognizable. In the DCS combined with U-Net scenario, shown in Figure 15c, the image edge is broken and some details are lost, although part of the contour remains recognizable. In contrast, MCS with U-Net, as shown in Figure 15d, demonstrates relatively stable reconstruction capability even under high noise and retains the outer contour and inner structure more completely, which exhibits a closer match to the true distribution displayed in Figure 15a.
Table 12. NRMSE and SSIM for a dielectric constant at six, with 20% noise for TE case.
Figure 15. Dielectric constant at six, with 20% noise for TE case. (a) Ground truth. (b) CSI, 10 iterations with U-Net. (c) DCS, three iterations with U-Net. (d) MCS, three iterations with U-Net.

4.2.2. Dielectric Constant Between 4 and 10, with 5% Noise for TE Case

In the following scenarios, we attempt to compare three methods—CSI, DCS and MCS—each combined with U-net, to reconstruct more complex dielectric distributions in the TE case. The dielectric constants are distributed between 4 and 6, 6 and 8, and 8 and 10. A total of 32 transmitters and 32 receivers are deployed with 5% Gaussian noise each. Assuming that the scatterers have 10 different dielectric coefficient distributions, and they can be located at any 50 different positions in the domain of interest, in total 500 images (10   ×   50) are used for each context. The dataset is divided into 80% for training and 20% for testing. The initial images are evaluated using 10 iterations of CSI, three iterations of DCS, and three iterations of MCS, each further combined with U-Net.
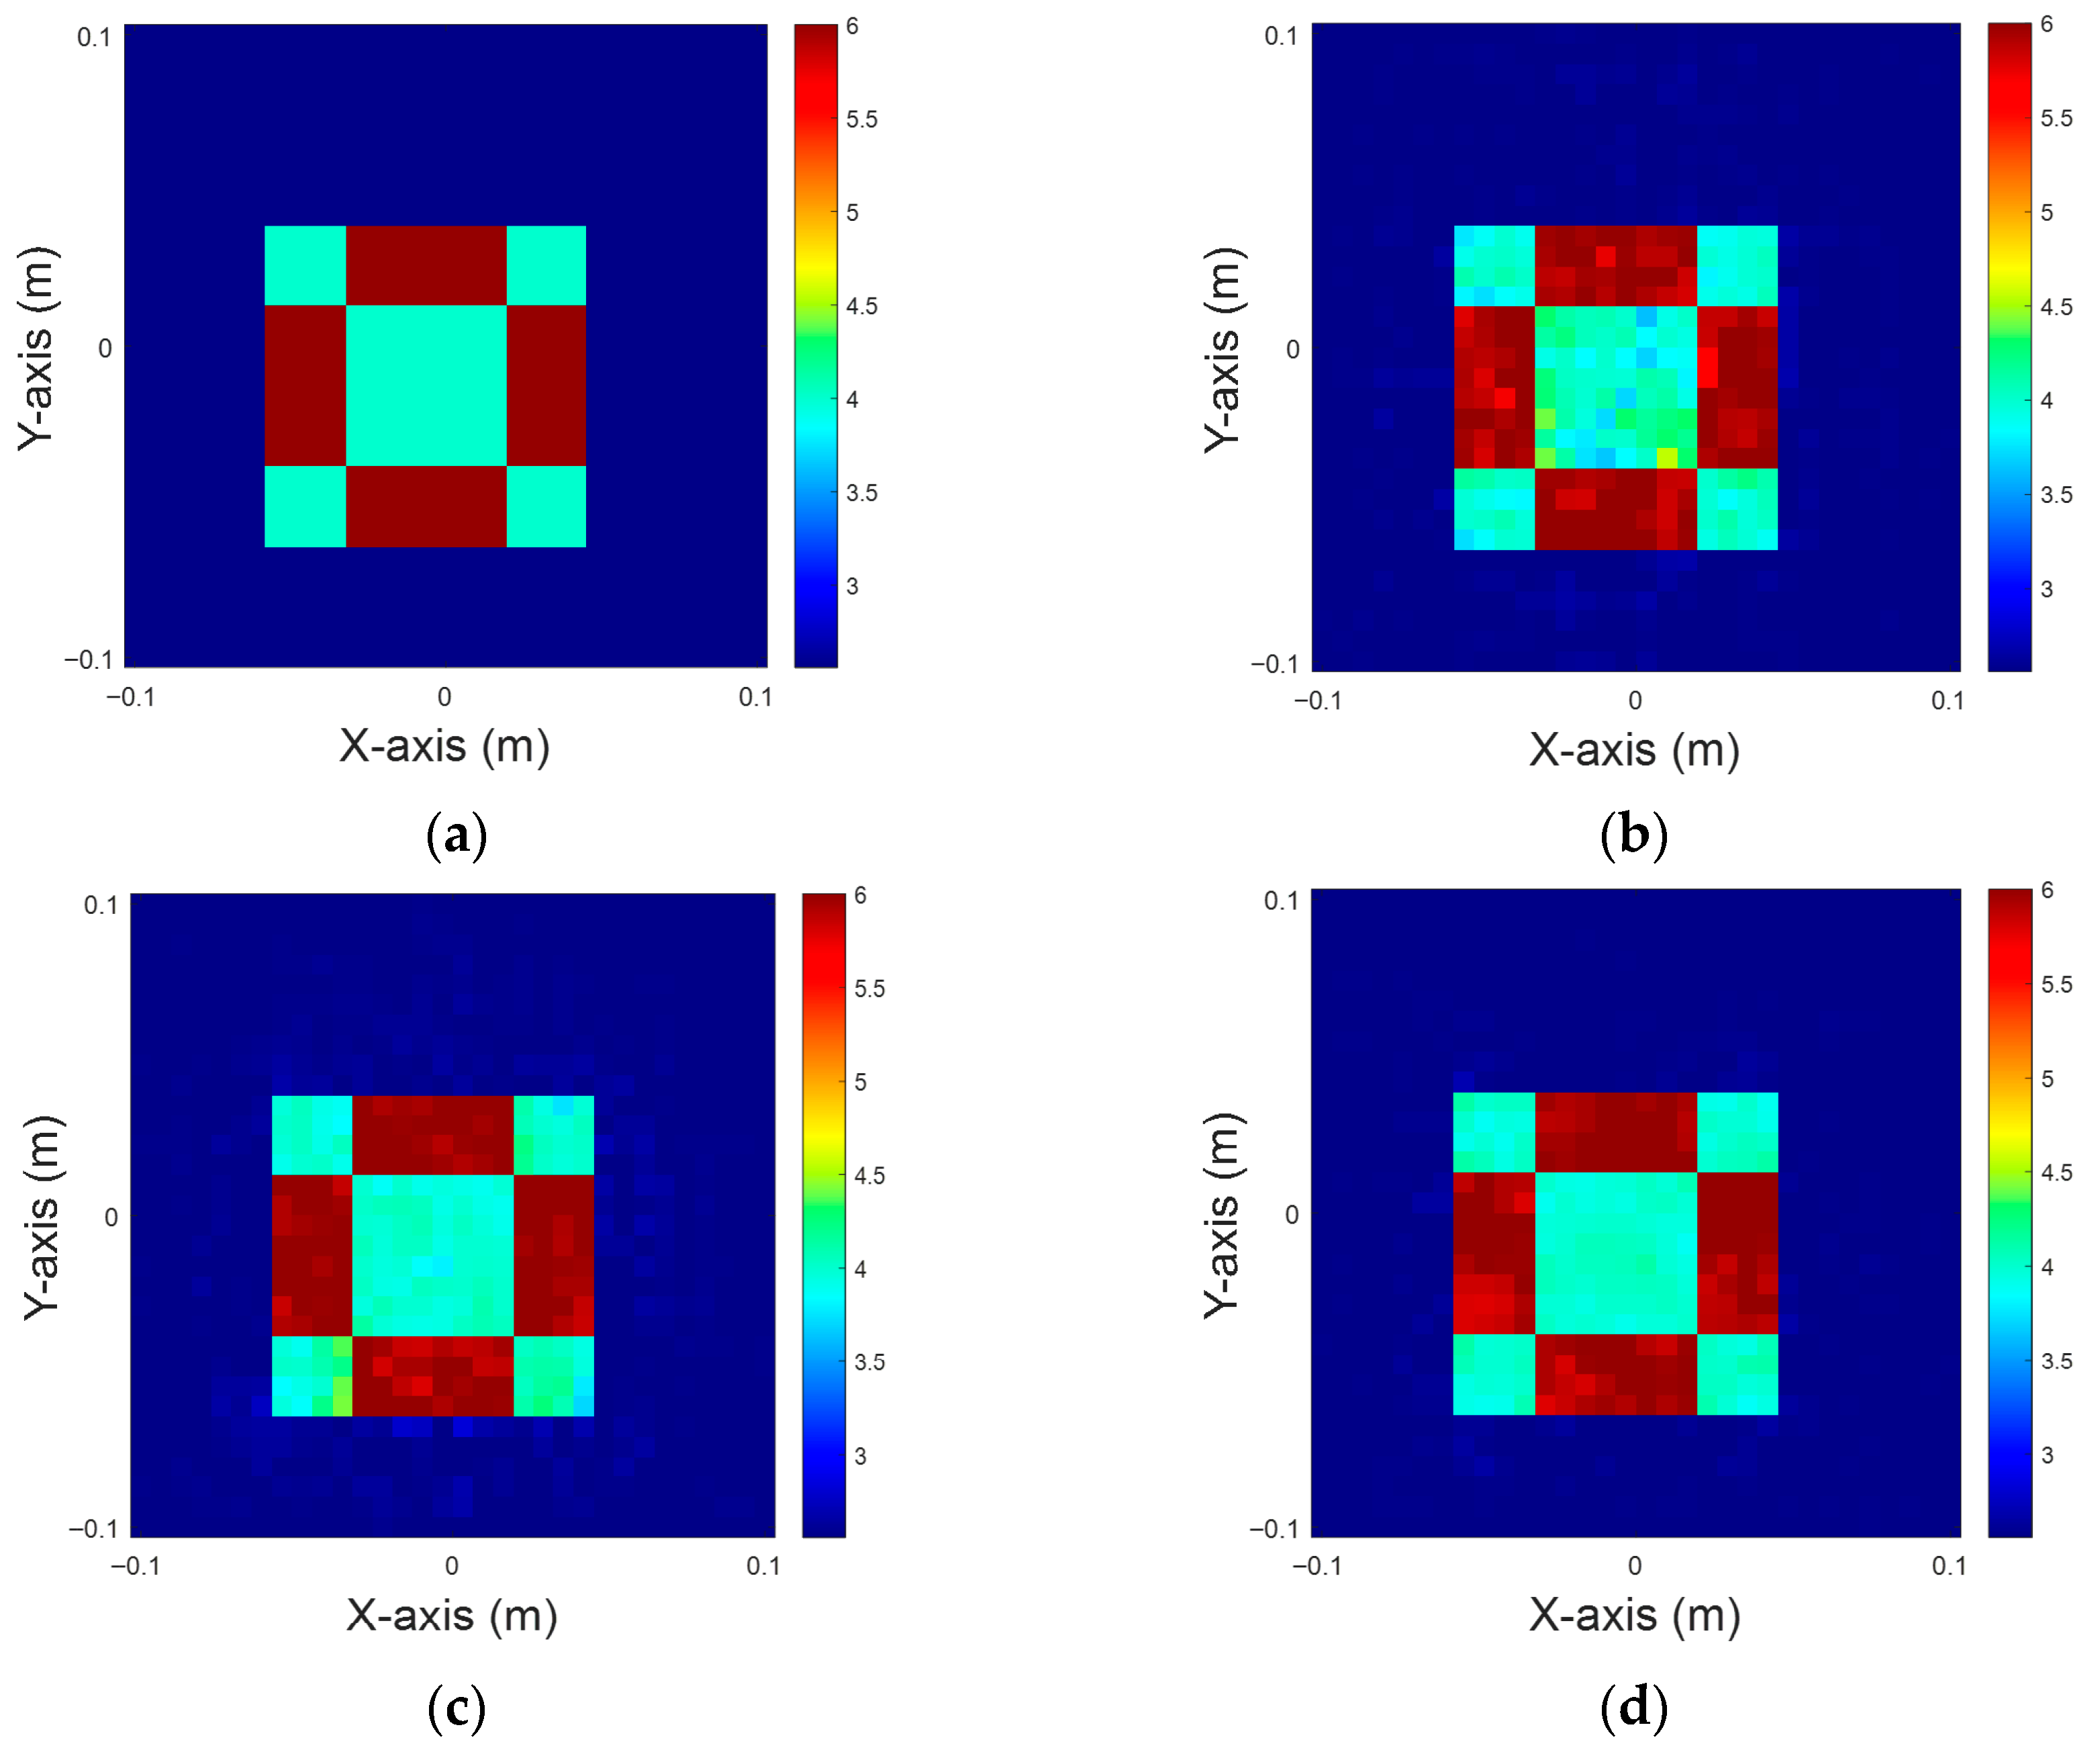
It is observed that the performance of the three methods differs significantly when facing more complex dielectric constant distributions. The result of CSI combined with U-Net, as shown in Figure 16b, is substantially affected by noise. However, the DCS with U-Net, as shown in Figure 16c, has mitigated the noise artifacts. In contrast, the result of MCS combined with U-Net, illustrated in Figure 16d, effectively reconstructs the checkerboard pattern while preserving good geometrical contours and detailed dielectric coefficient variations. In general, MCS combined with U-Net demonstrates higher stability and accuracy in reconstructing the dielectric distribution of complex structures, especially in maintaining fine details and anti-noise capability. The NRMSEs and SSIMs of the recovered images are shown in Table 13.
Figure 16. Dielectric constant between four and six, with 5% noise for TE case. (a) Ground truth. (b) CSI, 10 iterations with U-Net. (c) DCS, three iterations with U-Net. (d) MCS, three iterations with U-Net.
Table 13. NRMSE and SSIM for a dielectric constant between four and six, with 5% noise for TE case.
The NRMSEs and SSIMs of the recovered images are shown in Table 14. It can be seen that the differences in reconstruction performance among the methods become more pronounced for high-contrast target and moderate noise conditions. In addition, the result of CSI with U-Net, as shown in Figure 17b, is more affected by noise, resulting in blurred image outlines, misdiagnosed areas, and artifacts. Although the result of DCS with U-Net, as shown in Figure 17c, can recognize the main areas, the values of the dielectric constants are still significantly out of line. In other words, the method shows limited capability in recovering fine details. In contrast, the reconstruction result of MCS with U-Net, as shown in Figure 17d, not only correctly reproduces the distribution of high and low dielectric regions, but also aligns well with the ground truth image in Figure 17a regarding the overall shape and the value of the permittivity, demonstrating the method’s stability and accuracy under high-contrast targets and medium noise.
Table 14. NRMSE and SSIM for a dielectric constant between six and eight, with 5% noise for TE case.
Figure 17. Dielectric constant between six and eight, with 5% noise for TE case. (a) Ground truth. (b) CSI, 10 iterations with U-Net. (c) DCS, three iterations with U-Net. (d) MCS, three iterations with U-Net.
The NRMSEs and SSIMs of the recovered images are presented in Table 15. Significant differences in reconstruction results are observed among the methods in this high-contrast and noisy scenario. In Figure 18b, the reconstruction error of CSI with U-Net is relatively large, with blurred boundaries, noticeable distortion, and low values in the central region. While the U-Net reconstruction of DCS shown in Figure 18c is slightly better—allowing the main contour to be recognized—the reconstruction of the high-dielectric region remains unstable. In contrast, the U-Net reconstruction of MCS shown in Figure 18d is more stable and accurate in both the boundary and inner regions, successfully preserving the geometrical structure of the core and edges. Moreover, it correctly distinguishes between regions with high and low dielectric constants, making it the closest to the real image shown in Figure 18a.
Table 15. NRMSE and SSIM for a dielectric constant between 8 and 10, with 5% noise for TE case.
Figure 18. Dielectric constant between 8 and 10, with 5% noise for TE case. (a) Ground truth. (b) CSI, 10 iterations with U-Net. (c) DCS, three iterations with U-Net. (d) MCS, three iterations with U-Net.

4.2.3. Dielectric Constant Between Four and Six, with Different Noise

The following section provides the TE case simulation results for a dielectric constant between four and six, with 5%, 10%, 15%, and 20% noise, respectively.
It can be observed that the reconstruction quality of all methods shows a decreasing trend as the noise level gradually increases from 5% (Figure 19b–d) to 20% (Figure 19k–m). For the results of CSI with U-Net displayed in Figure 19b,e,h,k, although the main contours remain recognizable at 5% noise, the reconstruction quality deteriorates as the noise increases, with progressively more blurring, deformation, and visible artifacts. The reconstruction of DCS with U-Net illustrated in Figure 19c,f,i,l maintains a more stable geometry at low to moderate noise. However, at high noise, the reconstruction results of the U-Net using either method, as shown in Figure 19k–m, exhibit a decreasing trend. In contrast, MCS combined with U-Net, as shown in Figure 19d,g,j,m, achieves the best structural restoration and noise immunity at all levels of noise. Even under the highest 20% Gaussian noise simulations, the reconstructed images still clearly preserve the original geometry and dielectric distribution, closely resembling the ground truth shown in Figure 19a.
Figure 19. Dielectric constant between four and six, with 5%, 10%, 15%, and 20% noise for TE case. (a) Ground truth; (bd) 5% noise; (eg) 10% noise; (hj) 15% noise; (km) 20% noise.
In summary, the preliminary estimate generated by MCS, when combined with the deep learning model U-Net, not only improves the reconstruction accuracy, but also demonstrates excellent robustness and reconstruction quality under a noisy environment. Taken together, this finding suggests strong potential for practical applications. Table 16 provides the NRMSEs and SSIMs of the recovered images.
Table 16. NRMSE and SSIM for dielectric constants between four and six, with different noise levels for TE case.
Table 17 summarizes the computational resource data. On a workstation equipped with an Intel Core i7 (4.8 GHz) CPU, 128 GB RAM, and an NVIDIA RTX 40-series GPU, MCS with U-Net requires 22,491 s. Under the same hardware configuration, DCS with U-Net requires 21,077 s, while CSI with U-Net requires 179,288 s across all test cases. Overall, although MCS with U-Net requires slightly more computation time than DCS with U-Net, it achieves superior reconstruction performance. It is worth noting that substantial time is spent on data generation and model training; however, once the model is fully trained, the reconstruction for each test case can be completed in less than one second.
Table 17. Computational resources of the three methods.

5. Conclusions

This study presents a novel electromagnetic image reconstruction framework that integrates MCS with the U-Net deep learning architecture to address the inherent nonlinearity and ill-posedness of the inverse scattering problem in half-space environments. Though conventional inversion techniques such as CSI and DCS demonstrate certain levels of accuracy, their performance often deteriorates in the presence of strong noise, high dielectric contrast, or limited-view measurement conditions. To overcome these challenges, the proposed method utilizes MCS to generate physically meaningful initial reconstructions with only a small number of iterations, which are subsequently refined by U-Net to enhance detail recovery and suppress artifacts. This hybrid approach yields high reconstruction accuracy while significantly reducing computational cost.
A series of systematic simulations are conducted across a broad range of dielectric constants (from 4 to 10) and Gaussian noise levels (5% to 20%). The test targets include both numeric shapes and checkerboard patterns to evaluate geometric generalizability. Across all scenarios, the proposed MCS–U-Net method consistently achieves the lowest NRMSE and the highest SSIM compared to the CSI- and DCS-based frameworks. Notably, under extreme conditions such as 20% noise or sharp permittivity gradients, the MCS–U-Net model maintains superior image fidelity, preserving clear structural contours and stable dielectric profiles. These results highlight the method’s excellent noise resilience and robustness against nonlinear scattering effects.
Beyond accuracy, the proposed framework emphasizes real-time applicability. Unlike traditional schemes that require hundreds of iterations to converge, MCS produces high-quality preliminary images in just a few steps, making the overall pipeline suitable for time-sensitive scenarios. Potential real-world applications include medical diagnostics (e.g., MRI), ground-penetrating radar, landmine detection, and non-destructive material inspection, where both imaging speed and reliability are critical.
Although the proposed framework achieves promising results, several limitations should be acknowledged. Factors such as limited-view conditions, deep burial depth, and the lack of prior knowledge regarding the range of dielectric constants may lead to degraded reconstruction performance. Future work may aim to extend the reconstruction framework to more complex or inhomogeneous dielectric media, potentially incorporating real measurement data. Enhancements to the deep learning model, such as integrating GANs, attention mechanisms, transformers, or multi-scale fusion, may further improve accuracy and generalization. In summary, the proposed MCS–U-Net framework successfully combines physics-driven initialization with data-driven refinement, demonstrating strong potential for solving complex electromagnetic inverse scattering problems. Undoubtedly, this work lays a solid foundation for the development of intelligent electromagnetic imaging technologies and their deployment in practical applications.

Author Contributions

Conceptualization, W.-T.L.; methodology, C.-C.C.; software, P.-H.C. and Y.-C.L.; validation, W.-T.L.; formal analysis, P.-H.C.; investigation, Y.-C.L.; resources, W.-T.L.; data curation, P.-H.C. and H.J.; writing—original draft preparation, Y.-C.L.; writing—review and editing, C.-C.C.; visualization, H.J.; supervision, W.-T.L.; project administration, C.-C.C.; funding acquisition, H.J. All authors have read and agreed to the published version of the manuscript.

Funding

This research was funded by National Science and Technology Council, Taiwan, grant number NSTC 114-2221-E-032-034-.

Data Availability Statement

The original contributions presented in this study are included in the article. Further inquiries can be directed to the corresponding author.

Conflicts of Interest

The authors declare no conflict of interest.

References

  1. Qin, Y.; Rodet, T.; Lambert, M.; Lesselier, D. Microwave breast imaging with prior ultrasound information. IEEE Open J. Antennas Propag. 2020, 1, 472–482. [Google Scholar] [CrossRef]
  2. Wei, T.-F.; Wang, X.-H.; Wang, L.; Feng, Z.; Wang, B.-Z. Efficient Born iterative method for inverse scattering based on modified forward-solver. IEEE Access 2020, 8, 229101–229107. [Google Scholar] [CrossRef]
  3. Zhang, Y.; Lambert, M.; Fraysse, A.; Lesselier, D. Group sparsity penalized contrast source solution method for 2-D non-linear inverse scattering. IEEE Open J. Antennas Propag. 2022, 3, 48–58. [Google Scholar] [CrossRef]
  4. Sun, S.; Dai, D.; Wang, X. A fast algorithm of cross-correlated contrast source inversion in homogeneous background media. IEEE Trans. Antennas Propag. 2023, 71, 4380–4393. [Google Scholar] [CrossRef]
  5. Chiu, C.-C.; Chen, P.-H.; Chien, W.; Lim, E.H.; Chen, G.-Z. Microwave imaging for half-space conductors using the whale optimization algorithm and the spotted hyena optimizer. Appl. Sci. 2023, 13, 5857. [Google Scholar] [CrossRef]
  6. Dubey, P.; Murch, R. Distorted wave extended phaseless Rytov iterative method for inverse scattering problems. IEEE Trans. Geosci. Remote Sens. 2023, 61, 2003612. [Google Scholar] [CrossRef]
  7. Zhong, Y.; Zardi, F.; Salucci, M.; Oliveri, G.; Massa, A. Multiscaling differential contraction integral method for inverse scattering problems with inhomogeneous media. IEEE Trans. Microw. Theory Tech. 2023, 71, 4064–4079. [Google Scholar] [CrossRef]
  8. Yin, T.; Pan, L.; Chen, X. Subspace-based distorted-Rytov iterative method for solving inverse scattering problems. IEEE Trans. Antennas Propag. 2023, 71, 8173–8183. [Google Scholar] [CrossRef]
  9. Liu, Y.; Zhu, Z.; Zhang, B. A novel hybrid regularization method for solving inverse scattering problems. IEEE Trans. Antennas Propag. 2023, 71, 9761–9775. [Google Scholar] [CrossRef]
  10. Liu, Y.; Zhu, Z.; Wang, S.; Zhao, R.; Zhang, B. Proximal alternating direction method of multipliers for solving 3-D electromagnetic inverse scattering problems. IEEE Trans. Microw. Theory Tech. 2024, 72, 981–995. [Google Scholar] [CrossRef]
  11. Li, Z.; Guan, Z.; Han, F. 2-D electromagnetic scattering and inverse scattering from anisotropic objects under TE illumination solved by the hybrid SIM/SEM. IEEE Trans. Antennas Propag. 2024, 72, 3517–3528. [Google Scholar] [CrossRef]
  12. Üregen, E.; Yapar, A. Focusing-based Newton solution for electromagnetic inverse scattering problems. IEEE Trans. Antennas Propag. 2024, 72, 8611–8620. [Google Scholar] [CrossRef]
  13. Wang, M.; Sun, S.; Dai, D.; Zhang, Y.; Su, Y. Cross-correlated subspace-based optimization method for solving electromagnetic inverse scattering problems. IEEE Trans. Antennas Propag. 2024, 72, 8575–8589. [Google Scholar] [CrossRef]
  14. Saurer, M.M.; Na, H.; Brinkmann, M.; Eibert, T.F. On the solution of linearized inverse scattering problems in near-field microwave imaging by operator inversion and matched filtering. arXiv 2025, arXiv:2410.06465. [Google Scholar] [CrossRef]
  15. Li, Y.; Zhu, Q.; Liu, Z. Deep learning for image reconstruction in electrical tomography: A review. IEEE Sens. J. 2025, 25, 14522–14538. [Google Scholar] [CrossRef]
  16. Li, L.; Wang, L.G.; Teixeira, F.L. Performance Analysis and Dynamic Evolution of Deep Convolutional Neural Network for Electromagnetic Inverse Scattering. IEEE Antennas Wirel. Propag. Lett. 2019, 18, 2263–2267. [Google Scholar] [CrossRef]
  17. Xiao, J.; Li, J.; Chen, Y.; Han, F.; Liu, Q.-H. Fast electromagnetic inversion using Born approximation and 3-D U-Net. IEEE Geosci. Remote Sens. Lett. 2020, 17, 1677–1681. [Google Scholar] [CrossRef]
  18. Zhou, Y.; Zhong, Y.; Wei, Z.; Yin, T.; Chen, X. An Improved deep learning scheme for solving 2-D and 3-D inverse scattering problems. IEEE Trans. Antennas Propag. 2021, 69, 2853–2863. [Google Scholar] [CrossRef]
  19. Chiu, C.-C.; Chen, P.-H.; Hao, J. Electromagnetic Imaging of Uniaxial Objects by Artificial Intelligence Technology. IEEE Trans. Geosci. Remote Sens. 2022, 60, 2008414. [Google Scholar] [CrossRef]
  20. Xu, K.; Zhang, C.; Ye, X.; Song, R. Fast Full-Wave Electromagnetic Inverse Scattering Based on Scalable Cascaded Convolutional Neural Networks. IEEE Trans. Geosci. Remote Sens. 2022, 60, 2001611. [Google Scholar] [CrossRef]
  21. Ma, J.; Liu, Z.; Zong, Y. Inverse scattering solver based on deep neural network with total variation regularization. IEEE Antennas Wirel. Propag. Lett. 2023, 22, 2447–2451. [Google Scholar] [CrossRef]
  22. Huang, Y.; Song, R.; Xu, K.; Ye, X.; Li, C.; Chen, X. Deep Learning-Based Inverse Scattering with Structural Similarity Loss Functions. IEEE Sens. J. 2021, 21, 4900–4907. [Google Scholar] [CrossRef]
  23. Hu, H.-J.; Xiao, L.-Y.; Li, J.; Liu, Q.-H. A hybrid forward–inverse neural network with the transceiver-configuration-independent technique for the wideband electromagnetic inverse scattering problem. IEEE Trans. Geosci. Remote Sens. 2024, 62, 2001411. [Google Scholar] [CrossRef]
  24. Topbaş, T.O.; Alkumru, A. A hybrid method for an inverse scattering problem related to cylindrical bodies buried in a half-space. Appl. Math. Sci. Eng. 2023, 31, 2248355. [Google Scholar] [CrossRef]
  25. Chiu, C.-C.; Chen, P.-H.; Chen, Y.-H.; Jiang, H. Self-attention GAN for electromagnetic imaging of uniaxial objects. Appl. Sci. 2025, 15, 6723. [Google Scholar] [CrossRef]
  26. Yao, H.M.; Jiang, L.; Ng, M. Enhanced deep learning approach based on the conditional generative adversarial network for electromagnetic inverse scattering problems. IEEE Trans. Antennas Propag. 2024, 72, 6133–6138. [Google Scholar] [CrossRef]
  27. Chien, W.; Chiu, C.-C.; Chen, P.-H.; Wu, H.-Y.; Lim, E.-H. Electromagnetic imaging of uniaxial objects by two-step neural network. Appl. Sci. 2024, 14, 5624. [Google Scholar] [CrossRef]
  28. Lv, Q.; Ming, X.; Xu, K.; Min, L.; Cao, C.; Li, X. Quantitative imaging by generative adversarial network with data complementation for limited-aperture inverse scattering problem. IEEE Antennas Wirel. Propag. Lett. 2024, 23, 3416–3420. [Google Scholar] [CrossRef]
  29. Du, N.; Wang, J.; Song, R.; Xu, K.; Sun, S.; Ye, X. Inhomogeneous media inverse scattering problem assisted by Swin Transformer network. IEEE Trans. Microw. Theory Tech. 2024, 72, 6809–6820. [Google Scholar] [CrossRef]
  30. Du, C.; Pan, J.; Yang, D.; Hu, J.; Nie, Z.; Chen, Y. Physics-assisted deep learning scheme based on globally perceptive modules for electromagnetic inverse scattering problems. IEEE Trans. Geosci. Remote Sens. 2025, 63, 2000514. [Google Scholar] [CrossRef]
  31. Xing, Z.; Zhang, Z.; Chen, Z.; Wang, Y.; Ma, H.; Wei, Z. VBIM-Net: Variational Born iterative network for inverse scattering problems. IEEE Trans. Geosci. Remote Sens. 2025, 63, 5101516. [Google Scholar] [CrossRef]
  32. Maricar, M.F.; Zakaria, A.; Qaddoumi, N. Attention-U-Net for EM inverse scattering problems in microwave imaging. IEEE Trans. Microw. Theory Tech. 2025, 73, 1290–1304. [Google Scholar] [CrossRef]
  33. Huang, Q.; Li, C.; Ye, X.; Xu, K.; Song, R. Meta-learning-assisted untrained neural network for electromagnetic inverse scattering problems. IEEE Trans. Antennas Propag. 2025, 73, 2548–2560. [Google Scholar] [CrossRef]
  34. Wang, M.; Sun, S.; Zhang, Y.; Dai, D.; Wu, H.; Su, Y. PUP-Net: A twofold physical model embedded 3-D U-Net with polarization fusion for solving inverse scattering problems with a sparse planar array. IEEE Trans. Microw. Theory Tech. 2025, 73, 2123–2136. [Google Scholar] [CrossRef]
  35. Ambrosanio, M.; Franceschini, S.; Autorino, M.M.; Pascazio, V. Convolutional Neural Networks for Tomographic MIMO Ground Penetrating Radar Imaging, Proceedings of the 2021 7th Asia-Pacific Conference on Synthetic Aperture Radar (APSAR), Bali, Indonesia, 1–5 November 2021; IEEE: Piscataway, NJ, USA, 2021; pp. 1–5. [Google Scholar]
Disclaimer/Publisher’s Note: The statements, opinions and data contained in all publications are solely those of the individual author(s) and contributor(s) and not of MDPI and/or the editor(s). MDPI and/or the editor(s) disclaim responsibility for any injury to people or property resulting from any ideas, methods, instructions or products referred to in the content.

Article Metrics

Citations

Article Access Statistics

Multiple requests from the same IP address are counted as one view.