Abstract
In recent years, the deployment of edge servers has attracted significant research interest, with a focus on maximizing their utilization under resource constraint to improve overall efficiency. However, most existing studies concentrate on initial deployment strategies, paying limited attention to approaches involving incremental expansion. As user demands continue to escalate, many edge systems are facing overload situations that hinder their ability to meet performance requirements. To tackle these challenges, this paper introduces an auxiliary edge-server deployment strategy designed to achieve load balancing across edge systems and alleviate local server overloads. The problem is herein referred to as the Auxiliary Edge Server Deployment (A–ESD) problem, and the aim is to determine the optimal deployment scheme for auxiliary edge servers. A–ESD is modeled as a multi-objective optimization problem subject to global constraints and is demonstrated to be NP-hard. An enhanced genetic algorithm called LBA–GA is proposed to efficiently solve the A–ESD problem. The algorithm is designed to maximize overall load balance while minimizing total system delay. Extensive experiments conducted on real-world datasets demonstrate that LBA–GA outperforms existing methods, delivering superior load balancing, reduced latency, and higher cost-effectiveness.
MSC:
68W50
1. Introduction
With the rapid advancement of network communication technologies and the Internet of Things (IoT), the volume of data generated on the Internet is experiencing explosive growth. According to IDC projections, the global datasphere is expected to reach 175ZB by 2025, with this value representing more than a five-fold increase over the 33ZB recorded in 2018 [1]. Cloud computing, as an emerging computational paradigm, offers significant advantages in terms of efficiency, flexibility, and scalability. It effectively supports the processing and storage of massive datasets, thereby injecting new vitality into Internet development. However, with the widespread adoption of IoT devices and the growing demand for real-time processing, latency has become a critical bottleneck that limits the applicability of cloud computing in latency-sensitive scenarios.
To mitigate this challenge, edge computing has emerged as a promising complementary paradigm. By relocating computation and services from the centralized cloud to the network edge—closer to end users and data sources [2]— edge computing facilitates localized data processing and analysis. This proximity considerably reduces transmission latency and bandwidth consumption while improving data security and privacy [3]. As a result, edge computing is increasingly regarded as a vital extension of cloud computing, and their integrated application offers a more comprehensive solution for modern information-processing requirements.
In recent years, edge computing has made substantial progress and has been deployed in numerous domains [4]. However, several challenges remain. Edge servers are typically constrained by cost, energy consumption, and computational capacity. Considering the aim of maximizing their utilization under such limitations, the Edge-Server Deployment (ESD) problem has attracted significant research attention [5,6]. A primary objective in tackling the ESD problem is to optimize the placement of edge servers based on user distribution, thereby improving service efficiency and reducing user-perceived latency.
Numerous approaches have been proposed to address the ESD problem. Researchers have developed various deployment strategies, often modeling the task as an optimization problem under specific performance constraints [7,8,9], such as minimizing latency, maximizing coverage, reducing energy consumption, or lowering costs. Metaheuristic algorithms [10,11,12] and enhanced genetic algorithms [13,14,15] are commonly used to identify optimal or near-optimal deployment configurations.
Despite these efforts, existing methods exhibit several limitations. First, most ESD strategies focus primarily on initial server placement, overlooking the potential for server overload as user requests increase over time, a phenomenon that can severely impact the user experience. Second, many current approaches rely on offloading strategies to alleviate load, thus failing to fundamentally address the shortage of computational resources. Finally, the prevailing deployment methods tend to prioritize latency and cost optimization, often neglecting the crucial objective of achieving system-wide load balance under high-demand conditions.
To enhance user experience and mitigate resource shortages, this paper explores the deployment of auxiliary edge servers as a scalable expansion of existing edge infrastructure [16]. Compared to conventional edge nodes, auxiliary edge servers feature a smaller communication radius and reduced capacity, resulting in lower cost and greater deployment flexibility. This expansion strategy is formalized as the Auxiliary Edge Server Deployment (A–ESD) problem. In contrast to prior work, our approach explicitly incorporates load balancing into the problem formulation. To tackle the NP-hard A–ESD problem effectively, we propose a novel genetic algorithm (GA)-based method named LBA–GA that efficiently identifies high-quality approximate solutions. Our method conducts a comprehensive analysis of users and edge servers within the system, incorporating user-demand satisfaction, server load levels, and connectivity conditions. It subsequently determines the optimal placement for auxiliary edge servers to effectively alleviate load pressure.
The main contributions of this paper are summarized below
- We formalize the A–ESD problem as a constrained multi-objective optimization model with an emphasis on load balancing, and establish its NP-hardness.
- We propose LBA–GA, an enhanced genetic algorithm, to efficiently identify optimal deployment strategies for auxiliary edge servers.
- We conduct extensive experiments on widely used real-world datasets to evaluate the performance of LBA–GA. Results demonstrate that our approach outperforms existing methods in achieving better load balance, lower latency, and higher cost-effectiveness.
The remainder of this paper is organized as follows. Section 2 provides a motivational example for this study. Section 3 introduces the system model and problem formulation. Section 4 presents the proposed algorithm and proves the NP-hardness of the A–ESD problem. Section 5 discusses experimental results and analysis. Related work is reviewed in Section 6. Finally, Section 7 concludes the paper and outlines future research directions.
2. Motivating Example
Figure 1 presents an example of the Auxiliary Edge-Servers Deployment scenario. There is an edge system that consists of a set of edge servers and a set of users . Every user can access edge servers in the coverage area. Please note that the computing and storage resources on the edge server are limited. Each user has many request tasks, all of which require some amount of resources.
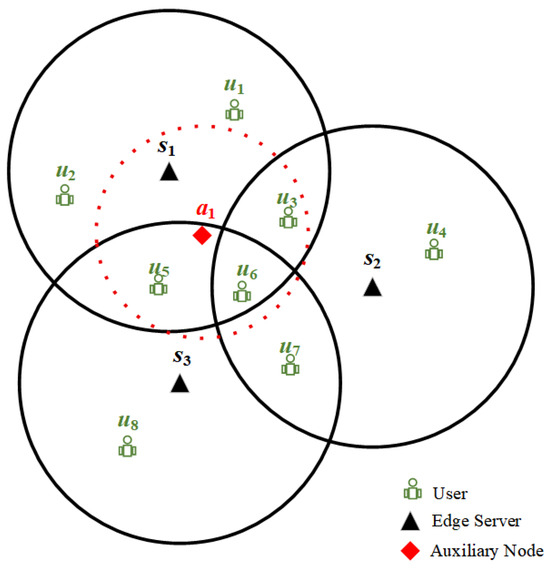
Figure 1.
Example edge system.
Existing studies of the ESD problem assume that no edge server exists in the current region. Then, they choose the deployment locations of edge servers to ensure the lowest overall latency for all users. However, in practice, a certain number of edge servers have already been deployed in many regions. The assumption of starting completely from scratch may not reflect reality. Furthermore, most of the research on load balancing uses resource scheduling to satisfy large numbers of user requests. When an edge server is overloaded, it will send the user’s request to other free edge servers for processing [17,18,19]. While these approaches can alleviate the overload on edge servers to some extent, they do not work when all edge servers (, , and ) are overloaded. There are then no devices in the system with sufficient computational resources. Under those conditions, it becomes necessary to add new computational resources.
However, the addition of computational resources increases costs, and the timing and circumstances of edge-server overloads are variable. Thus, the problem of how to add new computational resources and the extent to which additional resources should be added are important research questions.
Based on the edge system, an auxiliary edge server, denoted as , is integrated to facilitate communication with users and offload requests, as shown in Figure 1. The auxiliary edge server can communicate with users , and . Consequently, these users are able to offload their requests to , thus reducing the load on the original edge servers that were processing these requests and adjusting the overall load distribution. It follows that the location and number of auxiliary edge servers affect the users they can communicate with, which in turn influences the overall load level. Therefore, examining the location and number of auxiliary edge servers is imperative if one is to determine the optimal placement and quantity for overall load balancing in the system.
3. System Model
3.1. Edge System
The main focus of this research is the auxiliary edge-server deployment problem, as presented within the context of pre-existing edge systems. The relevant symbols are shown in Table 1. An edge system consists of a set of edge servers and users.

Table 1.
Symbol table.
Definition 1
(Edge Users ). The set of edge users is defined as . For an edge user, their geographical position is defined by the coordinates .
Definition 2
(User Request). The set of user request demands is defined as , corresponding to each edge user in the user set .
In the initialization phase of the experiment, the values in set Q need to be assigned to the corresponding users according to their indices. Users are permitted to dispatch these requests to appropriate edge servers or auxiliary edge servers for processing based on the actual conditions of the edge system or, alternatively, process them on their own devices.
Definition 3
(Edge servers). The set of edge servers is defined as . For the edge server , its geographical position is defined by the coordinates . Its communication range is defined as , and the set of its maximum load capacity and current load is defined as .
For an edge server , which has a communication range , a maximum load capacity , and a current load , a user that can communicate with must satisfy the following conditions: the geospatial distance between and must be no greater than the communication range, and the remaining load capacity of must be sufficient to meet the current request demand of the user. That is,
The main focus of the A–ESD Problem in this paper is to deploy auxiliary edge servers in existing edge systems to improve load balancing. Therefore, it is necessary to define the auxiliary edge servers themselves.
Definition 4
(auxiliary edge servers). The set of auxiliary edge servers to be deployed is defined as . For an auxiliary edge server , geographical position is defined by the coordinates . Its communication range is defined as , and the set of its maximum load capacity and current load is defined as .
In an approach similar to that used for the edge servers, for an auxiliary edge server , which has a communication range , a maximum load capacity , and a current load , a user capable of communicating with must satisfy the following conditions: the geospatial distance between and must be no greater than the communication range, and the residual load capacity of must be sufficient to meet the current request demand of the user. That is,
The number of auxiliary edge servers is part of the optimization objective and is not predetermined. We initially posit that the number of auxiliary edge servers is p, which will be a variable to be determined during the process. To ensure the smooth operation of the algorithm, it is prudent to establish a maximum threshold for the number of deployable auxiliary edge servers, defined as . This limit should satisfy the following condition:
During the algorithm’s execution, any unused auxiliary edge servers will be designated as idle, and the set of auxiliary edge servers will be capped at elements. This ensures the stability and efficiency of the algorithm’s execution.
When an auxiliary edge server is deployed, its coordinates must not exceed the boundaries of the study area. The lower-left boundary point of the study area is defined as . That is,
where represents the coordinates of the boundary point farthest from the initial point in the study area.
3.2. Load Balancing- and Delay-Aware Model
This paper establishes optimizing load balancing and delay as the objectives of the model.
To effectively address these metrics, it is necessary to quantify their specific performance based on the user-offloading process, thereby deriving concrete values that can measure load balancing and delay.
User requests to the edge system should, whenever feasible, be processed by edge servers. The edge server must fall within the communication range of the user and possess ample idle resources to support request offloading. To achieve better load balancing, it is imperative for users to assess the load levels of edge servers to ascertain whether they are operating beyond capacity, while ensuring that offloading actions contribute positively to the overall load distribution.
User requests are typically routed to the edge server exhibiting the lowest current load level that is within the communication range, thereby enhancing overall load distribution and reducing the incidence of overloading on edge servers. Therefore, it is imperative to precisely delineate the load thresholds of edge servers. Additionally, assessing server-overload status constitutes a critical aspect; hence, establishing unambiguous criteria for overload conditions is essential.
Definition 5
(Load level). The load levels of edge server and auxiliary edge server are defined as and , respectively, representing the percentage of the current load relative to the total load. The critical load level for determining whether an edge server or auxiliary edge server is overloaded is defined as .
The load levels of the edge server and the auxiliary edge server can be expressed as follows:
In this paper, load levels are quantified as percentages to mitigate potential biases in the assessment of actual load levels arising from the heterogeneity of edge servers and auxiliary edge servers.
To reduce the number of auxiliary edge servers deployed, when the resources of the edge system are sufficient, users should refrain from offloading requests to auxiliary edge servers. Only when all edge servers within the user’s communication range are overloaded will users consider offloading requests to auxiliary edge servers. Specifically, when the load level of an edge server reaches , that server is deemed overloaded and ceases to accept new requests from users. If, after attempting to find auxiliary edge servers for offloading, a user still cannot find any available devices and if the overloaded edge server still possesses the capacity to process the request, the request will be returned to that server for processing. This is because, in the absence of available edge servers, users must perform local computations, which significantly degrades the user experience. As this could potentially impair overall load distribution, such a situation should be avoided as much as possible.
During the offloading process, this paper utilizes the system’s overall standard deviation and the average distance between users and the devices to which they offload requests to measure system performance metrics, specifically the overall load-balancing level and the overall delay.
Currently, the standard deviation of edge-server loads is frequently employed as an optimization criterion [6,20]. A lower value indicates a more balanced load distribution within the edge system. Therefore, the standard deviation can be expressed as follows:
where represents the average load ratio of all edge servers.
Employing the distance D as a metric for delay is a common approach in the field of edge-server deployment [13,21]. The following will demonstrate the rationality of using the average distance between users and the devices to which they offload requests to measure delay.
The delay between user and the device to which it offloads tasks can be calculated as follows:
where denotes the data-transmission rate between user and the edge server or auxiliary edge server to which it offloads requests. For a fixed user , is a predetermined value and remains constant, so is related only to and they are negatively correlated. The signal-transmission rate is influenced by numerous interference conditions, making it challenging to express this value with a single formula. These interference factors can be collectively considered, and under an ideal assumption, the calculation formula can be expressed as follows:
where B denotes the signal bandwidth, denotes the transmission power of user , and N denotes the sum of all interferences and noise. In the research scenario of this paper, N can be considered a fixed value. Therefore, for a fixed user , all these variables remain constant, and it can be concluded that is related only to and that they are positively correlated. denotes the channel gain between user and the device to which it offloads tasks. According to the 3GPP technical report, the calculation formula can be expressed as follows:
where denotes the reference channel gain at a distance of 1 m. For a fixed user , remains constant throughout the experiment. Therefore, is solely dependent on the distance between user and the device to which it offloads requests, and they are negatively correlated. Combining the derivations from Equations (10) and (11), it can be concluded that the delay is solely a function of the distance and that they are positively correlated. Therefore, this distance can be used as a standard for measuring the delay of a single user.
The overall system delay can be obtained by averaging the delays of all users. The average distance between users and the devices to which they offload requests can be expressed as follows:
3.3. A–ESD Problem
Definition 6
(Auxiliary Edge-Server Deployment Problem). Based on the derivations from the preceding sections, the A–ESD problem to be studied in this paper can be defined as a quadruple where
is the set of users.
is the set of user request demands
is the set of edge servers.
is the set of auxiliary edge servers.
4. Approach
4.1. Optimization Model
Integrating the insights gleaned in the preceding sections, the optimization model for the A–ESD problem in this paper can be formulated as follows:
s.t.
where represents the set of users associated with the edge server and represents the set of users associated with the auxiliary edge server .
Function (14) is the load-balancing optimization objective, which aims to minimize the overall standard deviation of the edge-server loads. Function (15) is the delay optimization objective, which aims to minimize the average distance between users and the devices to which they offload tasks. Function (16) ensures that the number of deployed auxiliary edge servers does not surpass the predefined maximum. Function (17) ensures that the coordinates of the deployed auxiliary edge servers fall within the predefined boundaries. Function (18) ensures that the distance between users and their offloading devices is within the communication range. Function (19) ensures that users are prohibited from offloading tasks to devices that have insufficient remaining capacity.
4.2. A–ESD Problem Hardness
The Auxiliary Edge Server Deployment (A–ESD) problem is NP-hard. Proof. We establish this by a reduction from the classical capacitated k-median problem, which is well known to be NP-hard [13]. The capacitated k-median problem is defined on a set of clients , a set of candidate facilities , capacity limits for each facility , and a distance metric . The goal is to select at most k facilities such that all clients are assigned to an open facility without violating capacity constraints while minimizing the total assignment cost . To reduce this problem to A–ESD, we let the candidate auxiliary edge servers A correspond directly to the facilities F, while the existing edge servers S are treated as fixed facilities with given residual capacities. The user set U remains unchanged, with identical demand quantities , and the communication ranges are set to be sufficiently large that feasibility is governed solely by the capacity constraints. Under this construction, any feasible solution of the capacitated k-median problem with cost at most B yields an auxiliary deployment in A–ESD with no more than nodes that satisfies constraints (16)–(19) and achieves cost at most B; conversely, any feasible A–ESD solution can be mapped back to a capacitated k-median solution with equivalent feasibility and objective value. Since this reduction is clearly computable in polynomial time, the NP-hardness of the capacitated k-median problem directly implies that A–ESD is also NP-hard.
4.3. LBA–GA Method
4.3.1. Overview of LBA–GA Algorithm
The LBA–GA algorithm is an enhanced approach based on the genetic algorithm. Genetic algorithms generate a random population for the problem and then encode this population, resulting in encoded segments similar to chromosomes in biology. By manipulating these encoded segments and simulating the evolutionary processes guided by a fitness function, the population is continuously optimized to obtain an approximate optimal solution.
Traditional genetic algorithms exhibit limitations when applied to the A–ESD problem, such as inappropriate configurations of the fitness function and insufficient responsiveness to specific problem conditions. Hence, there is a compelling need to refine the genetic algorithm to better address the A–ESD problem.
The pseudocode for the enhanced genetic algorithm, LBA–GA, is shown in Algorithm 1. Firstly, the initial parameters are set; these include population size , number of iterations , crossover probability , and mutation probability (1), Then, a random population of the specified size is generated as the initial population (2). Next, a fitness calculation is performed to obtain the necessary data and fitness values (3). Before the maximum number of iterations is reached, each loop cycle involves selection (7), crossover (8–10, 16–18), and mutation (11–15) operations. At the end of each iteration, a fitness calculation (20) and selection-coefficient calculation (21) are performed. Based on the fitness and selection coefficients, the probability of each individual in the population entering the next generation is calculated (22). The next generation’s population is then formed based on these probabilities and proceeds to the next iteration. Once the maximum number of iterations has been reached, the individual with the highest fitness in the current population is returned, and the approximate solution is obtained by decoding this individual (23–25).
4.3.2. Generation Update of LBA–GA
During the initialization of the population, each individual is regarded as a set of positions for auxiliary edge servers, constructed through the concatenation of the positions of each node. This encompasses all pertinent details regarding the deployment positions of the auxiliary edge servers, which are subsequently encoded into a binary chromosome sequence.
In the fitness-calculation step, to obtain the required variables, auxiliary edge servers should be deployed in the edge system according to the chromosome code. A single offloading process is then performed, and data for various system variables are recorded. Necessary data are extracted for subsequent calculations, and the data from the offloading process are used to supplement and save the attributes of the auxiliary edge servers. In this paper, the load-balancing level serves as the fitness metric and is represented as the reciprocal of the standard deviation of the load levels of all edge servers. The formula can be expressed as follows:
| Algorithm 1: Load balancing-based auxiliary edge-server deployment genetic algorithm (LBA–GA) |
 |
To enhance the convergence velocity of the algorithm, in the crossover process, we forgo the conventional random-crossover approach employed in genetic algorithms; instead, the chromosome code is segmented based on the chromosome code corresponding to each auxiliary edge server. The individuals and are decomposed into and , as depicted in Figure 2. For each corresponding pair of segments and , which correspond to auxiliary edge servers and , the segment exhibiting a lower total delay for the user sets and is selected as the chromosome code segment post-crossover. That is,
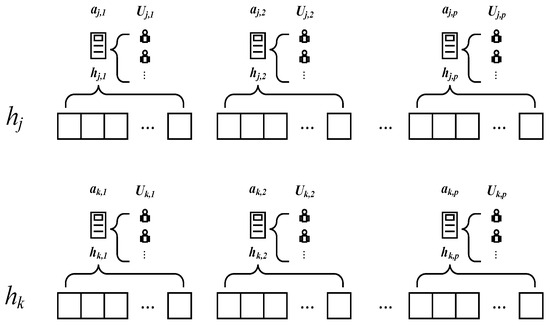
Figure 2.
Chromosome coding segmentation.
This ensures that the resulting offspring possess the superior-performing segment in terms of total delay.
When the crossover process is enhanced with a focus on delay optimization, the delay performance of the offspring chromosome code is optimized and thereby rapidly converges to the optimal solution. By contrast, load balancing, which must be assessed from a global perspective, is challenging to incorporate within local adjustments. To prevent the algorithm from being excessively swayed by delay considerations, which could potentially compromise the optimization of load balancing, an independent traditional crossover probability is employed in the crossover operation. The chromosome code of the offspring individual after crossover is defined as follows:
where denotes the offspring’s individual chromosome code obtained using the improved crossover method proposed in LBA–GA, and denotes the offspring’s individual chromosome code obtained using the traditional crossover method. When a random number meets the criteria for the traditional crossover probability yet fails to meet those for the improved crossover probability, solely the traditional crossover method is applied. This approach accelerates convergence while avoiding the risk of missing the optimal solution.
To broaden the search space and prevent premature convergence, the mutation process is further refined. After the chromosome code based on auxiliary edge servers has been segmented as , a distinct mutation operation is applied to each segment within the group. This entails randomly inverting a bit within the binary representation to derive . The resulting mutated segments are subsequently recombined to constitute as a candidate for the subsequent generation.
However, this approach markedly increases the number of bits that can potentially be mutated and the probability of mutation, thereby potentially resulting in an excessively high mutation rate and thus impeding algorithmic convergence. To address this, a mutation-adjustment coefficient is introduced. This coefficient is derived from the aggregate standard deviation of each solution set, as follows:
where denotes the baseline mutation coefficient, a value established a priori. Adjusting the mutation probability ensures that the likelihood of mutation for higher-performing solutions is proportionally diminished. This approach guarantees that the algorithm, in its pursuit of the optimal solution, sustains stability in convergence throughout the execution process.
To account for the effects of latency and the count of auxiliary edge servers within the algorithm’s deployment, a set of coefficients is defined in the selection step of the genetic algorithm. These coefficients are derived from the average latency across all users within the system and the tally of auxiliary edge servers. The calculation formula is as follows:
where denotes the selection-balancing coefficient, which serves to correlate the number of auxiliary edge servers and the average user latency into the same space. It is calculated as follows:
where denotes the maximum number of auxiliary edge servers among all individuals in the population and denotes the maximum latency among all individuals in the population.
serves as the novel weighting factor in the computation with the fitness set and is subsequently normalized to determine the selection probability for each individual:
Through the modulation of selection probabilities, the influence of delay and the number of auxiliary edge servers deployed are manifested in the subsequent generation of the population.
Upon the conclusion of all iterative processes, the chromosome of the fittest individual in the final population is decoded to yield the auxiliary edge server positions, which constitute the determined solution.
5. Experiments
5.1. Experimental Setup and Dataset
In order to verify the performance of LBA–GA, we evaluate its effectiveness and efficiency experimentally. All experiments are conducted on a computer equipped with an AMD Ryzen 7 6800H CPU, 16 GB RAM, and an NVIDIA GeForce RTX 3060 Laptop GPU. Our approach, as well as the comparative methods, were implemented in Python 3.9.
The experiments are carried out on a public benchmarking dataset, the EUA dataset. It contains 125 edge servers in the Melbourne CBD area in Australia, as shown in Figure 3. The dataset records the latitude and longitude of edge servers and users. It has been used extensively in existing studies. In alignment with the research scenarios for the A–ESD problem, user task data are synthesized following the Zipf distribution, and the communication radius and maximum load capacity of edge servers are defined in the experiment.
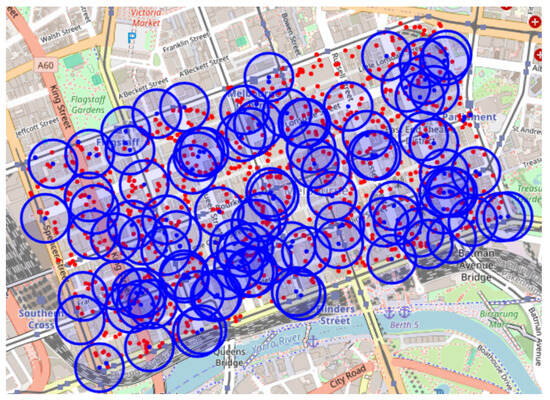
Figure 3.
EUA dataset visualization.
To explore the effectiveness of the method in different situations, this paper employs two distinct experimental configurations based on an existing dataset, depicting scenarios of absolute and relative scarcity of edge system resources. and adjusts the number of auxiliary edge servers deployable to reflect real-world constraints.
5.2. Comparative Methods and Evaluation Metrics
To evaluate the performance of LBA–GA, we compare it with four competing approaches.
- No-Aux: It does not use additional auxiliary edge servers.
- Random-B: It randomly deploys a number of auxiliary edge servers and selects the servers with optimal performance.
- Trad-GA: It uses traditional genetic algorithms to solve the optimization problem.
- HE-GA [13]: It employs a genetic algorithm to find the optimal solution for the deployment of edge servers by calculating the impact on communication.
In the experiments, we employ five evaluation metrics to compare and analyze the results.
- Satisfiability (): It represents a binary indicator used to ascertain whether the task requirements of all users are satisfied.where represents the unprocessed task demand of user .
- Load-Balancing Optimization Rate (): It is measured by the standard deviation reduction ratio to indicate the effectiveness of the method in terms of load balancing.where represents the overall standard deviation of the No-Aux method and represents the overall standard deviation of the current method.
- Delay-Optimization Rate (): It is measured by the reduction ratio of the mean distance to indicate the effectiveness of the method in terms of delay.where represents the overall average distance of the No-Aux method and represents the overall average distance of the current method.
- Load-Balancing Optimization Rate per Node (): It is measured by the reduction ratio of the standard deviation per node to indicate the cost-effectiveness of deploying auxiliary edge servers for load-balancing optimization.
- Delay optimization rate per node (): It is measured by the reduction ratio of the mean distance per node to indicate the cost-effectiveness of deploying auxiliary edge servers for delay optimization.
5.3. Experiment Results and Analyses
In the experiment, the parameters are configured to achieve the optimal performance for the competing methods. The user task demand set Q was simulated based on Zipf’s law. The initial parameters were set as follows: , , , , and . The selection criteria for the initial population size and mutation rates are as shown in Figure 4a,b. We conducted 50 rounds of simulations on Dataset 1 and Dataset 2, respectively. Then, the average value was taken as the final experimental result.
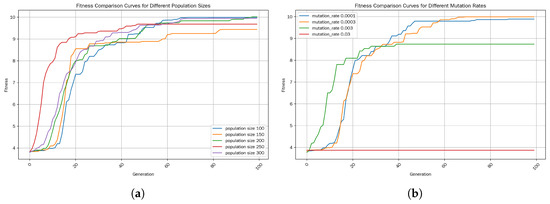
Figure 4.
(a) Fitness-comparison curves for different population sizes. (b) Mutation rates.
5.4. Performance Impact of Parameters
Table 2 summarizes the experimental results on EUA Dataset 1 and Dataset 2 with Laa = 0.8. The No-Aux method fails to satisfy all user demands. Random-B and HE–GA utilize auxiliary servers but achieve only limited improvement due to the lack of a global optimization mechanism. Trad–GA performs better in allocating tasks but shows weaker cost-effectiveness in per-node metrics. In contrast, LBA–GA consistently achieves the best results across all five metrics. Specifically, compared to Trad–GA, LBA–GA improves by 2.19% and 3.22% and by 4.08% and 12.05% on the two datasets, respectively. Furthermore, it achieves higher and demonstrating superior cost-effectiveness. These results confirm that LBA–GA outperforms baselines both in overall performance and in efficiency when deployment of auxiliary servers is limited.
Table 2.
Experimental data sheet for EUA Dataset 1 and EUA Dataset 2 for the case where .
Figure 5 illustrates the load distribution of servers in EUA Dataset 1 with . Under the No-Aux setting, the system shows poor load balance, with several servers overloaded while others remain underutilized. Introducing auxiliary servers alleviates the imbalance to varying degrees. Random-B and HE–GA provide only limited improvement, while Trad–GA significantly reduces the number of overloaded servers. LBA–GA delivers the best results, achieving both lower peak loads and more uniform distribution across servers. This visualization confirms the superior capability of LBA–GA in balancing loads under complex system conditions.
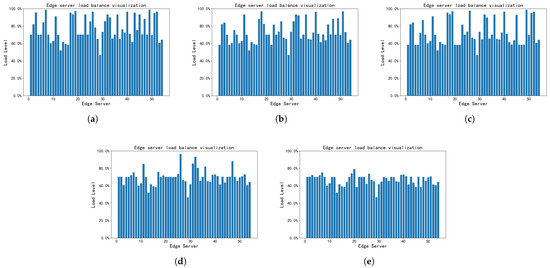
Figure 5.
Visualization of edge-server load balancing by different methods. (a) No-Aux; (b) Random-B; (c) HE–GA; (d) Trad–GA; (e) LBA–GA.
The iteration processes of the LBA–GA and Trad–GA methods are depicted in Figure 6. It compares the convergence curves of Trad–GA and LBA–GA. Trad–GA converges slowly and is prone to local optima in the early iterations. In contrast, LBA–GA, enhanced by improved crossover, mutation, and selection strategies, achieves faster convergence and higher solution quality within fewer iterations. It also maintains stable performance without premature convergence, highlighting its effectiveness in efficiently solving the A–ESD problem.
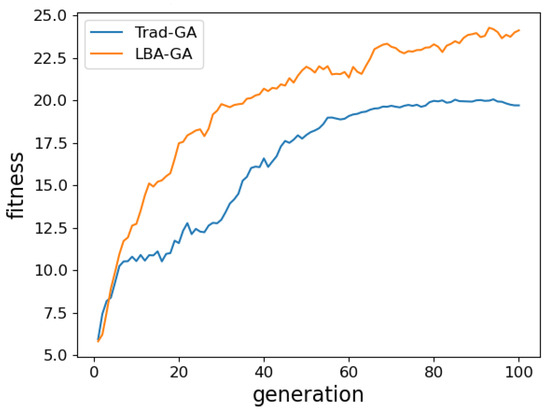
Figure 6.
Iteration process of the genetic algorithm.
5.5. Performance Impacts of Parameters
In addition, to assess the method’s effectiveness and performance trends across varying conditions, several experiments were also conducted for various values in the same edge environment, and the results are depicted in Figure 7 and Figure 8.
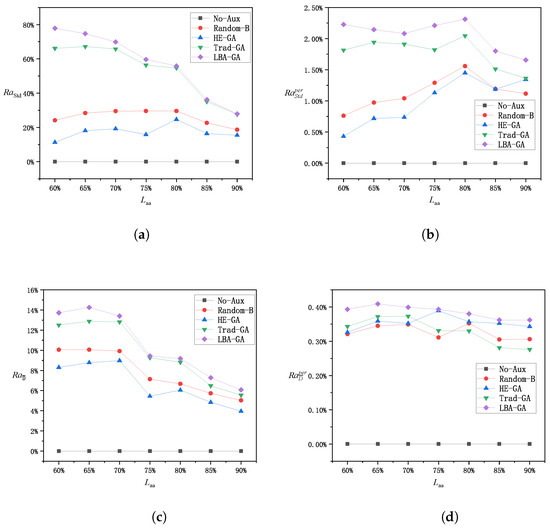
Figure 7.
Performance of each method on Dataset 1. (a) Load-balancing optimization; (b) load-balancing optimization per node; (c) delay optimization; (d) delay optimization per node.
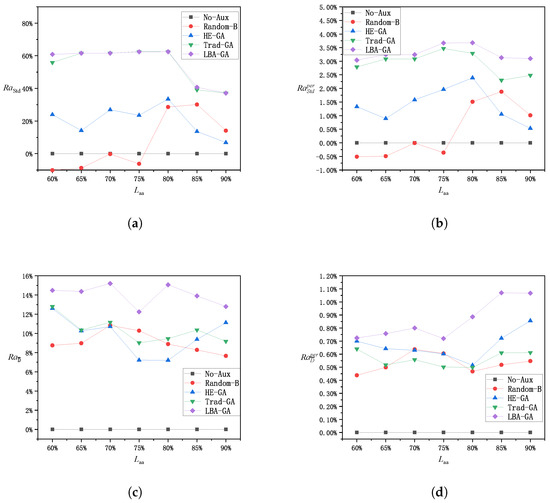
Figure 8.
Performance of each method on Dataset 2. (a) Load-balancing optimization; (b) load-balancing optimization per node; (c) delay optimization; (d) delay optimization per node.
Figure 7a and Figure 8a display the overall optimization level of each method in terms of load-balancing optimization. For Dataset 1, as increases, the need for auxiliary edge servers also increases and the algorithm’s operational flexibility decreases, leading to a gradual decline in the overall load-balancing optimization effect. For Dataset 2, since the overall system resources are more sufficient, a small number of auxiliary edge servers can be used to search for the optimal solution, and it is not until reaches a certain threshold that the disadvantage of reduced operational space becomes apparent. For the Random and HE–GA methods, the absence of global load-balancing considerations during their operation may prevent the algorithms from finding the optimal solution, resulting in inferior outcomes and irregular variations in the standard deviation of the algorithms as changes. The LBA–GA method generally shows greater improvement in load-balancing optimization than Trad–GA across different values, while Trad–GA has more significant advantages over the other methods.
The per-node optimization level of each method in terms of load-balancing optimization is shown in Figure 7b and Figure 8b. Although the effect of the overall load-balancing optimization decreases as the value of increases, the per-node optimization level in terms of standard deviation for each method tends to remain stable, as this also concurrently reduces the number of deployed auxiliary edge servers. The LBA–GA method exhibits a more pronounced advantage over the other methods; therefore, it is concluded that the LBA–GA method is superior for both overall load-balancing optimization and the cost-effectiveness of load-balancing optimization.
The overall optimization level of each method in terms of delay is demonstrated in Figure 7c and Figure 8c. For Dataset 1, as increases, the need for auxiliary edge servers increases and the operational space for the algorithm is reduced, resulting in a gradual reduction in the overall optimization of the delay. In contrast, in Dataset 2, the overall delay is less sensitive to changes in . The LBA–GA method generally outperforms the other methods in terms of average improvement across different values and holds a more significant advantage.
The per-node optimization level of each method in terms of delay, as presented in Figure 7d and Figure 8d, indicates that for Dataset 1, although the overall standard deviation effect diminishes as increases, the per-node optimization level in terms of standard deviation for each method tends to remain stable, as this approach also concurrently reduces the number of auxiliary edge servers deployed. For Dataset 2, although the overall delay changes little, the per-node improvement becomes greater as the number of auxiliary edge servers decreases at higher values. When the methods are compared, the performance difference is not significant, and LBA–GA is concluded to be the best-performing method across all scenarios.
Overall, the LBA–GA method demonstrates significant advantages in load-balancing optimization, both in terms of overall improvement and cost-effectiveness, compared to other methods. Additionally, it sustains superior performance in terms of latency while ensuring load-balancing optimization. Therefore, it can be concluded that the LBA–GA method is effective and superior in addressing the A–ESD problem proposed in this paper.
6. Related Work
During the deployment of edge servers, a multitude of factors must be taken into account. Among these, geographical location is of paramount importance due to the high sensitivity of edge servers to distance. The performance of the edge system can exhibit substantial variation across different environments, and the objectives of research on edge-server deployment can differ significantly as well. Therefore, identifying effective deployment strategies for edge servers and the selection of appropriate specifications to achieve specific goals are crucial research goals [22,23].
To optimize edge-server deployment, a variety of multi-objective and heuristic strategies have been proposed in recent studies. Ye et al. [13] proposed a scheme for edge-server deployment that combines multi-objective optimization methods and genetic algorithms. By iteratively determining the number of servers through probabilistic modeling and then optimizing their locations, they achieved load balancing while also minimizing delay and energy consumption. Lovén et al. [16] employed a method for edge-server deployment that considers a large number of constraints and parameters to expand edge servers in a system that already contains deployed edge servers, achieving load balancing and demonstrating stability [24]. Cao et al. [25] introduced a clustering method where the clustering radius varies with density, along with an improved multi-objective optimization technique, and presented a six-objective optimization framework for large-scale vehicular networks. Given the complexity of the edge-server deployment problem, it is generally modeled as a multi-objective optimization problem [21], which can be effectively addressed using evolutionary or heuristic algorithms. Chang et al. [26] analyzed vehicle trajectories for urban vehicular services and proposed a heuristic multi-objective optimization method for roadside edge-server deployment. Zhang et al. [27] developed an integrated approach using clustering algorithms and nonlinear programming to jointly optimize the deployment of both edge servers and services. Ling et al. [28] employed a graph convolutional network-based traffic prediction model to inform edge-server placement, thereby reducing overall deployment cost and the frequency of server overload. To enhance robustness, Cui et al. [29] formulated a k-edge server-placement problem considering possible server failures and solved it using an integer programming-based optimization approach. Chen et al. [30] proposed a preference-aware placement method that accounts for user query behavior across different regions, demonstrating improved performance on large-scale datasets. Jasim et al. [9] applied edge-server deployment to the healthcare domain, developing an optimal placement algorithm that enhances service efficiency, cost-effectiveness, and response latency. Liu et al. [31] addressed the security challenges in Web 3.0 vehicular networks by proposing a non-cooperative game-theoretic placement scheme integrated with anomaly-detection mechanisms to enhance deployment security.
Currently, significant progress has been made in the research on edge-server deployment, yet certain limitations persist. Existing approaches rarely consider the incremental deployment of new servers into an already existing system under overload conditions. In contrast, our work explicitly addresses this gap by formulating the Auxiliary Edge Server Deployment (A–ESD) problem, which emphasizes load balancing and incremental scalability.
7. Conclusions and Future Work
This paper studies a server-deployment scheme for the auxiliary edge-server deployment problem (A–ESD Problem) and includes load-balancing optimization in the optimal objective. By deploying lightweight auxiliary edge servers, it addresses the severe resource-shortage problem in edge systems. First, the paper formalizes the A–ESD Problem, models it as a constrained optimization problem, and proves its NP-hardness. To effectively solve the A–ESD Problem, this paper presents an improved method based on genetic algorithms, called LBA–GA, which searches for the optimal deployment positions of auxiliary edge servers to achieve the best possible load balance. Extensive experiments were conducted on real-world datasets to evaluate the performance of LBA–GA. The experimental results show that the LBA–GA method demonstrates significant advantages over the compared methods across multiple metrics.
In future work, we plan to introduce the time-varying characteristics of user locations and request demands. We will conduct research on server expansion in a time-varying edge environment to explore strategies for dynamic edge-server deployment. We also intend to investigate the runtime complexity and convergence of the proposed algorithm and to design more efficient variants to improve scalability and practical applicability.
Author Contributions
Conceptualization, S.N. and B.Z.; methodology, S.N. and K.L.; software, X.Z. and S.W.; validation, X.Z., S.W. and K.L.; formal analysis, G.Z.; investigation, S.N.; resources, B.Z.; data curation, G.Z.; writing—original draft preparation, X.Z.; writing—review and editing, X.Z. and S.W.; visualization, K.L.; supervision, G.Z. and B.Z.; project administration, S.N.; funding acquisition, G.Z. and B.Z. All authors have read and agreed to the published version of the manuscript.
Funding
This work was supported in part by Natural Science Foundation of Xinjiang Uygur Autonomous Region under Grant No. 2022D01A236, National Natural Science Foundation of China under Grants 62272290, Shanghai Central Guide Local Science and Technology Development Fund Projects under Grant No. YDZX20253100004004005.
Data Availability Statement
The original contributions presented in the study are included in the article; further inquiries can be directed to the corresponding author.
Acknowledgments
The authors would like to thank Qiang He for the contributors of the EUA dataset, which were essential for model validation. We also appreciate all of the anonymous reviewers for their insightful suggestions and useful comments that will significantly improve the quality of our manuscript.
Conflicts of Interest
The authors declare no conflicts of interest.
References
- Reinsel, D.; Gantz, J.; Rydning, J. Data Age 2025: The Evolution of Data to Life-Critical. Report. 2017. Available online: https://www.seagate.com/www-content/our-story/trends/files/Seagate-WP-DataAge2025-March-2017.pdf (accessed on 12 April 2022).
- Shi, W.; Cao, J.; Zhang, Q.; Li, Y.; Xu, L. Edge computing: Vision and challenges. IEEE Internet Things J. 2016, 3, 637–646. [Google Scholar] [CrossRef]
- Kong, L.; Tan, J.; Huang, J.; Chen, G.; Wang, S.; Jin, X.; Zeng, P.; Khan, M.; Das, S.K. Edge-computing-driven internet of things: A survey. ACM Comput. Surv. 2022, 55, 1–41. [Google Scholar] [CrossRef]
- Chinnasamy, P.; Rojaramani, D.; Praveena, V.; Annlin Jeba, S.; Bensujin, B. Data Security and Privacy Requirements in Edge Computing: A Systemic Review. Cases Edge Comput. Anal. 2021, 171–187. [Google Scholar]
- Wang, Z.; Zhou, Y.; Jin, X.; Chen, Y.; Lu, C. An edge server deployment approach for delay reduction and reliability enhancement in the industrial internet. Wirel. Netw. 2024, 30, 5743–5757. [Google Scholar] [CrossRef]
- Ghasemzadeh, A.; Aghdasi, H.S.; Saeedvand, S. Edge server placement and allocation optimization: A tradeoff for enhanced performance. Clust. Comput. 2024, 27, 5783–5797. [Google Scholar] [CrossRef]
- Li, Q.; Wang, S.; Zhou, A.; Ma, X.; Yang, F.; Liu, A.X. QoS driven task offloading with statistical guarantee in mobile edge computing. IEEE Trans. Mob. Comput. 2020, 21, 278–290. [Google Scholar] [CrossRef]
- Mondal, S.; Ruffini, M. Optical front/mid-haul with open access-edge server deployment framework for sliced O-RAN. IEEE Trans. Netw. Serv. Manag. 2022, 19, 3202–3219. [Google Scholar] [CrossRef]
- Jasim, A.M.; Al-Raweshidy, H. Optimal intelligent edge-servers placement in the healthcare field. IET Netw. 2024, 13, 13–27. [Google Scholar] [CrossRef]
- Yin, L.; Sun, J.; Zhou, J.; Gu, Z.; Li, K. ECFA: An Efficient Convergent Firefly Algorithm for Solving Task Scheduling Problems in Cloud-Edge Computing. IEEE Trans. Serv. Comput. 2023, 16, 3280–3293. [Google Scholar] [CrossRef]
- Asghari, A.; Sayadi, M.; Azgomi, H. Energy-aware edge server placement using the improved butterfly optimization algorithm. J. Supercomput. 2023, 79, 14954–14980. [Google Scholar] [CrossRef]
- Havas, S.; Azizi, S.; Abdollahpouri, A. A Multistart Power of d Choices Strategy for Edge Server Placement Problem. In Proceedings of the 2023 7th International Conference on Internet of Things and Applications (IoT), Xining, China, 25–27 August 2023; pp. 1–6. [Google Scholar]
- Ye, H.; Cao, B.; Liu, J.; Li, P.; Tang, B.; Peng, Z. An edge server deployment method based on optimal benefit and genetic algorithm. J. Cloud Comput. 2023, 12, 148. [Google Scholar] [CrossRef]
- Cui, G.; He, Q.; Chen, F.; Jin, H.; Yang, Y. Trading off between user coverage and network robustness for edge server placement. IEEE Trans. Cloud Comput. 2020, 10, 2178–2189. [Google Scholar] [CrossRef]
- Song, H.; Gu, B.; Son, K.; Choi, W. Joint optimization of edge computing server deployment and user offloading associations in wireless edge network via a genetic algorithm. IEEE Trans. Netw. Sci. Eng. 2022, 9, 2535–2548. [Google Scholar] [CrossRef]
- Lovén, L.; Lähderanta, T.; Ruha, L.; Leppänen, T.; Peltonen, E.; Riekki, J.; Sillanpää, M.J. Scaling up an Edge Server Deployment. In Proceedings of the 2020 IEEE International Conference on Pervasive Computing and Communications Workshops (PerCom Workshops), Austin, TX, USA, 23–27 March 2020; pp. 1–7. [Google Scholar]
- Raeisi-Varzaneh, M.; Dakkak, O.; Habbal, A.; Kim, B.S. Resource scheduling in edge computing: Architecture, taxonomy, open issues and future research directions. IEEE Access 2023, 11, 25329–25350. [Google Scholar] [CrossRef]
- Elgendy, I.A.; Meshoul, S.; Hammad, M. Joint Task Offloading, Resource Allocation, and Load-Balancing Optimization in Multi-UAV-Aided MEC Systems. Appl. Sci. 2023, 13, 2625. [Google Scholar] [CrossRef]
- Shruthi, G.; Mundada, M.R.; Supreeth, S.; Gardiner, B. Deep learning-based resource prediction and mutated leader algorithm enabled load balancing in fog computing. Int. J. Comput. Netw. Inf. Secur. 2023, 15, 84–95. [Google Scholar] [CrossRef]
- Kasi, S.K.; Kasi, M.K.; Ali, K.; Raza, M.; Afzal, H.; Lasebae, A.; Naeem, B.; Ul Islam, S.; Rodrigues, J.J. Heuristic edge server placement in industrial internet of things and cellular networks. IEEE Internet Things J. 2020, 8, 10308–10317. [Google Scholar] [CrossRef]
- Luo, F.; Zheng, S.; Ding, W.; Fuentes, J.; Li, Y. An Edge Server Placement Method Based on Reinforcement Learning. Entropy 2022, 24, 317. [Google Scholar] [CrossRef]
- Li, B.; Hou, P.; Wu, H.; Hou, F. Optimal edge server deployment and allocation strategy in 5G ultra-dense networking environments. Pervasive Mob. Comput. 2021, 72, 101312. [Google Scholar] [CrossRef]
- Asghari, A.; Sohrabi, M.K. Multiobjective edge server placement in mobile-edge computing using a combination of multiagent deep q-network and coral reefs optimization. IEEE Internet Things J. 2022, 9, 17503–17512. [Google Scholar] [CrossRef]
- Lähderanta, T.; Leppänen, T.; Ruha, L.; Lovén, L.; Harjula, E.; Ylianttila, M.; Riekki, J.; Sillanpää, M.J. Edge server placement with capacitated location allocation. arXiv 2019, arXiv:1907.07349. [Google Scholar] [CrossRef]
- Cao, B.; Fan, S.; Zhao, J.; Tian, S.; Zheng, Z.; Yan, Y.; Yang, P. Large-scale many-objective deployment optimization of edge servers. IEEE Trans. Intell. Transp. Syst. 2021, 22, 3841–3849. [Google Scholar] [CrossRef]
- Chang, L.; Deng, X.; Pan, J.; Zhang, Y. Edge server placement for vehicular ad hoc networks in metropolitans. IEEE Internet Things J. 2021, 9, 1575–1590. [Google Scholar] [CrossRef]
- Zhang, X.; Li, Z.; Lai, C.; Zhang, J. Joint edge server placement and service placement in mobile-edge computing. IEEE Internet Things J. 2021, 9, 11261–11274. [Google Scholar] [CrossRef]
- Ling, C.; Feng, Z.; Xu, L.; Huang, Q.; Zhou, Y.; Zhang, W.; Yadav, R. An edge server placement algorithm based on graph convolution network. IEEE Trans. Veh. Technol. 2022, 72, 5224–5239. [Google Scholar] [CrossRef]
- Cui, G.; He, Q.; Xia, X.; Chen, F.; Jin, H.; Yang, Y. Robustness-oriented k Edge Server Placement. In Proceedings of the 2020 20th IEEE/ACM International Symposium on Cluster, Cloud and Internet Computing (CCGRID), Melboune, Australia, 11–14 May 2020; pp. 81–90. [Google Scholar]
- Chen, Y.; Lin, Y.; Zheng, Z.; Yu, P.; Shen, J.; Guo, M. Preference-Aware Edge Server Placement in the Internet of Things. IEEE Internet Things J. 2022, 9, 1289–1299. [Google Scholar] [CrossRef]
- Liu, Z.; Xu, X.; Han, F.; Zhao, Q.; Qi, L.; Dou, W.; Zhou, X. Secure edge server placement with non-cooperative game for internet of vehicles in web 3.0. IEEE Trans. Netw. Sci. Eng. 2023, 11, 4020–4031. [Google Scholar] [CrossRef]


Disclaimer/Publisher’s Note: The statements, opinions and data contained in all publications are solely those of the individual author(s) and contributor(s) and not of MDPI and/or the editor(s). MDPI and/or the editor(s) disclaim responsibility for any injury to people or property resulting from any ideas, methods, instructions or products referred to in the content. |
© 2025 by the authors. Licensee MDPI, Basel, Switzerland. This article is an open access article distributed under the terms and conditions of the Creative Commons Attribution (CC BY) license (https://creativecommons.org/licenses/by/4.0/).