Article

Novel Gaussian-Decrement-Based Particle Swarm Optimization with Time-Varying Parameters for Economic Dispatch in Renewable-Integrated Microgrids

by
Yuan Wang
1,*,
Wangjia Lu
1,
Wenjun Du
2,3 and
Changyin Dong
4,5
1
College of Mechanical Engineering, Zhejiang University of Technology, Hangzhou 310023, China
2
Zhejiang Institute of Communications Co., Ltd., Hangzhou 310030, China
3
Key Laboratory of Transport Industry of Comprehensive Transportation Theory, Hangzhou 310030, China
4
School of Aeronautics, Northwestern Polytechnical University, Xi’an 710072, China
5
National Key Laboratory of Aircraft Configuration Design, Xi’an 710072, China
*
Author to whom correspondence should be addressed.
Mathematics 2025, 13(15), 2440; https://doi.org/10.3390/math13152440
Submission received: 21 June 2025 / Revised: 25 July 2025 / Accepted: 28 July 2025 / Published: 29 July 2025

Abstract

Background: To address the uncertainties of renewable energy power generation, the disorderly charging characteristics of electric vehicles, and the high electricity cost of the power grid in expressway service areas, a method of economic dispatch optimization based on the improved particle swarm optimization algorithm is proposed in this study. Methods: Mathematical models of photovoltaic power generation, energy storage systems, and electric vehicles were established, thereby constructing the microgrid system model of the power load in the expressway service area. Taking the economic cost of electricity consumption in the service area as the objective function and simultaneously meeting constraints such as power balance, power grid interactions, and energy storage systems, a microgrid economy dispatch model is constructed. An improved particle swarm optimization algorithm with time-varying parameters of the inertia weight and learning factor was designed to solve the optimal dispatching strategy. The inertia weight was improved by adopting the Gaussian decreasing method, and the asymmetric dynamic learning factor was adjusted simultaneously. Findings: Field case studies demonstrate that, compared to other algorithms, the improved Particle Swarm Optimization algorithm effectively reduces the operational costs of microgrid systems while exhibiting accelerated convergence speed and enhanced robustness. Value: This study provides a theoretical mathematical reference for the economic dispatch optimization of microgrids in renewable-integrated transportation systems.

1. Introduction

Microgrids consist of loads, distributed energy sources and energy storage systems, and they provide an effective way to improve the utilization efficiency of renewable energy and reduce greenhouse gas emissions [1]. Against the backdrop of the low-carbon transformation towards clean and sustainable energy production, the utilization of renewable energy is regarded as an important method to address existing energy and environmental issues. However, the inherent uncertainties of renewable energy generation make peak load regulation in microgrids difficult to handle, and the grid cost is relatively high. To balance the peak load of microgrids, reduce pollution emissions and grid costs, mathematical optimization models are widely used to analyze the economic dispatch problem, in combination with these renewable energy sources [2,3].
Constructing a microgrid energy system is the primary basis for exploring economic dispatch optimization. Recent relevant studies have shown that the use of energy storage modules is an important solution for economic dispatch in microgrids, with the ability to effectively balance energy supply and demand, improving energy utilization efficiency and enhancing the stability and reliability of the power grid. A new grid-connected microgrid energy management system, which includes wind turbines, fuel cells, micro-turbines and battery energy storage systems has been proven to evaluate the impact of various irradiances on the day-ahead dispatching of the microgrid on different days and seasons [4]. Models for an integrated energy microgrid system considering a hybrid structure of electric thermal energy storage can reflect the complementary advantages of multiple energy sources and improve energy utilization efficiency [5]. To evaluate the impacts of energy storage systems and demand-side management on costs, emissions, and wind energy utilization, high wind permeability has been combined in a dynamic economic emission model, considering its intermittency and uncertainty [6]. The development of renewable energy sources, including photovoltaic power, also has an impact on the economic dispatch of microgrids. One previous study proposed a wind-diesel-load coordinated frequency regulation strategy based on high-permeability renewable energy microgrids, which includes high-permeability wind turbines, photovoltaic systems, diesel engines, loads and other components, effectively improving the frequency stability [7]. Regarding modularity and the balance degree of reactive power and active power as the evaluation criteria, a cluster division method combining structural and functional factors was proposed to solve the problem of a high proportion of renewable energy being connected to the distribution network [8]. The influence of distributed photovoltaic systems at photovoltaic penetration rates of 40%, 70% and 100% has also been evaluated on the voltage curve of low-voltage power grids [9]. These studies have contributed to microgrid energy systems considering both energy storage devices and renewable energy. Such microgrid energy systems have been gradually applied in the actual scenarios of expressway service areas. However, the charging of electric vehicles in service areas poses new demands for the construction of energy systems. Therefore, the construction of a microgrid energy system that accounts for the power consumption characteristics of electric vehicles is also a component of the microgrid energy system construction and is worthy of study.
When determining the optimal economic dispatch strategies in microgrids, traditional methods include adopting an organic combination of multiple dispatching methods by monitoring load changes in real time and dynamically adjusting the output of power generation equipment. Top-down and bottom-up coordinated control modes have also been applied. The upper part of this model comprehensively calculated measurements such as energy supply and demand, cost, and environment at the macro level to formulate the optimal energy allocation plan. The lower part maintains the balance of AC and DC power at the micro level with the help of advanced power electronics technology and control, as well as voltage fluctuations. Strategies based on load following, cycle charging, generator sequence, and combined dispatching have been evaluated to optimize the CO2 emissions, net current situation cost, and energy cost of the island microgrid [10]. Researchers proposed a real-time collaborative optimal economic dispatch control model for multiple microgrids and a real-time optimal economic dispatch strategy for multiple microgrids based on energy storage collaboration, regarding energy storage devices as energy management controllers, and significantly enhancing the resilience and reliability of the multiple microgrid system [11]. A multi-microgrid energy complementarity model was built to obtain a real-time optimized scheduling control strategy using a case study of the IEEE 33-node model to achieve the optimal energy coordination in the MMG system [12]. Another integrated management and control strategy with upper economic dispatch and lower electronic control coordination has been proven to maintain the power balance on both the AC and DC sides and suppress the fluctuations in frequency and voltage without the need for normalization processing [13]. Although the above-mentioned traditional dispatching strategies have been illustrated in optimizing the energy management of microgrids, higher requirements for the flexibility and optimization efficiency of dispatching strategies need to be met with the increase in the complexity of microgrid systems and the diversification of energy demands.
Machine learning algorithms are also widely used to solve the economic dispatch strategies of microgrids, including intelligent optimization algorithms such as the particle swarm optimization algorithm, genetic algorithm, simulated annealing algorithm, and gravitational search algorithm. Researchers previously established an optimized model by setting the comprehensive cost as the objective function and proposed an improved particle swarm optimization algorithm with adaptive inertia weight and contraction factors, which effectively reduced the comprehensive target cost [14]. An improved real-coded genetic algorithm and an enhanced method were built based on mixed integer linear programming and were proven to perform well in the microgrid model tests under different operating conditions [15]. It has been demonstrated that a hybrid particle swarm optimization and simulated annealing algorithm can be used to evaluate the performance of heuristic solutions for larger instances [16]. Simulation results proved the effectiveness of a hybrid particle swarm optimization and opposition-based learning gravitational search algorithm to solve a two-stage model based on day-ahead and real-time dispatching [17]. It has also been verified that an enhanced adaptive bat algorithm for the optimal economic dispatch strategy of microgrid systems outperforms other algorithms in the considered MG economic dispatch [18]. Researchers applied the whale element heuristic algorithm to the operation management of microgrids and found that the use of this management strategy plays an important role in operating costs and emissions [19]. When the internal search algorithm was applied to the economic load and joint economic emission of multi-microgrid systems, the results showed relatively high reductions in cost when compared with other algorithms [20]. The uncertainty of the rotational reserve provided by energy storage under probability constraints has been modeled to construct a new optimal mode, considering the charging and discharging characteristics of energy storage equipment [21]. Previous research incorporated the particle swarm optimization algorithm into a variable step incremental conductance method to form a hybrid algorithm for power tracking control to solve the problem of renewable energy microgrids [22]. An innovative hybrid optimization technology of Cheetah Optimization and Particle Swarm Optimization was also proposed to solve the coordinated control of multiple microgrids [23]. Different types of deep learning neural networks have also been developed and compared for short-term output photovoltaic power predictions, with their performance being evaluated [24]. A multi-objective cross-entropy algorithm was used to solve the reconstruction model to optimize all objectives simultaneously, considering the interference of solar energy [25]. Additionally, researchers developed a data-driven approach for constructing a hybrid integer linear method to predict renewable energy; it aims to utilize integrated weather forecasting to enhance the performance of hybrid microgrids that incorporate both renewable energy and traditional power sources [26]. When solving the economic dispatch strategy of microgrids, all the above-mentioned intelligent algorithms perform well in optimization, especially the particle swarm optimization algorithm, which has a simple principle and high computational efficiency. It is easy to integrate with other models and has good adaptability and scalability in dealing with complex scenarios. Therefore, in this study, these intelligent optimization algorithms were explored to solve the economic dispatch strategy for microgrids in expressway service areas.
Given the above, to optimize microgrid economic dispatch in special scenarios such as expressway service areas, an energy collaborative dispatching system combining the main grid and microgrid is expected to be established in this study, encompassing actual conditions such as energy storage devices, photovoltaic power generation, and electricity usage for electric vehicles. To optimize the economic cost of electricity consumption, a microgrid economic dispatch method based on intelligent optimization algorithms is proposed. This research can help to enhance the consumption capacity of renewable energy in the microgrid of expressway service areas by optimizing the collaborative dispatching strategies of clean energy, such as photovoltaic power, with energy storage and the main grid, which is expected to effectively enhance the power supply stability of the system under varied loads such as the disorderly charging of electric vehicles. It provides important support for the microgrid in service areas to achieve the efficient utilization of renewable energy and reliable power supplies under complex working conditions.

2. Methodology

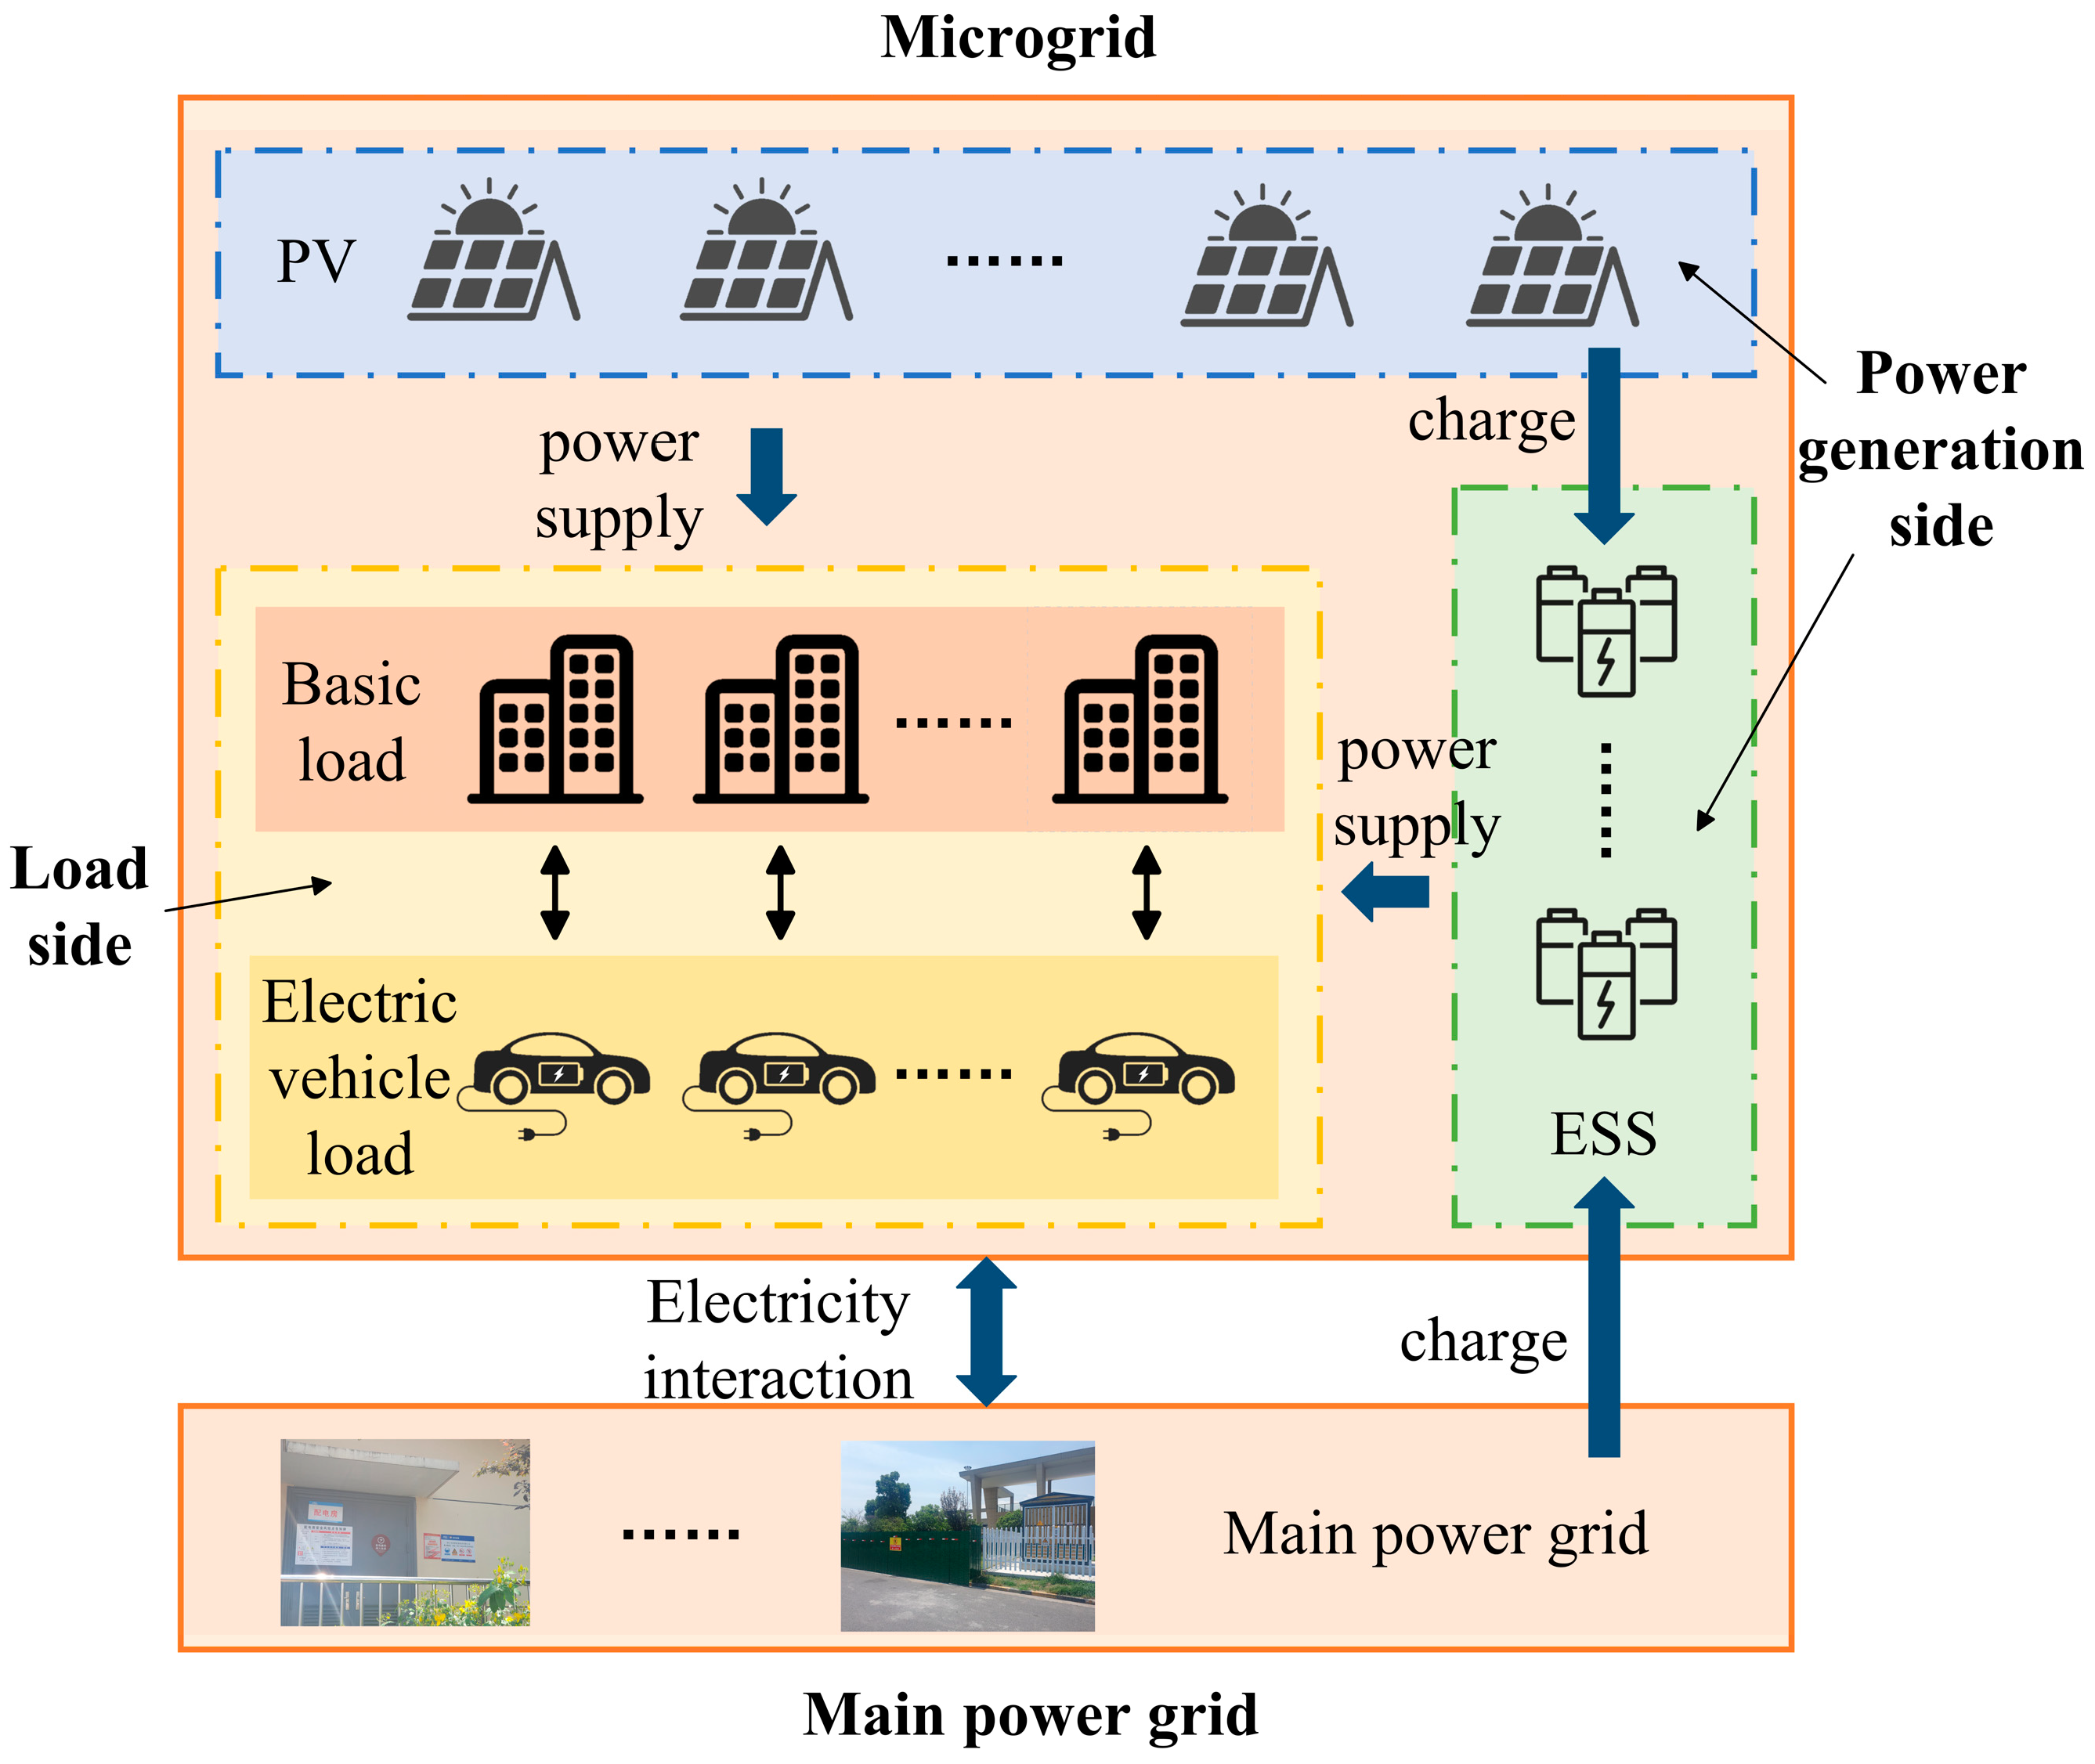
2.1. Microgrid System Modelling

The model structure diagram of the microgrid system in this study is shown in Figure 1. The microgrid system is externally connected to the main power grid, containing basic loads such as photovoltaic power generation (PV), charging and discharging of energy storage systems (ESS), electricity for electric vehicles, and basic load. Among them, photovoltaic power generation and energy storage power generation belong to the power generation side, while electric vehicles and the basic load of electricity consumption for routine operations belong to the load side. This model structure ensures the efficient consumption of renewable energy and can address power fluctuations caused by impact loads, such as those from electric vehicles, through the flexible dispatch of energy storage systems, forming a regional energy Internet with self-balancing capabilities.

2.1.1. PV Power Generation Modelling

Photovoltaic power generation is characterized by volatility and randomness due to factors such as sunlight and meteorological conditions. The value of light intensity in a day follows the beta distribution, and its probability density function is calculated as follows:
f r r = Γ α + β Γ α Γ β ( r r m a x ) α 1 ( 1 r r m a x ) β 1
where r is the light intensity and α and β are beta distribution parameters, which are related to light intensity.
The parameters of α and β can be calculated according to the average value and standard deviation of light intensity within a day:
α = μ μ 1 μ σ 2 1
β = 1 μ μ 1 μ σ 2 1
where μ and σ are, respectively, the average value and standard deviation of the light intensity r   [27].
Then, the maximum output power of photovoltaic power [28] is calculated as follows:
P p V = A η r
where A represents the total area of the photovoltaic array and η is the photoelectric conversion efficiency of the photovoltaic array.
According to photovoltaic characteristics [29], the beta distribution is also used to model PV power generation:
f p V P p V = Γ α + β Γ α Γ β ( P p V P p V m a x ) α 1 ( 1 P p V P p V m a x ) β 1

2.1.2. ESS Modelling

The mathematical model of the energy storage device constructed in this study mainly comprises the following two parameters:
(1)
Battery capacity (E)
The battery capacity of energy storage devices refers to the amount of electrical energy completely released through discharge operation when the device is fully charged. The amount of electrical energy released at this time is the battery capacity (E), that is, the rated capacity.
(2)
State of Charge (SOC)
SOC refers to the ratio of the remaining power of an energy storage device at a certain moment to its rated capacity, and the ratio is generally between 0 and 1. Energy storage devices generally operate in two working states: charging and discharging. Under these two working states, the SOC model of energy storage devices is calculated as follows [30]:
S O C ( t ) = S O C ( t 1 ) P e s s ( t ) t η d , P e s s ( t ) > 0 S O C ( t 1 ) η c P e s s ( t ) t , P e s s ( t ) < 0
where S O C ( t ) represents the SOC state at this moment; S O C ( t 1 ) represents the SOC state at the previous moment; P e s s ( t ) represents the charging and discharging power of the energy storage device; η c and η d represent the charging and discharging efficiency of the energy storage device.
The charging and discharging power and state of charge of energy storage devices need to be set within an upper and lower limit:
P e s s m i n ( t ) P e s s P e s s m a x ( t )
S O C m i n ( t ) S O C ( t ) S O C m a x ( t )

2.1.3. Modeling of Disordered Charging of Electric Vehicles

The driving characteristics of electric vehicles have a significant impact on their schedules and charging and discharging times. Electric vehicles are characterized by a large number, high randomness, and relatively difficult scheduling. By fitting the big data, we determined that the probability density function of the charging start time of electric vehicles follows a normal distribution [31]:
f x = 1 σ 2 π e x p x μ 2 2 σ 2 μ 12 x 24 1 σ 2 π e x p x + 24 μ 2 2 σ 2 0 x μ 12
where μ   = 15 and σ   = 3.4.
The probability density function of the daily mileage of vehicles follows a lognormal distribution:
f y = 1 y σ 2 π e x p l n y μ 2 2 σ 2
where μ   = 3.2 and σ   = 0.88.
Considering the charging condition of electric vehicles in expressway service areas, a disorderly charging model of electric vehicles is established in this study. Without any incentive measures, car owners charge electric vehicles according to their own will. The charging duration can be obtained using the following formula [32]:
T c = S W 100 100 η c P c
where S represents the daily mileage driven; W 100 is the power consumption per 100 km; η c is the charging power of the electric vehicle; and P c is the charging efficiency of the electric vehicle.
The Monte Carlo method was adopted to randomly sample the charging load of electric vehicles [33], and the flowchart is shown in Figure 2.
Combining Equations (9)–(11), the charging power of a single electric vehicle in a day can be obtained. Using further accumulation, the daily total load of the disorderly charging of all electric vehicles in the area can be obtained.

2.1.4. Basic Load Composition

Electricity consumption for routine operations in expressway service areas mainly includes lighting, catering, air conditioning, etc. These loads are uniformly regarded as the basic loads of the service areas.

2.2. Modelling of Microgrid Economic Dispatch

2.2.1. Objective Function of the Microgrid Economic Dispatch Model

For the economic dispatch optimization of the microgrid in expressway service areas, the minimum economic cost is selected as the objective function, including the cost of energy storage equipment, subsidies for photovoltaic power generation, and the purchase and sale costs of electricity interacting between the microgrid and the external main power grid. The specific objective function ( m i n F ) is expressed as follows:
m i n   F = C b u y + C s e l l + C b a t + C d e g + C P V + C g r i d p e n a l t y
where F represents economic cost; C b u y is the cost of purchasing electricity; C s e l l is the cost of selling electricity; C b a t is the cost of the energy storage equipment; C d e g is the cost of battery degradation; C P V is the operation and maintenance cost of photovoltaic power; and C g r i d p e n a l t y is the grid interaction penalty cost.

2.2.2. Constraints of Microgrid Economic Dispatch Model

(1)
Total power balance constraints
The energy system needs to ensure that the sum of the electricity from the external main power grid, energy storage equipment and photovoltaic power generation should meet the basic electricity load and electric vehicle load demands of the service area [34], which can be expressed as:
P l o a d + P E V = P g r i d + P b a t + P P V
where P l o a d is the basic load of the expressway service area; P E V is the load of electric vehicles; P g r i d is the electrical power purchased from the main power grid during grid interaction; P b a t is the power of energy storage equipment; and P P V is the power of photovoltaic power generation.
(2)
Power grid interaction constraints
P g r i d m a x P g t P g r i d m a x
where P g r i d m a x represents the upper limit of the exchange power between the microgrid of the service area and the external main power grid.
(3)
Constraints of energy storage system
The SOC of energy storage devices is between the upper and lower limits at every moment:
M i n S O C b a t S O C ( t ) M a x S O C b a t
where S O C ( t ) represents the state of charge of the energy storage device at a certain moment.
The initial and final SOC remain consistent, facilitating the recycling of energy storage:
S O C ( t ) = S O C ( 0 )
where S O C ( t ) is the state of charge of the energy storage device at time t; S O C ( 0 ) is the state of charge of the energy storage device at the initial moment.
(4)
PV constraints
P P V , m i n < P P V < P P V , m a x
where P P V is the photovoltaic power generation capacity; P P V , m i n and P P V , m a x are the minimum and maximum value of the photovoltaic power generation capacity, respectively.

2.3. Model Solution

The particle swarm optimization (PSO) algorithm is used to explore the economic dispatch strategy of the microgrid in this study. In the PSO algorithm, each “particle” is regarded as a latent solution without the characteristics of mass and volume. It uses swarm intelligence to establish a simplified model to find the best solution for complex optimization problems. Like other evolutionary algorithms, PSO is also based on the concepts of “population” and “evolution” to search for the best solution in a complex space through collaboration and competition among individuals. However, unlike other evolutionary algorithms, there are no genetic operations on individuals of PSO. Instead, it regards the individuals in the population as particles moving in the solution space, constantly aggregating towards their own historical best positions and the historical best positions of their groups to optimize the candidate solutions.
For the PSO algorithm, its state update formula can be expressed as follows [35]:
v j i k + 1 = ω k v j i k + c 1 r a n d 0 , a 1 p j i k x j i k + c 2 r a n d 0 , a 2 p j g k x j i k
where v j i k represents the velocity vector of particle i in the j dimension in the k th iteration; x j i k represents the position vector of particle i in the j dimension in the k th iteration.
In the PSO algorithm, c 1 = c 2 = 1 . ω k is the inertia weight factor (a non-negative value) representing the influence of the velocity of the previous generation of particles on the velocity of the current generation. A large value of ω k indicates a strong global optimization ability and a weak local optimization ability, while a smaller value of ω k indicates a weak global optimization ability and a strong local optimization ability.
In the early stage of the PSO algorithm, it is important for the global search to accelerate the search speed. In the later stage, it focuses on local searches. However, fixed inertia weight coefficients and learning factors may cause the algorithm to fall into local optimal solutions. An improved PSO (PSO-GD) algorithm is proposed to balance the capabilities of the global and local search to improve the speed of the algorithm and the local optimization ability by using a Gaussian decrement of nonlinear decrement. Thus, in the PSO-GD algorithm, it can more easily jump out of the local optimal position when becoming stuck in the local optimal solution. The improved PSO algorithm ensures the excellent search ability of the algorithm during the optimization process by adjusting the strategies of the inertia weight and learning factor.
In this study, the inertia weight is improved using the Gaussian decrement of nonlinear decrement, and it is calculated as follows:
ω k = ω m i n + ω m a x ω m i n e k 2 n d 2
where ω k is the improved inertia weight factor; k is the current number of iterations; and d is the maximum number of iterations.
A large value of inertia weight is beneficial for the global search, while a small weight is beneficial for the local search. Different improvement strategy types of particle swarm optimization in decreasing inertia weights are shown in Figure 3. The line named ‘Linear’ (dark green plane) represents the linearly decreasing method, while lines named ‘Nonlinear1’ (middle green plane) and ‘Nonlinear2’ (light green plane) represent nonlinear methods of parabolic decreasing and quadratic decreasing strategies, respectively. The traditional linearly decreasing inertia weight decreases in a linear pattern with the increase in the number of iterations. Although the traditional nonlinear decreasing inertia weight does not vary linearly, it has different characteristics of decreasing curves. These two curves exhibit the characteristics of rapid decreases in the inertia weight in the early stage (Nonlinear2) and later stage (Nonlinear1).
Gaussian decrement inertia is used in this study to improve the inertia weight adopted, represented by the line named ‘GD’ (orange plane) in Figure 3. With the increase in the number of iterations, the inertia weight decreases non-linearly in a Gaussian distribution curve. Figure 4 depicts the principal processes of the PSO and PSO-GD algorithms, which demonstrates that the particles arrive at the optimal position after searching from the initial position. The dotted circles indicate the current particle search range, and the green arrows indicate the particle swarm optimization path. The red dots indicate the positions of the particles, and the blue arrow indicates the direction. Unlike traditional linear and nonlinear decreasing methods that cannot guarantee a stable stage of the inertia weight value in both the early and later stages of the iteration, the Gaussian decreasing method can keep the inertia coefficient relatively high in the early stage of the iteration and relatively low in the later stage, so as to achieve the effect of focusing on global search in the early stage and local search in the later stage. Meanwhile, the reduction in the amplitude of the Gaussian decreasing inertia weight can be adjusted by changing the coefficient n to achieve better evaluation.
Additionally, the learning factor has also been adjusted in the PSO-GD algorithm. A larger scale of c 1 will cause the particle to search too much within the local range, and a larger scale of c 2 will cause the particle to converge to the local optimal value prematurely. In this study, asymmetric learning factors are used to improve c 1 and c 2 . The improved learning factors of c 1 and c 2 are calculated as follows:
c 1 = c m a x + c m i n c m a x × k d
c 2 = c m i n + c m a x c m i n × k d
where k is the current number of iterations, and d is the maximum number of iterations.
Therefore, the main steps of the PSO-GD algorithm for solving the economic dispatch optimization of microgrid in this study are as follows:
  • Parameters of the population size and the initial position x and velocity v of each particle are initialized.
  • The fitness of the particles (the economic cost F ) are calculated.
  • Value of p b e s t referring to the historical optimal position information for each particle by the individual optimal position is obtained. The value of g b e s t , referring to a group optimal position from these individual historical optimal positions, is compared with the historical optimal positions to select the best one as the current historical optimal position is obtained.
  • The velocity vector v is updated as follows:
    v j i k + 1 = ω k v j i k + c 1 r a n d 0 , a 1 p j i k x j i k + c 2 r a n d 0 , a 2 p j g k x j i k
The position vector x is updated as follows:
x j i k + 1 = x j i k + v j i k + 1
where i = 1,2 , , m ; j = 1,2 , , n .
  • When updating the position vector x , it is necessary to restrict the position of the particle to be within the boundary range of the search space.
  • The number of iterations k is checked to determine whether it has reached the maximum number of iterations. If so, the iteration is terminated. Meanwhile, the fitness value is checked to determine whether it meets the convergence condition. If so, the process is terminated and the global optimal solution is obtained.
  • The final optimal strategy for microgrid energy dispatching is obtained.

3. Data Analysis and Preprocessing

3.1. Microgrid System Conditions

Data related to the microgrid energy system were collected from the Xiaoshan Expressway Service Area in Hangzhou City, Zhejiang Province, as shown in Figure 5. They include photovoltaic power generation systems, energy storage devices and electric vehicle charging piles. The relevant parameters of the photovoltaic equipment are shown in Table 1. The relevant parameters of the energy storage equipment are shown in Table 2. The time-of-use electricity price is shown in Table 3. The parameters related to the main grid are shown in Table 4.

3.2. Photovoltaic Power Generation Capacity

Based on the light intensity conditions of the Xiaoshan Expressway Service Area from 1 to 30 June 2022 [36], the parameters of α and β can be obtained using Equations (2) and (3), as shown in Table 5. Then, the photovoltaic power generation capacity for 30 days can be calculated using the photovoltaic power generation model.

3.3. Electric Vehicle Charging Power Load

A total of 200 electric vehicles entered the service area for charging on a single day in this study. The maximum SOC of the electric vehicles was 90%, while the minimum SOC was 10%. The power consumption per 100 km was 10 kW/h, and the charging power was 10 kW/h. Then, the total load of electric vehicle charging was fitted using Monte Carlo method as shown in Figure 6.

3.4. Sensitivity Analysis of Parameters

For the PSO-GD algorithm, all relevant parameters of PSO-GD, including the inertia weights ( ω ), learning factors ( c 1 and c 2 ), population size (m), and maximum iteration times (d), were selected to conduct a global sensitivity analysis of the algorithm parameters. The range definition of the parameter values is shown in Table 6. Among them, m represents the number of particles in this algorithm. Each particle represents a possible strategy solution of economic dispatch, and the inertia weight and learning factor determine the velocity and the position of the particles in the optimization process.
Figure 7 shows the optimal cost distribution under different parameter combinations. The blue dots on the coordinate plane indicate the combination of c 1 and c 2 . The green dots on the coordinate plane indicate the combination of ω and c 2 . The orange dots on the coordinate plane indicate the combination of c 1 and ω . The size of the sphere represents m , and the color of the sphere represents the value of the optimal economic cost. The LHS sampling method was used for the global sensitivity analysis, and the optimal parameter combination for optimal fitness is obtained: ω = 0.72 ; c 1 = 1.86 ; c 2 = 1.86 ; m = 139 ; d = 130 .

4. Results

4.1. Comparative Analysis of the Optimal Economic Costs

Intelligent optimization algorithms such as PSO [14], the genetic algorithm (GA) [15], the simulated annealing algorithm (SA) [16], the differential evolution algorithm (DE) [17] and the whale optimization algorithm (WOA) [19] are widely used to optimize the economic dispatch of microgrids. Eight algorithms (including PSO-GD, PSO, PSO-linear, PSO-nonlinear, GA, SA, DE and WOA) were calculated in cases to compare and analyze the optimization effects in this study, in which the parabolic inertia weight decreasing is selected as the strategy of PSO-nonlinear in this study. The parameter settings and technical details of the eight algorithms are shown in Table 7.
Additionally, the same initialization strategy is applied to these eight algorithms: that is, SOC is randomly initialized within the range of [0, 1], and the first and last SOC values are forced to be 0.4. The termination condition for all these eight algorithms is to iterate to the maximum number of iterations. The constraint processing methods are all set as SOC boundary constraints and grid interaction power limits.
The statistical results of the optimal economic cost with different algorithms for 50 runs of calculations in one typical day are shown in Table 8. The optimal economic cost of PSO-GD both in the mean and standard deviation values is lower than other algorithms. Conversely, the optimal economic cost of SA is the highest (3611.34 CNY), CNY 84.89 higher than that of PSO-GD. SA has the potential to be used for global search, but, in practical applications, its selection, crossover and mutation operations may cause the algorithm to converge prematurely, resulting in the solution not being globally optimal. In such complex issues as economic dispatch microgrids, the premature convergence of SA prompts high economic costs. Compared with SA, the optimized energy scheduling strategy calculated by PSO-GD reduces the economic cost by CNY 84.89.
Meanwhile, to further verify the improvement effectiveness, the algorithms of PSO-GD and PSO are, respectively, used to calculate the cases to make comparisons. The parameters of these two algorithms are set consistently: that is, the population size is 139 and the maximum number of iterations is 130. Table 9 presents a comparison of the results of PSO-GD and PSO daily for 30 days in this case study.
Combined with the comparative analyses of this case, this proves that PSO-GD can more effectively reduce the economic cost and shows better performance than PSO, GA, SA, DE and WOA in optimizing the economic dispatch of microgrids.

4.2. Performance Analyses of Algorithms

4.2.1. Robustness Analysis

To verify the robustness of the improved particle swarm optimization algorithm under uncertain conditions, the situation of load fluctuations indicated by the randomness and volatility of charging electric vehicle loads and grid electricity price were analyzed in this study.
Different numbers of charging electric vehicles (such as 50, 200, and 400) were selected to analyze the optimal costs calculated by PSO-GD, PSO, PSO-linear, PSO-nonlinear, GA, SA, DE and WOA. As shown in Table 10, it was found that the optimal economic cost of PSO-GD is lower than that of other algorithms under different load fluctuations, indicating the strong robustness of PSO-GD.
Meanwhile, the uncertainty of grid electricity price was also analyzed by establishing three electricity price scenarios, namely, THE baseline scenario, high electricity price scenario and low electricity price scenario, which are, respectively, the benchmark priceS of Xiaoshan District, 20% increased based on the baseline scenario, and 20% decreased based on the baseline scenario. Table 11 shows the optimal costs of the eight algorithms for different electricity price scenarios. The results show that, under the three electricity price levels, the PSO-GD algorithm can stably obtain a lower dispatching cost with the least cost fluctuation among these algorithms, fully demonstrating the robustness of PSO-GD under the condition of electricity price uncertainty and being able to better adapt to the actual electricity market.

4.2.2. Convergence Analysis

To verify the convergence of the improved particle swarm optimization algorithm, the comparison of the convergence of the eight algorithms has been conducted using specific data. All algorithms were run with the parameter’s settings described in Table 7 and averaged over 50 runs. Table 12 shows the number of iterations when these algorithms iterate to the optimal cost. Figure 8 shows the comparison of convergence curves with eight algorithms. The statistical results showed that the proposed PSO-GD algorithm converges after 64 iterations, which is significantly less than the number of iterations required for convergence by other algorithms. It indicated the better convergence performance of PSO-GD compared to the others, with fast convergence speeds and a high degree of stability, which is of great significance for efficiency improvements in practical applications.

4.3. Microgrid Economic Dispatch Strategy

Based on the data for a typical day in this study, the optimal microgrid economic dispatch strategy was calculated based on PSO-GD to achieve the lowest economic cost within a single day under the condition of meeting the constraint conditions, shown in Figure 9.
Figure 9 shows that the period from 7:00 to 18:00 is the output stage of photovoltaic power. During this period, power is mainly supplied by photovoltaic power and the main grid. From 14:00 to 22:00, due to the increase in load demand, energy storage devices are supplemented to increase the power supply. During the period from 19:00 to 22:00, PV does not supply power. It is the peak electricity price period, and the power supply is jointly provided by energy storage devices and the main grid. During the period from 23:00 to 6:00 the next day, PV does not supply power. This is the off-peak electricity price period, so power is only supplied by the main grid and the energy storage devices are charged during this period.

5. Discussion

5.1. Main Findings

The proposed PSO-GD algorithm demonstrates significant advantages in optimizing the economic dispatch of renewable-integrated microgrids, particularly under the uncertainties inherent in highway service area scenarios. The superior performance of PSO-GD, characterized by lower operational costs, faster convergence, and enhanced robustness, can be attributed to its innovative parameter adjustment strategies: the Gaussian decrement inertia weight ensures strong global search capabilities in the early iteration stage and refined local optimization in the later stage, while the asymmetric dynamic learning factors effectively prevent premature convergence, allowing particles to escape local optima. This addresses a critical limitation of standard PSO and other heuristic algorithms, such as their tendency to stagnate in suboptimal solutions when handling complex constraints such as renewable energy uncertainty and disorderly electric vehicle (EV) charging.
Specifically, the constructed microgrid model, integrating photovoltaic, energy storage, and electric vehicle loads, effectively captures the actual operation characteristics of expressway service areas, which is in line with the modeling framework of previous research for electric vehicle charging stations [33] but extends it by incorporating time-varying renewable energy uncertainties. The PSO-GD algorithm reduces the operational cost by 0.8–2.5% compared to the standard PSO, GA, SA, DE, and WOA, which is consistent with the conclusions of a previous study that adaptive adjustments in PSO parameters can significantly lower comprehensive costs [14]. The accelerated convergence speed of PSO-GD (converging at 64 iterations on average, much faster than other algorithms) can be attributed to the Gaussian decrement strategy of inertia weight. The advantage of this strategy is more prominent than the linear or nonlinear decrement methods in a hybrid PSO-SA algorithm in a previous study [16]. The enhanced robustness of PSO-GD under varying conditions (fluctuating EV numbers and electricity prices) confirms its potential in handling microgrid complexity, as highlighted in one previous study on multi-microgrid resilience [11], but the current study further improves this adaptability through dynamic parameter tuning.
Notably, the practical relevance of the proposed approach is underscored by its adaptability to real-world scenarios. By integrating detailed models of photovoltaic (PV) generation, energy storage systems (ESS), and EV charging loads (each tailored to the specific characteristics of expressway service areas), it bridges the gap between theoretical optimization and on-site operation in this study. This aligns with the conclusions of Luo et al. [4], who emphasized that accurate modeling of renewable energy and storage systems is crucial for reliable microgrid dispatch. Additionally, the inclusion of time-of-use electricity prices and grid interaction constraints ensures that the dispatch strategy aligns with actual market mechanisms, while the Monte Carlo simulation for EV charging loads captures the stochastic nature of user behavior, enhancing the model’s realism.

5.2. Limitations and Future Directions of Verification

The energy and load characteristics of the Xiaoshan service area present a medium level of the penetration rate of renewable energy, which cannot cover different penetration scenarios. In addition, the validation data are real operation data, so it is difficult to fully verify the stability of the method under extreme conditions.
Future research will be improved in terms of scenario data expansion, based on the validation of the Xiaoshan service area, to expand the scope of application of the model and compare the scheduling accuracy, cost control, and power supply reliability of the algorithm under different energy structures.

5.3. Application Framework

A multi-level implementation framework will be constructed based on actual needs, forming a closed loop of “data prediction–optimization–implementation–feedback” to ensure the practicality of the algorithm. The core logic of the algorithm is transferred to microgrids such as industrial parks and communities. The objective function is adjusted according to the characteristics of the scenarios and combined with new energy systems such as wind power and hydrogen energy to test the optimization effect of the algorithm in renewable-integrated scenarios. A general dispatching scheme will be gradually formed.

6. Conclusions

The aim of this study is to explore the economic dispatch optimization of renewable-integrated microgrids in transportation systems by establishing mathematical models in microgrid systems. By comprehensibly considering the uncertainty of the output of renewable energy, the disorderly charging characteristics of electric vehicles and the economic requirements of the power grid, an optimization strategy based on the improved particle swarm optimization algorithm of Gaussian decreasing is proposed.
Taking the minimization of economic costs as the objective function, combined with constraints such as power balance and energy storage state of charge conditions, an optimized framework that suits actual scenarios was constructed. On this basis, to effectively solve this optimization model, the algorithm of PSO-GD was proposed by improving the parameters of the Gaussian decreasing inertia weight and asymmetric dynamic learning factors. Results of case analyses of energy systems from Xiaoshan Service Area in Hangzhou show that PSO-GD is significantly superior to other algorithms in terms of economic cost, convergence speed and parameter robustness.
The methodological innovations and contributions of this study are summarized. The Gaussian decrement inertia weight design provides a mathematically rigorous approach to balance global exploration and local exploitation. By modeling inertia weight as a Gaussian function of iterations, PSO-GD retains high inertia weights in early stages to explore the solution space broadly (which is critical for handling uncertainties from PV, EVs, and grid prices), while smoothly transitioning to lower weights in later stages to refine optimal solutions. This nonlinear adaptation mechanism overcomes the limitations of linear or parabolic decrement strategies, which often fail to adapt to the dynamic cost landscape of microgrid dispatch. The integration of asymmetric dynamic learning factors enhances the ability of algorithms to escape local optima. By adjusting individual cognition and social interaction dynamically, PSO-GD avoids swarm stagnation, a common issue in standard PSO with fixed symmetric factors. This adaptability ensures robust performance across diverse scenarios, from low EV penetration (50 vehicles) to high load fluctuations (400 vehicles), and under varying electricity price regimes. The proposed algorithm establishes a new paradigm for solving complex economic dispatch problems in renewable-integrated transportation systems. By integrating microgrid component models (PV, ESS, EVs) with a dynamic optimization framework, PSO-GD not only minimizes operational costs (up to 3.2% lower than traditional algorithms) but also ensures computational efficiency (20% faster convergence) and constraint satisfaction. This method provides a transferable mathematical framework for optimizing energy systems where multi-source uncertainty and multi-constraint coupling are prevalent.
In conclusion, PSO-GD advances the field of intelligent optimization for energy systems by introducing a parameter-adaptive mechanism that is both theoretically grounded and practically viable. It demonstrates that leveraging nonlinear dynamic parameters in swarm intelligence algorithms can significantly enhance their applicability to real-world energy dispatch problems for the more efficient, resilient, and cost-effective integration of renewable energy into transportation and urban infrastructure.

Author Contributions

Conceptualization, Y.W. and W.D.; Methodology, Y.W., W.L. and C.D.; Software, W.L.; Validation, Y.W., W.L., W.D. and C.D.; Investigation, W.L.; Resources, W.D.; Data curation, W.D.; Writing—original draft, Y.W.; Writing—review & editing, C.D.; Visualization, C.D.; Supervision, W.D.; Project administration, Y.W. All authors have read and agreed to the published version of the manuscript.

Funding

This work was supported by the National Natural Science Foundation of China (No. 52402434, No. 52302405), the Zhejiang Provincial Nature Science Foundation of China (LQ24E050019), “Pioneer” and “Leading Goose” Research and Development Programs of Zhejiang Province (No. 2023C01246), and the Zhejiang Department of Transportation Science and Technology Plan (No. 2024017).

Data Availability Statement

The original contributions presented in this study are included in the article. Further inquiries can be directed to the corresponding author.

Conflicts of Interest

Author Wenjun Du was employed by the company Zhejiang Institute of Communications Co., Ltd. The remaining authors declare that the research was conducted in the absence of any commercial or financial relationships that could be construed as a potential conflict of interest.

References

  1. Mazidi, M.; Rezaei, N.; Ghaderi, A. Simultaneous power and heat scheduling of microgrids considering operational uncertainties: A new stochastic p-robust optimization approach. Energy 2019, 185, 239–253. [Google Scholar] [CrossRef]
  2. Albalawi, H.; Wadood, A.; Park, H. Economic Load Dispatch Problem Analysis Based on Modified Moth Flame Optimizer (MMFO) Considering Emission and Wind Power. Mathematics 2024, 12, 3326. [Google Scholar] [CrossRef]
  3. Song, Z.; Wang, X.; Wei, B.; Shan, Z.; Guan, P. Distributed Finite-Time Cooperative Economic Dispatch Strategy for Smart Grid under DOS Attack. Mathematics 2023, 11, 2103. [Google Scholar] [CrossRef]
  4. Luo, L.; Abdulkareem, S.S.; Rezvani, A.; Miveh, M.R.; Pazhoohesh, M. Optimal scheduling of a renewable based microgrid considering photovoltaic system and battery energy storage under uncertainty. J. Energy Storage 2020, 28, 101306. [Google Scholar] [CrossRef]
  5. Dong, H.; Fu, Y.; Jia, Q.; Wen, X. Optimal dispatch of integrated energy microgrid considering hybrid structured electric-thermal energy storage. Renew. Energy 2022, 199, 628–639. [Google Scholar] [CrossRef]
  6. Alham, M.H.; Elshahed, M.; Ibrahim, D.K.; El Zahab, E.E.D.A. A dynamic economic emission dispatch considering wind power uncertainty incorporating energy storage system and demand side management. Renew. Energy 2016, 96, 800–811. [Google Scholar] [CrossRef]
  7. Bian, X.; Jiang, Y.; Zhao, Y.; Li, D. Coordinated Frequency Regulation Strategy of Wind, Diesel and Load for Microgrid with High-penetration Renewable Energy. Autom. Electr. Power Syst. 2018, 42, 102–109. [Google Scholar] [CrossRef]
  8. Ding, M.; Liu, X.; Bi, R.; Hu, D.; Ye, B.; Zhang, J. Method for Cluster Partition of High-penetration Distributed Generators Based on Comprehensive Performance Index. Autom. Electr. Power Syst. 2018, 42, 47–52. [Google Scholar] [CrossRef]
  9. Visser, L.R.; Schuurmans, E.M.B.; AlSkaif, T.A.; Fidder, H.A.; Van Voorden, A.M.; Van Sark, W.G.J.H.M. Regulation strategies for mitigating voltage fluctuations induced by photovoltaic solar systems in an urban low voltage grid. Int. J. Electr. Power Energy Syst. 2022, 137, 107695. [Google Scholar] [CrossRef]
  10. Shezan, S.A.; Hasan, K.N.; Rahman, A.; Datta, M.; Datta, U. Selection of Appropriate Dispatch Strategies for Effective Planning and Operation of a Microgrid. Energies 2021, 14, 7217. [Google Scholar] [CrossRef]
  11. Wu, N.; Xu, J.; Linghu, J.; Huang, J. Real-time optimal control and dispatching strategy of multi-microgrid energy based on storage collaborative. Int. J. Electr. Power Energy Syst. 2024, 160, 110063. [Google Scholar] [CrossRef]
  12. Wu, N.; Wang, Z.; Li, X.; Lei, L.; Qiao, Y.; Linghu, J.; Huang, J. Research on real-time coordinated optimization scheduling control strategy with supply-side flexibility in multi-microgrid energy systems. Renew. Energy 2025, 238, 121976. [Google Scholar] [CrossRef]
  13. Lyu, Z.; Yi, J.; Song, J.; Liu, B. Coordinated optimal control and dispatching operation of grid-connected AC/DC hybrid microgrid group. Electr. Power Syst. Res. 2023, 221, 109430. [Google Scholar] [CrossRef]
  14. Zhang, H.; Li, G.; Wang, S. Optimization dispatching of isolated island microgrid based on improved particle swarm optimization algorithm. Energy Rep. 2022, 8, 420–428. [Google Scholar] [CrossRef]
  15. Nemati, M.; Braun, M.; Tenbohlen, S. Optimization of unit commitment and economic dispatch in microgrids based on genetic algorithm and mixed integer linear programming. Appl. Energy 2018, 210, 944–963. [Google Scholar] [CrossRef]
  16. Fontes, D.B.; Homayouni, S.M.; Gonçalves, J.F. A hybrid particle swarm optimization and simulated annealing algorithm for the job shop scheduling problem with transport resources. Eur. J. Oper. Res. 2023, 306, 1140–1157. [Google Scholar] [CrossRef]
  17. Wu, X.; Cao, W.; Wang, D.; Ding, M. A Multi-Objective Optimization Dispatch Method for Microgrid Energy Management Considering the Power Loss of Converters. Energies 2019, 12, 2160. [Google Scholar] [CrossRef]
  18. Yang, Q.; Dong, N.; Zhang, J. An enhanced adaptive bat algorithm for microgrid energy scheduling. Energy 2021, 232, 121014. [Google Scholar] [CrossRef]
  19. Tahmasebi, M.; Pasupuleti, J.; Mohamadian, F.; Shakeri, M.; Guerrero, J.M.; Basir Khan, M.R.; Nazir, M.S.; Safari, A.; Bazmohammadi, N. Optimal Operation of Stand-Alone Microgrid Considering Emission Issues and Demand Response Program Using Whale Optimization Algorithm. Sustainability 2021, 13, 7710. [Google Scholar] [CrossRef]
  20. Trivedi, I.N.; Jangir, P.; Bhoye, M.; Jangir, N. An economic load dispatch and multiple environmental dispatch problem solution with microgrids using interior search algorithm. Neural Comput. Appl. 2018, 30, 2173–2189. [Google Scholar] [CrossRef]
  21. Li, Y.; Yang, Z.; Li, G.; Zhao, D.; Tian, W. Optimal scheduling of an isolated microgrid with battery storage considering load and renewable generation uncertainties. IEEE Trans. Ind. Electron. 2018, 66, 1565–1575. [Google Scholar] [CrossRef]
  22. Li, F.; Shi, Z.; Zhu, Z.; Gan, Y. Energy Management Strategy for Direct Current Microgrids with Consideration of Photovoltaic Power Tracking Optimization. Energies 2025, 18, 252. [Google Scholar] [CrossRef]
  23. Mohamed, M.A.E.; Mahmoud, A.M.; Saied, E.M.M.; Hadi, H.A. Hybrid cheetah particle swarm optimization based optimal hierarchical control of multiple microgrids. Sci. Rep. 2024, 14, 9313. [Google Scholar] [CrossRef]
  24. Mellit, A.; Pavan, A.M.; Lughi, V. Deep learning neural networks for short-term photovoltaic power forecasting. Renew. Energy 2021, 172, 276–288. [Google Scholar] [CrossRef]
  25. Wang, L.; Li, Q.; Ding, R.; Sun, M.; Wang, G. Integrated scheduling of energy supply and demand in microgrids under uncertainty: A robust multi-objective optimization approach. Energy 2017, 130, 1–14. [Google Scholar] [CrossRef]
  26. Craparo, E.; Karatas, M.; Singham, D.I. A robust optimization approach to hybrid microgrid operation using ensemble weather forecasts. Appl. Energy 2017, 201, 135–147. [Google Scholar] [CrossRef]
  27. Hui, H.; Li, R.; Zhu, Y.D. Multi-objective probabilistic planning method for distribution network with high proportion of distributed photovoltaic. Electr. Meas. Instrum. 2023, 60, 2–10. [Google Scholar] [CrossRef]
  28. Atawi, I.E.; Abuelrub, A.; Al-Shetwi, A.Q.; Albalawi, O.H. Design of a wind-PV system integrated with a hybrid energy storage system considering economic and reliability assessment. J. Energy Storage 2024, 81, 110405. [Google Scholar] [CrossRef]
  29. Daud, A.K.; Ismail, M.S. Design of isolated hybrid systems minimizing costs and pollutant emissions. Renew. Energy 2012, 44, 215–224. [Google Scholar] [CrossRef]
  30. Li, J.; Niu, D.; Wu, M.; Wang, Y.; Li, F.; Dong, H. Research on Battery Energy Storage as Backup Power in the Operation Optimization of a Regional Integrated Energy System. Energies 2018, 11, 2990. [Google Scholar] [CrossRef]
  31. Wu, S.; Pang, A. Optimal scheduling strategy for orderly charging and discharging of electric vehicles based on spatio-temporal characteristics. J. Clean. Prod. 2023, 392, 136318. [Google Scholar] [CrossRef]
  32. Du, W.; Ma, J.; Yin, W. Orderly charging strategy of electric vehicle based on improved PSO algorithm. Energy 2023, 271, 127088. [Google Scholar] [CrossRef]
  33. Domínguez-Navarro, J.A.; Dufo-López, R.; Yusta-Loyo, J.M.; Artal-Sevil, J.S.; Bernal-Agustín, J.L. Design of an electric vehicle fast-charging station with integration of renewable energy and storage systems. Int. J. Electr. Power Energy Syst. 2019, 105, 46–58. [Google Scholar] [CrossRef]
  34. Hossain, M.A.; Pota, H.R.; Squartini, S.; Abdou, A.F. Modified PSO algorithm for real-time energy management in grid-connected microgrids. Renew. Energy 2019, 136, 746–757. [Google Scholar] [CrossRef]
  35. He, Y.; Wu, X.; Sun, K.; Du, X.; Wang, H.; Zhao, J. Economic Optimization Scheduling Based on Load Demand in Microgrids Considering Source Network Load Storage. Electronics 2023, 12, 2721. [Google Scholar] [CrossRef]
  36. European Commission; Joint Research Centre. Photovoltaic Geographical Information System (PVGIS). EU Science Hub. Available online: https://re.jrc.ec.europa.eu/pvg_tools/en/ (accessed on 12 June 2025).
Figure 1. Diagram of the microgrid system structure.
Mathematics 13 02440 g001
Figure 2. Flowchart of the Monte Carlo method sampling for electric vehicle charging load.
Mathematics 13 02440 g002
Figure 3. Schematic diagram of different strategy types for decreasing inertia weights.
Mathematics 13 02440 g003
Figure 4. Schematic comparison of PSO and PSO-GD algorithms.
Mathematics 13 02440 g004
Figure 5. On-site map of the energy system of the Xiaoshan Expressway Service Area.
Mathematics 13 02440 g005
Figure 6. Total load curves of electric vehicle charging, fitted using Monte Carlo.
Mathematics 13 02440 g006
Figure 7. Three-dimensional scatter plot of parameter sensitivity combinations of PSO-GD.
Mathematics 13 02440 g007
Figure 8. Comparison of convergence curves with eight algorithms.
Mathematics 13 02440 g008
Figure 9. A typical daily microgrid economic dispatch strategy.
Mathematics 13 02440 g009
Table 1. Parameters related to photovoltaic equipment.
ParametersValueUnit
Installed Capacity631kWp
A 3155m2
η 0.2N/A
Cost Coefficient 0.02CNY/kW
Table 2. Parameters related to energy storage devices.
ParametersValueUnit
Installed Capacity945kWh
Cost Coefficient0.15CNY/kW
Table 3. The time-of-use electricity price.
Time period23:00~7:007:00~17:0017:00~23:00
Price/CNY0.350.851.04
Table 4. Parameters related to the main grid.
ParametersValueUnit
Maximum power2500kW
Minimum power0kW
Table 5. Weather conditions of the Xiaoshan Expressway Service Area in June 2022.
Date α   a n d   β Date α   a n d   β Date α   a n d   β
1 June α   =   0.42 ;   β = 6.0611 June α   =   0.42 ;   β = 2.4921 June α   =   0.30 ;   β = 1.25
2 June α   =   0.23 ;   β = 0.7912 June α   =   0.53 ;   β = 6.8722 June α   =   0.37 ;   β = 1.70
3 June α   =   0.57 ;   β = 3.5913 June α   =   0.34 ;   β = 3.4223 June α = 0.27; β = 1.00
4 June α   =   0.36 ;   β = 1.7414 June α   =   0.25 ;   β = 0.7524 June α   =   0.39 ;   β = 2.49
5 June α   =   0.54 ;   β = 8.8215 June α   =   0.25 ;   β = 0.7225 June α   =   0.32 ;   β = 1.39
6 June α   =   0.14 ;   β = 0.3216 June α   =   0.27 ;   β = 0.8426 June α   =   0.25 ;   β = 0.76
7 June α   =   0.23 ;   β = 0.6917 June α   =   0.19 ;   β = 0.5127 June α   =   0.20 ;   β = 0.50
8 June α   =   0.20 ;   β = 0.5818 June α   =   0.25 ;   β = 0.7028 June α   =   0.34 ;   β = 1.35
9 June α   =   0.18 ;   β = 0.4719 June α   =   0.56 ;   β = 6.1829 June α   =   0.25 ;   β = 0.80
10 June α   =   0.19 ;   β = 2.1220 June α   =   0.46 ;   β = 4.3830 June α   =   0.20 ;   β = 0.73
Table 6. Range of relevant parameter values.
Parameters ω c 1 c 2 m d
Value range [ 0.4 ,   0.9 ] [ 0.5 ,   2.5 ] [ 0.5 ,   2.5 ] [ 100 ,   300 ] [ 50 ,   200 ]
Table 7. Parameter settings and technical details of the eight algorithms.
AlgorithmsPSOPSO-GDPSO-LinearPSO-Nonlinear
ParametersPopulation size 130.
Inertia weighs 0.4.
Velocity range [−0.1, 0.1];
Learning factor [0.5, 2.5]
Population size 130.
ω m i n = 0.45 ,
ω m a x = 0.76 ;
Velocity range
[−0.1, 0.1].
c m a x = 1.12 ,
c m i n = 0.62 .
Population size 130.
Inertia weighs 0.4.
Velocity range [−0.1, 0.1]
Learning factor [0.5, 2.5]
Population size 130.
Inertia weighs 0.4.
Velocity range [−0.1, 0.1]
Learning factor [0.5, 2.5]
AlgorithmsDEGASAWOA
ParametersPopulation size 130.
Scaling factor 0.5.
Crossing probability 0.8
Population size 130.
Probability of crossover 0.8.
Probability of variation 0.01
Initial temperature 100.
Cooling rate: 0.95
Population size 130.
Spiral constant b = 1.
Coefficient a: 2 to 0.
Coefficient a2: −1 to −2.
p = rand.
Table 8. The optimal economic cost with different algorithms in one typical day.
AlgorithmsPSO-GDPSOPSO-LinearPSO-NonlinearGASADEWOA
m i n F Mean/CNY3526.453556.863542.643542.643552.993611.343545.263530.62
Standard   deviation 7.0920.389.2818.9522.8926.0819.4414.66
Table 9. Comparison of optimal economic cost between PSO-GD and PSO.
DateThe Optimal Economic Costs/CNYVariation/CNY
PSOPSO-GD
1 June2279.19 2272.76 6.42
2 June2407.40 2404.37 3.03
3 June3568.51 3566.69 1.81
4 June2128.54 2126.68 1.86
5 June2950.32 2952.01 −1.69
6 June3083.58 3081.19 2.39
7 June1984.41 1976.40 8.01
8 June2694.03 2689.30 4.73
9 June2734.90 2720.50 14.40
10 June1579.85 1569.72 10.13
11 June2145.23 2135.47 9.75
12 June3049.06 3048.68 0.38
13 June3007.96 3000.21 7.76
14 June1896.05 1887.13 8.92
15 June2215.06 2214.29 0.77
16 June1960.10 1948.06 12.04
17 June2602.04 2601.66 0.38
18 June2821.16 2832.42 −11.26
19 June1807.61 1807.38 0.23
20 June2278.43 2266.59 11.84
21 June2789.87 2754.29 35.58
22 June1560.97 1557.78 3.19
23 June2998.08 2996.35 1.74
24 June1889.41 1874.08 15.33
25 June2313.15 2306.91 6.24
26 June1728.59 1719.92 8.66
27 June2107.52 2110.77 −3.25
28 June2124.12 2111.63 12.48
29 June3866.65 3867.03 −0.38
30 June1905.46 1898.27 7.19
Table 10. The optimal costs with different numbers of charging electric vehicles.
50 Vehicles200 Vehicles400 Vehicles
Cost of PSO-GD (CNY)2494.13528.55036.2
Cost of PSO (CNY)2506.63556.85063.3
Cost of PSO-linear (CNY)2496.43542.65053.1
Cost of PSO-nonlinear (CNY)2496.13542.65052.5
Cost of GA (CNY)2513.63552.95124.7
Cost of SA (CNY)2548.83611.35139.1
Cost of DE (CNY)2506.73545.25054.1
Cost of WOA (CNY)2520.43570.65080.4
Table 11. The optimal cost under different electricity price scenarios.
Low Electricity Price ScenarioBaseline ScenarioHigh Electricity Price Scenario
Cost of PSO-GD (CNY)2866.73528.54161.4
Cost of PSO (CNY)2900.13556.84197.3
Cost of PSO-linear (CNY)2869.23542.64174.7
Cost of PSO-nonlinear (CNY)2869.23542.64163.1
Cost of GA (CNY)2884.83552.94200.8
Cost of SA (CNY)3114.33611.34576.3
Cost of DE (CNY)2889.13545.24180.7
Cost of WOA (CNY)2869.23570.64162.7
Table 12. The number of iterations for optimal cost with eight algorithms.
PSOPSO-GDPSO-LinearPSO-NonlinearGASADEWOA
Average number of iterations100641009591819983
Disclaimer/Publisher’s Note: The statements, opinions and data contained in all publications are solely those of the individual author(s) and contributor(s) and not of MDPI and/or the editor(s). MDPI and/or the editor(s) disclaim responsibility for any injury to people or property resulting from any ideas, methods, instructions or products referred to in the content.

