

Computational Simulation of Aneurysms Using Smoothed Particle Hydrodynamics

 , , , ,
Abstract
1. Introduction
2. Related Work
2.1. SPH-Based Fluid Simulation
2.2. Modeling and Simulation of Aneurysmal Lesions and Hemodynamics
3. Proposed Method
3.1. SPH-Based Blood Flow Simulation
3.2. Simulation of Aneurysm Rupture

3.3. Simulation of Aneurysm Growth
3.4. Simulation of Bifurcation Aneurysms
3.5. Boundary Conditions in Aneurysm Simulation
4. Experiments and Discussion
4.1. Subjective Effectiveness Evaluation of the Proposed Method in Simulating Aneurysm Progression
4.2. Subjective Effectiveness Evaluation of the Proposed Method in Simulating Different Artery and Aneurysm Morphologies
4.3. Efficiency Evaluation of the Proposed Method
4.4. Parametric Analysis of the Proposed Simulation Model
5. Conclusions
Supplementary Materials
Author Contributions
Funding
Data Availability Statement
Acknowledgments
Conflicts of Interest
References
- Brisman, J.L.; Song, J.K.; Newell, D.W. Cerebral aneurysms. N. Engl. J. Med. 2006, 355, 928–939. [Google Scholar] [CrossRef]
- Rincon, F.; Rossenwasser, R.H.; Dumont, A. The epidemiology of admissions of nontraumatic subarachnoid hemorrhage in the United States. Neurosurgery 2013, 73, 217–223. [Google Scholar] [CrossRef] [PubMed]
- Texakalidis, P.; Sweid, A.; Mouchtouris, N.; Peterson, E.C.; Sioka, C.; Rangel-Castilla, L.; Reavey-Cantwell, J.; Jabbour, P. Aneurysm formation, growth, and rupture: The biology and physics of cerebral aneurysms. World Neurosurg. 2019, 130, 277–284. [Google Scholar] [CrossRef] [PubMed]
- Chentanez, N.; Muller, M. Real-time eulerian water simulation using a restricted tall cell grid. ACM Siggraph 2011, 30, 82. [Google Scholar] [CrossRef]
- Wen, J.; Ma, H. Real-time smoke simulation based on vorticity preserving lattice Boltzmann method. Vis. Comput. 2019, 35, 1279–1292. [Google Scholar] [CrossRef]
- Hu, L.; Chen, M.; Liu, P.X.; Xu, S. A vortex method of 3D smoke simulation for virtual surgery. Comput. Methods Programs Biomed. 2021, 198, 105813. [Google Scholar] [CrossRef]
- Sequeira, A.; Bodnár, T. Blood Coagulation Simulations using a Viscoelastic Model. Math. Model. Nat. Phenom. 2014, 9, 34–45. [Google Scholar] [CrossRef]
- Leiderman, K.; Fogelson, A.L. Grow with the flow: A spatial-temporal model of platelet deposition and blood coagulation under flow. Math. Med. Biol. J. IMA 2011, 28, 47–84. [Google Scholar] [CrossRef] [PubMed]
- Solenthaler, B.; Pajarola, R. Predictive-corrective incompressible SPH. ACM Trans. Graph. 2009, 28, 40. [Google Scholar] [CrossRef]
- Foster, N.; Metaxas, D.N. Realistic Animation of Liquids. Graph. Model. Image Process. 1995, 58, 471–483. [Google Scholar] [CrossRef]
- Chen, X.; Wang, R.; Lin, S.; Wang, F.; Luo, X. Thrombus Clotting Simulation Method Based on the Gillespie Method. J. Comput.-Aided Des. Comput. Graph 2019, 31, 1301–1311. [Google Scholar] [CrossRef]
- Wang, F.; Xu, S.; Jiang, D.; Zhao, B.; Dong, X.; Zhou, T.; Luo, X. Particle hydrodynamic simulation of thrombus formation using velocity decay factor. Comput. Methods Programs Biomed. 2021, 207, 106173. [Google Scholar] [CrossRef]
- Faizal, W.; Ghazali, N.; Khor, C.; Badruddin, I.A.; Zainon, M.; Yazid, A.A.; Ibrahim, N.B.; Razi, R.M. Computational fluid dynamics modelling of human upper airway: A review. Comput. Methods Programs Biomed. 2020, 196, 105627. [Google Scholar] [CrossRef]
- Lopes, D.; Puga, H.; Teixeira, J.; Lima, R. Blood flow simulations in patient-specific geometries of the carotid artery: A systematic review. J. Biomech. 2020, 111, 110019. [Google Scholar] [CrossRef]
- Muller, M.; Charypar, D.; Gross, M. Particle-based fluid simulation for interactive applications. In Proceedings of the 2003 ACM SIGGRAPH/Eurographics Symposium on Computer Animation, San Diego, CA, USA, 26–27 July 2003; pp. 154–159. [Google Scholar]
- Badgaish, M.; Lin, J.E.; Seshaiyer, P. Nonlinear Dynamics and Analysis of Intracranial Saccular Aneurysms with Growth and Remodeling. J. Nonlinear Dyn. 2016, 2016, 2869083. [Google Scholar] [CrossRef]
- Hademenos, G.; Massoud, T.; Valentino, D.; Duckwiler, G.; Viñuela, F. A nonlinear mathematical model for the development and rupture of intracranial saccular aneurysms. Neurol. Res. 1994, 16, 376–384. [Google Scholar] [CrossRef]
- Chitanvis, S.; Hademenos, G.; Powers, W. Hemodynamic assessment of the development and rupture of intracranial aneurysms using computational simulations. Neurol. Res. 1995, 17, 426–434. [Google Scholar] [CrossRef] [PubMed]
- Perktold, K.; Kenner, T.; Hilbert, D.; Spork, B.; Florian, H. Numerical blood flow analysis: Arterial bifurcation with a saccular aneurysm. Basic Res. Cardiol. 1988, 83, 24–31. [Google Scholar] [CrossRef] [PubMed]
- Bridson, R. Fluid Simulation for Computer Graphics, 2nd ed.; A K Peters/CRC Press: Natick, MA, USA, 2015; pp. 1–256. [Google Scholar]
- Becker, M.; Teschner, M. Weakly compressible SPH for free surface flows. In Proceedings of the 2007 ACM SIGGRAPH/Eurographics Symposium on Computer Animation, San Diego, CA, USA, 2–4 August 2007; pp. 209–217. [Google Scholar]
- Schechter, H.; Bridson, R. Ghost SPH for animating water. ACM Trans. Graph. 2012, 31, 1–8. [Google Scholar] [CrossRef]
- Bridson, R. Fast Poisson Disk Sampling in Arbitrary Dimensions. In Proceedings of the ACM SIGGRAPH 2007 Sketches, SIGGRAPH ’07, San Diego, CA, USA, 5–9 August 2007; p. 22. [Google Scholar]
- Macklin, M.; Müller, M. Position Based Fluids. ACM Trans. Graph. 2013, 32, 104. [Google Scholar] [CrossRef]
- Winchenbach, R.; Hochstetter, H.; Kolb, A. Infinite continuous adaptivity for incompressible SPH. ACM Trans. Graph. 2017, 36, 102. [Google Scholar] [CrossRef]
- Ihmsen, M.; Cornelis, J.; Solenthaler, B.; Horvath, C.; Teschner, M. Implicit Incompressible SPH. IEEE Trans. Vis. Comput. Graph. 2014, 20, 426–435. [Google Scholar] [CrossRef]
- Kang, N.; Sagong, D. Incompressible SPH using the Divergence-Free Condition. Comput. Graph. Forum 2014, 33, 219–228. [Google Scholar] [CrossRef]
- Bender, J.; Koschier, D. Divergence-Free Smoothed Particle Hydrodynamics. In Proceedings of the SCA ’15, Los Angeles, CA, USA, 7–9 August 2015; pp. 147–155. [Google Scholar]
- Bender, J.; Koschier, D. Divergence-Free SPH for Incompressible and Viscous Fluids. IEEE Trans. Vis. Comput. Graph. 2017, 23, 1193–1206. [Google Scholar] [CrossRef] [PubMed]
- Wang, F.; Lin, S.; Wang, R.; Li, Y.; Zhao, B.; Luo, X. Improving Incompressible SPH Simulation Efficiency by Integrating Density-Invariant and Divergence-Free Conditions. In Proceedings of the ACM SIGGRAPH 2018 Posters, SIGGRAPH ’18, Vancouver, BC, Canada, 12–16 August 2018. [Google Scholar]
- Wang, F.; Lin, S.; Luo, X.; Wang, R. Coupling Computation of Density-Invariant and Divergence-Free for Improving Incompressible SPH Efficiency. IEEE Access 2020, 8, 135912–135919. [Google Scholar] [CrossRef]
- Laha, S.; Fourtakas, G.; Das, P.K.; Keshmiri, A. Graphics processing unit accelerated modeling of thrombus formation in cardiovascular systems using smoothed particle hydrodynamics. Phys. Fluids 2025, 37, 021902. [Google Scholar] [CrossRef]
- Laha, S.; Fourtakas, G.; Das, P.K.; Keshmiri, A. Smoothed particle hydrodynamics based FSI simulation of the native and mechanical heart valves in a patient-specific aortic model. Sci. Rep. 2024, 14, 6762. [Google Scholar] [CrossRef]
- Topalovic, M.; Nikolic, A.; Milovanovic, V. Smoothed particle hydrodynamics for blood flow analysis: Development of particle lifecycle algorithm. Comput. Part. Mech. 2022, 9, 1119–1135. [Google Scholar] [CrossRef]
- Sigalotti, L.D.G.; Rendón, O.; Klapp, J.; Vargas, C.A.; Cruz, F. A new insight into the consistency of the SPH interpolation formula. Appl. Math. Comput. 2019, 356, 50–73. [Google Scholar] [CrossRef]
- Chitanvis, S.; Dewey, M.; Hademenos, G.; Powers, W.; Massoud, T. A nonlinear quasi-static model of intracranial aneurysms. Neurol. Res. 1997, 19, 489–496. [Google Scholar] [CrossRef]
- Nieto, J.J.; Torres, A. A nonlinear biomathematical model for the study of intracranial aneurysms. J. Neurol. Sci. 2000, 177, 18–23. [Google Scholar] [CrossRef]
- Nikolov, S.; Stoytchev, S.; Torres, A.; Nieto, J.J. Biomathematical modeling and analysis of blood flow in an intracranial aneurysm. Neurol. Res. 2003, 25, 497–504. [Google Scholar] [CrossRef]
- Farnoush, A.; Qian, Y.; Avolio, A. Effect of inflow on computational fluid dynamic simulation of cerebral bifurcation aneurysms. In Proceedings of the 33rd Annual International Conference of the IEEE Engineering in Medicine and Biology Society, Boston, MA, USA, 30 August–3 September 2011; pp. 1025–1028. [Google Scholar]
- Fu, C.; Yan, Z.; Zhang, H.; Ling, F. Advances in Numerical Simulations on the Hemodynamic of Intracranial Aneurysms and Their Rupture Mechanism. Adv. Mech. 2001, 31, 84–94. [Google Scholar]
- Chalouhi, N.; Hoh, B.L.; Hasan, D. Review of Cerebral Aneurysm Formation, Growth, and Rupture. Stroke 2013, 44, 3613–3622. [Google Scholar] [CrossRef]
- Zhang, M.; Shang, R.; Zhang, C.; Li, X.; Que, P.; Wei, X. Advances in hemodynamics of intracranial aneurysms. J. Mudanjiang Med. Univ. 2021, 42, 135–137. [Google Scholar]
- Holzapfel, G.A. Nonlinear Solid Mechanics: A Continuum Approach for Engineering Science. Meccanica 2002, 37, 489–490. [Google Scholar] [CrossRef]
- Humphrey, J.D. Cardiovascular Solid Mechanics: Cells, Tissues, and Organs; Springer: New York, NY, USA, 2002. [Google Scholar]
- Murray, C.D. The Physiological Principle of Minimum Work Applied to the Angle of Branching of Arteries. J. Gen. Physiol. 1926, 23, 835–841. [Google Scholar] [CrossRef] [PubMed]
- Burleson, A.C.; Strother, C.M.; Turitto, V.T. Computer modeling of intracranial saccular and lateral aneurysm for the study of their hemodynamics. Neurosurgery 1995, 37, 774–784. [Google Scholar] [CrossRef] [PubMed]


| Parameters | Value | Unit | Description |
|---|---|---|---|
| 1050.0 | kg/m3 | Density of particles | |
| 1000.0 | kg/m3 | Density of tissue fluid | |
| a | 0.01 | m2 | Cross-sectional area of tissue fluid acting on aneurysm |
| c | 1500.0 | m/s | Propagation velocity in the wave equation |
| 800.0 | N/m | Scale factor of elastin | |
| 3.52 | N/m | Scale factor of collagen | |
| 20.0 | m2 | Cross-sectional area of elastin | |
| 10.0 | m2 | Cross-sectional area of collagen | |
| 1.1 | – | Intensity coefficient of the relationship between aneurysm wall thickness and aneurysm radius | |
| 0.4 | – | Poisson’s ratio | |
| – | Porosity | ||
| – | Angle of bifurcation | ||
| 0.025 | – | Ratio of initial thickness h of the artery wall to the radius of the artery |
| No. | Shape | Neck Width of Aneurysm | Base Width of Aneurysm |
|---|---|---|---|
| 1 | Hemispherical | 1.6R | 1.6R |
| 2 | Spherical | 1.2R | 2.4R |
| 3 | Piriform | 1.2R | 1.6R |
| TC | Number of Particles | Aneurysm * | FPS | |
|---|---|---|---|---|
| CPU | CUDA (CPU + GPU) | |||
| 1 | 5520 | ✓ | 5.65 | 86.95 |
| 2 | 15,456 | ✓ | 1.61 | 54.56 |
| 3 | 15,456 | × | 1.72 | 54.15 |
| 4 | 40,296 | ✓ | 0.45 | 11.10 |
| 0.4 | |||
|---|---|---|---|
| Angle | Angle | ||
| Number of Frame When Ruptured | () | Number of Frame When Ruptured | |
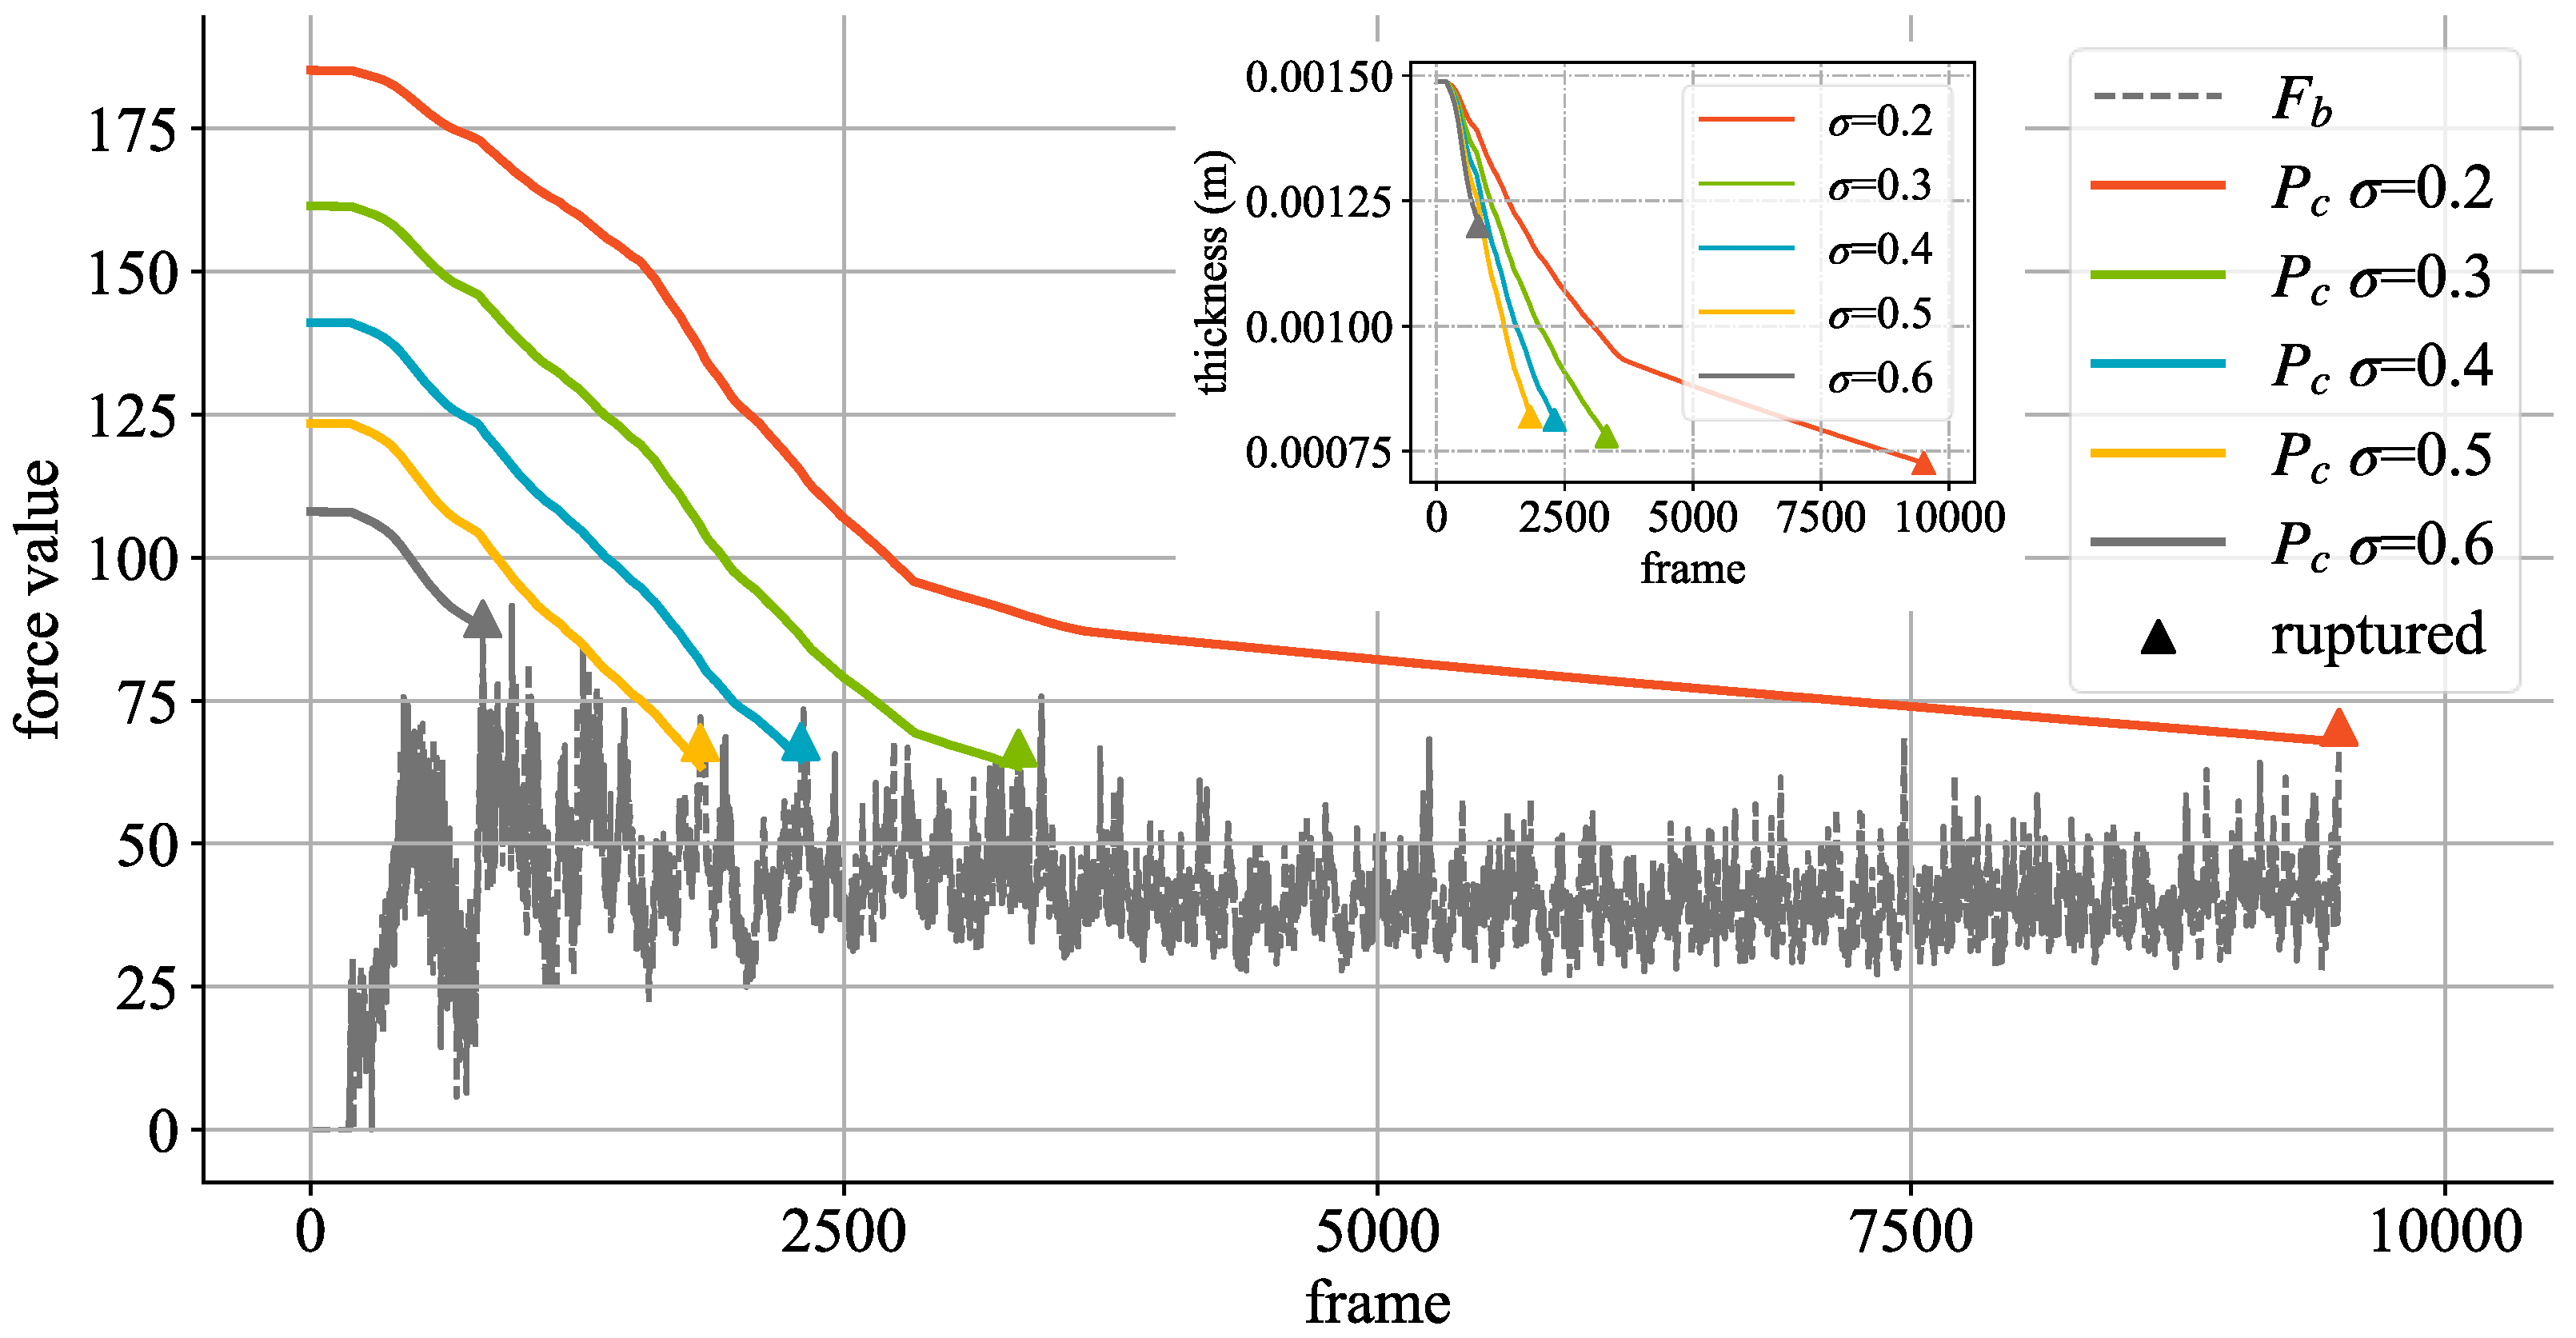
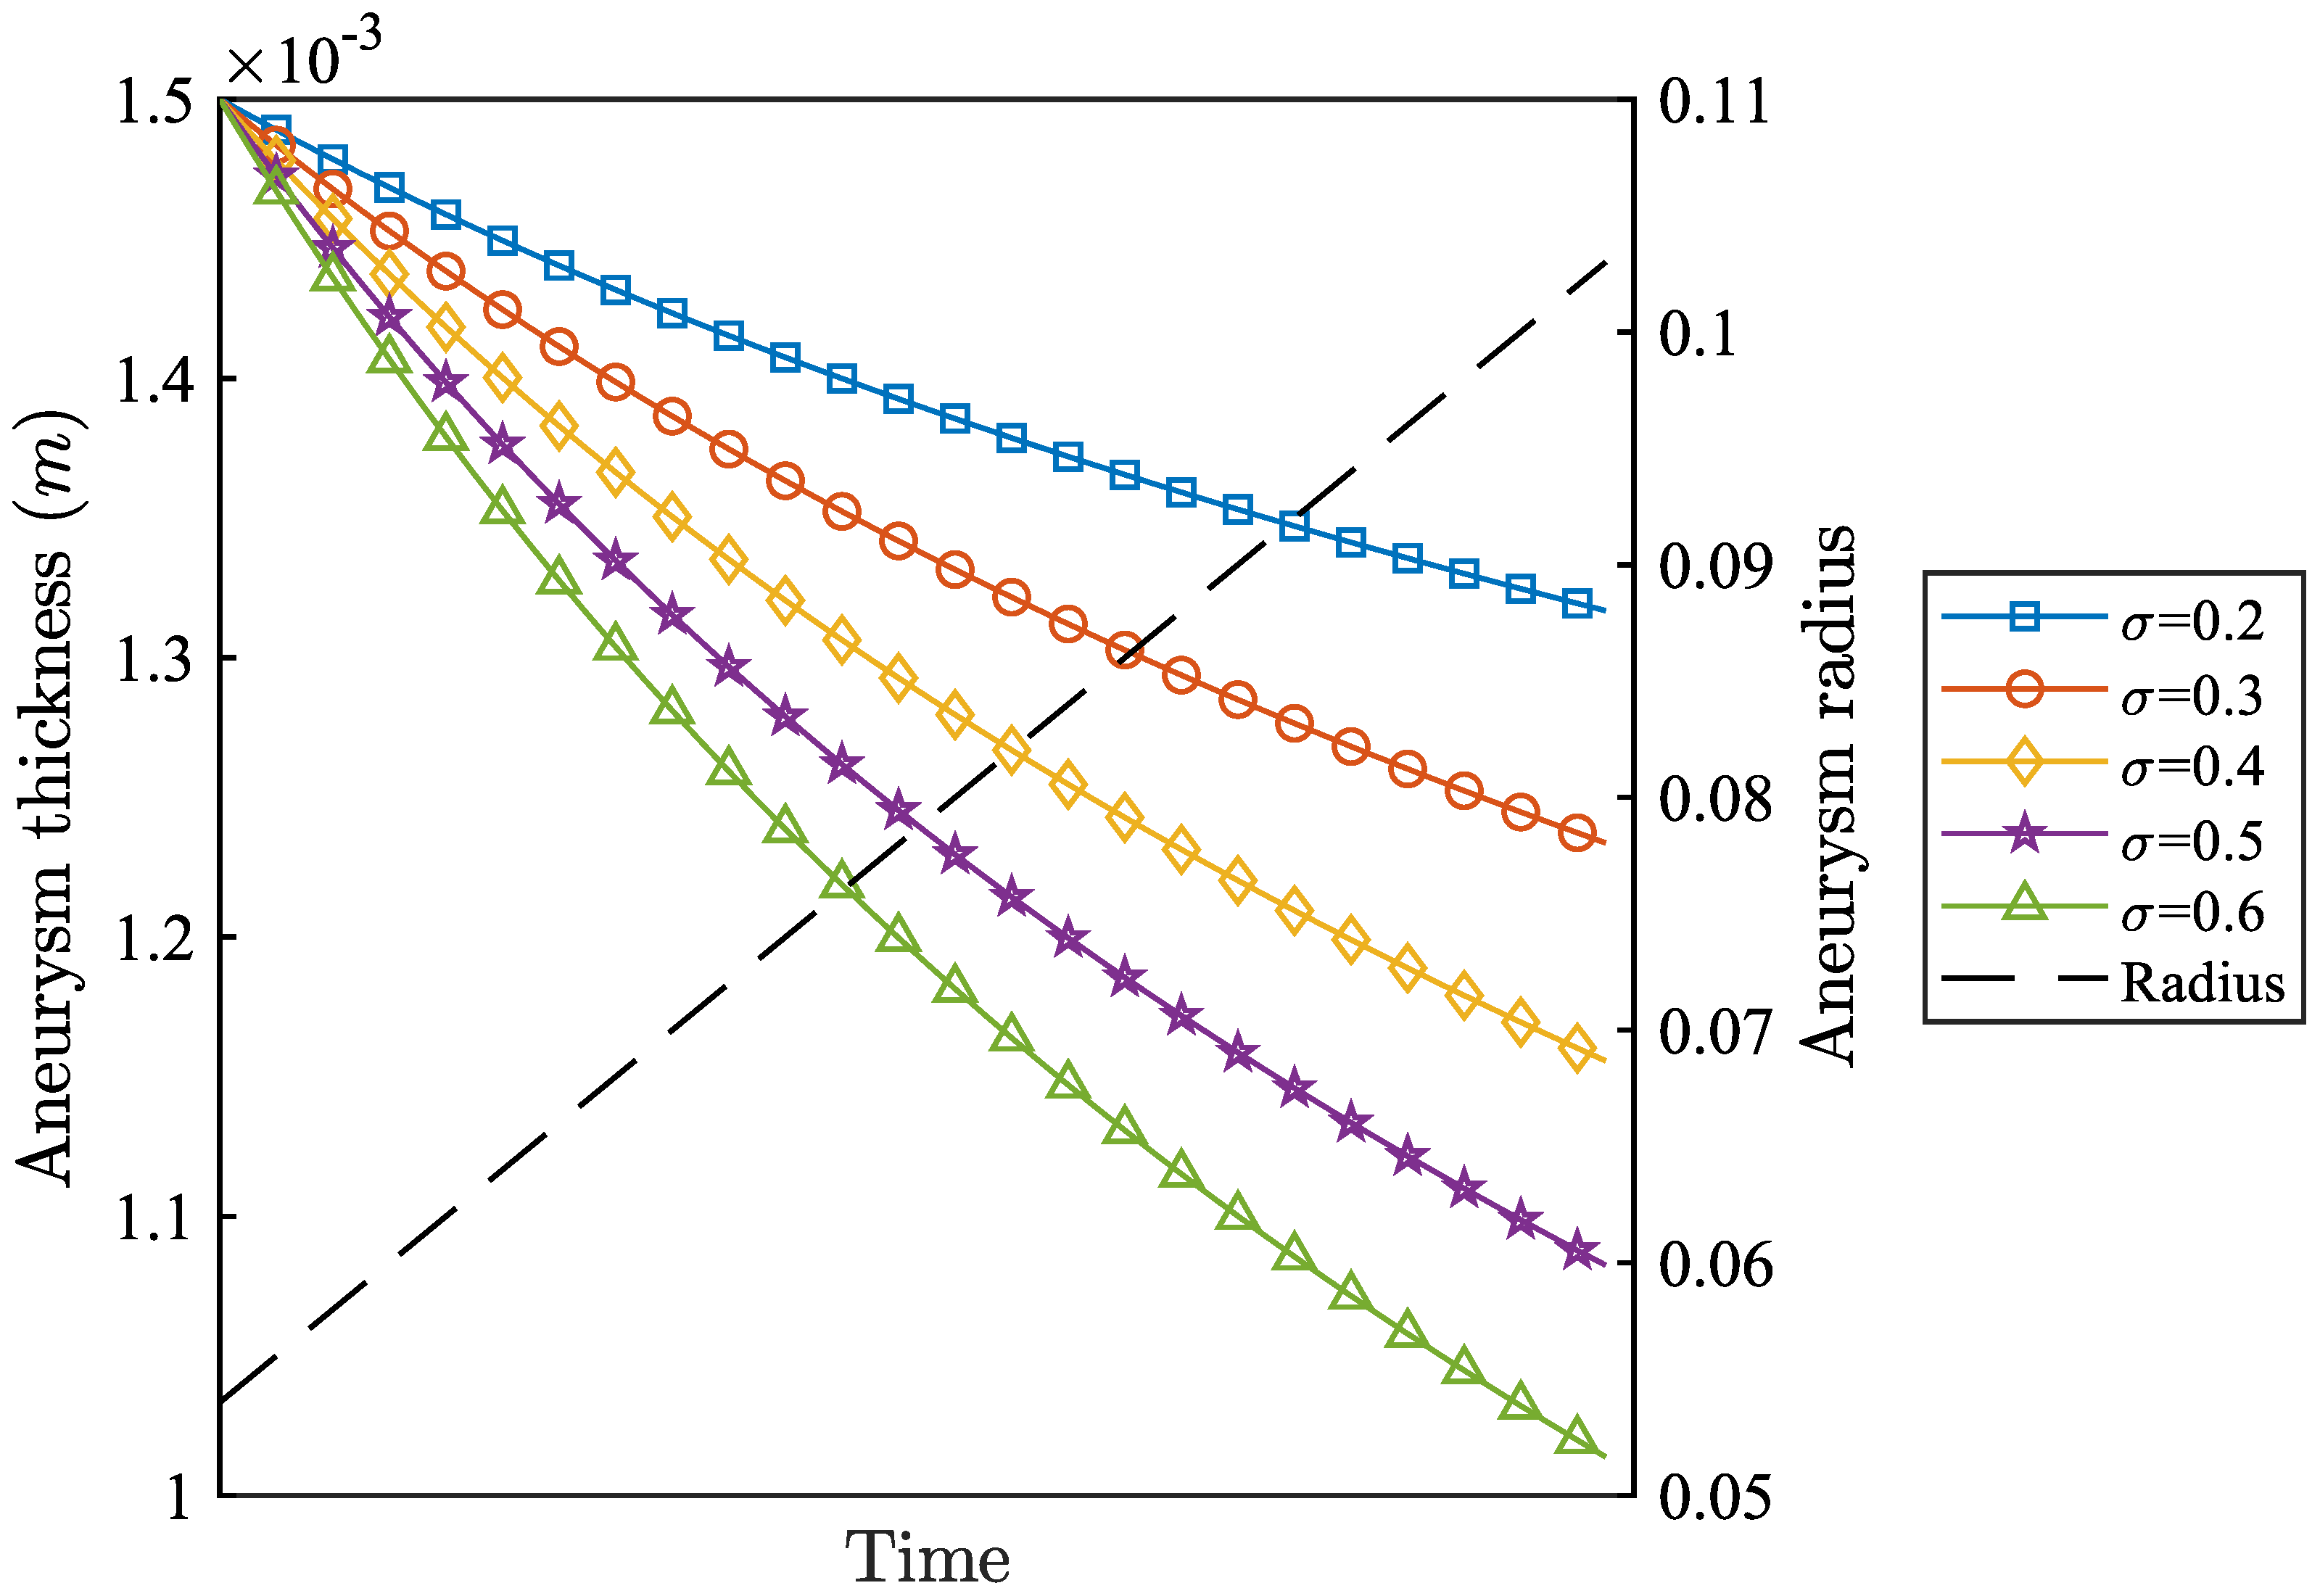
| 0.2 | 9505 | 3 | 2299 |
| 0.3 | 3318 | 4 | 946 |
| 0.4 | 2299 | 5 | 807 |
| 0.5 | 1828 | 6 | 437 |
| 0.6 | 809 | – | – |
Disclaimer/Publisher’s Note: The statements, opinions and data contained in all publications are solely those of the individual author(s) and contributor(s) and not of MDPI and/or the editor(s). MDPI and/or the editor(s) disclaim responsibility for any injury to people or property resulting from any ideas, methods, instructions or products referred to in the content. |
© 2025 by the authors. Licensee MDPI, Basel, Switzerland. This article is an open access article distributed under the terms and conditions of the Creative Commons Attribution (CC BY) license (https://creativecommons.org/licenses/by/4.0/).
Share and Cite
Wu, Y.; Wang, F.; Sun, X.; Liu, Z.; Xiong, Z.; Zhang, M.; Zhao, B.; Zhou, T. Computational Simulation of Aneurysms Using Smoothed Particle Hydrodynamics. Mathematics 2025, 13, 2439. https://doi.org/10.3390/math13152439
Wu Y, Wang F, Sun X, Liu Z, Xiong Z, Zhang M, Zhao B, Zhou T. Computational Simulation of Aneurysms Using Smoothed Particle Hydrodynamics. Mathematics. 2025; 13(15):2439. https://doi.org/10.3390/math13152439
Chicago/Turabian StyleWu, Yong, Fei Wang, Xianhong Sun, Zibo Liu, Zhi Xiong, Mingzhi Zhang, Baoquan Zhao, and Teng Zhou. 2025. "Computational Simulation of Aneurysms Using Smoothed Particle Hydrodynamics" Mathematics 13, no. 15: 2439. https://doi.org/10.3390/math13152439
APA StyleWu, Y., Wang, F., Sun, X., Liu, Z., Xiong, Z., Zhang, M., Zhao, B., & Zhou, T. (2025). Computational Simulation of Aneurysms Using Smoothed Particle Hydrodynamics. Mathematics, 13(15), 2439. https://doi.org/10.3390/math13152439