Article

Developing a Model to Predict the Effectiveness of Vaccination on Mortality Caused by COVID-19

by
Malihe Niksirat
1,
Javad Tayyebi
2,
Seyedeh Fatemeh Javadi
1 and
Adrian Marius Deaconu
3,*
1
Department of Computer Sciences, Birjand University of Technology, Birjand 97198-66981, Iran
2
Department of Industrial Engineering, Birjand University of Technology, Birjand 97198-66981, Iran
3
Department of Mathematics and Computer Science, Transylvania University of Brașov, 500036 Brașov, Romania
*
Author to whom correspondence should be addressed.
Mathematics 2025, 13(11), 1816; https://doi.org/10.3390/math13111816
Submission received: 18 April 2025 / Revised: 26 May 2025 / Accepted: 27 May 2025 / Published: 29 May 2025
(This article belongs to the Special Issue Advanced Optimization Methods and Applications, 3rd Edition)

Abstract

:
The Coronavirus Disease 2019 (COVID-19) pandemic highlighted the urgent need for effective vaccination strategies to control the virus’s spread and reduce mortality. Machine learning (ML) algorithms offer promising tools for predicting vaccine effectiveness and aiding public health decisions. This study explores the application of various ML techniques, including artificial neural network (ANN), decision tree (DT), K-nearest neighbor (KNN), random forest (RF), and support vector machine (SVM) to model and forecast the impact of vaccination on COVID-19 mortality. The algorithms were evaluated using accuracy, precision, recall, specificity, F-measure, and area under the curve (AUC) metrics. The findings revealed that DT outperformed other ML algorithms, achieving the highest metrics across multiple evaluation criteria. It recorded an accuracy of 92.27%, precision of 92.54%, recall of 91.95%, specificity of 87.92%, F-measure of 92.24%, and an AUC of 94.50%, highlighting its exceptional predictive performance. Moreover, DT demonstrated this high level of accuracy while maintaining minimal computational time. These findings suggest that ML models, particularly DTs, can be valuable in assessing vaccine effectiveness and informing health strategies against COVID-19.

1. Introduction

In December 2019, the outbreak of a novel coronavirus was first identified in humans in Wuhan, China, and within a short period, this virus evolved into a global pandemic [1]. While public health interventions, such as social distancing and quarantine, remain vital in controlling transmission, vaccination constitutes a critical and highly effective strategy for mitigating the spread of COVID-19 [2].
Approximately one year after the emergence of COVID-19, extensive global research efforts led to the development of vaccines aimed at mitigating the spread and severity of the virus. By mid-2020, several vaccines were introduced, eliciting varied responses from different populations. The large-scale production and distribution of multiple vaccine formulations across various countries significantly accelerated immunization efforts, contributing to a substantial increase in vaccination coverage worldwide [3]. The vaccination trends observed across select nations from December 2020 to October 2023 are illustrated in Figure 1. We randomly selected and analyzed data from 15 countries that represent a range of population sizes and geographic regions. The data were obtained from official government reports and were sourced from the Our World in Data project at the University of Oxford. Globally, over 5 billion people have received at least one dose of a COVID-19 vaccine, accounting for approximately 72% of the world’s population.
Using these data, we calculated a vaccination coverage ratio for each country, defined as the number of fully vaccinated individuals divided by the total population. This ratio provides a standardized measure to compare vaccination progress across nations. The data revealed that Sudan had the lowest vaccination ratio, while Spain had the highest, indicating a more successful vaccination effort in the latter. Table 1 displays the specific coverage ratios for each of the selected countries.
Despite the availability of vaccines, understanding their real-world effectiveness and predicting their impact on public health remain essential challenges. Given the vast amount of data generated during the pandemic, there is an urgent demand for advanced analytical tools to assist in evaluating vaccine efficacy and informing health policy decisions. ML algorithms offer promising solutions due to their ability to analyze complex data and generate accurate predictions rapidly [4].
Traditionally, predicting how infectious diseases spread was done using mathematical models, called compartmental models, with the susceptible–infected–removed (SIR) model being the simplest example [5,6]. These models divide the population into groups based on their health status and help simulate epidemic outbreaks [7].
In recent years, ML techniques have been used to improve predictions. Many ML models have been developed to forecast COVID-19 cases and deaths, and they also help evaluate how well vaccines work [8,9,10,11]. According to Rayguru et al. [12], epidemic forecasting models can be grouped into three main types: (i) mechanistic models like SIR, which are based on biological and disease processes, (ii) time series models that analyze data trends over time [13], and (iii) ML models, which are capable of capturing complex patterns in data. Rayguru et al. compared the performance of LSTM and ARIMA models for predicting COVID-19 confirmed and death cases across the U.S. They observed that LSTM, a deep learning model, outperformed ARIMA in forecasting accuracy. Their analysis also indicated that vaccination, particularly dual-dose strategies, contributed significantly to reducing mortality rates [12].
Zaidi et al. developed a predictive model using a voting classifier to forecast future COVID-19 vaccine adoption trends. The study combined multiple ML algorithms to enhance prediction accuracy and robustness [13]. Chhabra et al. proposed an intelligent time-series models to forecast the trends of epidemics like COVID-19, Monkeypox, Influenza and HIV [14].
Omar et al. carried out a study in Egypt to assess the evolving behavior of COVID-19 in the context of ongoing vaccination efforts. This research focused on developing two population-based models to forecast trends. The findings indicated that a high vaccination rate significantly reduced the peak of daily infections compared to previous waves. Additionally, the study’s statistics revealed a decrease in daily infected cases from 160,845 to 125,690 and a reduction in daily deaths at the predicted peak from 64 to 58, highlighting the effectiveness of vaccination efforts [15].
Another similar study has been conducted to develop a model of the COVID-19 epidemic aimed at predicting the impact of vaccination in the United States. This model considers key factors, such as transmission from both asymptomatic and symptomatic infected individuals, reported versus unreported cases, and the reduction in transmission resulting from social distancing measures. Furthermore, this model can be adapted for other aspects of the pandemic, such as analyzing viral variants, vaccine effectiveness across different age groups, and demographic factors [16].
Garcia-Carretero et al. developed models using machine learning algorithms like ElasticNet and RF to estimate the decline in hospitalizations and deaths in Spain attributable to vaccination. Their findings demonstrated a strong inverse relationship between vaccination rollout and COVID-19 severity across age groups, confirming vaccination’s protective effect [17].
Ongoing studies and models suggest that integrating vaccination data, demographic factors, and clinical variables into ML models enhances predictive accuracy [11,18]. For example, models utilizing RF and gradient boosting have been used to identify key predictors of mortality, including vaccination status, age, comorbidities, and social determinants. Moreover, in recent years, numerous studies have focused on conducting surveys of literature reviews and systematic reviews related to applications of ML methods for the COVID-19 pandemic [19,20,21].
This study aims to explore the application of various ML techniques to model and forecast the impact of vaccination on COVID-19 mortality. Key distinctions in forecasting COVID-19 data primarily stem from its dynamic and evolving nature, heterogeneous data sources, and the rapidly changing patterns of infection and vaccination outcomes, which pose unique challenges compared to more static datasets. Handling such temporal variability and data heterogeneity requires careful data preprocessing and model tuning.
Our study primarily focuses on comparative analysis of established ML algorithms applied to COVID-19 mortality prediction. The contribution lies in systematically evaluating their performance within this particular context, which can guide future applications in pandemic modeling and health policy.
The specific objectives are to evaluate the performance of these algorithms using standard metrics and determine their potential in supporting evidence-based health strategies. ML techniques can enhance policy decision-making by providing data-driven insights to effectively address emerging COVID-19 variants and similar infectious disease outbreaks in the future. ML algorithms have proven effective in modeling the impact of vaccination on COVID-19 mortality, offering tools for policymakers to evaluate vaccination strategies and allocate resources efficiently. As data quality improves and models become more sophisticated, these approaches will continue to play a vital role in managing current and future public health crises.
This paper is organized into five sections: Section 1 provides the introduction, literature review discussing previous research and studies conducted in the area of vaccination, and outlines the problem. Section 2 describes the dataset and the models used. The proposed work is demonstrated in Section 3. The numerical results and an assessment of the algorithms are detailed in Section 4. Finally, Section 5 offers the concluding remarks.

2. Methodology

2.1. Dataset

This study utilizes a dataset obtained from Kaggle, which compiles COVID-19 vaccination and mortality data across multiple countries, spanning from December 2020 to 29 March 2022. The dataset primarily includes daily records showcasing vaccination efforts and COVID-19 death tolls for each country, derived from official health authorities, government reports, and international health organizations [22].
The dataset features several key variables essential for understanding the dynamics of the pandemic, as follows:
  • Country: The name of the country.
  • ISO code: Standardized country identifiers.
  • Date: The specific day of record.
  • Total vaccinations: Cumulative count of all vaccine doses administered up to that date.
  • People vaccinated: The number of individuals who have received at least one dose (partial vaccination).
  • People fully vaccinated: The number of individuals who completed the full vaccination course.
  • New death: The cumulative number of COVID-19-related deaths reported on that day.
  • Population: The total population of the country, used for normalization.
  • Vaccination ratio: A derived feature calculated the proportion of the population vaccinated.
Before analysis, comprehensive data quality checks were performed to ensure reliability, as follows:
  • Consistency checks: All date entries were converted into a uniform date–time format. Data were validated against other trusted sources where possible to verify accuracy.
  • Anomaly detection: Exploratory data analysis identified anomalies, such as days with zero reported deaths and sudden spikes in vaccination counts. These anomalies were reviewed to determine their plausibility; where appropriate, smoothing techniques or data flagging were employed to prevent distortion in modeling.
  • Handling missing data: Missing values in key variables were addressed through forward filling or interpolation.
  • Normalization and scaling: Numeric features, such as total vaccinations, total deaths, and vaccination ratios were scaled to standardize the feature ranges. This step aids in model convergence and comparability across features.
  • Feature engineering: New features, such as the vaccination coverage ratio and daily increments in vaccinations and deaths, were created to capture dynamic trends and facilitate deeper insights. Furthermore, a binary classification was adapted based on differential assessment in vaccination and mortality rates. This approach compares the full vaccination rate with the rate of new deaths per population. This approach integrates mean-based threshold and median-based threshold for a more comprehensive evaluation. It is particularly well suited for realistic, context-aware assessments of vaccine effectiveness.
  • Correlation analysis: A correlation analysis was conducted to assess feature importance, revealing several notable insights. The strongest association was observed between higher levels of full vaccination and a reduction in the mortality rate. If the ratio of people vaccinated/people fully vaccinated is high, mortality may not drop significantly. Indeed, a high ratio suggests many are only partially vaccinated, which may be less protective. Overall, mortality tends to decrease as vaccination efforts progress over time. Clearly, small countries achieve high vaccination rates quickly, while large populations face slower declines in mortality.

2.2. Modeling

The steps for designing the research model are shown in Figure 2. First, data were collected from trusted sources to ensure it was accurate and relevant. Next, the data were cleaned and organized in a process called preprocessing, which included fixing missing information, correcting errors, and preparing the data for analysis. This helped create a main database that could be used for applying ML algorithms.
After preparing the data, ML models were applied to find patterns and gain insights. Models’ performance was validated using k-fold cross-validation. This approach partitions the dataset into k subsets, iteratively training on k 1 folds and testing on the remaining fold, where k = 5 . It effectively reduces overfitting by ensuring the model is evaluated on diverse unseen data segments, providing a robust estimate of generalization performance without relying solely on a separate test set.
The results from these models were then tested and validated to check their accuracy and reliability. Based on this validation, the best and most accurate model was selected and finalized. Finally, the completed model was presented, providing useful knowledge and answers related to the research problem.
In this study, we explore the application of various ML techniques, including ANN, DT, KNN, RF, and SVM to model and forecast the impact of vaccination on COVID-19 mortality. The performance of the algorithms was evaluated using several important evaluation criteria, including accuracy, precision, recall, specificity, F-measure, and AUC. Details of the algorithms and evaluation criteria are described in the next section.

3. Proposed Work

ML algorithms play a crucial role in predicting COVID-19 disease progression. This section outlines ML algorithms employed and discusses the methodologies used to assess their performance.

3.1. Machine Learning Algorithms

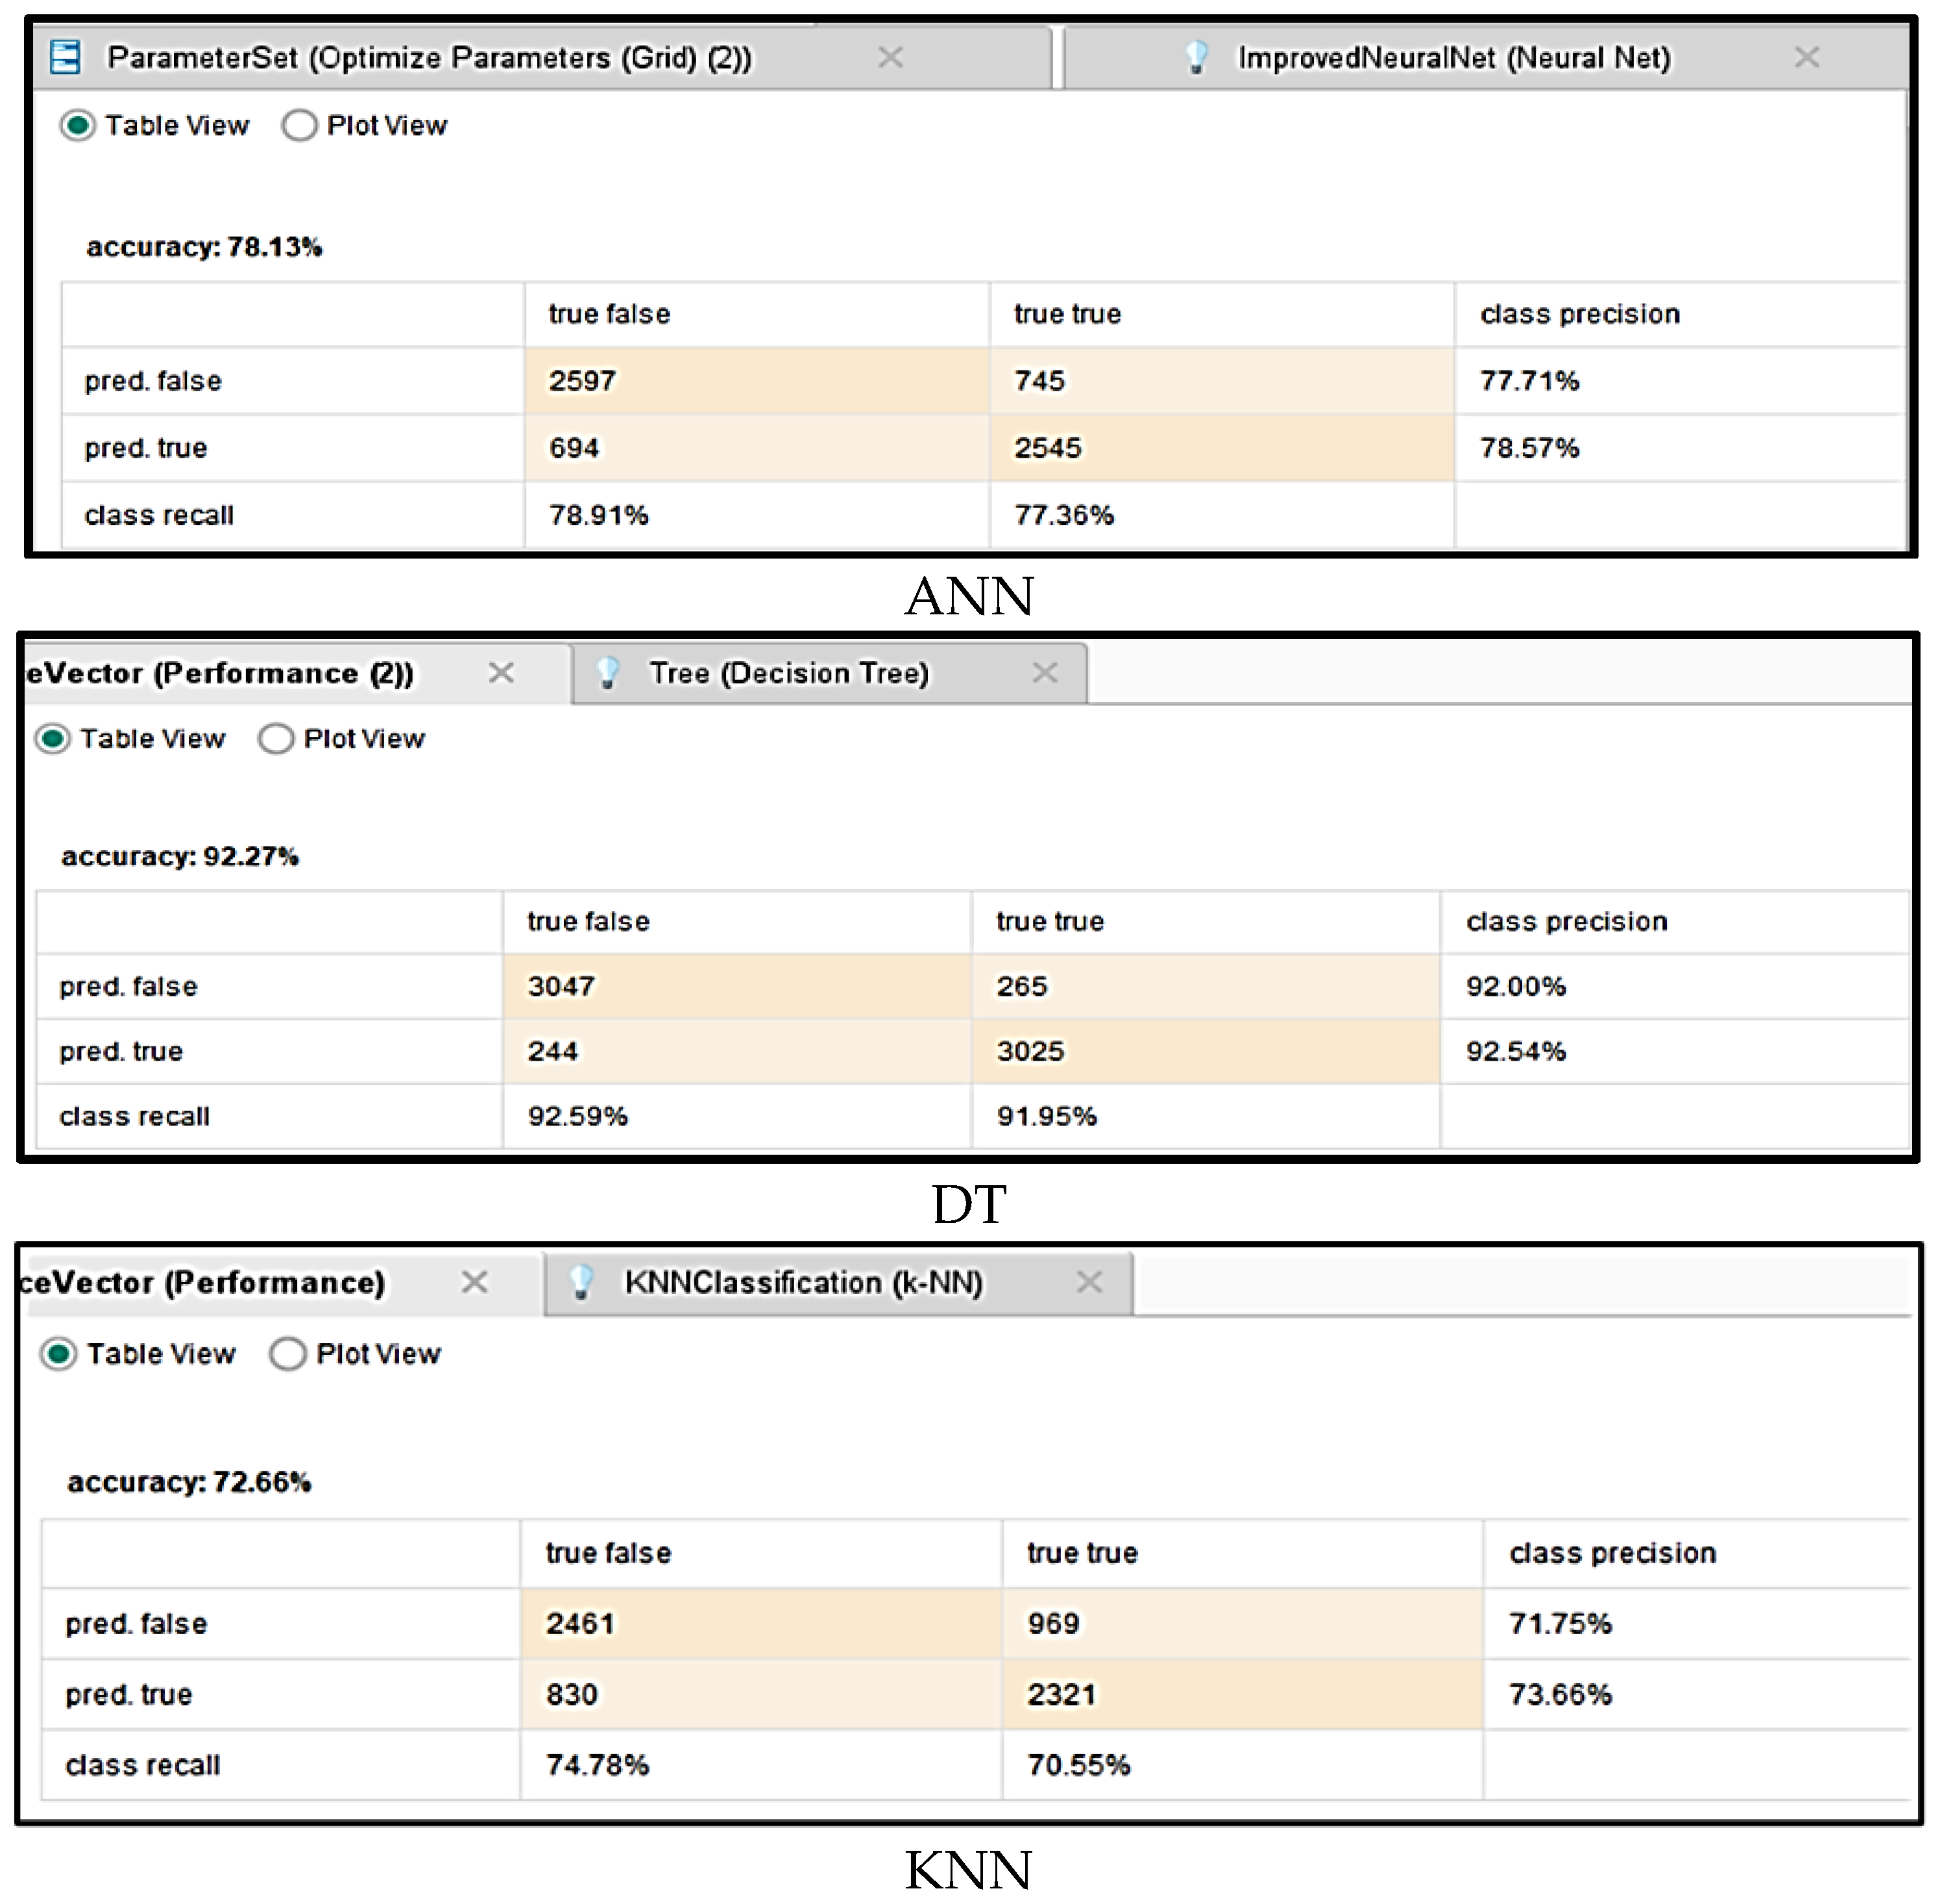
3.1.1. Artificial Neural Network

ANN mimics the human brain by processing information through connected layers of neurons. It has an input layer, one or more hidden layers for complex processing, and an output layer. Data flow from input to hidden layers, where they are transformed, then to the output for the final result [23].
In the ANN algorithm, we began by setting the number of training cycles to 200. We then used the grid search method to optimize two essential parameters: learning rate and momentum. The learning rate controls the magnitude of weight updates during training. This parameter varies between 0 and 1. Momentum, which affects the acceleration of weight changes, ranges from 0 to 2. By applying an optimization process, we fine-tuned these parameters to maximize performance. As shown in Table 2, the optimal learning rate was 0.01, and the ideal momentum value was 0.9.

3.1.2. Decision Tree

DTs are among the most effective methods in ML. They predict outcomes using internal decision nodes and leaf nodes. The process begins at the root node and progresses through branches based on decision rules. The depth of the tree is a key factor, with the typical approach employing divide-and-conquer techniques to make predictions.
DTs operate by following “if–then” rules along branches, where each path from the root to a leaf represents a classification. While DTs are easy to interpret, they tend to grow exponentially with problem size, which is a notable limitation. The main criteria for splitting nodes include information gain, gain ratio, and Gini index. In a top-down approach, the tree is built by partitioning data into subsets with similar values, aiming for maximum homogeneity. The algorithm selects attributes that yield the highest information gain, leading to the most homogeneous branches and optimal splits within the tree [24].
The hyperparameters of the DT are tuned using the grid search method. The maximum depth parameter defines how deep the tree can grow. We varied this parameter incrementally from 12 to 23, identifying 20 as the most optimal value. The confidence level is another key parameter, which influences the calculation of pessimistic pruning error. We tested values ranging from 0.01 to 0.2, with 0.1 emerging as the best choice. The minimal leaf size parameter determines the smallest permissible number of samples in each leaf node; in our case, we set this value to 2. Lastly, we examined the minimal gain parameter, which controls the minimum increase in information gain needed to split a node. Larger values result in fewer branches and, as shown in Table 3, the optimal value for this parameter was 0.01.

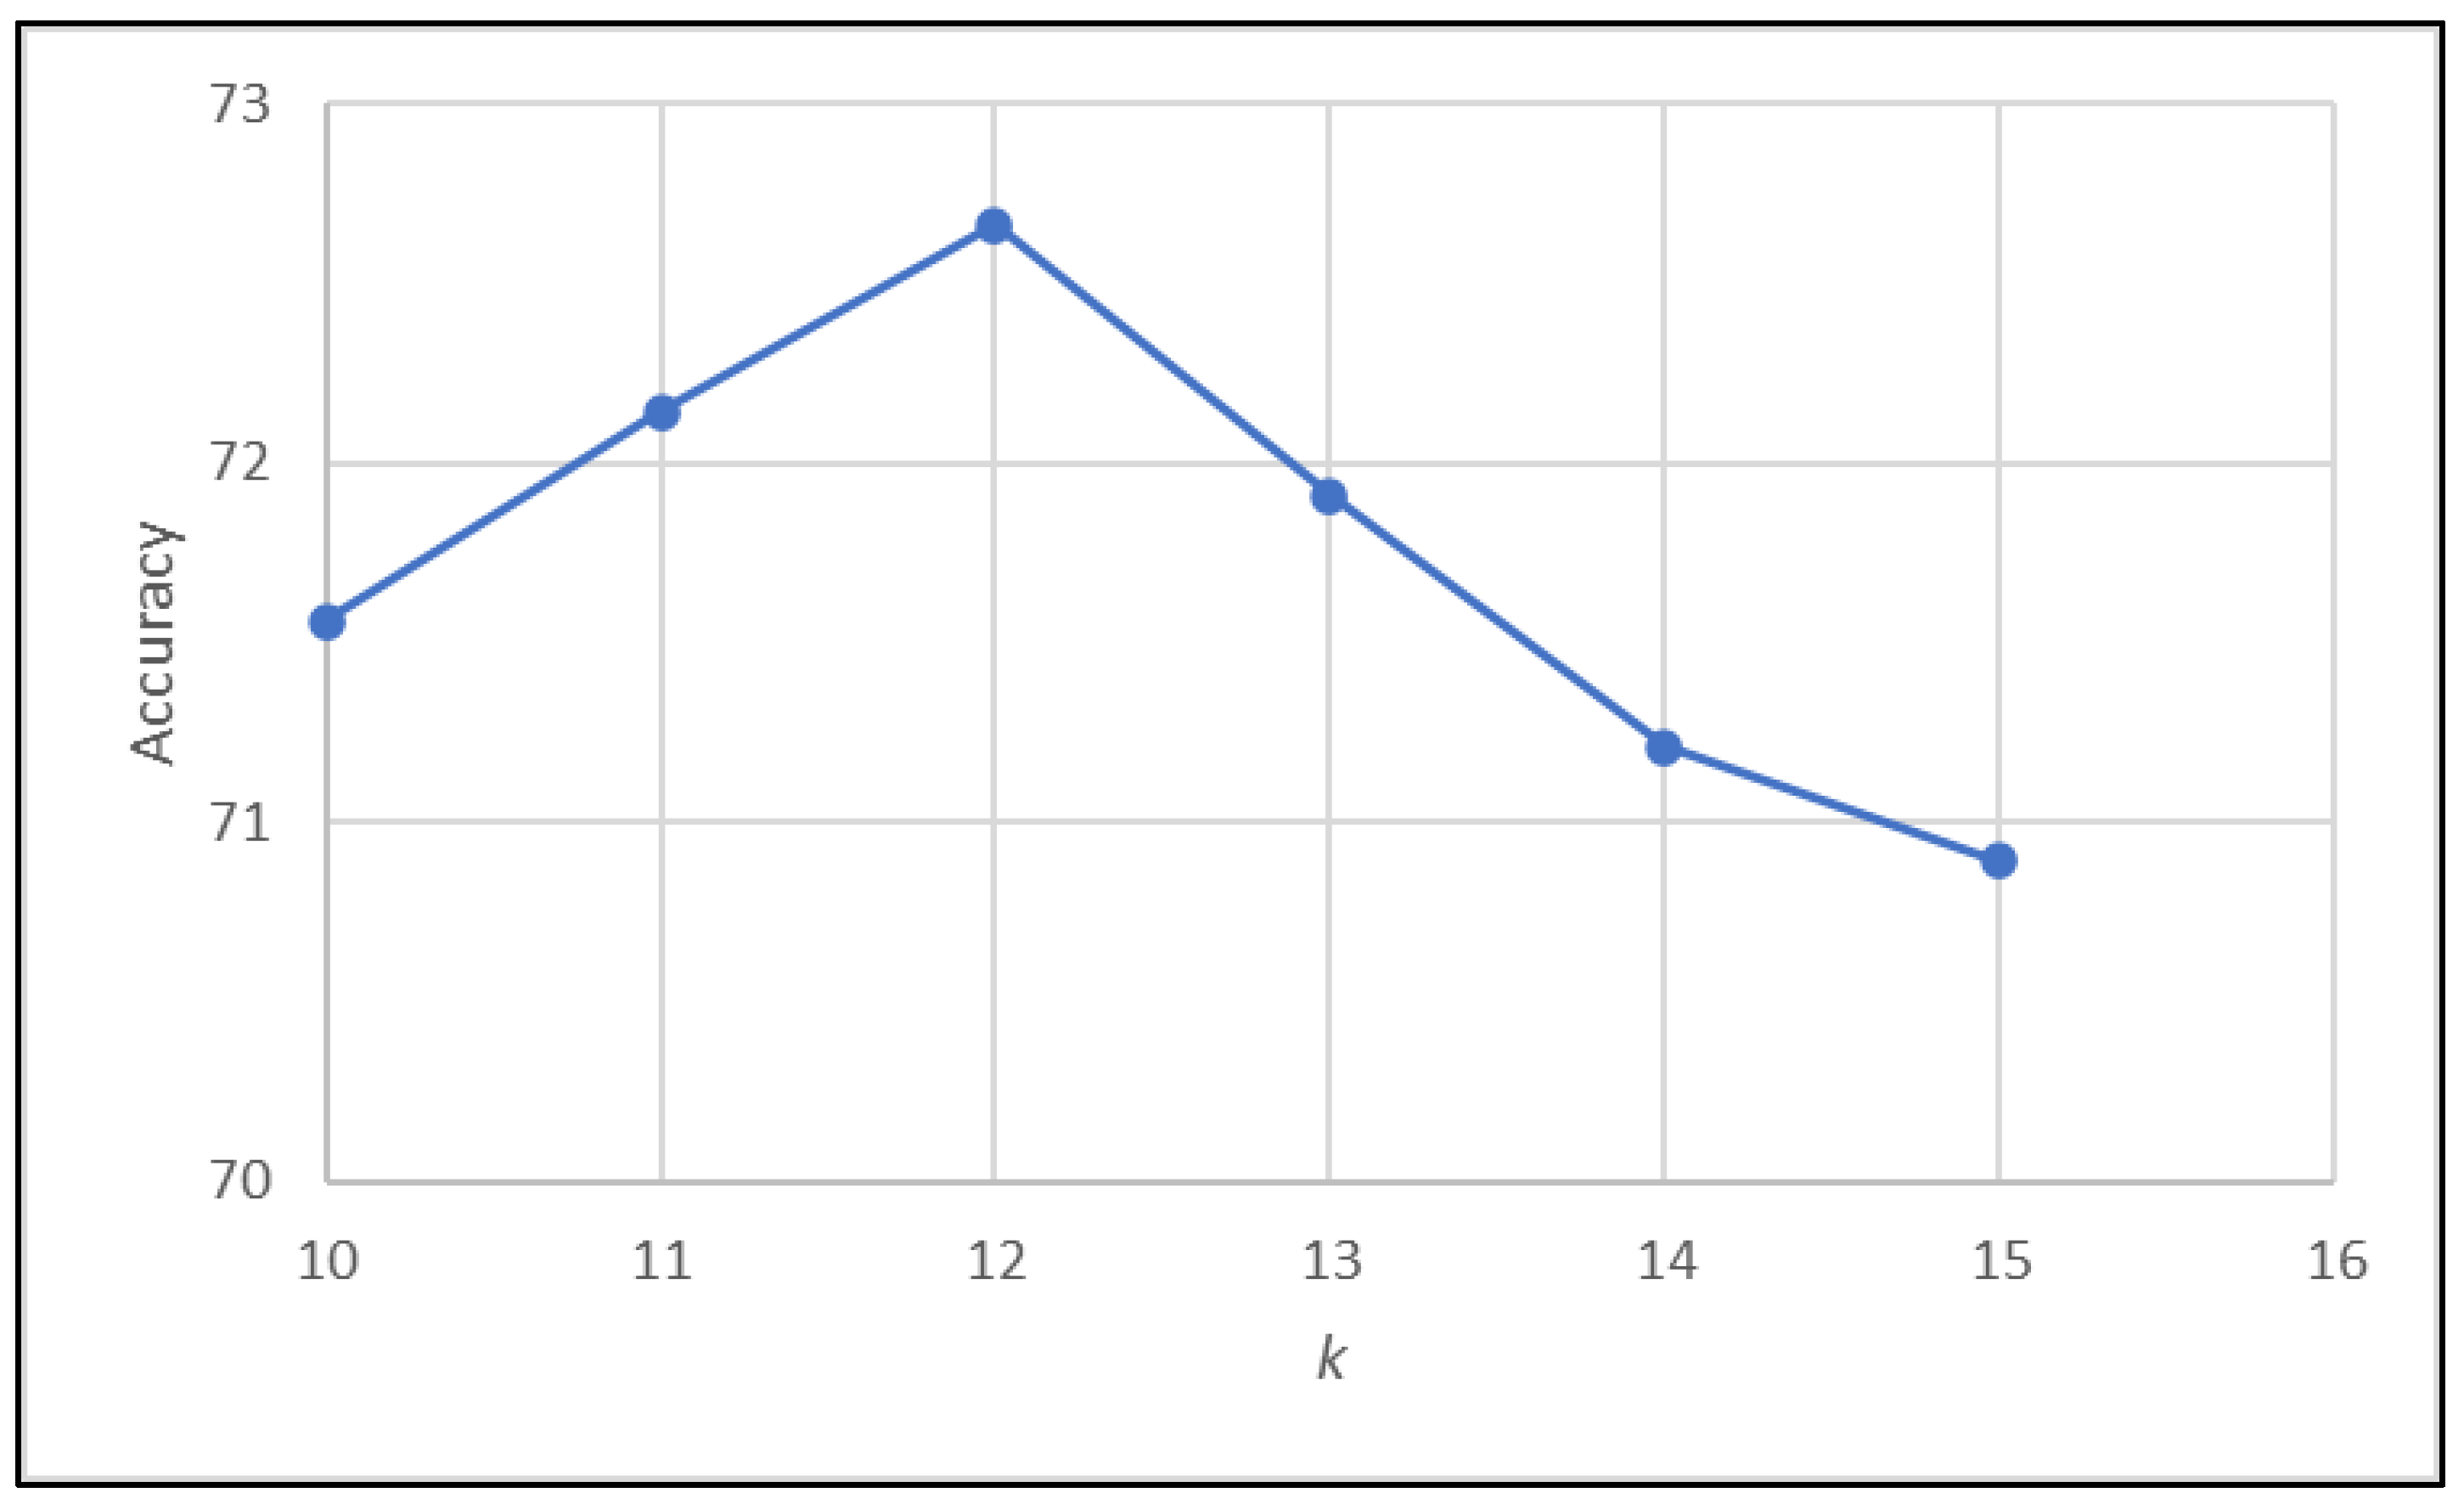
3.1.3. k -Nearest Neighbor

The KNN technique is a straightforward and widely used method in ML. Its effectiveness depends heavily on key parameters, such as the value of k, the distance calculation method, and the selection of relevant predictors. KNN classifies a test sample by measuring its similarity to training samples through distance metrics, determining its class label based on the closest neighbors [25]. This approach is applicable to both classification and regression tasks. Due to its simplicity and strong classification performance, KNN remains a popular choice in data mining [26].
Different distance metrics, such as Euclidean, Manhattan, and Minkowski distances, can be employed to identify the k-nearest neighbors. Among these, Euclidean distance is one of the most common, calculating the straight-line distance between two points in two- or three-dimensional space [27].
KNN is categorized as a lazy learning algorithm because it does not involve an explicit training phase; instead, it uses the entire dataset during classification. It is also considered a non-parametric method since it makes no assumptions about the underlying data distribution, relying solely on the proximity of data points for its predictions [28].
The key parameter in the KNN algorithm is the value of k, which is an integer indicating the number of closest neighbors used to make classifications. In our implementation, we employed the Euclidean distance to identify these neighbors. Figure 3 illustrates how different values of k influence the accuracy of the KNN algorithm. Based on this analysis, a value of 12 was selected as optimal.

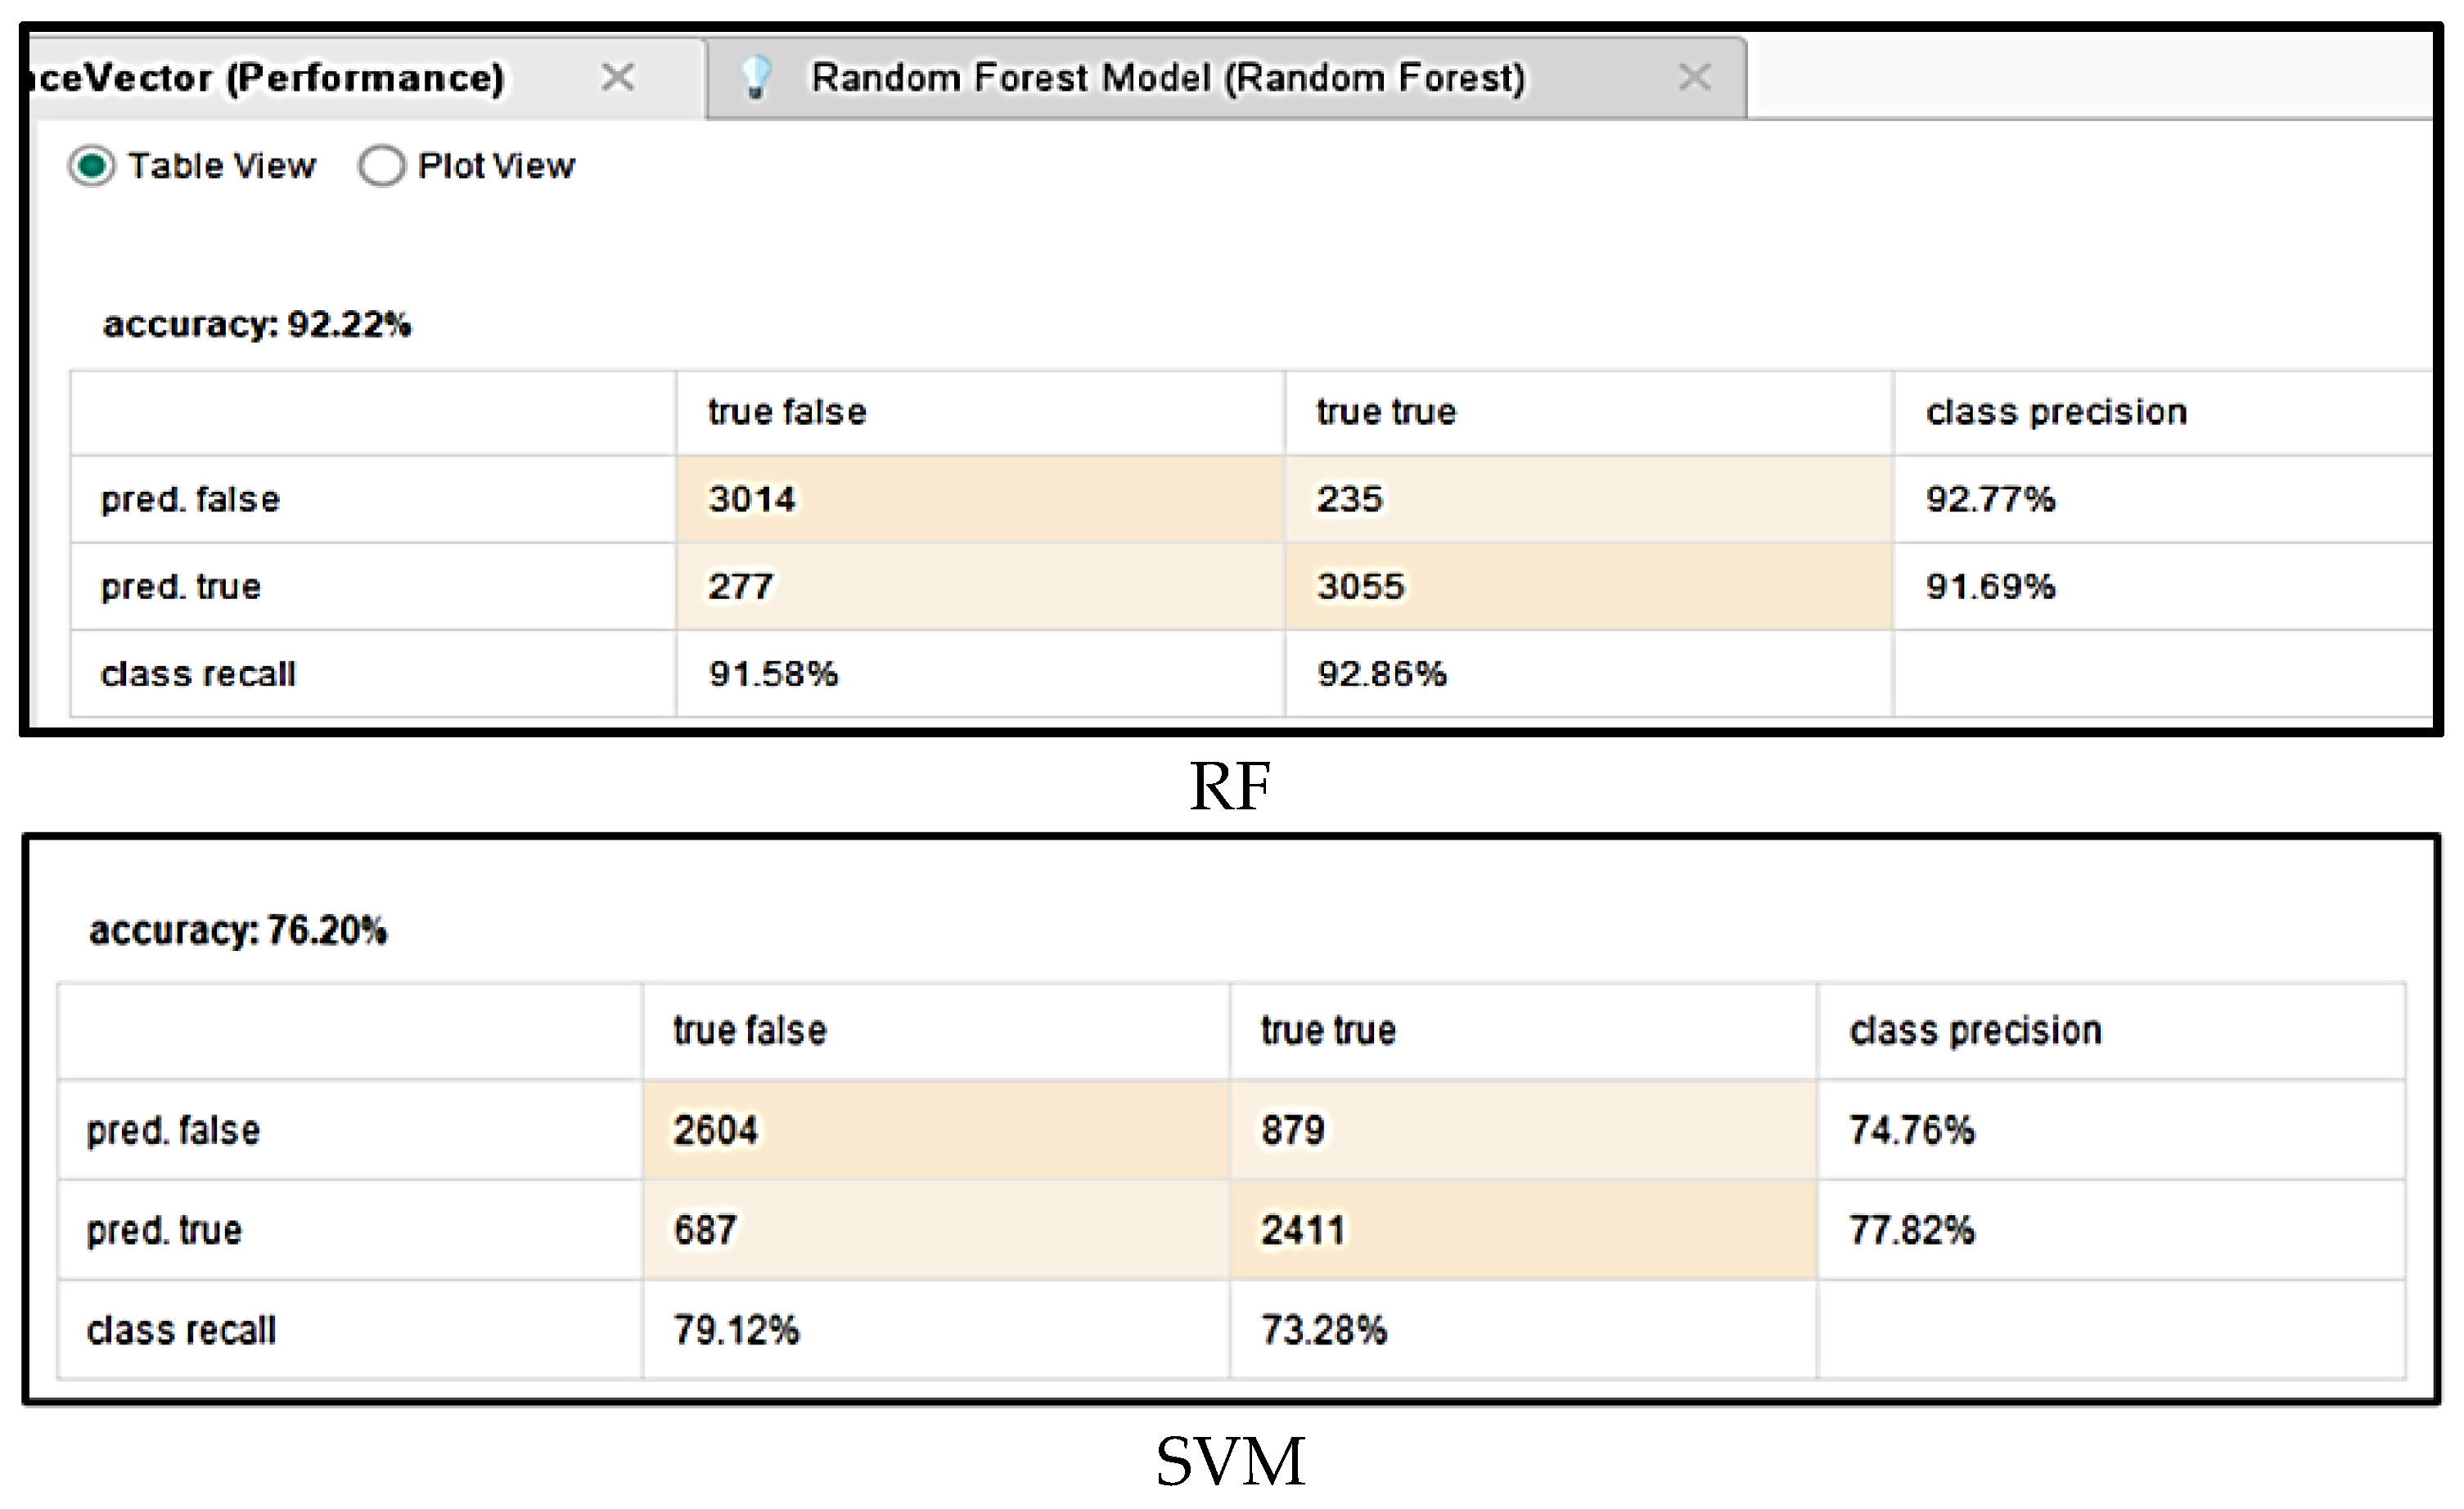
3.1.4. Random Forest

Similar to the KNN algorithm, the RF model is widely recognized as an effective method for both classification and regression tasks. RF operates by aggregating the predictions of multiple DTs to enhance accuracy.
Essentially, an RF consists of a collection of randomly selected DTs, where the number of trees plays a crucial role in determining the overall predictive performance of the model. Each tree independently generates a prediction and, ultimately, the class with the highest number of votes is chosen as the final output.
To construct a robust forest, the bagging technique was employed. This approach ensures diversity among the trees by selecting a random subset of features at each node split, improving the model’s stability and reducing overfitting [29].
To optimize the maximum depth parameter, we incrementally increased its value by one unit within the range of 10 to 18, repeating this process until identifying the most optimal setting. As a result, we determined that a value of 15 was the most suitable.

3.1.5. Support Vector Machine

SVMs are widely applied in various classification tasks, including image recognition, market analysis, product optimization, text categorization, and facial recognition. In classification problems, SVM employs a hyperplane to distinguish between two classes, ensuring maximum separation between them. Each data point is mapped into an n-dimensional space, and a straight line is drawn to categorize distinct datasets. The data points closest to this boundary are known as support vectors, which play a crucial role in defining the hyperplane. The primary objective of this hyperplane is to establish a clear boundary between classes and determine the closest points in each class.
Kernels are a fundamental component of the SVM algorithm, as they enable the transformation of non-linearly separable data into higher-dimensional feature spaces where classification becomes feasible. Various types of kernels exist, each designed for specific data structures and applications. Among the most commonly used kernels are the linear kernel, polynomial kernel, radial basis function (RBF) kernel, and sigmoid kernel [30].
One of the critical challenges in implementing SVM is selecting the most suitable kernel. If the chosen kernel does not align with the underlying data distribution, the model may fail to capture complex patterns, leading to diminished predictive accuracy.
SVM is known for its high classification accuracy and robustness in high-dimensional spaces, making it particularly advantageous for complex datasets. Additionally, since it relies on a subset of training points, SVM is memory-efficient compared to other algorithms, reducing computational overhead while maintaining strong performance [31].

3.2. Evaluation Metrics

The confusion matrix is a structured table that evaluates the effectiveness of a classification algorithm. It provides a visual representation and concise summary of the algorithm’s performance in distinguishing between different classes. The confusion matrix comprises four fundamental values that serve as key metrics for evaluating a classifier’s performance:
  • T P (True Positives): The model correctly predicts positive cases (the actual class is positive, and the prediction is positive).
  • T N (True Negatives): The model correctly predicts negative cases (the actual class is negative, and the prediction is negative).
  • F P (False Positives): The model incorrectly predicts positive when the actual class is negative.
  • F N (False Negatives): The model incorrectly predicts negative when the actual class is positive.
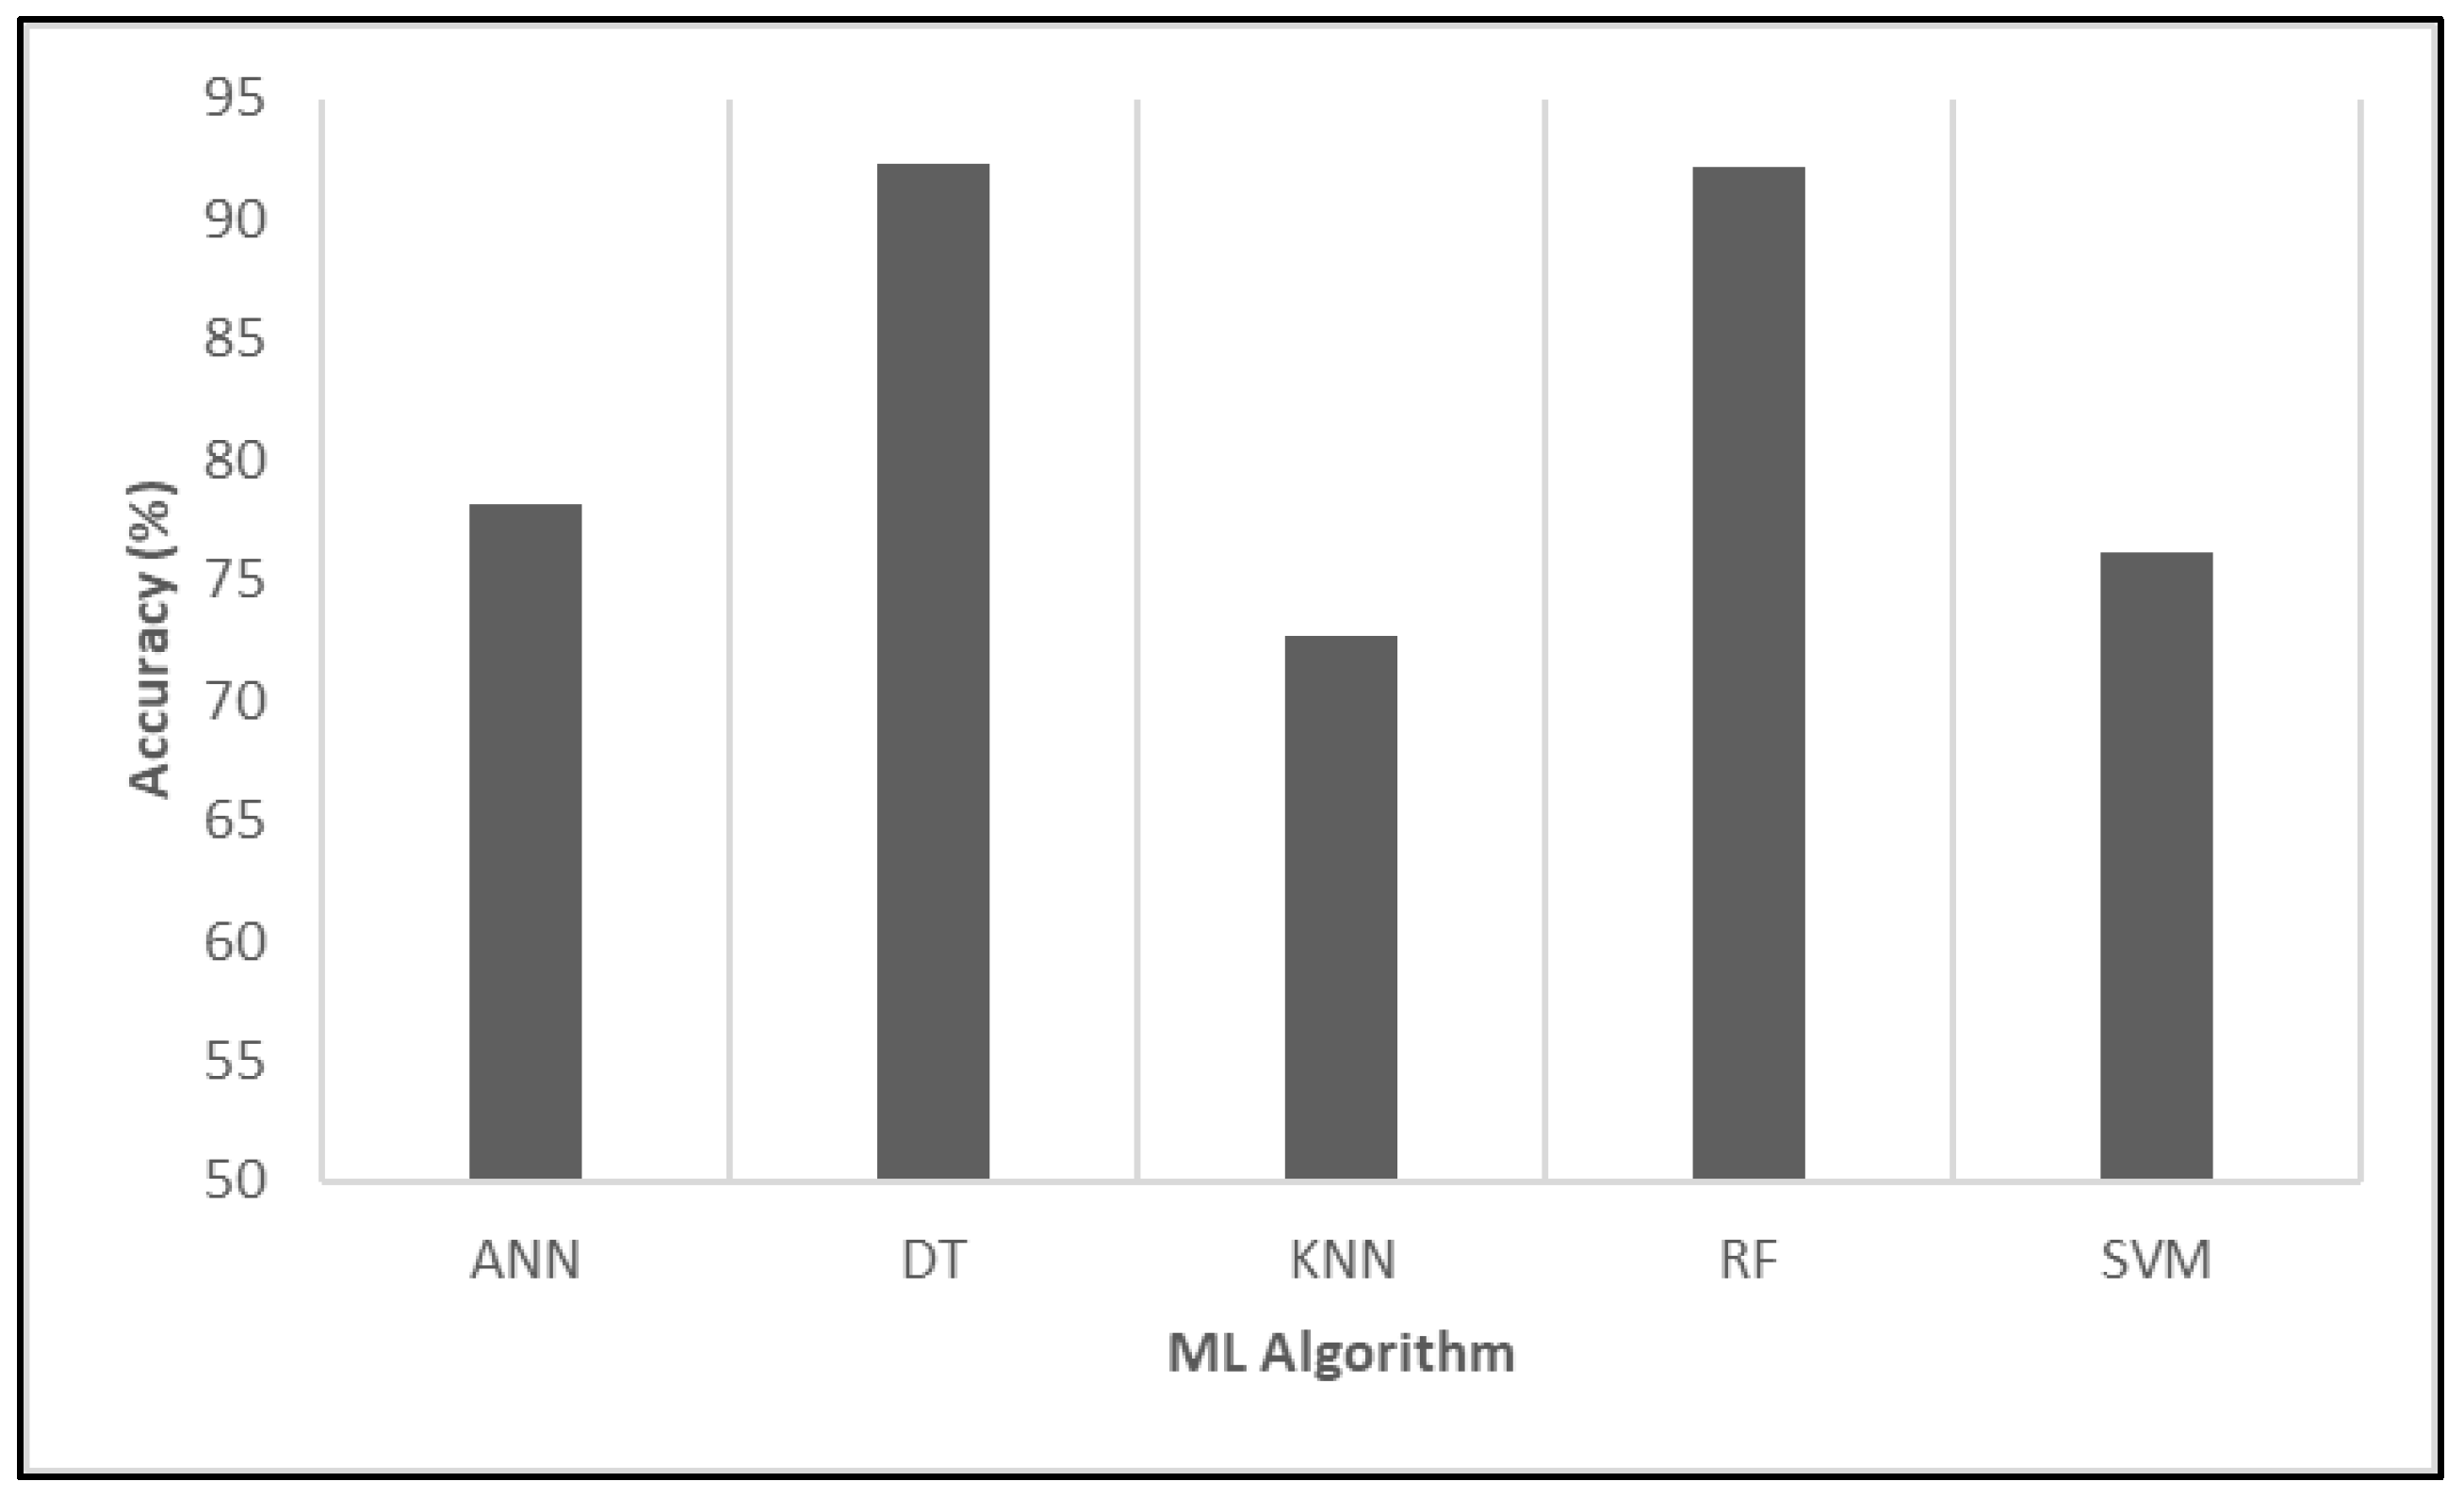
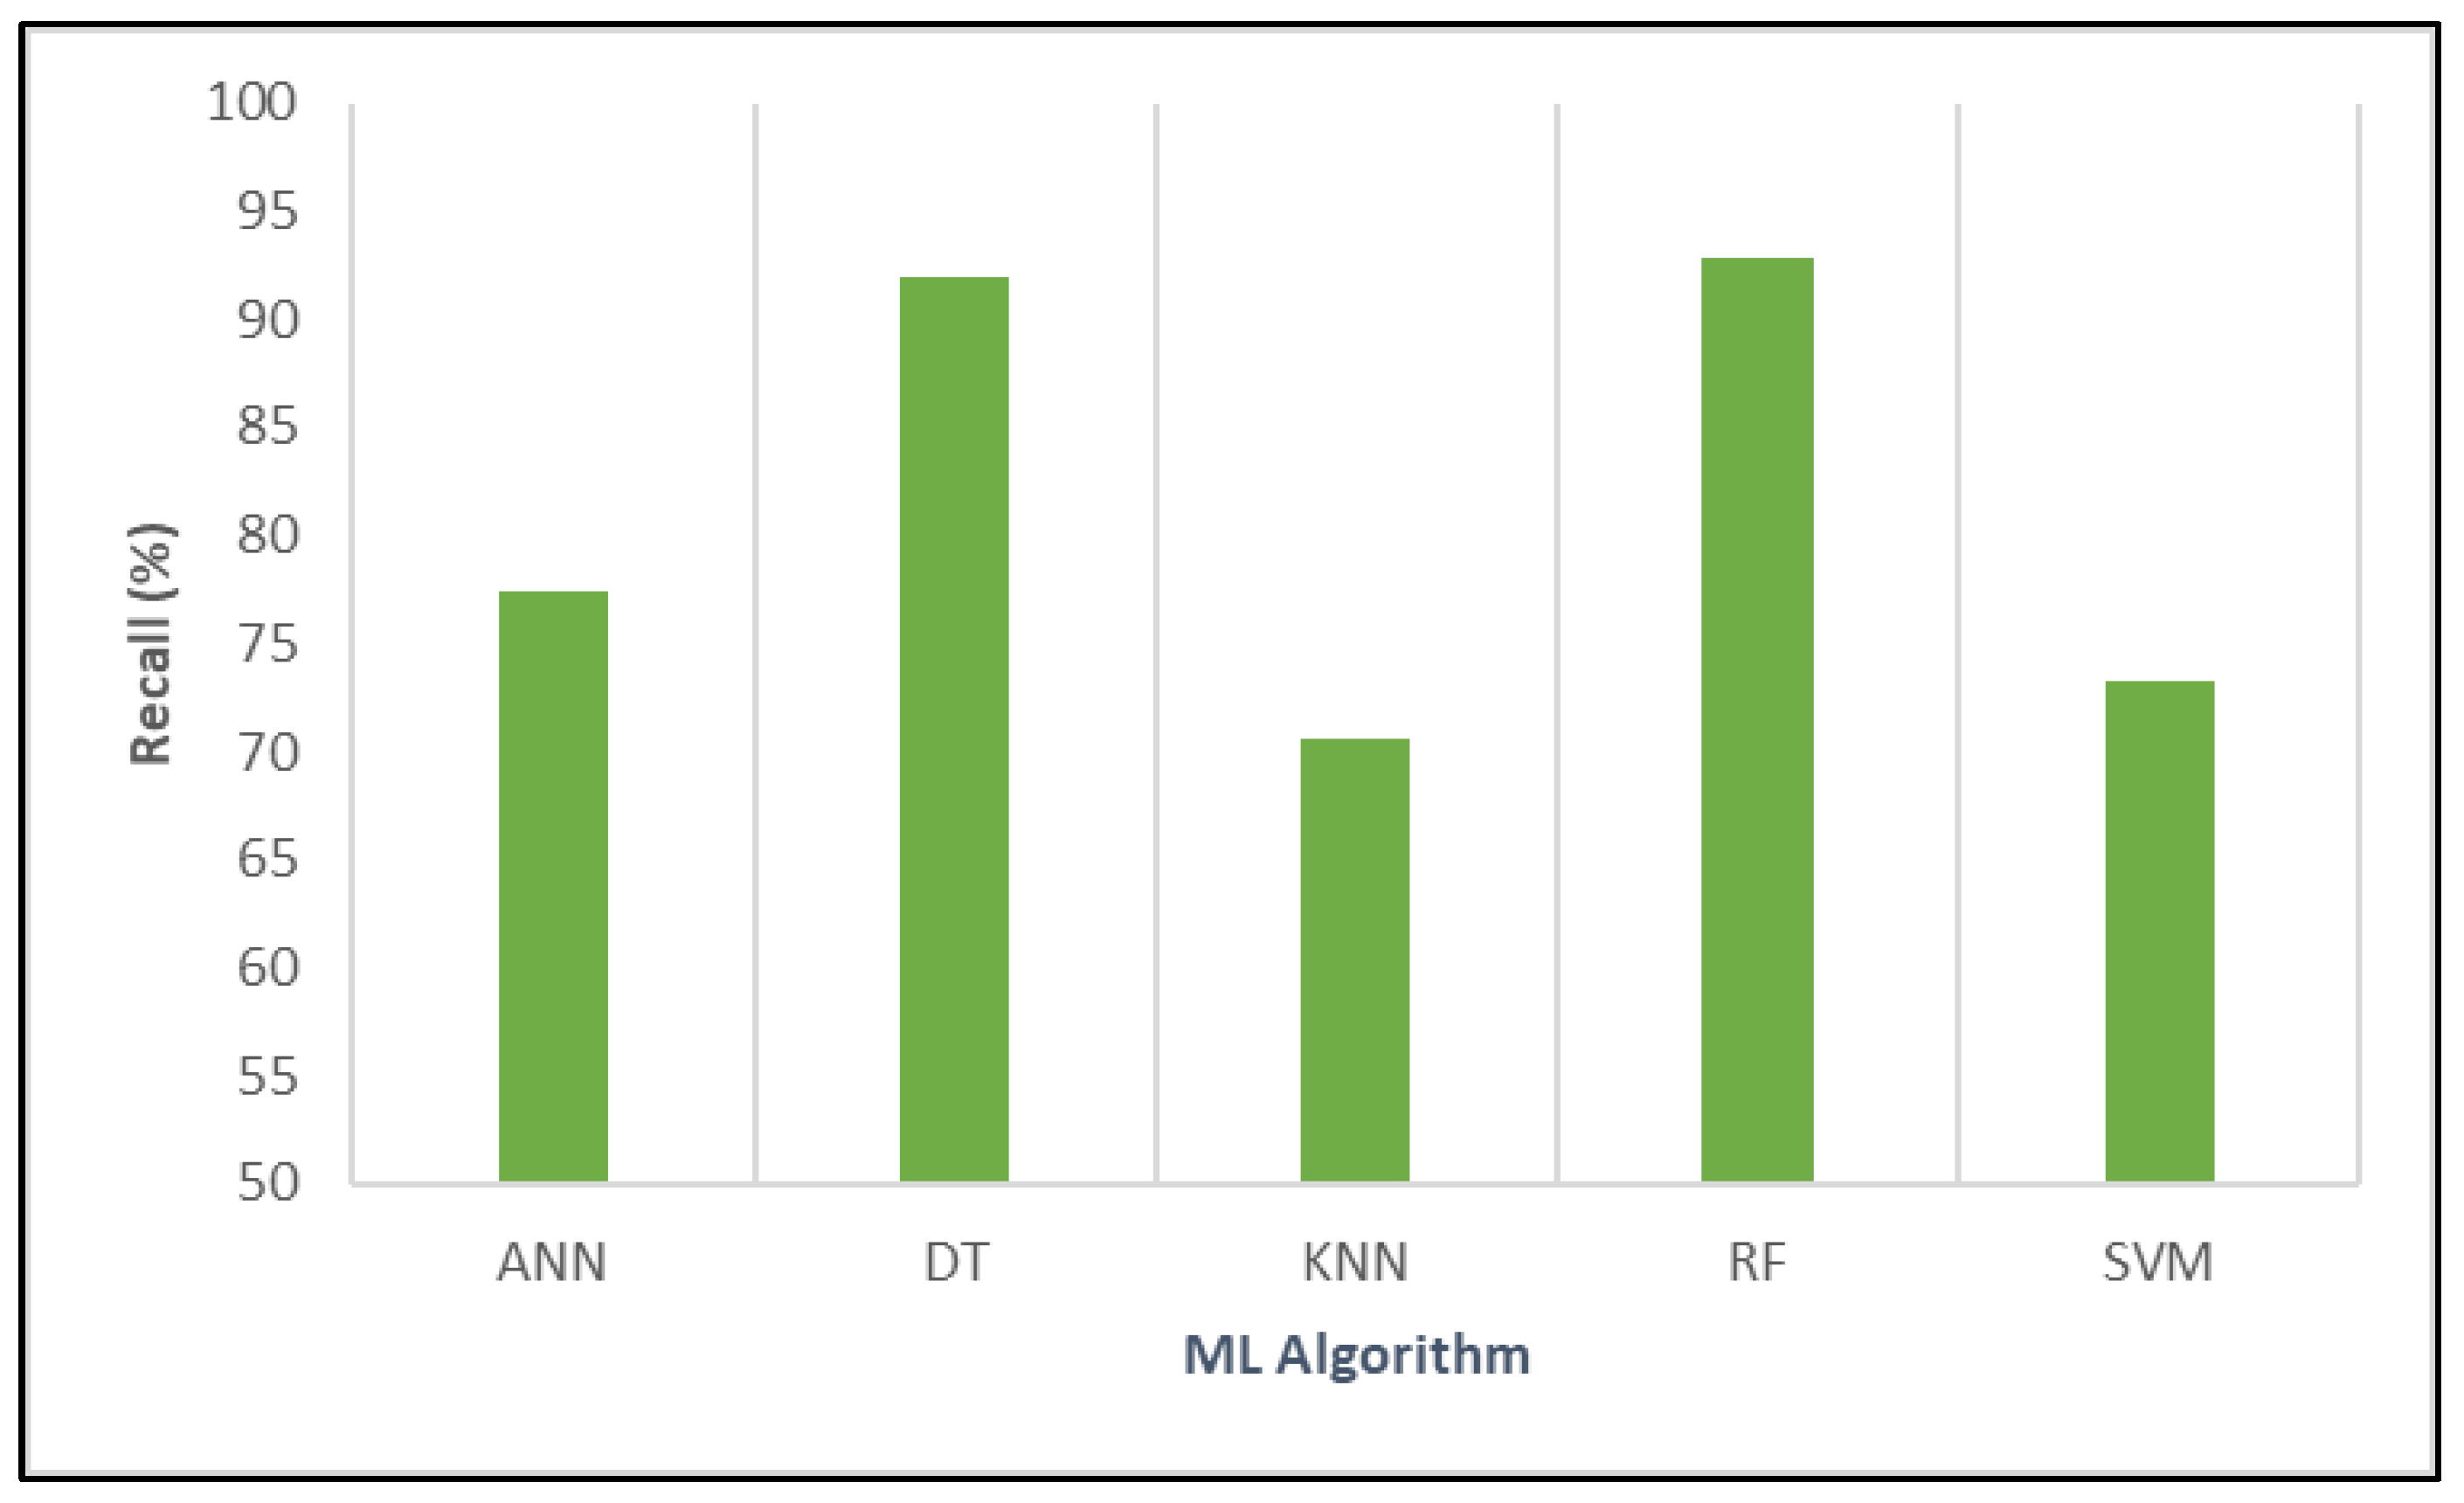
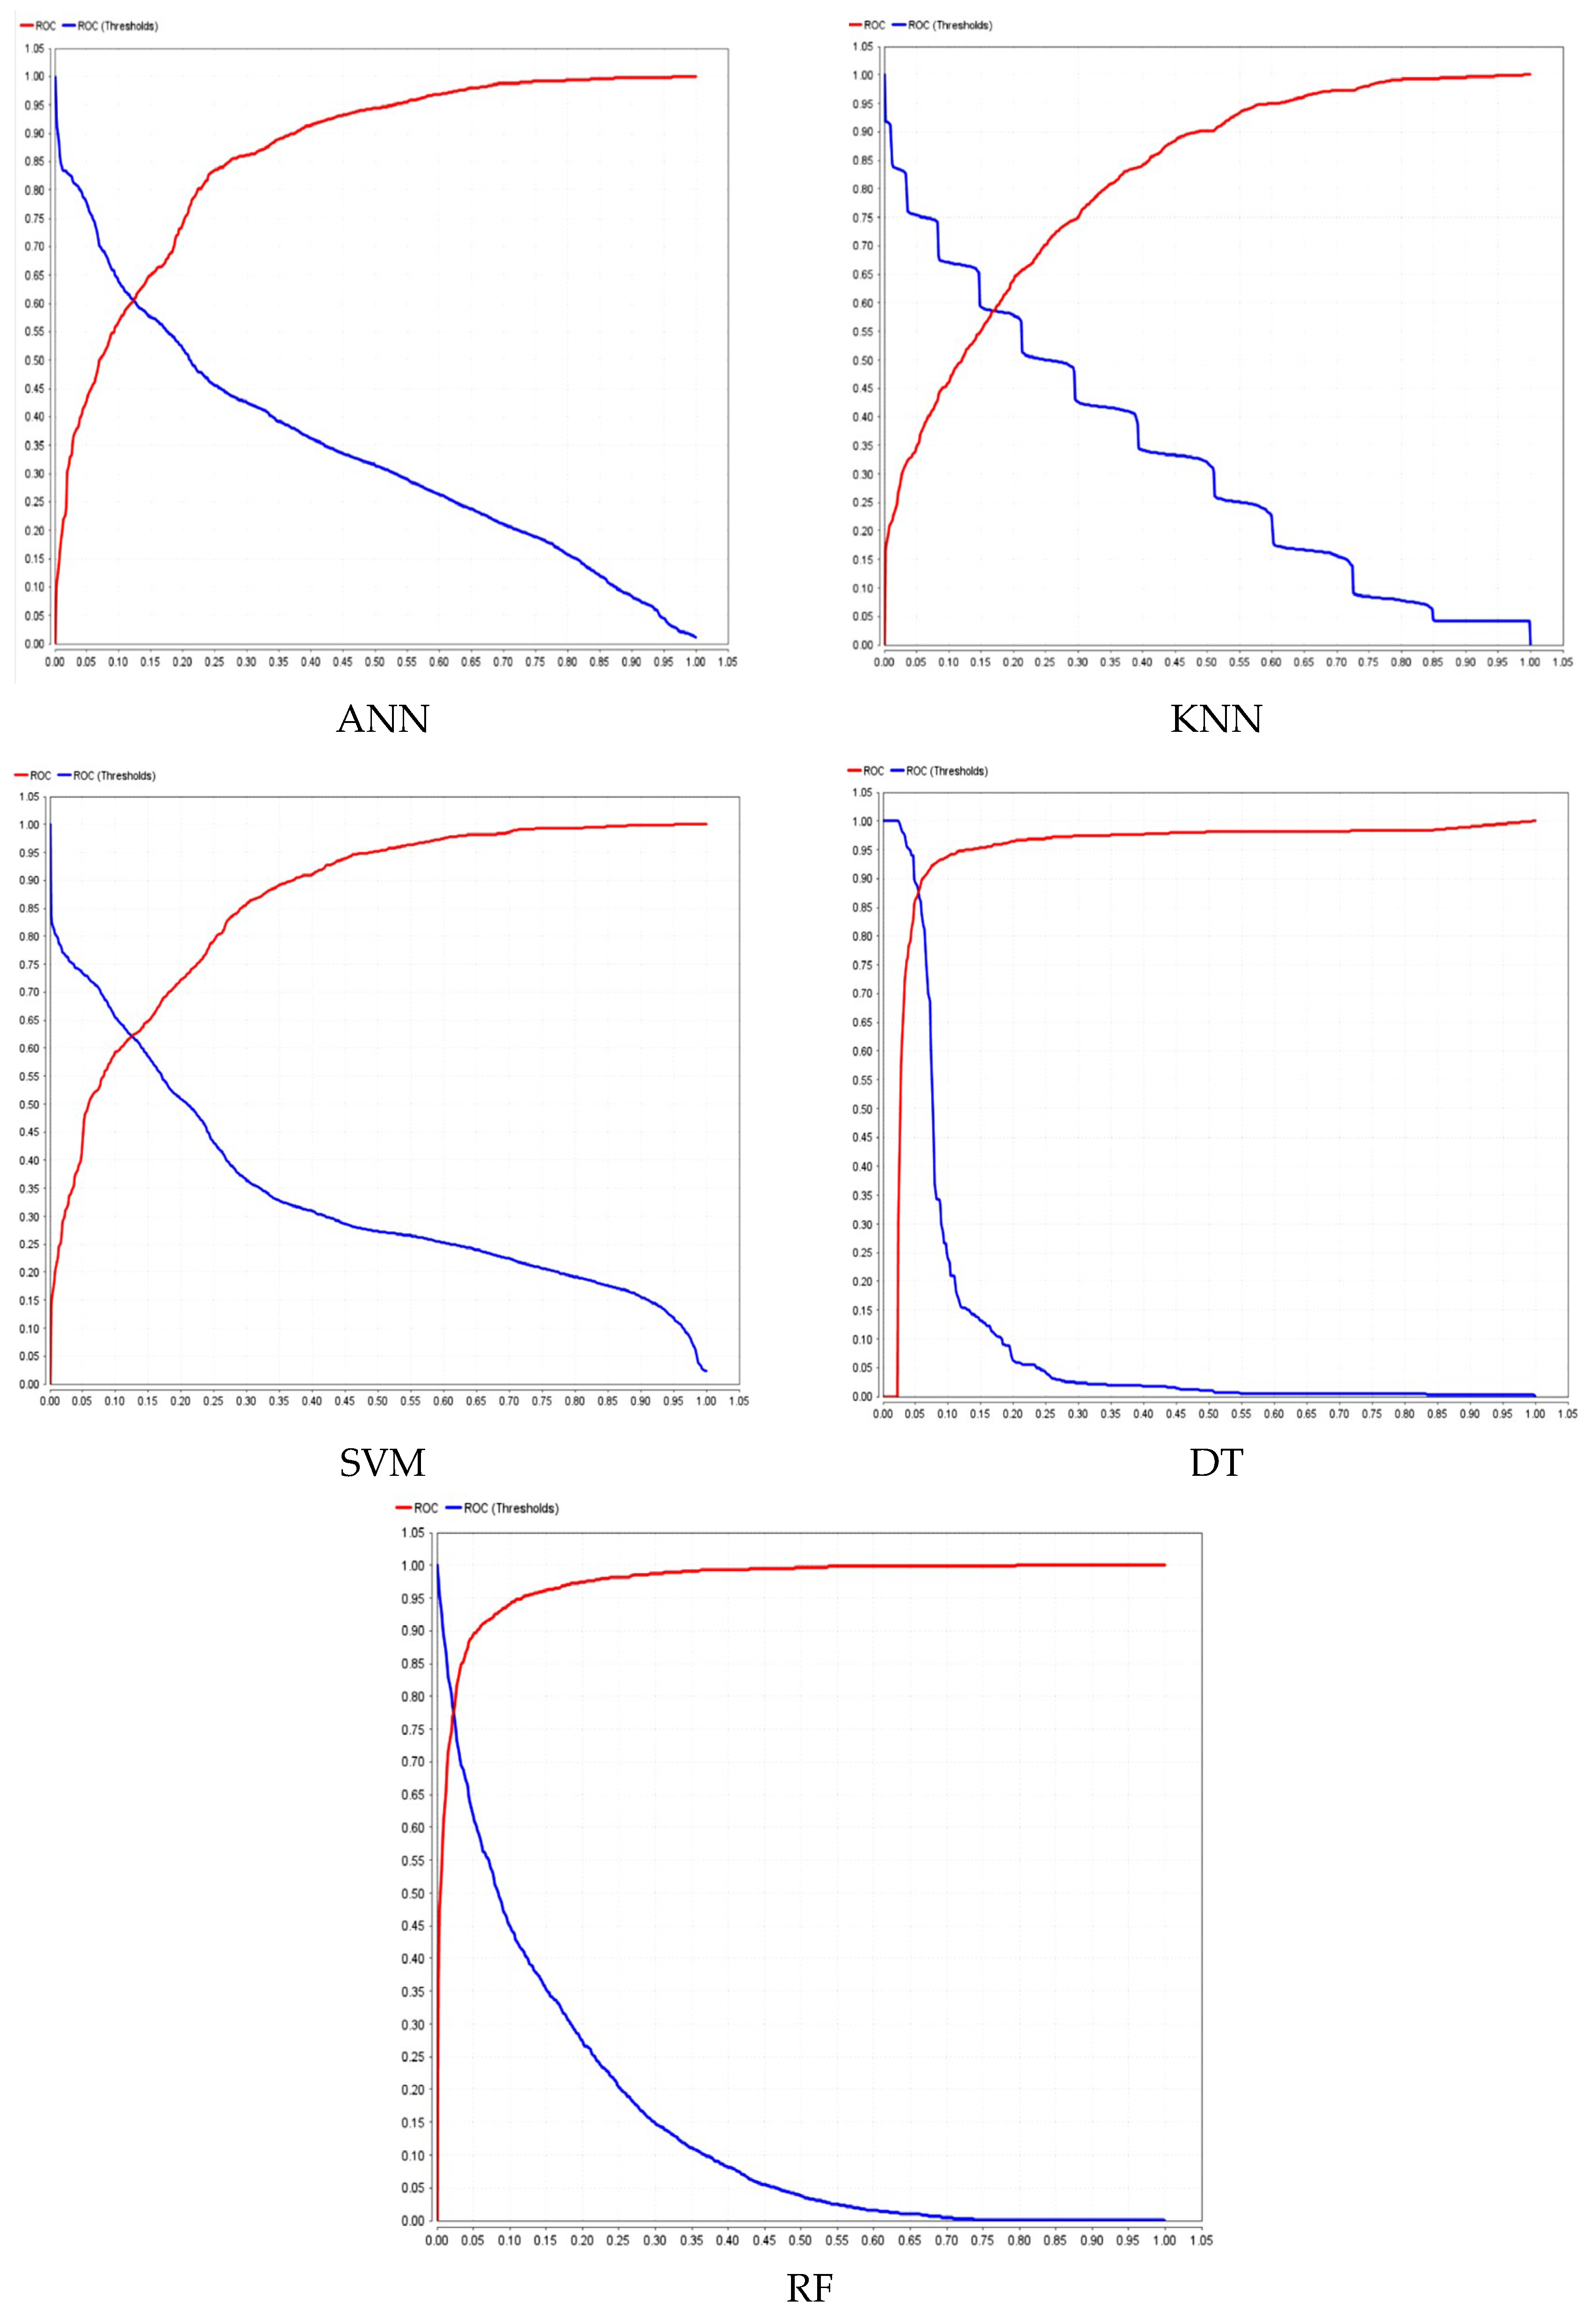
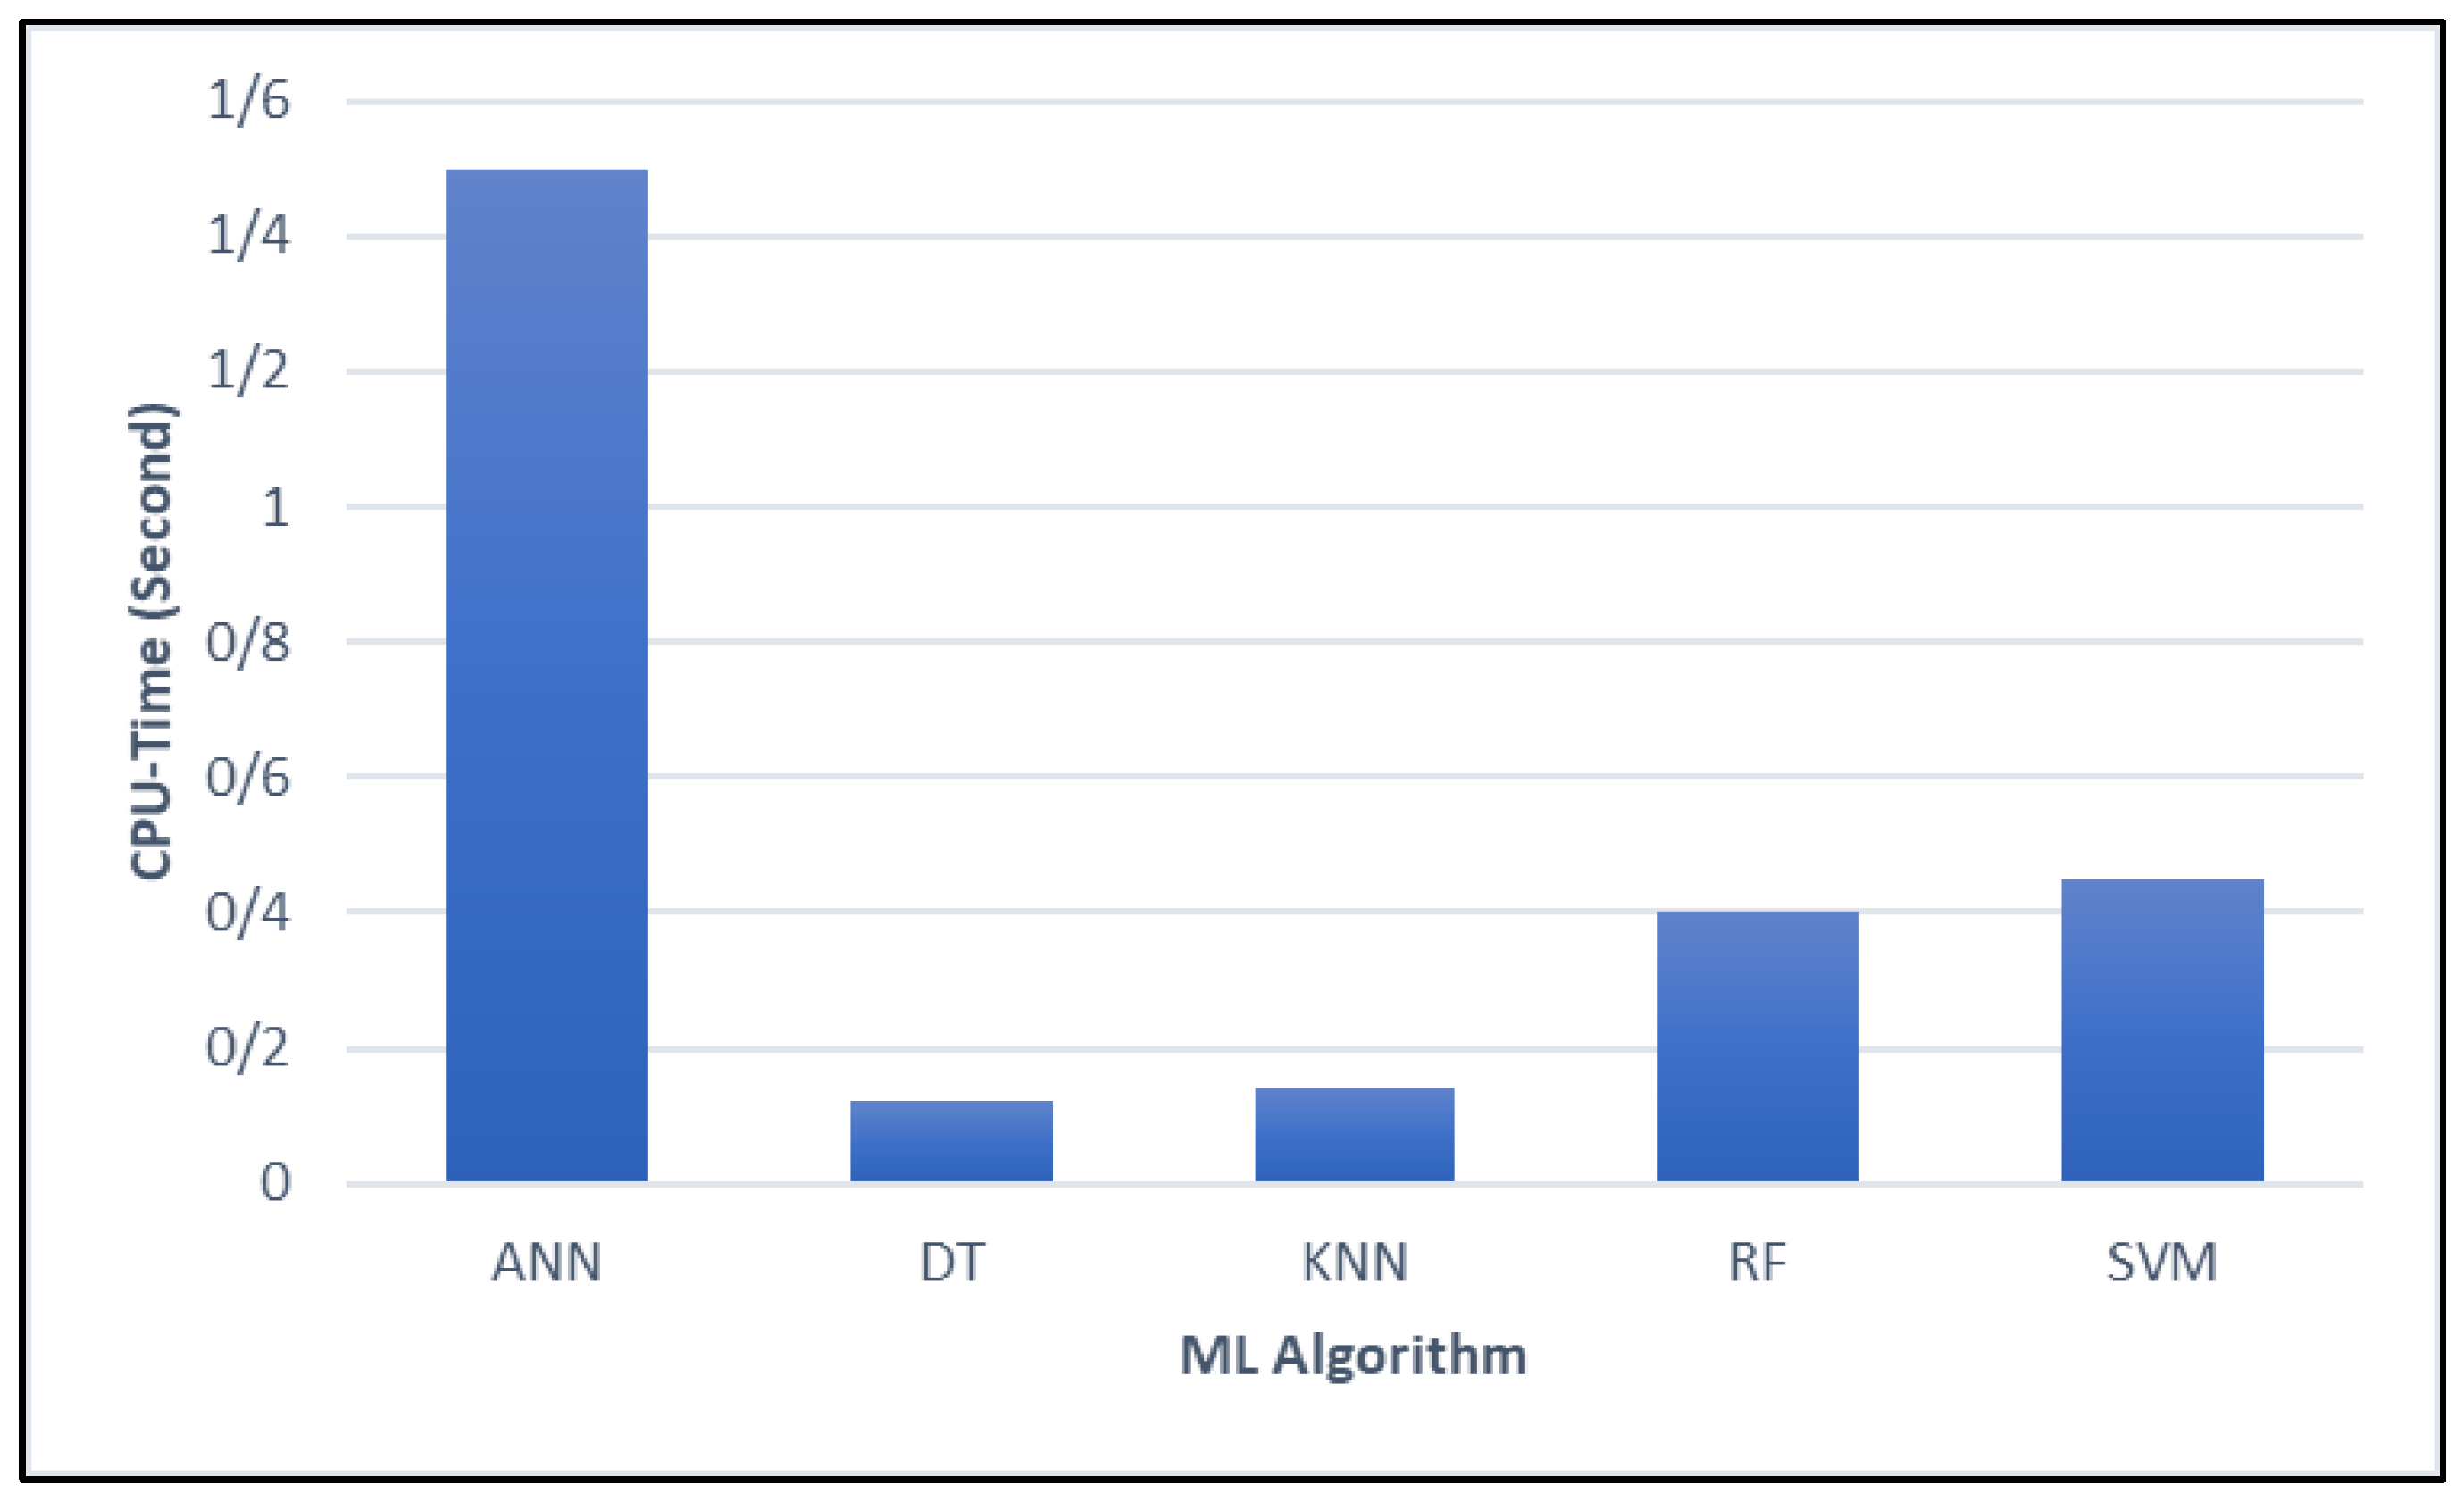
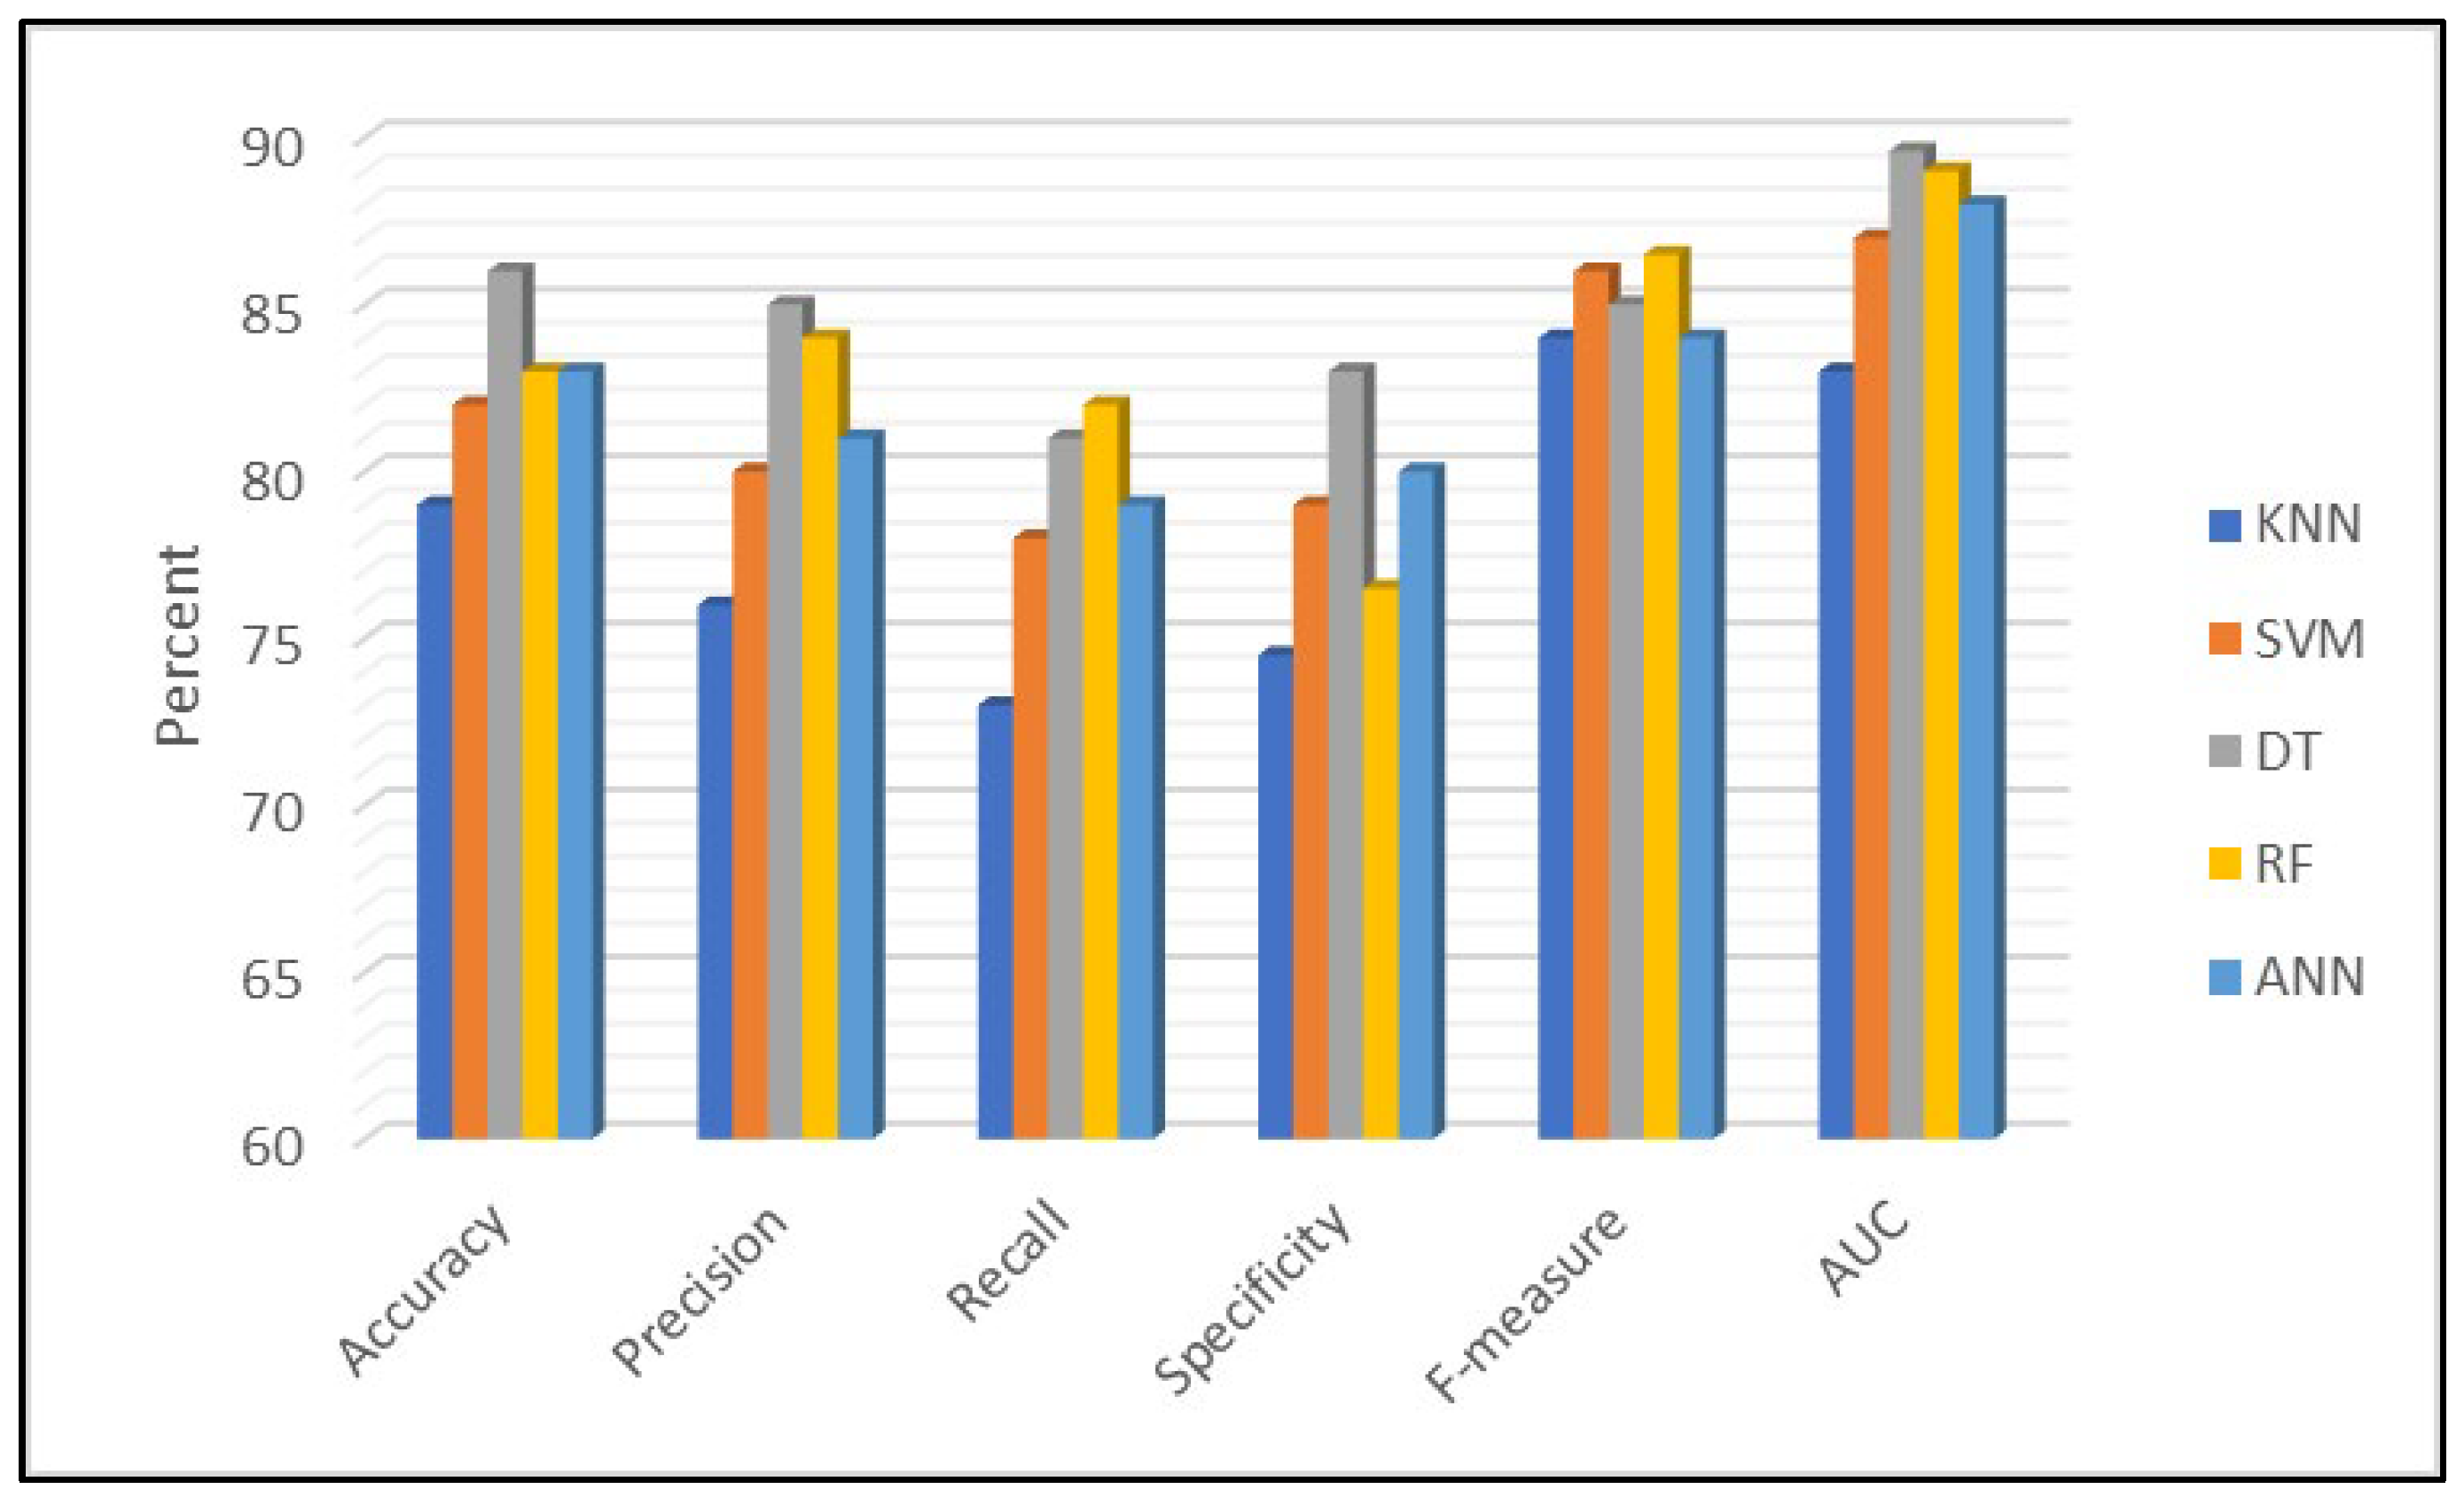
The performance of the algorithms was evaluated using several important metrics [32,33]. Accuracy measured how often the model predicted correctly overall and is defined as follows:
Accuracy = T P + T N T P + T N + F P + F N  
Precision looked at how many of the predicted positive cases were actually true positives, helping to see if the model was good at avoiding false positives (Equation (2)):
P r e c i s i o n = T P T P + F P
Recall, or sensitivity, checked how well the model identified all actual positive cases, showing its ability to catch true positives, as described in Equation (3):
R e c a l l = T P T P + F N
Specificity, on the other hand, measured the model’s ability to correctly identify actual negatives, helping to assess how well it avoided false positives on truly negative cases, see Equation (4):
S p e c i f i c i t y = T N T N + F P
The F-measure combined precision and recall into one score, as illustrated in Equation (5), giving a balanced view of the model’s accuracy in detecting positives and minimizing false alarms:
F-measure = 2 × P r e c i s i o n × R e c a l l P r e c i s i o n + R e c a l l
Finally, AUC, based on ROC curves, showed how effectively the model could distinguish between classes across different thresholds. Using all these metrics together provided a comprehensive understanding of each algorithm’s strengths and weaknesses, ensuring a thorough evaluation of their accuracy, reliability, and ability to correctly classify both positive and negative cases.

4. Results Analysis

The primary objective of this study was to develop predictive models to assess the impact of vaccination on mortality rate associated with COVID-19. To evaluate the effectiveness and reliability of these models, a comprehensive performance analysis was conducted using several key metrics, including accuracy, precision, specificity, recall, F-measure, and AUC. The calculation of these evaluation parameters was based on the confusion matrices generated for each algorithm, which are detailed in Figure 4. This rigorous assessment ensured a thorough comparison of model performance and helped identify the most effective approaches for forecasting COVID-19 mortality trends related to vaccination efforts.
First, we examined the accuracy, which is the simplest and most fundamental measure of a model’s performance in classification tasks. Accuracy indicates the proportion of correctly predicted instances out of the total number of predictions made, providing an overall assessment of how well the model distinguishes between different categories. Figure 5 illustrates the comparative accuracy of five ML algorithms applied to predict the impact of vaccination on COVID-19 mortality. The results demonstrated that the DT achieved the highest accuracy, reaching 92.27%, marginally surpassing RF at 92.22%. These figures underscore the effectiveness of tree-based models in capturing complex patterns associated with COVID-19 mortality influenced by vaccination.
In conclusion, the evaluation based on accuracy provided a valuable initial insight into model performance. While it offers a quick snapshot of effectiveness, accuracy alone may not fully capture the model’s performance, especially in cases of imbalanced datasets; hence, it is complemented by additional metrics, such as precision, recall, specificity, F-measure, and AUC, for a more comprehensive evaluation.
In the following analysis, the algorithms’ performance was evaluated based on their precision, which indicates the proportion of true positive predictions among all positive predictions made by each model. Based on the results of Figure 6, DT demonstrated the highest precision at 92.54%, reflecting its superior ability to accurately identify positive cases, which is vaccine efficacy or reduced COVID-19 mortality, while minimizing false positives. This high level of precision underscores the model’s reliability in making correct positive predictions within this context. RF closely followed, with a precision of 91.69%, indicating comparable accuracy in positive predictions and a similarly low false positive rate.
Overall, based on precision metrics, DT emerged as the most robust model for accurately predicting vaccine effectiveness and mitigating mortality risk, suggesting its strong potential as a tool for informing public health strategies against COVID-19.
Next, the performance of the algorithms was compared based on their recall, which indicates each model’s ability to correctly identify true positive cases related to the impact of vaccination on COVID-19 mortality. The results are demonstrated in Figure 7.
ANN achieved a recall of 77.36%, reflecting moderate sensitivity in detecting positive instances. DT outperformed this significantly, with a high recall of 91.95%, demonstrating its strong capacity to capture the majority of true positive cases. KNN showed a lower recall of 70.55%, indicating that a considerable number of positive cases may go undetected. RF exhibited the highest recall among all models at 92.86%, highlighting its exceptional ability to identify positive cases and making it highly suitable for comprehensive detection. Lastly, SVM reported a recall of 73.28%, which suggests moderate sensitivity.
Overall, RF and DT stood out with the highest recall values, signifying their robustness in identifying true positive instances and their potential usefulness in informing public health strategies through accurate modeling of vaccine effectiveness.
Figure 8 illustrates the specificity percentages of various ML algorithms, which quantify the ability of each model to correctly identify actual negatives. Once again, DT achieved the highest specificity, demonstrating exceptional accuracy in distinguishing negative cases and effectively reducing false positive rates. In contrast, KNN exhibited relatively low specificity, indicating potential limitations in correctly identifying negatives, which may affect its suitability for applications where false positives must be minimized.
The F-measure combines precision and recall into a single metric, providing a balanced measure of a model’s accuracy, especially useful when dealing with imbalanced datasets.
Figure 9 shows that DT attained the highest F-measure at 92.24%, highlighting its excellent balance between precision and recall in predicting positive cases. RF closely followed, with an F-measure of 92.27%, slightly outperforming DT, which underscores its strong overall predictive performance and ability to balance sensitivity and precision effectively.
ANN had a lower F-measure of 77.96%, indicating moderate performance with less optimal balancing of false positives and false negatives. SVM scored 75.49%, reflecting moderate effectiveness, similar to ANN. KNN registered the lowest F-measure at 72.07%, suggesting it had limited accuracy in balancing precision and recall for this task.
Finally, AUC measures the overall ability of the models to distinguish between positive and negative cases, with higher values indicating better discrimination. RF and DT demonstrated superior discriminatory ability, making them highly effective for correctly classifying vaccine efficacy impacts. ANN and SVM showed good discrimination, while KNN was comparatively less capable (Figure 10).
In addition, the ROC-AUC curves obtained from the dataset for different models are shown in Figure 11.
Furthermore, Figure 12 presents a comparative analysis of the CPU time required by various ML algorithms. The results indicated that DT was the most computationally efficient, demonstrating exceptionally fast processing. Its minimal CPU time makes it an attractive option for real-time applications and environments with limited computational resources.
In contrast, ANN models exhibited significantly higher computational demands. This substantial resource requirement may limit their practicality in scenarios where processing speed is a critical factor. Meanwhile, RF and SVM provided a balance between computational efficiency and predictive performance, though they incurred slightly higher computational costs compared to DT.
In summary, the DT model exhibited exceptional predictive performance across key metrics, achieving high accuracy, precision, recall, and AUC while maintaining computational efficiency. Additionally, several critical insights were derived from the DT analysis:
  • Variables such as population size, total vaccinations, fully vaccinated individuals, and vaccination ratio played a significant role in determining outcomes.
  • The presence of a date-related node indicated that the model incorporated temporal information, potentially linking vaccination timelines to other predictive features.
  • Pathways where high numbers of fully vaccinated individuals aligned with specific population sizes appeared strongly correlated with certain predictions.
To strengthen confidence in the models’ robustness and real-world applicability, an external validation was conducted using another independent dataset, which is downloadable from [34]. This dataset comprises global cancer patient records collected from 2015 to 2024, designed to model the key factors influencing cancer diagnosis, treatment, and survival outcomes. It includes a diverse range of clinically relevant features, such as age, gender, cancer type, environmental influences, and lifestyle behaviors, making it highly valuable for various analytical applications. ML models were applied to this dataset. The evaluation results provided insights into the predictive performance of various algorithms, assessing metrics including accuracy, precision, recall, specificity, F-measure, and AUC.
Figure 13 presents a comparative evaluation of several ML algorithms applied to global cancer patient data. The results showed that DT emerged as the best-performing algorithm, demonstrating superior accuracy, precision, recall, and computational efficiency. RF closely followed, particularly excelling in AUC. The results highlighted the effectiveness of DT in cancer diagnosis and survival prediction, reinforcing its suitability for real-world medical applications.

5. Conclusions

The results of this study underscore the potential of ML algorithms, particularly DT, in evaluating COVID-19 vaccine effectiveness and informing public health strategies. The DT model demonstrated superior predictive performance across multiple key metrics, achieving high accuracy, precision, recall, and AUC while maintaining computational efficiency. These findings reinforce the role of ML techniques in advancing data-driven decision-making in epidemiology and vaccine assessment.
Despite promising results, this study faced limitations related to dataset size and diversity, which may restrict the model’s generalizability across different populations or geographic areas. Data quality issues, such as missing or inaccurate entries, could also influence model performance. While cross-validation mitigates overfitting, it does not fully address biases inherent in the data collection process or unmeasured confounders. Future research could expand upon this work by incorporating diverse and larger datasets, including variables such as vaccine type, dose numbers, and demographic factors. Additionally, exploring other advanced ML techniques, feature engineering, and external validation across different regions will enhance the generalizability and applicability of these models in real-world settings, ultimately supporting more targeted and effective vaccination strategies. Furthermore, incorporating time series or longitudinal modeling approaches could significantly enhance the predictive capabilities of the analysis by explicitly capturing temporal dependencies and trends inherent in vaccination data and COVID-19 mortality outcomes. It is considered as a promising avenue for future research to improve the temporal robustness and practical applicability.

Author Contributions

Conceptualization, M.N.; Methodology, M.N., S.F.J. and J.T.; Software, S.F.J.; Validation, J.T. and A.M.D.; Formal analysis, J.T.; Investigation, S.F.J.; Resources, A.M.D.; Data curation, J.T. and S.F.J.; Writing – original draft, M.N. and S.F.J.; Writing – review & editing, A.M.D.; Visualization, M.N. and S.F.J.; Supervision, A.M.D. All authors have read and agreed to the published version of the manuscript.

Funding

This research received no external funding.

Data Availability Statement

The original contributions presented in this study are included in the article. Further inquiries can be directed to the corresponding author.

Conflicts of Interest

The authors declare no conflict of interest.

References

  1. Nishiura, H.; Jung, S.M.; Linton, N.M.; Kinoshita, R.; Yang, Y.; Hayashi, K.; Kobayashi, T.; Yuan, B.; Akhmetzhanov, A.R. The extent of transmission of novel coronavirus in Wuhan, China, 2020. J. Clin. Med. 2020, 9, 330. [Google Scholar] [CrossRef] [PubMed]
  2. Dashtbali, M.; Mirzaie, M. The impact of vaccination and social distancing on COVID-19: A compartmental model and an evolutionary game theory approach. J. Frankl. Inst. 2024, 361, 106994. [Google Scholar] [CrossRef]
  3. Chakraborty, C.; Lo, Y.H.; Bhattacharya, M.; Das, A.; Wen, Z.H. Looking beyond the origin of SARS-CoV-2: Significant strategic aspects during the five-year journey of COVID-19 vaccine development. Mol. Ther. Nucleic Acids 2025, 36, 102527. [Google Scholar] [CrossRef]
  4. Tiwari, S.; Chanak, P.; Singh, S.K. A review of the machine learning algorithms for COVID-19 case analysis. IEEE Trans. Artif. Intell. 2022, 4, 44–59. [Google Scholar] [CrossRef] [PubMed]
  5. Zhang, J.; Zheng, N.; Liu, M.; Yao, D.; Wang, Y.; Wang, J.; Xin, J. Multi-weight susceptible-infected model for predicting COVID-19 in China. Neurocomputing 2023, 534, 161–170. [Google Scholar] [CrossRef]
  6. Ambalarajan, V.; Mallela, A.R.; Dhandapani, P.B.; Sivakumar, V.; Leiva, V.; Castro, C. Multi-strain COVID-19 dynamics with vaccination strategies: Mathematical modeling and case study. Alex. Eng. J. 2025, 119, 665–684. [Google Scholar] [CrossRef]
  7. Kalachev, L.; Graham, J.; Landguth, E.L. A simple modification to the classical SIR model to estimate the proportion of under-reported infections using case studies in flu and COVID-19. Infect. Dis. Model. 2024, 9, 1147–1162. [Google Scholar] [CrossRef] [PubMed]
  8. Etli, D. Evaluating Vaccine Effectiveness During the COVID-19 Pandemic: Insights from Statistical and Machine Learning Methods. In World Congress in Computer Science, Computer Engineering & Applied Computing; Springer: Cham, Switzerland, 2025; pp. 445–453. [Google Scholar]
  9. Dodoo, C.C.; Hanson-Yamoah, E.; Adedia, D.; Erzuah, I.; Yamoah, P.; Brobbey, F.; Cobbold, C.; Mensah, J. Using machine learning algorithms to predict COVID-19 vaccine uptake: A year after the introduction of COVID-19 vaccines in Ghana. Vaccine X 2024, 18, 100466. [Google Scholar] [CrossRef]
  10. Girma, S.; Paton, D. Using double-debiased machine learning to estimate the impact of Covid-19 vaccination on mortality and staff absences in elderly care homes. Eur. Econ. Rev. 2024, 170, 104882. [Google Scholar] [CrossRef]
  11. Jdid, T.; Benbrahim, M.; Kabbaj, M.N.; Naji, M. A vaccination-based COVID-19 model: Analysis and prediction using Hamiltonian Monte Carlo. Heliyon 2024, 10, e38204. [Google Scholar] [CrossRef]
  12. Rayguru, C.; Husnayain, A.; Chiu, H.S.; Sumazin, P.; Su, E.C.Y. Predictive analysis of COVID-19 occurrence and vaccination impacts across the 50 US states. Comput. Biol. Med. 2025, 185, 109493. [Google Scholar] [CrossRef] [PubMed]
  13. Zaidi, S.A.J.; Tariq, S.; Belhaouari, S.B. Future prediction of COVID-19 vaccine trends using a voting classifier. Data 2021, 6, 112. [Google Scholar] [CrossRef]
  14. Chhabra, A.; Singh, S.K.; Sharma, A.; Kumar, S.; Gupta, B.B.; Arya, V.; Chui, K.T. Sustainable and intelligent time-series models for epidemic disease forecasting and analysis. Sustain. Technol. Entrep. 2024, 3, 100064. [Google Scholar] [CrossRef]
  15. Omar, O.A.; Elbarkouky, R.A.; Ahmed, H.M. Fractional stochastic modelling of COVID-19 under wide spread of vaccinations: Egyptian case study. Alex. Eng. J. 2022, 61, 8595–8609. [Google Scholar] [CrossRef]
  16. Webb, G. A COVID-19 epidemic model predicting the effectiveness of vaccination in the US. Infect. Dis. Rep. 2021, 13, 654–667. [Google Scholar] [CrossRef]
  17. Garcia-Carretero, R.; Ordoñez-Garcia, M.; Vazquez-Gomez, O.; Rodriguez-Maya, B.; Gil-Prieto, R.; Gil-de-Miguel, A. Impact and Effectiveness of COVID-19 Vaccines Based on Machine Learning Analysis of a Time Series: A Population-Based Study. J. Clin. Med. 2024, 13, 5890. [Google Scholar] [CrossRef] [PubMed]
  18. Nirmalarajah, K.; Aftanas, P.; Barati, S.; Chien, E.; Crowl, G.; Faheem, A.; Farooqi, L.; Jamal, A.J.; Khan, S.; Mubareka, S.; et al. Identification of patient demographic, clinical, and SARS-CoV-2 genomic factors associated with severe COVID-19 using supervised machine learning: A retrospective multicenter study. BMC Infect. Dis. 2025, 25, 132. [Google Scholar] [CrossRef]
  19. Mengüç, K.; Aydin, N.; Ulu, M. Optimization of COVID-19 vaccination process using GIS, machine learning, and the multi-layered transportation model. Int. J. Prod. Res. 2025, 63, 404–417. [Google Scholar] [CrossRef]
  20. Dhanaraj, R.K. A Comprehensive Exploration of Artificial Intelligence Methods for COVID-19 Diagnosis. EAI Endorsed Trans. Pervasive Health Technol. 2024, 10. [Google Scholar]
  21. Lv, C.; Guo, W.; Yin, X.; Liu, L.; Huang, X.; Li, S.; Zhang, L. Innovative applications of artificial intelligence during the COVID-19 pandemic. Infect. Med. 2024, 3, 100095. [Google Scholar] [CrossRef]
  22. COVID Vaccination vs. Mortality. 2022. Available online: https://www.kaggle.com/datasets/sinakaraji/covid-vaccination-vs-death (accessed on 1 January 2022).
  23. Azeem, M.; Javaid, S.; Khalil, R.A.; Fahim, H.; Althobaiti, T.; Alsharif, N.; Saeed, N. Neural networks for the detection of COVID-19 and other diseases: Prospects and challenges. Bioengineering 2023, 10, 850. [Google Scholar] [CrossRef]
  24. Bagriacik, M.; Otero, F.E. Multiple fairness criteria in decision tree learning. Appl. Soft Comput. 2024, 167, 112313. [Google Scholar] [CrossRef]
  25. Samet, H. K-nearest neighbor finding using MaxNearestDist. IEEE Trans. Pattern Anal. Mach. Intell. 2007, 30, 243–252. [Google Scholar] [CrossRef] [PubMed]
  26. Sandhu, G.; Singh, A.; Lamba, P.S.; Virmani, D.; Chaudhary, G. Modified Euclidean-Canberra blend distance metric for KNN classifier. Intell. Decis. Technol. 2023, 17, 527–541. [Google Scholar]
  27. Tomat, A. Interval pattern structures for interpreting K-nearest neighbor approach in lazy classification. In Proceedings of the 11th FCA4AI Workshop Co-Located with the IJCAI 2023 Conference, Macao, China, 20 August 2023; pp. 17, 24. [Google Scholar]
  28. Deng, S.; Wang, L.; Guan, S.; Li, M.; Wang, L. Non-parametric Nearest Neighbor Classification Based on Global Variance Difference. Int. J. Comput. Intell. Syst. 2023, 16, 26. [Google Scholar] [CrossRef]
  29. Hamar, Á.; Mohammed, D.; Váradi, A.; Herczeg, R.; Balázsfalvi, N.; Fülesdi, B.; László, I.; Gömöri, L.; Gergely, P.A.; Gombos, K.; et al. COVID-19 mortality prediction in Hungarian ICU settings implementing random forest algorithm. Sci. Rep. 2024, 14, 11941. [Google Scholar] [CrossRef]
  30. Azzeh, M.; Elsheikh, Y.; Nassif, A.B.; Angelis, L. Examining the performance of kernel methods for software defect prediction based on support vector machine. Sci. Comput. Program. 2023, 226, 102916. [Google Scholar] [CrossRef]
  31. Guido, R.; Ferrisi, S.; Lofaro, D.; Conforti, D. An overview on the advancements of support vector machine models in healthcare applications: A review. Information 2024, 15, 235. [Google Scholar] [CrossRef]
  32. Naidu, G.; Zuva, T.; Sibanda, E.M. A review of evaluation metrics in machine learning algorithms. In Proceedings of the Computer Science On-Line Conference, Online, 3–5 April 2023; Springer International Publishing: Cham, Switzerland, 2023; pp. 15–25. [Google Scholar]
  33. Levashenko, V.; Rabcan, J.; Zaitseva, E. Reliability evaluation of the factors that influenced COVID-19 patients’ condition. Appl. Sci. 2021, 11, 2589. [Google Scholar] [CrossRef]
  34. Feroze, Z. Cancer Cases Report in All the World in Last 10 Years. 2024. Available online: https://www.kaggle.com/datasets/zahidmughal2343/global-cancer-patients-2015-2024/code (accessed on 10 May 2025).
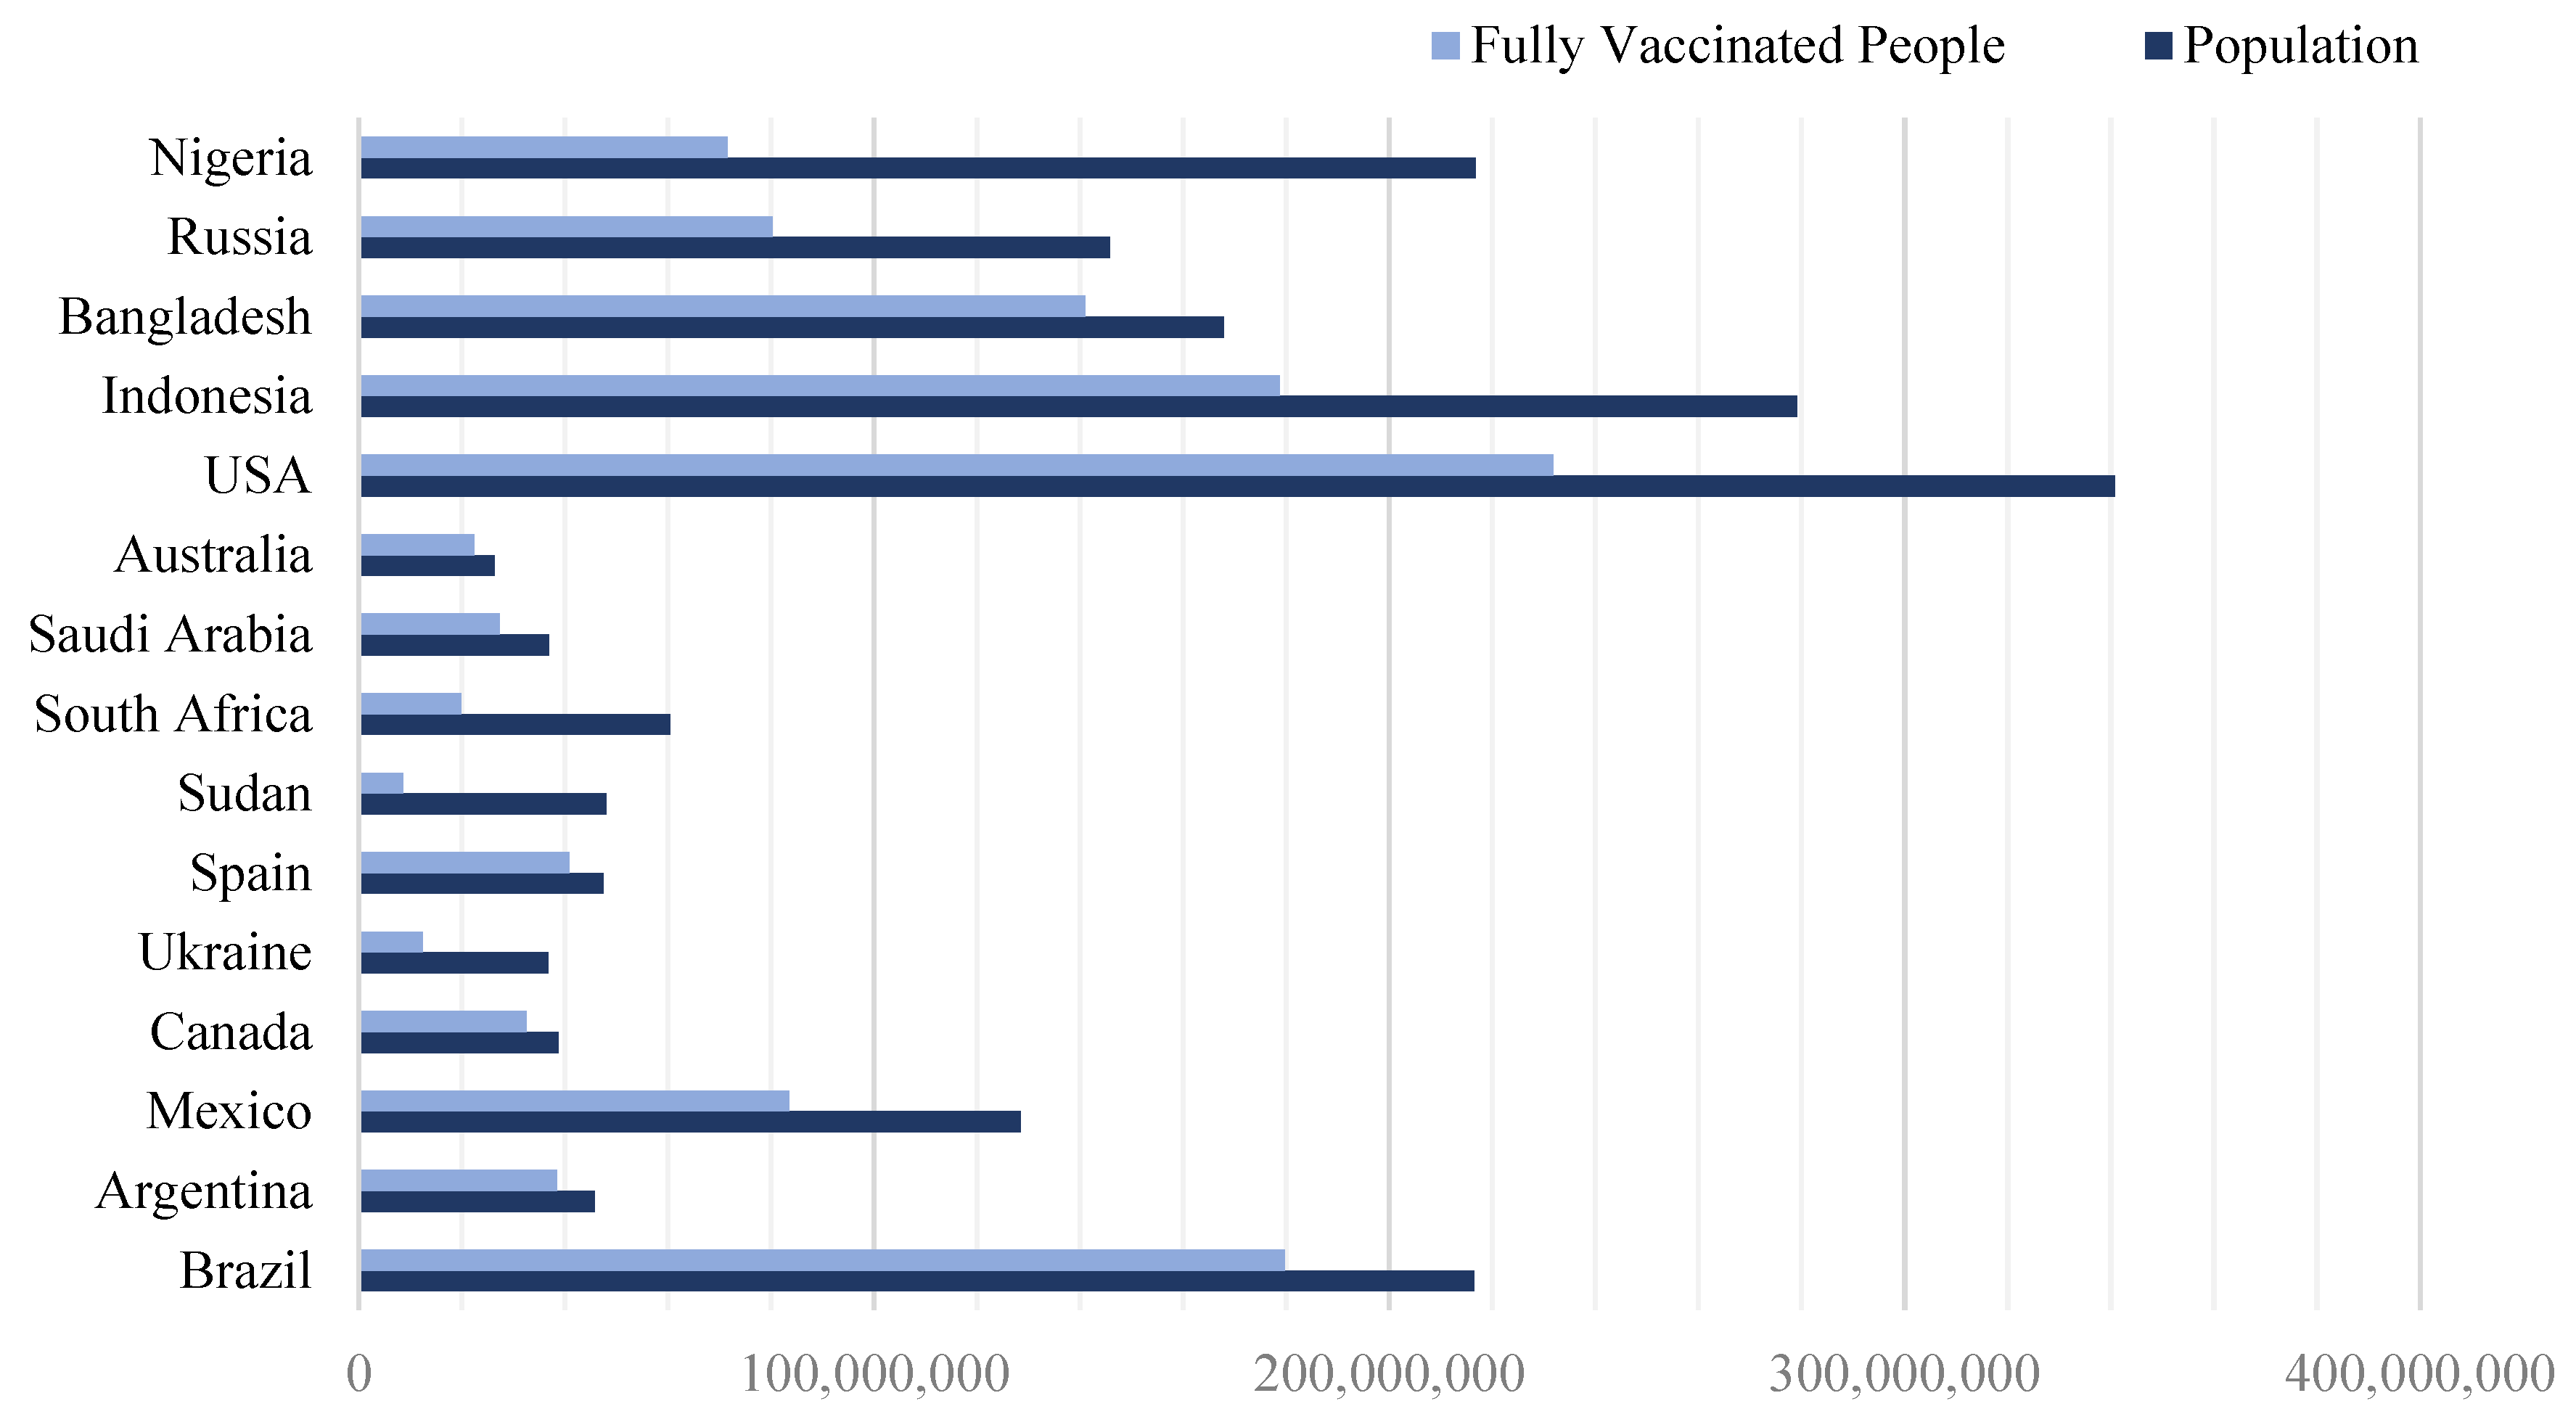
Figure 1. The populations of different countries and the amount of people who are fully vaccinated.
Mathematics 13 01816 g001
Figure 2. The diagram of the research model.
Mathematics 13 01816 g002
Figure 3. Effect of varying parameter k on the accuracy of KNN algorithm.
Mathematics 13 01816 g003
Figure 4. Confusion matrices for different algorithms.
Mathematics 13 01816 g004aMathematics 13 01816 g004b
Figure 5. Evaluating the relative performance of various algorithms in terms of accuracy.
Mathematics 13 01816 g005
Figure 6. Evaluating the relative performance of various algorithms in terms of precision.
Mathematics 13 01816 g006
Figure 7. Evaluating the relative performance of various algorithms in terms of recall.
Mathematics 13 01816 g007
Figure 8. Evaluating the relative performance of various algorithms in terms of specificity.
Mathematics 13 01816 g008
Figure 9. Analyzing the comparative performance of different algorithms based on F-measure.
Mathematics 13 01816 g009
Figure 10. Examining the relative effectiveness of various algorithms using AUC.
Mathematics 13 01816 g010
Figure 11. ROC-AUC curves for different models.
Mathematics 13 01816 g011
Figure 12. Comparing the CPU time of different ML algorithms.
Mathematics 13 01816 g012
Figure 13. Performance comparison of machine learning models for cancer prediction.
Mathematics 13 01816 g013
Table 1. The proportion of fully vaccinated individuals relative to the total population of a given country.
CountryPopulationPeople Fully VaccinatedRatio
Brazil216,422,446179,630,6300.83
Argentina45,773,88438,450,0630.84
Mexico128,455,56783,496,1190.65
Canada38,781,29132,576,2840.84
Ukraine36,744,63412,493,1760.34
Spain47,519,62840,866,8800.86
Sudan48,109,0068,659,6210.18
South Africa60,414,49519,936,7830.33
Saudi Arabia36,947,02527,340,7990.74
Australia26,439,11122,473,2440.85
USA340,779,371231,729,9720.68
Indonesia279,134,505178,646,0830.64
Bangladesh167,885,689141,023,9780.84
Russia145,805,94780,193,2700.55
Nigeria216,746,93471,526,4880.33
Table 2. Tuning parameters of ANN.
ParametersTesting BoundOptimal Value
Learning rate[0, 1]0.01
Momentum[0, 2]0.9
Table 3. Tuning parameters of DT.
ParametersTesting BoundOptimal Value
Maximum depth[12, 23]20
Confidence[0.01, 0.2]0.1
Minimum leaf size[1, 4]2
Minimum gain[0.001, 1]0.01
Disclaimer/Publisher’s Note: The statements, opinions and data contained in all publications are solely those of the individual author(s) and contributor(s) and not of MDPI and/or the editor(s). MDPI and/or the editor(s) disclaim responsibility for any injury to people or property resulting from any ideas, methods, instructions or products referred to in the content.

