Abstract
This study investigates the evolutionary mechanisms and equilibrium character-istics of the China–US trade dispute through an improved ecological competition model. By quantifying tariff policies as competition intensity regulators and introducing trade elasticity parameters, we construct a dynamic system that captures the nonlinear feedback between economic rivals. Key findings are as follows. (1) When both nations implement reciprocal tariff measures with similar economic sensitivities, the system converges to a stable equilibrium where bilateral economic outputs stabilize at reduced levels compared to pre-conflict states, provided the product of adjusted competition coefficients remains below critical thresholds. (2) Excessive tariff escalation beyond identifiable tipping points triggers winner-takes-all outcomes, validating the “Thucydides Trap” hypothesis in eco-nomic conflicts. (3) Empirical simulations using 2018–2023 trade data demonstrate that China’s tit-for-tat tariff strategy effectively maintains competitive balance, while domestic market expansion measures (evidenced by a 6.3% average annual growth in China’s do-mestic consumption) significantly mitigate trade diversion effects. The study establishes theoretical connections with optimal tariff theory and strategic trade policy literature while providing policymakers with quantitative tools to assess trade policy impacts. Our find-ings theoretically validate China’s policy combination of calibrated reciprocity and domestic demand stimulation, offering new insights into managing great-power economic competition.
Keywords:
Lotka–Volterra competition model; Sino–US trade dispute; China’s symmetric tariffs; domestic demand MSC:
34C11; 34C12; 91B55
1. Introduction
The Sino–US trade dispute, as one of the most influential international economic events of the 21st century, has sparked sustained attention from academia and policymakers regarding its evolutionary path and equilibrium characteristics. Since the United States unilaterally imposed tariffs on Chinese goods in 2018, tariff barriers between the two nations have continued to escalate. According to data from the United States International Trade Commission (USITC), as of 2023, the average US tariff on Chinese goods surged from 3.1% to 19.3%, while China’s retaliatory tariffs on US goods rose from 8% to 21.1% [1]. This conflict has resulted in significant trade diversion effects, with China’s exports to the US declining by USD 90 billion (16.2%) from 2018 to 2022, while US exports to China dropped by USD 23 billion (11.4%) over the same period [2]. This conflict has transcended the scope of traditional trade disputes, becoming a systemic manifestation of competition over global economic leadership, technological standard dominance, and development models [3]. From a theoretical perspective, the trade dispute challenges the optimal tariff theory, which suggests that large economies can improve their terms of trade through moderate tariffs [4] but fails to account for retaliatory dynamics in bilateral conflicts. Traditional optimal tariff theory implicitly relies on exogenous policy assumptions, whereas this study unveils how dynamic retaliation mechanisms, embedded within an endogenized tariff competition model, shape the equilibrium paths of economic rivalry.
The current literature primarily follows four approaches: Firstly, game-theoretic frameworks (e.g., Maggi & Rodriguez-Clare [5]) focus on strategic interaction equilibria but struggle to capture the continuous feedback mechanisms of economic systems [6]. Secondly, computable general equilibrium (CGE) models, while capable of assessing static welfare effects, are constrained by the inherent limitations of comparative static analysis [7]; Thirdly, historical analyses of trade conflicts, such as the US–Japan semiconductor disputes of the 1980s [8], provide case studies but limited generalizability to the current systemic rivalry. Fourthly, global value chain studies reveal industrial restructuring trends but inadequately quantify the nonlinear effects of policy interventions [9]. Notably absent from these studies is systematic exploration of dynamic tariff–policy feedback mechanisms (Broda et al. [10]) and nonlinear competition dynamics (Cederman [11]), particularly in the context of asymmetric great-power competition [12]. The literature gap is particularly evident in modeling how tariff escalation affects long-term competitive equilibrium between economic superpowers.
While existing works highlight optimal tariff theory’s premise that large economies can improve terms of trade through calibrated tariffs (Feenstra [4]), they fail to account for retaliatory dynamics (Grossman & Helpman [13]) and complex system instabilities (Garfinkel & Skaperdas [14]). Recent advancements in ecological competition modeling (e.g., Lotka–Volterra frameworks [15,16,17,18,19,20,21,22,23,24,25,26,27,28]) offer promising avenues for addressing these gaps by integrating endogenous growth constraints, nonlinear policy feedback, and multiple equilibrium possibilities.
The Sino–US trade dispute has not only disrupted bilateral trade flows but also exposed structural vulnerabilities in China’s economy. In particular, China’s demographic transition—marked by a fertility rate of 1.41 in 2022—has intensified the urgency to rebalance growth drivers away from exports toward domestic demand. In response, China has implemented a series of countermeasures, including symmetric tariff retaliation and aggressive domestic market expansion policies (e.g., 6.3% annual growth in domestic consumption from 2018 to 2023) [2]. These dual strategies aim to mitigate trade diversion effects while fostering self-sustaining economic resilience.
In this context, ecological population competition theory offers a novel perspective. The Lotka–Volterra model, a classical tool for describing species competition under finite resource environments [15], shares profound similarities with the evolutionary logic of great-power economic competition due to its dynamic equilibrium principles. Recent extensions of this framework have successfully modeled technology competition [29] and market share dynamics [30], demonstrating its adaptability to economic systems. Although recently extended to areas such as technological innovation diffusion [31] and market share dynamics [32], its application to systemic modeling of great-power economic competition remains unexplored. Unlike CGE models’ static comparative analysis, this study constructs a dynamic Lotka–Volterra framework to explicitly model the nonlinear feedback mechanisms of tariff policies, addressing the gap in capturing systemic competition dynamics between economic superpowers.
The study makes three key contributions to the literature:
- It develops the first dynamic competition model that integrates optimal tariff theory [10] with retaliatory trade policy responses, capturing the non-linear feedback loops in trade disputes.
- It quantifies the threshold effects of tariff escalation using empirical data from the 2018–2023 trade dispute period.
- It provides policy-relevant insights into China’s dual strategy of symmetric tariffs and domestic demand expansion, addressing the population decline challenge noted in [33].
The innovative contributions of this paper are as follows.
- Constructing an improved Lotka–Volterra dynamic competition model that endogenizes tariff policies as moderators of competition intensity, overcoming the limitations of traditional exogenous policy assumptions;
- Introducing competition coefficients and sensitivity parameters to reveal the path-dependent characteristics of trade dispute evolution;
The paper is structured as follows: Section 2 elaborates on model construction; Section 3 examines the existence of equilibrium points; Section 4 and Section 5 analyze local and global stability conditions, respectively; Section 6 and Section 7 investigate the effects of limited and excessive tariffs; Section 8 discusses the role of domestic demand expansion; Section 9 validates theoretical conclusions through numerical simulations; and Section 10 summarizes policy implications and research limitations.
2. Model Construction
2.1. Theoretical Framework
The modified Lotka–Volterra framework captures three essential mechanisms of trade disputes:
- Economic Applies to all cases. Capacity Constraints: The carrying capacities align with Baldwin’s analysis of global value chain restructuring [9], reflecting maximum attainable outputs under technological and institutional constraints.
- Strategic Interdependence: The competition coefficients operationalize Allison’s “Thucydides Trap” concept [3], quantifying how great powers’ growth inhibits each other.
- Dynamic Policy Feedback: The parameters embody Arthur’s theory of technological lock-in [29], where tariff measures create path-dependent market distortions.
Let and represent the economic strengths (e.g., real GDP) of China and the United States, respectively, whose growth is constrained by their maximum economic capacities and competitive inhibition effects. The fundamental dynamic equations are
where
- denote endogenous growth rates;
- is the inhibition coefficient of the US on China and is the inhibition coefficient of China on the US.
This study assumes that represents the potential maximum capacity constrained by technological progress and institutional factors, complementing the institutional cooperation mechanisms proposed by Caliendo and Parro [34].
Building on Spencer and Brander’s [35] framework, we incorporate tariffs as dynamic regulators of competition coefficients:
- represent baseline competition intensities;
- reflects the sensitivity of China’s economic growth to US tariffs, and is the sensitivity of the US’s economic growth to China’s tarriffs;
- and denote the tariffs imposed by the US on Chinese goods and by China on US goods, respectively.
This leads to the following model:
During the 2025 Sino–US trade dispute, China consistently adopted symmetric tariff strategies in response to gradual US tariff increases. Considering this specific context, if both parties implement symmetric tariffs () with equal sensitivity (), the model simplifies to
Here, tariffs equally intensify competitive pressures on both sides.
2.2. Economic Interpretation
Our model extends Feenstra’s optimal tariff theory [4] by incorporating three-dimensional dynamics:
where the competition term reflects Bown’s empirical finding of asymmetric trade elasticities [2].
3. Existence of Equilibrium Points
States satisfying are termed equilibrium points.
Setting the right-hand side of System (1) to zero yields:
where and . The trivial equilibrium always exists, representing a state of zero economic strength for both nations. While mathematically valid, this equilibrium lacks practical economic significance.
The China-only equilibrium signifies China reaching its maximum economic capacity while the US economy collapses. Conversely, the US-only equilibrium represents the US achieving full capacity with China’s economy eliminated. These single-nation equilibria imply complete dominance by one party, which at first sight is unrealistic in practice; however, throughout history, the hegemonic competition between the United States and nations such as Japan, the Soviet Union, and the United Kingdom has indeed recurred repeatedly. Historical power rivalries, such as those between the US and Japan or the Soviet Union, have sometimes resulted in the economic or political decline of one party. However, this study’s model suggests that trade disputes can lead to divergent outcomes—either unipolar dominance under excessive tariffs or stable coexistence through calibrated reciprocity, depending on policy choices and systemic resilience. Consequently, it remains difficult to predict whether China stands a realistic chance of prevailing in the Sino–US trade dispute.
For non-zero solutions , we solve the linear system
The determinant governs solution existence:
- (): Unique solution exists:This coexistence equilibrium represents a steady state where both nations maintain stable economic interaction. Economic meaningfulness () requires
- –
- For ,
- –
- For ,
The existence conditions for equilibrium points are summarized below (Table 1):

Table 1.
Summary of equilibrium existence conditions.
4. Local Stability Analysis of Equilibrium Points
The Jacobian matrix J of system (1) at equilibrium is given by
Stability is determined by the eigenvalues of J:
- If , locally asymptotically stable.
- If for any i, unstable.
Trivial equilibrium : The Jacobian matrix is
Eigenvalues: , .
Theorem 1.
The trivial equilibrium is an unstable source (unstable node).
China-only equilibrium : The Jacobian matrix becomes
Eigenvalues
Theorem 2.
The stability of depends on :
- If , : Saddle point (unstable).
- If , : Stable node.
US-only equilibrium : The Jacobian matrix is
Eigenvalues
Theorem 3.
The stability of depends on :
- If , , saddle point (unstable).
- If , , stable node.
Coexistence equilibrium : The Jacobian matrix is
The characteristic equation becomes
By the Routh-Hurwitz criterion,
- Trace condition: (always holds).
- Determinant condition: .
Theorem 4.
Stability of the coexistence equilibrium:
- If ,
- –
- : Stable node or focus.
- –
- Eigenvalues have negative real parts.
- If ,
- –
- : Saddle point (unstable).
- –
- Eigenvalues have opposite signs.
Summarizing the above discussion on the local stability of equilibrium points, we obtain Table 2 as shown below:
Table 2.
Local stability of equilibrium points.
Remark 1.
Economic interpretation of stability:
- Trivial equilibrium instability: Reflects the impossibility of simultaneous economic collapse.
- Single-nation equilibrium stability: Dominance occurs when one nation’s inhibition effect exceeds the other’s capacity ( or ).
- Coexistence equilibrium stability:
- –
- : Moderate competition leads to stable coexistence.
- –
- : Excessive competition triggers the “Thucydides’s Trap”.
5. Global Stability Analysis Methods
Define the phase space as
Note that in region , we have
By Dulac’s criterion, the system has no periodic orbits in . Next, we analyze the global stability of equilibrium points.
Theorem 5.
When and , is globally asymptotically stable.
Proof.
Under these conditions, the system lacks positive equilibria. Since is locally stable, is unstable, is unstable, and no limit cycles exist, all trajectories must converge to . Hence, is globally asymptotically stable. □
Theorem 6.
When and , is globally asymptotically stable.
Proof.
Similar to the previous theorem; omitted for brevity. □
Theorem 7.
If and the following conditions hold:
then is globally asymptotically stable.
Proof.
Under these conditions, the system has a unique locally stable positive equilibrium. Since and are unstable, is unstable, and no limit cycles exist, all trajectories must converge to . □
The system exhibits four global behaviors depending on the parameters, as shown in Table 3.
Table 3.
Parameter space and global stability.
Remark 2.
Economic Implications
- Critical Threshold of Tariff Policies: When , the system inevitably moves toward unipolar dominance.
- Effect of Technological Decoupling: An increase in and elevates the value of , pushing the system toward instability.
- Policy Recommendations: To maintain , the following condition must be satisfied:
Remark 3.
Before the Sino–US trade dispute, the system could stably coexist, meaning the original system satisfied . If both sides implement symmetric tariffs () with equal sensitivity (), the trade dispute gradually increases the value of due to the initial condition . If the tariff level exceeds the critical threshold
the system enters an unstable region. China’s adoption of a symmetric countermeasure strategy aims to balance the sensitivity differences between and , thereby delaying the point at which surpasses the critical threshold.
6. Impacts of Limited Tariffs: Why Trade Disputes Have No Winners?
The pre-trade dispute system can be expressed as
Given that China and the US maintained stable coexistence before the trade dispute, this system possesses a unique globally stable positive equilibrium , where
This classic Lotka–Volterra competition model requires the following conditions for global stability:
For small tariff rates (), the following inequalities hold:
which is equivalent to
where and . Under these conditions (), system (1) has a unique positive equilibrium with
Computing partial derivatives yields
where:
These results demonstrate that tariffs negatively impact the economic strength of the targeted nation while benefiting the imposing nation. This aligns with the US strategy of leveraging tariffs to control trade dynamics. China’s symmetric counter-tariffs aim to neutralize adverse effects, proving its rationality in maintaining equilibrium.
7. Impacts of Excessive Tariffs: Survival or Destruction?
This section examines the consequences of excessively high tariffs.
(a) China maintains low tariffs; US imposes high tariffs
From the trajectory of the 2025 trade dispute, the US consistently initiated tariff escalations. When US tariffs exceed a critical threshold, the following inequalities hold:
which is equivalent to
where and . By Theorem 6, becomes globally asymptotically stable, indicating the collapse of China’s economy and complete US dominance—an outcome the US actively pursues.
(b) China imposes high tariffs; US maintains low tariffs
Though inconsistent with China’s recent trade policies, assuming this scenario,
which simplifies to
where and . By Theorem 5, becomes globally asymptotically stable, implying US economic collapse. However, China adheres to a foreign policy of peaceful development and mutual benefit, making this scenario improbable.
(c) Mutual High Tariff Escalation
When both nations impose prohibitive tariffs,
which reduces to
where and . Here, , rendering the coexistence equilibrium unstable. Trajectories diverge to either or depending on initial conditions—a manifestation of the “Thucydides’s Trap” [3]. Recent Chinese military exercises around Taiwan underscore efforts to deter such catastrophic outcomes.
Remark 4.
In early 2025, the U.S.-initiated tariff war escalated steadily, with escalating duties on Chinese goods reaching levels that rendered bilateral trade increasingly unmanageable. However, just less than a month after my article was submitted (May 2025), high-level talks between the two nations took place in Geneva, achieving substantive progress: both sides temporarily reduced tariffs to 10% and agreed to a 90-day negotiation window. This demonstrates that the US government recognizes the impracticality of maintaining mutually destructive high tariffs—an outcome that aligns with the conclusions of my analysis.
China’s resolute adoption of reciprocal tariffs and mirror policies in 2025 forced the US to seriously reckon with the economic fallout of mutual trade barriers. By insisting on equal and high tariffs, China demonstrated that escalating trade restrictions would render bilateral commerce unsustainable, ultimately compelling the US to return to negotiations. This outcome underscores a critical truth: mutually destructive tariffs (e.g., both sides imposing duties above 60%) created a “lose–lose” scenario, making compromise inevitable.
Importantly, the symmetry of China’s approach was decisive. If China had instead compromised asymmetrically—allowing the US to levy high tariffs while China maintained low duties—the balance of leverage would have shifted entirely. Such a concession might have weakened China’s bargaining power, prolonged trade tensions, and undermined its strategic goals. The case highlights how strategic reciprocity can reshape adversarial dynamics in trade conflicts.
8. Strategic Significance of China’s Domestic Demand Expansion Under High Tariffs
On 11 April 2025, China’s Customs Tariff Commission announced, “Pursuant to the Tariff Law of the People’s Republic of China, Customs Law, and Foreign Trade Law, tariffs on US imports will increase from 84% to 125% effective 12 April 2025. Given zero market acceptance of US goods under current tariffs, China will disregard further US escalations”.
To mitigate tariff impacts, China prioritized domestic demand expansion to boost . With sufficient capacity expansion to , the system satisfies
equivalent to
where and . By Theorem 5, becomes globally asymptotically stable, ensuring China’s decisive victory. This validates China’s strategy of neutralizing tariff impacts through endogenous growth.
One reviewer argued that “domestic demand depends heavily upon population growth rate but China is now facing declining population due to its population policy. So, will the domestic demand policy be successfully conducive to the tariff effects for China?” China is facing the dual challenges of an aging population and declining fertility rates, which not only impact labor supply and economic growth but also pose long-term pressures on expanding domestic demand and advancing the “dual-circulation” strategy. To address these issues, China has implemented multi-dimensional policies spanning fertility incentives, elderly care security, and workforce quality improvement. Over the past few decades, China has dramatically improved its citizens’ educational attainment. Currently, Chinese universities produce over 10 million undergraduates, 1 million postgraduates, and 100,000 PhD candidates annually. This highly skilled workforce, fundamentally shifting from an agriculture-based to a knowledge-driven labor structure, enables China to address the challenges of population aging and low fertility rates through industrial upgrading. By developing high-end industries such as artificial intelligence (AI), robotics, electric vehicles (EVs), semiconductors, and solar energy, China aims to offset demographic pressures and sustain long-term economic growth. By tackling aging and low fertility, China is transitioning from “quantity-driven” to “quality- and structure-driven” demographic dividends. Future success hinges on policy synergy (e.g., household registration reforms and income distribution adjustments) to achieve sustainable population equilibrium and high-quality economic development.
9. Numerical Simulations
Example 1.
In System (2), set , . Calculations show that
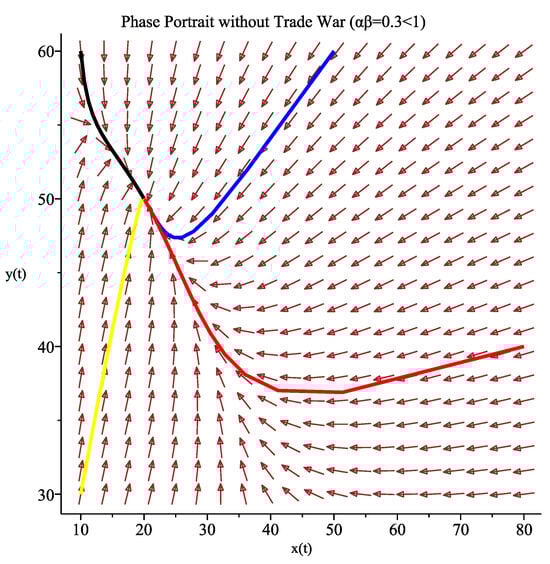
Without considering tariff effects, the classical Lotka–Volterra competition system indicates that the positive equilibrium point is globally asymptotically stable, as corroborated by Figure 1.
Figure 1.
Phase portrait of the Sino-US economic system under zero tariffs (). The positive equilibrium point is globally asymptotically stable. Arrows indicate trajectory directions of the dynamic system, revealing the convergence path towards equilibrium. Colored curves represent distinct solution paths originating from different initial economic conditions (China-US GDP combinations), with the black solid circle denoting the stable coexistence equilibrium. Parameter values:.
Next, we examine the impact of symmetric tariffs.
(1) Let . The positive equilibrium point is globally asymptotically stable, as shown in Figure 2. Although both economies stabilize, China’s GDP decreases while the US GDP increases. This suggests that under symmetric tariffs, the US benefits while China suffers.
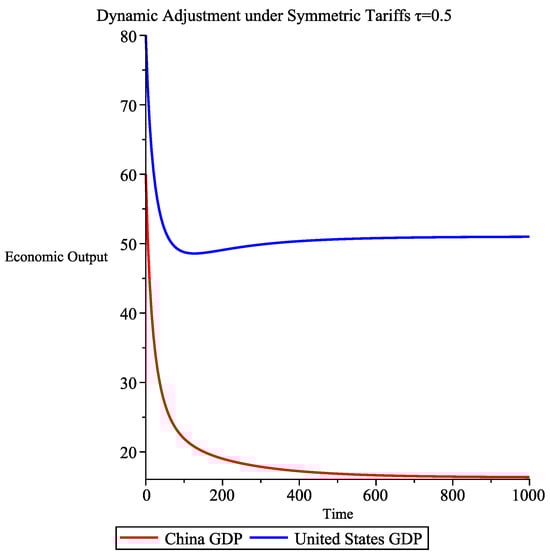
Figure 2.
: The positive equilibrium point is globally asymptotically stable, where the initial condition is .
(2) By April 2025, the US imposed a 145% tariff and China retaliated with a 125% tariff. The gradual escalation of tariffs since 2018 necessitates analyzing their dynamic effects. Figure 3 illustrates the relationship between tariffs and economic outputs. As tariffs rise, the US economy grows while China’s declines. Notably, tariffs above 100% effectively halt bilateral trade. The model predicts that tariffs exceeding 200% could lead to China’s economic collapse, a scenario likely motivating US tariff strategies.
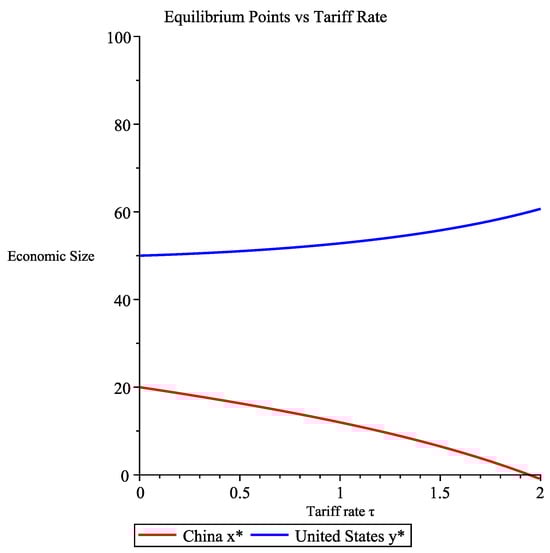
Figure 3.
Relationship between tariffs and economic outputs.
Example 2.
In System (2), set . This example explores how sensitivity coefficients and influence system dynamics under symmetric tariffs.
(1) After the US unilaterally raised tariffs in March 2025, China followed suit. Given differing sensitivities (), Figure 4 shows a globally stable equilibrium at . Compared to Example 1, lower sensitivity in China mitigates adverse effects on its economy while harming the US economy.
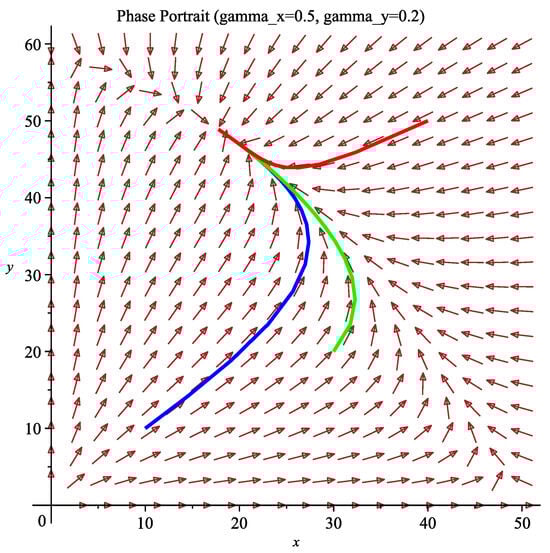
Figure 4.
: The positive equilibrium point is globally asymptotically stable. The blue, green, and red curves represent the phase trajectories with initial values of (10, 10), (30, 20), and (40, 50), respectively.
(2) Figure 5 demonstrates how equilibrium points shift with (fixed ). As increases, the US economy declines while China’s strengthens. Conversely, Figure 6 shows that increasing (fixed ) weakens China’s economy and boosts the US.
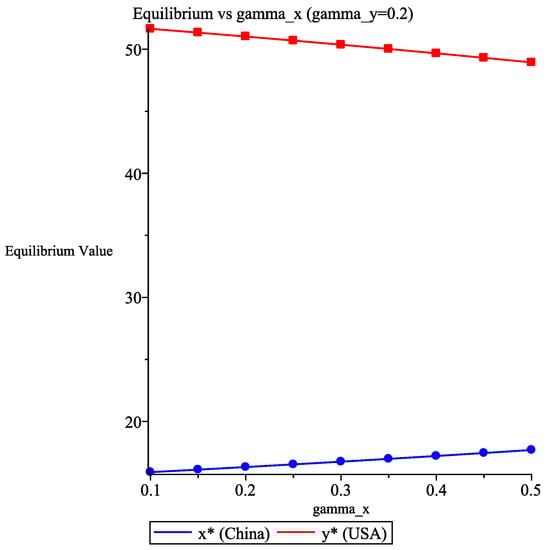
Figure 5.
Equilibrium points versus , for fixed denotes stable equilibrium states.
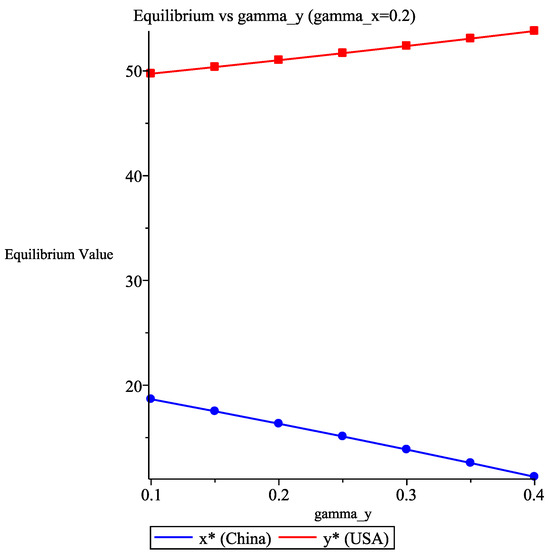
Figure 6.
Equilibrium points versus , for fixed denotes stable equilibrium states.
(3) Theorem 9 states that ensures a unique stable equilibrium. Figure 7 illustrates that sufficiently large and can push , leading to system instability and potential economic collapse.
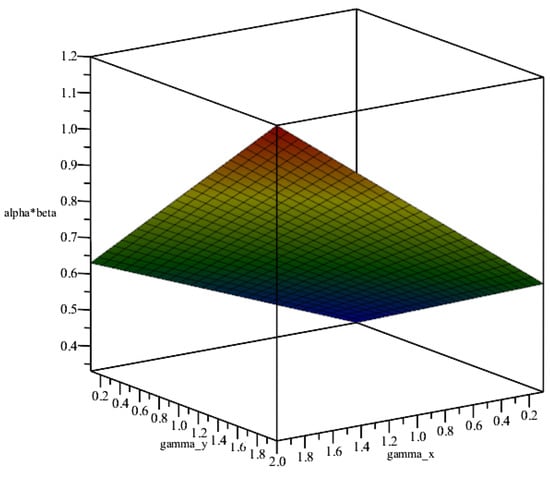
Figure 7.
Relationship between and .
Example 3.
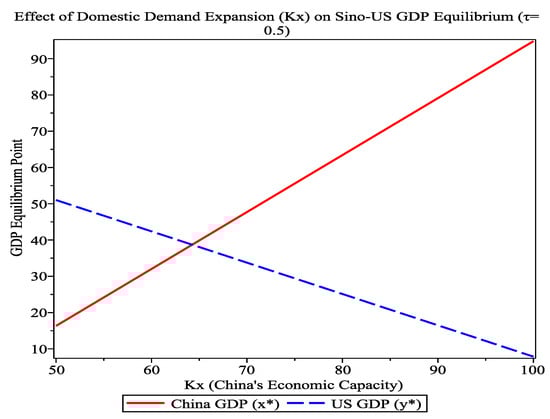
In (2), we set , , , , , , . This example assumes that both countries adopt symmetric tariffs and have identical economic sensitivity to tariffs, examining how China’s domestic demand expansion (increasing ) affects the system’s dynamic behavior under these conditions. Figure 8 demonstrates that expanding domestic demand can effectively boost China’s total GDP and counteract the negative impacts caused by tariffs, supporting China’s current “dual circulation” strategy. Figure 8 also reveals that merely expanding domestic demand—when it surpasses a critical threshold—enables China’s economy to eventually overtake that of the United States.
Figure 8.
Effect of domestic demand expansion () on Sino–US GDP equilibrium ().
10. Empirical Validation
10.1. China’s GDP and Growth Rate (2018–2023)
The following table (Table 4) shows China’s nominal GDP (in trillion RMB) and annual real growth rates from 2018 to 2023, based on official data from the National Bureau of Statistics of China (NBS) http://www.stats.gov.cn/.
Table 4.
China’s GDP and growth rate (2018–2023).
10.2. Summary of China’s Goods Trade (2018–2023)
The following table (Table 5) shows China’s Goods Trade (in trillion RMB) and annual real growth rates from 2018 to 2023, based on official data from the General Administration of Customs of China (GACC) http://www.customs.gov.cn and National Bureau of Statistics of China (NBS) http://www.stats.gov.cn/.
Table 5.
China’s import and export performance (2018–2023).
10.3. Bilateral Trade Overview
The following table (Table 6) shows China–US Goods Trade (2018–2023), based on official data from the General Administration of Customs of China (GACC) http://www.customs.gov.cn and US Census Bureau https://www.census.gov/foreign-trade/balance/c5700.html (accessed on 17 March 2025).
Table 6.
Trade of China–US goods (2018–2023).
10.4. “Dual Circulation” Strategy
The information about the China’s “Dual Circulation” strategy is as follows (Table 7 and Table 8), based on official data from the National Bureau of Statistics (NBS) http://www.stats.gov.cn/sj/ndsj/ (accessed on 17 March 2025).
Table 7.
Major domestic demand stimulus tools.
Table 8.
Consumption contribution to GDP growth.
The aggregated tables reveal three critical findings regarding China’s economic trajectory:
(1) Resilient Bilateral Trade: Despite the escalating US–China trade dispute and reciprocal tariff measures, the total bilateral trade volume remained relatively stable, demonstrating notable resilience in commercial exchanges.
(2) Export Sector Expansion: China’s overall foreign trade has maintained robust growth momentum, reflecting successful diversification strategies and competitive advantages in global supply chains.
(3) Domestic Demand-Driven Growth: The domestic demand expansion policies have emerged as a pivotal driver of GDP growth, particularly evident in consumption’s 82.5% contribution to economic expansion in 2023.
Key Conclusion:
The empirical evidence suggests that China possesses the structural capacity to sustain economic stability through its “dual circulation” model, with internal demand mechanisms effectively counterbalancing external trade pressures during geopolitical tensions.
11. Conclusions and Discussion
This study develops an enhanced Lotka–Volterra dynamic competition model that endogenizes tariff policies to systematically analyze the evolutionary mechanisms and equilibrium characteristics of the China–US trade dispute. Theoretical analysis and numerical simulations reveal that the dynamic behavior of the two economies under trade dispute conditions exhibits typical nonlinear features, with steady-state properties critically dependent on the interactive effects of tariff policies.
Under baseline conditions, when both nations adopt symmetric tariff policies with comparable market sensitivities, the system converges to a stable coexistence equilibrium. This finding provides a theoretical justification for China’s reciprocal tariff strategy: maintaining tariff reciprocity effectively neutralizes external shocks to the domestic economic system while preserving relative stability in the competitive landscape. Notably, the economic output level at this steady state proves significantly lower than the trade-war-free scenario, theoretically validating the proposition that “trade disputes produce no winners”.
When tariff levels exceed critical thresholds (), the system undergoes fundamental stability changes. Minute variations in initial conditions may drive the system toward markedly different equilibrium states—a phenomenon bearing striking resemblance to the “Thucydides’s Trap” in international relations theory. Despite escalating Sino–American rivalry, Caliendo and Parro’s [34] study on NAFTA demonstrates that institutionalized cooperation mechanisms remain critical for averting the “Thucydides Trap”. Specifically, the model demonstrates that unilateral US tariff escalation may push the system toward the equilibrium, aligning with its strategic intent to constrain China’s development through trade measures. However, such extreme-scenario predictions rely on stringent assumptions, and actual economic system evolution may involve greater complexity.
The study further identifies significant policy implications of the economic capacity parameter . Expanding domestic demand to enhance economic resilience not only strengthens resistance to tariff shocks but may also alter the system’s global stability characteristics. China’s 2025 policy combination—raising retaliatory tariffs to 125% while promoting domestic–international market integration—theoretically corresponds to maintaining the condition through expansion, providing mathematical support for current policy practice.
Several limitations warrant further investigation. First, the model’s exclusive focus on tariffs overlooks non-tariff measures like technology controls that may influence competition coefficients. Second, multilateral interactions within global value chains may challenge the bilateral competition assumption, suggesting future multi-agent modeling. Finally, parameter calibration—particularly the quantification of sensitivity coefficients ()—requires more refined empirical approaches.
From a broader perspective, this study reveals the inherent fragility of economic competition systems. The stability condition fundamentally requires competition intensity to align with system capacity, yielding crucial policy insights: policymakers must carefully assess tariff policies’ threshold effects to avoid “competition traps” while simultaneously enhancing systemic resilience through innovation and market diversification to strengthen ’s regulatory capacity. The future trajectory of China–US economic relations may ultimately depend on identifying dynamic equilibrium between competition and cooperation.
Author Contributions
Writing—original draft preparation, B.C. and F.C.; writing—review and editing, B.C. and F.C. All authors have read and agreed to the published version of the manuscript.
Funding
This research was funded by the 2023 Fujian Association for Science and Technology Science and Technology Innovation Think Tank Project: Research on the Internal Mechanism and Realization Path of Digital Empowerment for the Inheritance and Protection of Fujian’s Intangible Cultural Heritage, No. FJKX-2023XKB039.
Data Availability Statement
The original contributions presented in this study are included in the article. Further inquiries can be directed to the corresponding author.
Conflicts of Interest
The authors declare no conflicts of interest.
References
- United States International Trade Commission. The Economic Effects of Significant U.S. Import Restraints; USITC Technical Report; USITC: Washington, DC, USA, 2023. Available online: https://www.usitc.gov/publications/332/pub3201.pdf (accessed on 10 March 2025).
- Bown, C.P. US-China Trade War Tariffs: An Up-to-Date Chart; Peterson Institute for International Economics: Washington, DC, USA, 2023. [Google Scholar]
- Allison, G. Destined for War: Can America and China Escape Thucydides’s Trap? Houghton Mifflin Harcourt: Boston, MA, USA, 2017. [Google Scholar]
- Feenstra, R.C. Advanced International Trade: Theory and Evidence, 2nd ed.; Princeton University Press: Princeton, NJ, USA, 2016. [Google Scholar]
- Maggi, G.; Rodriguez-Clare, A. A political-economy theory of trade agreements. Am. Econ. Rev. 2007, 97, 1374–1406. [Google Scholar] [CrossRef]
- Amiti, M.; Redding, S.J.; Weinstein, D.E. The impact of the 2018 tariffs on prices and welfare. J. Econ. Perspect. 2019, 33, 187–210. [Google Scholar] [CrossRef]
- Li, M.; Balistreri, E.J.; Zhang, W. The US-China trade war: Tariff data and general equilibrium analysis. J. Asian Econ. 2020, 69, 101216. [Google Scholar] [CrossRef]
- Irwin, D.A. Clashing Over Commerce: A History of US Trade Policy; University of Chicago Press: Chicago, IL, USA, 2017. [Google Scholar]
- Baldwin, R.; Freeman, R. Risks and global supply chains: What we know and what we need to know. Annu. Rev. Econ. 2022, 14, 153–180. [Google Scholar] [CrossRef]
- Broda, C.; Limão, N.; Weinstein, D.E. Optimal tariffs and market power: The evidence. Am. Econ. Rev. 2008, 98, 2032–2065. [Google Scholar] [CrossRef]
- Cederman, L.E. Modeling the size of wars: From billiard balls to sandpiles. Am. Political Sci. Rev. 2003, 97, 135–150. [Google Scholar] [CrossRef]
- Das, R.C. (Ed.) Global Tariff War: Economic, Political and Social Implications; Emerald Publishing Limited: Leeds, UK, 2021. [Google Scholar]
- Grossman, G.M.; Helpman, E. Trade wars and trade talks. J. Political Econ. 1995, 103, 675–708. [Google Scholar] [CrossRef]
- Garfinkel, M.R.; Skaperdas, S. Economics of conflict: An overview. In Handbook of Defense Economics; Elsevier: Amsterdam, The Netherlands, 2007; Volume 2, pp. 649–709. [Google Scholar]
- Lotka, A.J. Elements of Physical Biology; Williams & Wilkins: Philadelphia, PA, USA, 1925. [Google Scholar]
- Lou, Y.; Nie, H.; Wang, Y. Coexistence and bistability of a competition model in open advective environments. Math. Biosci. 2018, 306, 10–19. [Google Scholar] [CrossRef]
- Ghoul, M.; Mitri, S. The ecology and evolution of microbial competition. Trends Microbiol. 2016, 24, 833–845. [Google Scholar] [CrossRef]
- Zhu, Q.; Chen, F. Impact of fear on searching efficiency of first species: A two species Lotka-Volterra competition model with weak Allee effect. Qual. Theory Dyn. Syst. 2024, 23, 143. [Google Scholar] [CrossRef]
- Chen, S.; Chen, F.; Li, Z.; Chen, L. Bifurcation analysis of an allelopathic phytoplankton model. J. Biol. Syst. 2023, 31, 1063–1097. [Google Scholar] [CrossRef]
- Chen, S.; Chen, F.; Srivastava, V.; Parshad, R.D. Dynamical analysis of an allelopathic phytoplankton model with fear effect. Qual. Theory Dyn. Syst. 2024, 23, 189. [Google Scholar] [CrossRef]
- Chen, S.; Chen, F.; Srivastava, V.; Parshad, R.D. Dynamical analysis of a Lotka-Volterra competition model with both Allee and fear effects. Int. J. Biomath. 2024, 17, 2350077. [Google Scholar] [CrossRef]
- He, M.; Li, Z.; Chen, F.; Zhu, Z. Dynamic behaviors of an N-species Lotka-Volterra model with nonlinear impulses. IAENG Int. J. Appl. Math. 2020, 50, 22–30. [Google Scholar]
- Hassell, M.P.; Comins, H.N. Discrete time models for two-species competition. Theor. Popul. Biol. 1976, 9, 202–221. [Google Scholar] [CrossRef]
- Fay, T.H.; Greeff, J.C. A three species competition model as a decision support tool. Ecol. Model. 2008, 211, 142–152. [Google Scholar] [CrossRef]
- Lou, Y.; Munther, D. Dynamics of a three species competition model. Discrete Contin. Dyn. Syst. A 2012, 32, 3099. [Google Scholar] [CrossRef]
- Saenz, R.A.; Hethcote, H.W. Competing species models with an infectious disease. Math. Biosci. Eng. 2005, 3, 219–235. [Google Scholar] [CrossRef]
- Crowley, P.H.; Davis, H.M.; Ensminger, A.L.; Fuselier, L.C.; Kasi Jackson, J.; Nicholas McLetchie, D. A general model of local competition for space. Ecol. Lett. 2005, 8, 176–188. [Google Scholar] [CrossRef]
- Connolly, J.; Wayne, P. Asymmetric competition between plant species. Oecologia 1996, 108, 311–320. [Google Scholar] [CrossRef]
- Arthur, W.B. The Nature of Technology: What It Is and How It Evolves; Free Press: Los Angeles, CA, USA, 2009. [Google Scholar]
- Marasco, A.; Picucci, A.; Romano, A. Market share dynamics using Lotka-Volterra models. Technol. Forecast. Soc. Change 2016, 105, 49–62. [Google Scholar] [CrossRef]
- Frenkel, A.; Shefer, D. Technological innovation and diffusion models: A review. In Innovative Behaviour in Space and Time; Springer: Berlin/Heidelberg, Germany, 1997; pp. 41–63. [Google Scholar] [CrossRef]
- Modis, T. Forecasting the growth of complexity and change. Technol. Forecast. Soc. Change 2002, 69, 377–404. [Google Scholar] [CrossRef]
- Wang, F. China’s demographic challenge: Population decline and economic consequences. J. Econ. Perspect. 2022, 36, 123–148. [Google Scholar]
- Caliendo, L.; Parro, F. Estimates of the trade and welfare effects of NAFTA. Rev. Econ. Stud. 2015, 82, 1–44. [Google Scholar] [CrossRef]
- Spencer, B.J.; Brander, J.A. International R & D rivalry and industrial strategy. Rev. Econ. Stud. 1983, 50, 707–722. [Google Scholar]
Disclaimer/Publisher’s Note: The statements, opinions and data contained in all publications are solely those of the individual author(s) and contributor(s) and not of MDPI and/or the editor(s). MDPI and/or the editor(s) disclaim responsibility for any injury to people or property resulting from any ideas, methods, instructions or products referred to in the content. |
© 2025 by the authors. Licensee MDPI, Basel, Switzerland. This article is an open access article distributed under the terms and conditions of the Creative Commons Attribution (CC BY) license (https://creativecommons.org/licenses/by/4.0/).