Abstract
As the forms of cyber threats become increasingly severe, cybersecurity knowledge graphs (KGs) have become essential tools for understanding and mitigating these threats. However, the quality of the KG is critical to its effectiveness in cybersecurity applications. In this paper, we propose a spurious-negative sample augmentation-based quality evaluation method for cybersecurity KGs (SNAQE) that includes two key modules: the multi-scale spurious-negative triple detection module and the adaptive mixup based on the attention mechanism module. The multi-scale spurious-negative triple detection module classifies the sampled negative triples into spurious-negative and true-negative triples. Subsequently, the attention mechanism-based adaptive mixup module selects appropriate mixup targets for each spurious-negative triple, constructing partially correct triples and achieving more precise sample generation in the entity embedding space to assist in training the KG quality evaluation models. Through extensive experimental validation, the SNAQE model not only performs excellently in general-domain KG quality evaluation but also achieves outstanding outcomes in the cybersecurity KGs, significantly enhancing the accuracy and F1 score of the model, with the best F1 score of 0.969 achieved on the FB15K dataset.
MSC:
68T50
1. Introduction
With the increasing complexity of cyberattack methods and the rapid growth of data scale, cybersecurity KGs have played an irreplaceable role in threat intelligence analysis, intrusion detection, and situational awareness, providing new solutions for the comprehensive integration of dispersed cybersecurity data and enhancing threat response capabilities [1,2,3]. However, since the construction of KGs often relies on automated or semi-automated techniques, it inevitably introduces noise and erroneous information. The performance of downstream applications can be significantly compromised by a low-quality KG, resulting in issues such as false positives, undetected threats, and flawed deductions and decision-making. Hence, accurately evaluating the quality of KGs to guarantee the dependability and correctness of their triple data is an important research challenge that needs to be addressed [4,5].
Current knowledge representation learning models have demonstrated notable success in tasks such as triple classification and KG completion by mapping entities and relations to low-dimensional vector spaces [6,7,8]. During the model training process, negative sampling plays a crucial role. If the quality of negative samples is too low, leading to a large discrepancy between positive and negative samples, it can result in the gradient vanishing problem. Negative sampling techniques aim to generate high-quality negative samples to increase the score difference between positive and negative samples, thereby effectively enhancing the training performance of the model.
However, traditional negative sampling methods are generally based on the closed-world assumption, which posits that all non-existent triples are negative samples [6]. These negative sampling methods largely overlook the issue of sampling noisy triples, often treating high-scoring but non-existent triples as high-quality negative triples. However, such high-scoring negative triples may actually be true triples, i.e., triples that do not exist in the knowledge graph but are factually correct. This may lead to the introduction of spurious-negative samples. We define spurious-negative triples as those absent from the knowledge graph but factually correct, using “score” as the criterion to determine whether a triple is a spurious-negative triple. Spurious-negative samples provide incorrect supervisory signals to the model, thereby misleading the training process and reducing its prediction accuracy. Therefore, in the task of quality evaluation for cybersecurity knowledge graphs, it is particularly important to mitigate the impact of spurious-negative samples during the sampling process in model training.
In this paper, we propose a spurious-negative sample augmentation-based quality evaluation method for cybersecurity KGs (SNAQE). SNAQE divides the sampled negative triples into critical spurious-negative triples and true-negative triples through a multi-scale spurious-negative triple detection module. Subsequently, the adaptive mixup based on the attention mechanism module selects suitable mixup targets for each spurious-negative triple. This adaptive mixup strategy can automatically adjust the mixing ratio based on the features between samples, thereby generating more reasonable training samples and enhancing the performance of the model and generalization ability. Through extensive comparative experiments on both general-domain datasets and cybersecurity datasets, we demonstrate the superiority of our KG quality evaluation model. To summarize, the key contributions of this study are as follows:
- (1)
- Key Technical Contributions
- We designed a multi-scale spurious-negative triple detection method, which improves the model’s ability to distinguish spurious-negative samples by performing multi-scale scoring on negatively sampled triples.
- We proposed an adaptive mixup based on the attention mechanism, which generates more reasonable training samples through adaptive mixing between samples, thereby enhancing the model’s accuracy and F1 score in the knowledge graph quality evaluation task.
- (2)
- Additional Contributions
- Through extensive experiments, we demonstrated the effectiveness of our model and its key components in the knowledge graph quality evaluation task, achieving the current State-of-the-Art results.
The remainder of the paper is structured as follows: Section 2 reviews existing research on KG quality assessment and explores methods for negative sampling in KGs. Section 3 offers a comprehensive overview of the proposed model. Section 4 presents the experimental outcomes and provides an in-depth analysis and discussion of the results. Finally, Section 5 concludes the paper and suggests potential avenues for future work.
2. Related Work
With the widespread application of knowledge graphs in fields such as semantic search, intelligent recommendation, and knowledge reasoning, the importance of knowledge graph quality evaluation has become increasingly prominent [9,10,11]. However, as the scale of knowledge graphs continues to expand, effectively evaluating their quality has emerged as a critical challenge. Against this backdrop, negative sampling techniques play a crucial role in the quality evaluation of knowledge graphs. This section reviews related work in the fields of knowledge graph quality evaluation and negative sampling methods.
2.1. KG Quality Evaluation
Conventional approaches to KG quality evaluation typically rely on manual inspection and rule formulation, which have limitations when dealing with large-scale data and complex relationships. In recent years, researchers have started investigating the application of machine-learning and deep-learning techniques to automate KG quality evaluation, with the goal of enhancing the effectiveness and accuracy of evaluations, thereby better accommodating the complexities and scale of large datasets. Xie et al. [12] introduced CKRL, a KG quality evaluation model based on translational distance that effectively utilizes the global structural features for error detection. Through comprehensive experiments, the capability of the model to assess the confidence of triples by leveraging structural details in KG quality evaluation tasks was validated. Inspired by the successful application of automated machine learning (AutoML) technology, Zhang et al. [13] proposed AutoSF, an approach that automatically designs scoring functions suitable for different KGs through AutoML. This method constructs a search space by defining a unified representation for scoring functions and proposes a greedy algorithm to optimize the search process. Experimental results show that AutoSF outperforms manually designed scoring functions in evaluating KG quality, highlighting the benefits of automating the design of scoring functions. Jia et al. [14] introduced a model for measuring the confidence of triples, utilizing a cross neural network architecture that integrates the internal semantic properties of triples with global reasoning context. The model achieves confidence measurement and fusion at the entity, relation, and global layers. Experimental results indicate that the model achieved good evaluation accuracy in KG error detection tasks. Bougiatiotis et al. [15] introduced the PRGE method, which combines path ranking scores of triples with graph embedding frameworks, making the generated embeddings more robust to noise in KGs and improving KG quality evaluation performance across multiple datasets.
Table 1 provides a summary of the accuracy and F1 scores of different models in assessing the quality of KGs using the FB15K dataset. Among these, the DistMult model [13,16] cleverly applies the bilinear function to deeply explore the intrinsic relationships between entities and relations, achieving a quality evaluation accuracy of 0.808. The ComplEx model [13,17], which uses complex-valued vectors to represent entities and relations, enhances the model’s accuracy in handling asymmetric relations and achieves an accuracy of 0.818 on the FB15K dataset. However, when faced with challenges in modeling complex relationships such as one-to-many, many-to-one, and many-to-many, the TransE model exhibits certain limitations. It struggles to fully capture the diversity and complexity of relations, leading to poor performance in quality evaluation for complex graphs. Subsequently, researchers introduced relation-specific parameters and developed models like TransD, TransR, and TransH, which led to notable improvements in the performance of evaluating KG quality [14,18,19]. Based on the Tucker model [20], Li et al. introduced the AttTucker model, which incorporates multi-head attention mechanisms and models the KG using a central tensor along with three-factor matrices, resulting in notable enhancements on the FB15K dataset.

Table 1.
Performance comparison of various models on the FB15K dataset.
2.2. KG Negative Sampling
During the KG quality evaluation process, existing negative sampling techniques can generally be divided into two categories: techniques that disregard spurious-negative triples and those that consider spurious-negative triples [22,23,24]. Negative sampling techniques that disregard spurious-negative triples rely on the closed-world assumption, where all sampled triples are considered negative. Typical methods include Uniform Sampling [6], Self-Adversarial Sampling [25], RW-SANS [26], and NSCaching [27]. Among these, Uniform Sampling is the most basic negative sampling technique, where negative triples are sampled uniformly from the distribution. Self-Adversarial Sampling allocates varying degrees of importance to individual negative triples, thereby improving the model’s learning performance. It introduces an adversarial mechanism when generating negative samples, modifying their sampling significance according to their scores, allowing the model to prioritize more challenging negative samples. RW-SANS samples negative triples from the graph structure through random walks, increasing the diversity and relevance of the sampled instances. To further improve sampling efficiency, NSCaching maintains a cache during the sampling process to store potential high-quality negative sample candidates, thereby reducing the computational cost of generating negative samples during each training iteration and enhancing both sampling efficiency and quality.
Conversely, techniques that consider spurious-negative triples aim to minimize the probability of incorrectly selecting spurious-negative samples during the sampling process. Typical techniques include CANS [28] and Bernoulli sampling [18]. CANS is a negative sampling method designed for KG embedding tasks, specifically addressing the issue of false-negative samples. By incorporating common-sense knowledge and the characteristics of complex relationships, CANS enhances the accuracy of negative sampling and reduces the probability of spurious-negative samples. Bernoulli sampling is a classic negative sampling method in KG embedding models, aimed at addressing the data distribution imbalance caused by complex relationships in KGs. By considering different relation patterns, Bernoulli sampling adjusts the sampling probability, effectively improving the quality of negative samples and enhancing the model’s learning performance.
Compared to traditional negative sampling techniques, the negative sampling strategy introduced in this study offers significant advantages in regard to several aspects. Firstly, traditional negative sampling methods are often search-based and require screening through a large number of unlabeled negative samples to select high-quality ones, thus increasing computational costs, and this process may not guarantee the diversity and difficulty of the negative samples. Secondly, methods like CANS rely on external common-sense information, which not only incurs high manual costs but also depends on the specific task, making it difficult to generalize. Although Bernoulli sampling avoids dependence on external information, it employs a fixed sampling scheme and lacks dynamic adjustment capability.
In contrast, the negative sampling strategy proposed in this paper does not merely avoid sampling false negatives. Instead, by introducing a spurious-negative sample optimization strategy, the sampled negative samples are optimized into high-quality training samples. This method dynamically filters and adjusts the mixing weights between negative samples during the sampling process, ensuring that the negative samples used in model training are not only representative but also provide effective supervisory signals. This strategy enhances the model’s discriminative ability and robustness against noise, thereby improving performance in the quality evaluation task.
In summary, existing methods for knowledge graph quality evaluation and negative sampling techniques have made significant progress but still face certain challenges. This study aims to enhance the accuracy and robustness of knowledge graph quality evaluation by introducing an optimization strategy for spurious-negative triples that transforms sampled negative samples into high-quality training samples.
3. Methods
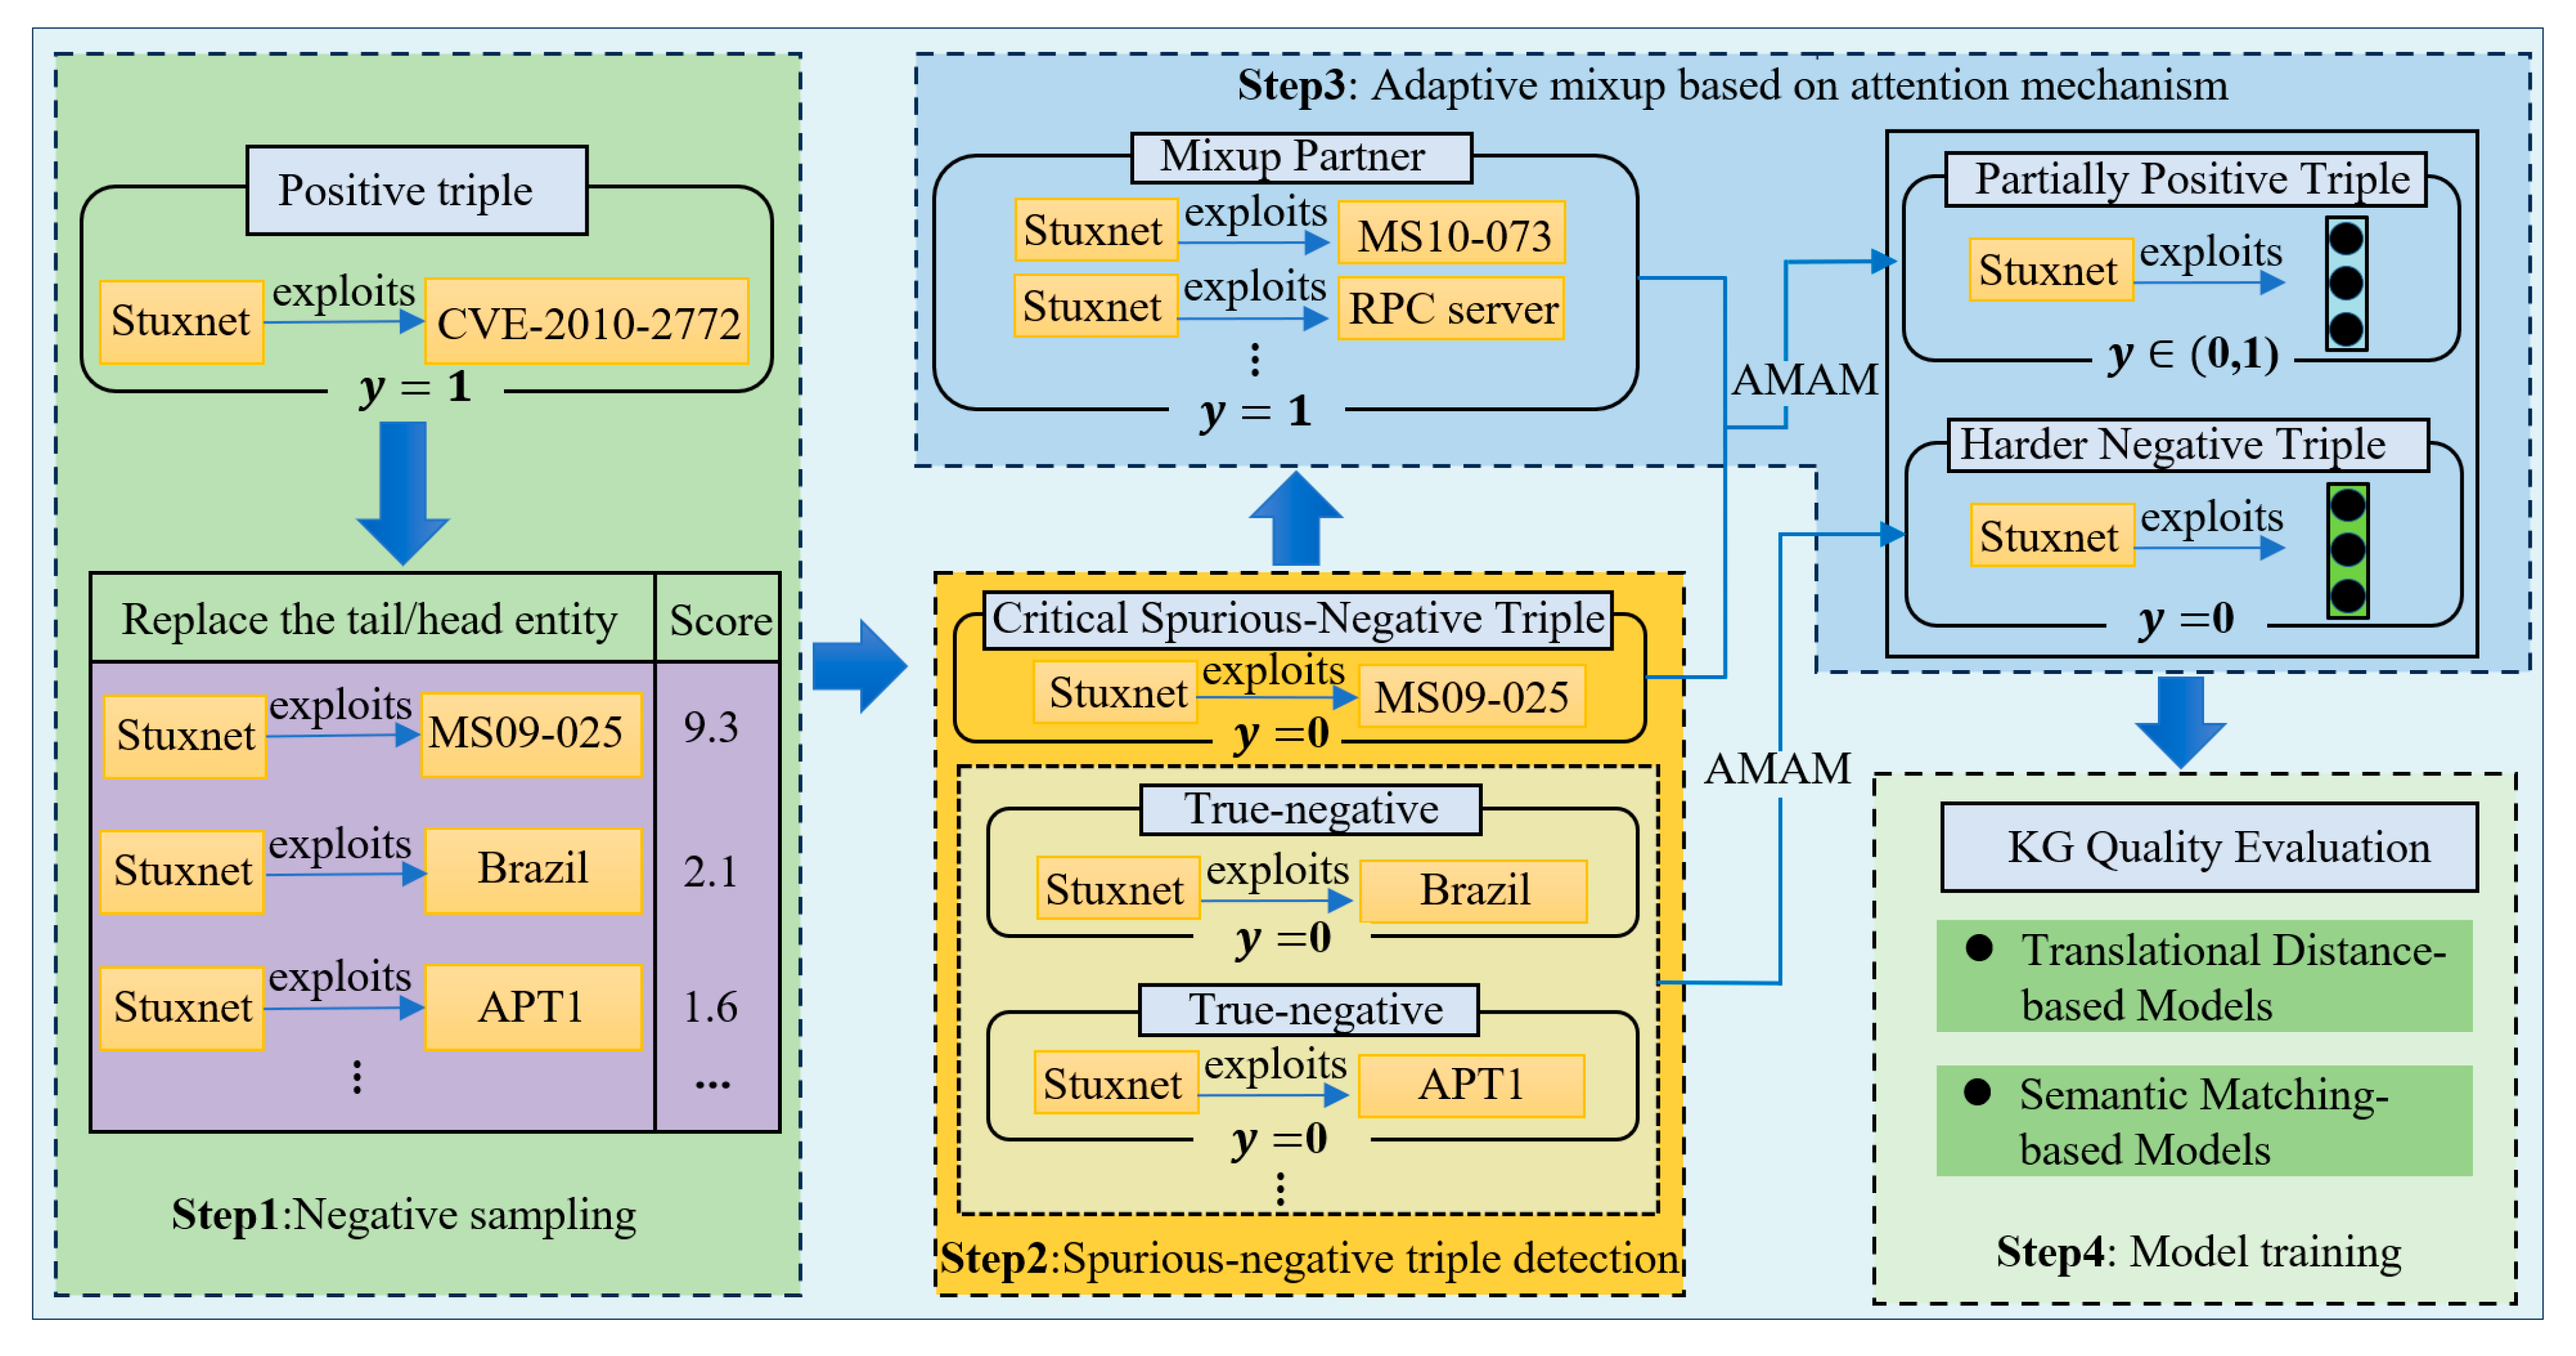
In this section, we propose a spurious-negative sample augmentation-based quality evaluation method for KGs. This method effectively identifies and handles spurious-negative samples through multi-scale spurious-negative triple detection and adaptive mixup based on attention mechanisms, thereby providing more precise supervisory signals during model training. Figure 1 illustrates the structure of the SNAQE model. We divided the SNAQE model into four main steps. Step 1 represents Negative Sampling, where negative triples are constructed by replacing either the head entity or the tail entity. Step 2 involves Spurious-Negative Triple Detection, in which negative triples are classified into spurious-negative triples and true-negative triples based on their multi-scale scores. Step 3 is the Adaptive Mixup Based on the Attention Mechanism, where suitable mixup partners are selected for each spurious-negative triple to achieve more precise sample generation. Step 4 is the Model Training phase, during which multiple scoring functions are utilized to train the model.
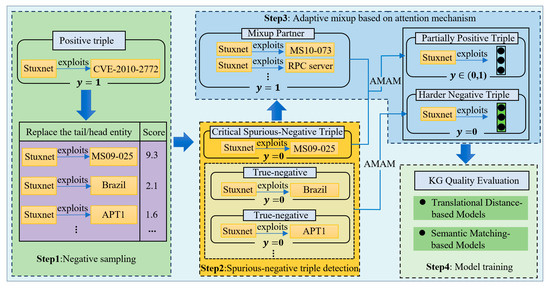
Figure 1.
The structure of the SNAQE.
3.1. Multi-Scale Spurious-Negative Triple Detection
Formally, a knowledge graph can be represented as follows:
where is the set of entities, is the set of relations, and is the set of triples. Each triple can be represented as , where , , and represent the head entity, relation, and tail entity of the triple, respectively. For each triple , the corresponding k-dimensional embedding is represented as . The labeled dataset is denoted as , where represents the number of positive samples labeled as , and represents the number of negative samples labeled as . Typically, equals the size of the factual set, i.e., . As negative triples are absent from the KG, they are typically generated through a negative sampling approach.
During the process of negative sampling, we refer to the method in [18], where negative triples, , are constructed by replacing or as follows:
Based on the closed-world assumption, in KG-related tasks, most negative sampling techniques consider all triples that do not exist as negative instances. Therefore, the labeled triple dataset, , can be represented as follows:
In this paper, we categorize the triples obtained through negative sampling into two groups based on the features of the triples: critical spurious-negative triples and true-negative triples. Critical spurious-negative triples are false-negative samples with scores that are nearly identical to those of positive samples. Considering that negative sampling in KGs involves replacing either the or of a triple, while the other components of the triple remain unchanged, we refer to the unchanged components as . Therefore, we can define as follows:
The collection of positive samples where and serves as the primitive can be expressed as follows:
The set of positive triples, , is expressed as follows:
To enhance the ability to identify critical spurious-negative samples, we introduce a local neighborhood score, which is measured based on the neighborhood structure of the entities in the KG. Specifically, for a given head entity, , or tail entity, , we define its local neighborhood, or , as the collection of all entities and relations directly connected to it.
For a negative triple to be detected, we first calculate the local neighborhood score of the head entity, , and the tail entity, . The local neighborhood score of is defined as follows:
Similarly, we can calculate the local neighborhood score of the tail entity, , denoted as . These local scores will be used to enhance the detection of spurious-negative samples, especially for relation types with complex local structures.
Based on this, we calculate the multi-scale spurious-negative sample score, , for spurious-negative samples:
where is the global score, which is the score of the triple given by the KG embedding model; and are the local neighborhood scores of the head entity and tail entity; and is a hyperparameter controlling the weight between the global and local scores.
Next, we classify the negative triples with scores that closely resemble those of the positive samples under the same primitive as critical spurious-negative triples, denoted as . can be defined as follows:
where denotes the set of scores for positive samples that have the identical primitive; and represent the minimum and mean values of , respectively; and is a hyperparameter that controls the estimation range during training.
Generally, when the number of elements in the positive triple set, , with the same primitive is low, the probability of generating spurious-negative triples from this primitive is also low. Therefore, a threshold, , is defined to determine whether to derive from :
where is the set of true-negative samples.
The algorithmic process for multi-scale spurious-negative triple detection is detailed in Algorithm 1.
| Algorithm 1. Multi-Scale Spurious-Negative Triple Detection |
| Input Knowledge graph, ; embedding dimension, d; scoring function, f; threshold, τ. Output: Spurious-negative triple set, Tcsn, and true-negative triple set, . 1: Initialize the embedding vectors of entity set, E, and relation set, R. 2: Generate the negative triple set, TN: |
3.2. Adaptive Mixup Based on Attention Mechanism (AMAM)
In the negative sampling process, directly labeling spurious-negative triples as positive () would provide the model with incorrect supervision signals, which could negatively impact the model’s training performance. To mitigate the interference caused by high-quality negative triples during model training, and building upon research in mixup techniques [29], we propose an attention mechanism-based adaptive mixup method. This method selects appropriate mixing partners for each negative sample triple to generate high-quality triples that encapsulate rich information.
First, we construct a potential positive set () for each distinct primitive. During the model training process, is updated. The set includes the positive triples that are close to the model’s current decision threshold.
Essentially, critical spurious-negative triples, , have a high probability of being positive samples but are incorrectly labeled as negative samples. In this paper, we randomly select mixing partners from for the critical spurious-negative triples and use an attention mechanism to construct partially positive triples. These partially positive triples provide more accurate supervision signals to the model. Not only do they reduce the negative impact of spurious-negative triples on model training, but they also enhance the generalization ability of the model to some extent.
Moreover, for the true-negative triples, , we randomly select real negative triples with the same primitive as mixing partners, thereby constructing higher-quality negative samples. It is worth noting that, as the construction of negative triples is performed under the same primitive, the true mixing occurs between the candidate entities and their corresponding counterparts. Let and represent the entities in the negative triples and their corresponding mixing partners. The range of mixing partners for negative triples can be represented as follows:
In the mixing operation, to enhance the rationality and flexibility of the mixing process, we combine the attention mechanism to dynamically adjust the mixing weights. First, for each negative sampled triple and the candidate positive or negative samples, we construct the , , and matrices:
For a spurious-negative sample, , and each candidate sample, (where ), we compute the similarity, , using the dot product of and :
where is the scaling factor used to prevent the dot product from becoming too large and affecting gradient propagation.
After calculating the similarity, , we normalize the similarity using the softmax function to obtain the attention weights, :
Using the calculated attention weights, , we combine the multiple candidate samples to generate the new sample embedding, , and label, :
This adaptive mixing strategy reasonably allocates the weights between samples through the attention mechanism, making the mixing process more flexible. Through adaptive mixing, the model can generate partially positive samples and higher-quality negative samples, thereby providing more precise supervision signals for the training process. This significantly enhances the performance of the model in the quality evaluation task.
3.3. Model Training
Throughout the training process, to ensure that our model can comprehensively and effectively capture the rich information and complex relationships embedded in the KG, we utilize various scoring functions from knowledge representation learning to train the model, including ComplEx, DistMult, TransE, and RotatE, as shown in Table 2.
Table 2.
Scoring functions, parameters, and time complexity for different models.
The SNAQE model, employing various scoring functions, is referred to as SNAQE-ComplEx, SNAQE-DistMult, SNAQE-TransE, and SNAQE-RotatE. It also incorporates a self-adversarial negative sampling strategy for loss calculation and model optimization [25]:
where represents the overall count of negative samples, refers to the sigmoid function, and denotes the fixed margin. The self-adversarial weight, , for the negative triple is computed as follows:
where denotes the sampling temperature.
4. Results and Discussion
This section evaluates the effectiveness of the SNAQE model on general-domain datasets through detailed comparative experiments, while also examining its quality assessment performance on cybersecurity-domain datasets.
4.1. Dataset Description
We first evaluated the performance of our model on the widely used general-domain datasets, FB15K and WN18, to assess its robustness and scalability across different datasets. Subsequently, the performance of the model was tested on the cybersecurity dataset CS13K. Table 3 summarizes the dataset statistics.
Table 3.
Statistical characteristics of the datasets.
- (1)
- FB15K [30]: This is a general-domain KG dataset that includes 14,951 entities and 1345 types of relations. The dataset’s characteristics include its large scale and rich set of knowledge facts.
- (2)
- WN18 [7]: This dataset contains 18 relation types and 40,943 entities. It is a subset extracted from the WordNet dataset and is widely used in the field of vocabulary relation inference in KGs.
- (3)
- CS13K [31]: This is a cybersecurity KG dataset that includes 12 relation types, 4494 entities, and 13,027 triples.
4.2. Experimental Settings and Evaluating Metrics
During the KG quality evaluation, triples are categorized according to their final predicted probability, . When , the model classifies the triple as a positive sample; when , it classifies the triple as a negative sample. The evaluation metrics used are F1 score and accuracy. Table 4 presents the main parameter settings of the SNAQE model.
where (true positive) refers to the positive examples correctly classified as positive, (false negative) refers to the positive examples incorrectly classified as negative, (false positive) refers to the negative examples incorrectly classified as positive, and (true negative) refers to the negative examples correctly classified as negative.
Table 4.
The key parameter configurations of the SNAQE model.
4.3. Experimental Results and Analysis
4.3.1. Performance of the Model on General-Domain KG Datasets
Within this part of the study, we first evaluated the performance of the SNAQE model on the FB15K and WN18 datasets and compared it with existing negative sampling methods, including Uniform Sampling, Self-Adversarial Sampling, RW-SANS, NSCaching, CANS, and Bernoulli Sampling. The results of the experiments are presented in Table 5, Table 6, Table 7 and Table 8.
Table 5.
Quality evaluation performance of different negative sampling strategies on TransE.
Table 6.
Quality evaluation performance of different negative sampling strategies on RotatE.
Table 7.
Quality evaluation performance of different negative sampling strategies on DistMult.
Table 8.
Quality evaluation performance of different negative sampling strategies on ComplEx.
On the FB15K dataset, the SNAQE model demonstrates significant performance improvements across various Translational Distance-Based Models and Semantic Matching-Based Models. Specifically, SNAQE-TransE achieves accuracy and F1-score values of 0.916 and 0.919, respectively, showing an approximately 1% gain compared to the second-best method, CANS-TransE. This indicates that the SNAQE method enhances the model’s ability to represent triples by effectively handling spurious-negative samples. The SNAQE-RotatE model demonstrates exceptional performance, attaining an F1 score of 0.969 on the FB15K dataset, significantly surpassing that of other methods. This demonstrates that, in Translational Distance-Based Models, the SNAQE-based model can further improve the KG evaluation performance by effectively identifying spurious-negative samples and constructing high-quality training samples. In Semantic Matching-Based Models, SNAQE-DistMult and SNAQE-ComplEx achieve F1 scores of 0.858 and 0.917, respectively, outperforming other negative sampling methods using the same scoring functions. For instance, SNAQE-ComplEx improves accuracy by about 3.5% compared to the second-best method, NSCaching-ComplEx. The SNAQE model also demonstrates excellent performance when applied to the WN18 dataset. SNAQE-RotatE achieves an F1 score of 0.948, exceeding CANS-RotatE’s 0.932. Compared to other negative sampling methods, SNAQE-DistMult and SNAQE-ComplEx also show remarkable enhancements in both accuracy and F1 score, highlighting the superiority of the SNAQE method.
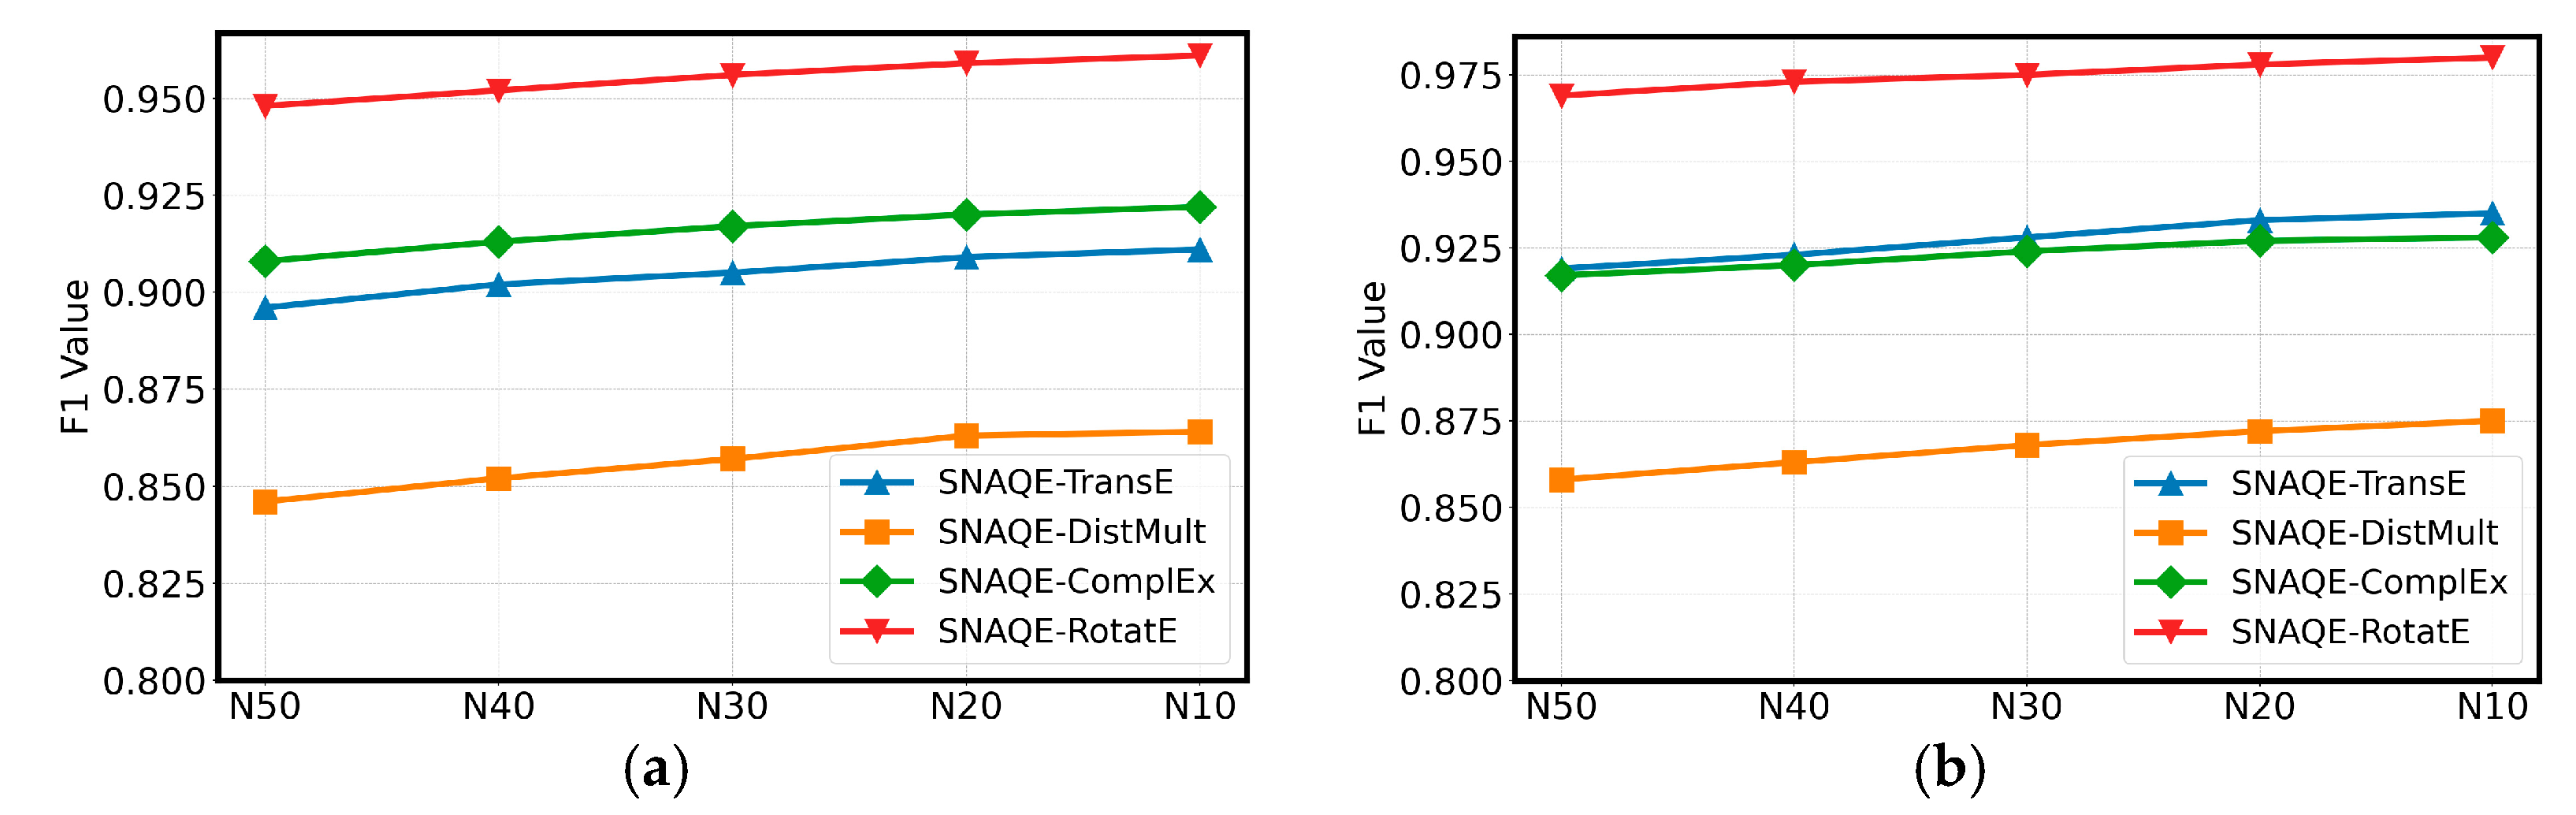
Additionally, we examined how the proportion of noise within triples influences the effectiveness of the SNAQE model. We evaluated the F1 scores on the FB15K and WN18 datasets, with the results shown in Figure 2. From the experimental data, it can be observed that on the FB15K dataset, as the noise triple ratio gradually decreases from 50% (N50) to 10% (N10), the F1 score of the SNAQE-based models remains relatively stable. This indicates that the model demonstrates strong robustness when handling varying noise ratios, confirming the advantage of the adaptive mixup based on attention mechanism in reducing the interference from noise triples, alleviating the negative impact of noise disturbances, and thus improving the overall model performance. For the WN18 dataset, the SNAQE model also performs exceptionally well across different noise ratios, further validating that the model can maintain stable quality evaluation performance even under varying noise conditions.
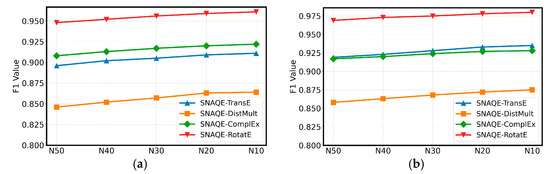
Figure 2.
Influence of noise triple ratio on model performance: (a) FB15K and (b) WN18.
Furthermore, a visualization of the quality evaluation outcomes of the SNAQE-RotatE model using the FB15K dataset was conducted to further confirm its effectiveness in differentiating positive and negative triples. Figure 3 shows the confidence scores for positive and negative triples evaluated by the SNAQE-RotatE model with the FB15K dataset. The visualization reveals that the confidence scores for positive triples predominantly fall within the range from 0.85 to 1.0, whereas those for negative triples are primarily distributed between 0 and 0.1. This distribution substantiates the capability of SNAQE-based models in regard to the quality assessment of KGs in general domains.
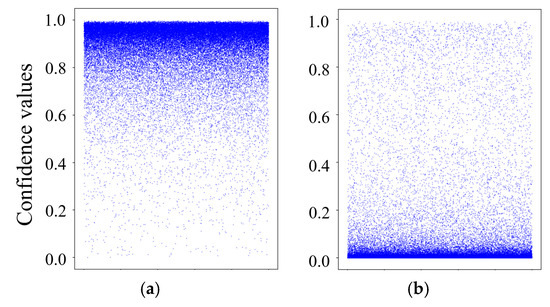
Figure 3.
Display of quality evaluation outcomes: (a) positive triples and (b) negative triples.
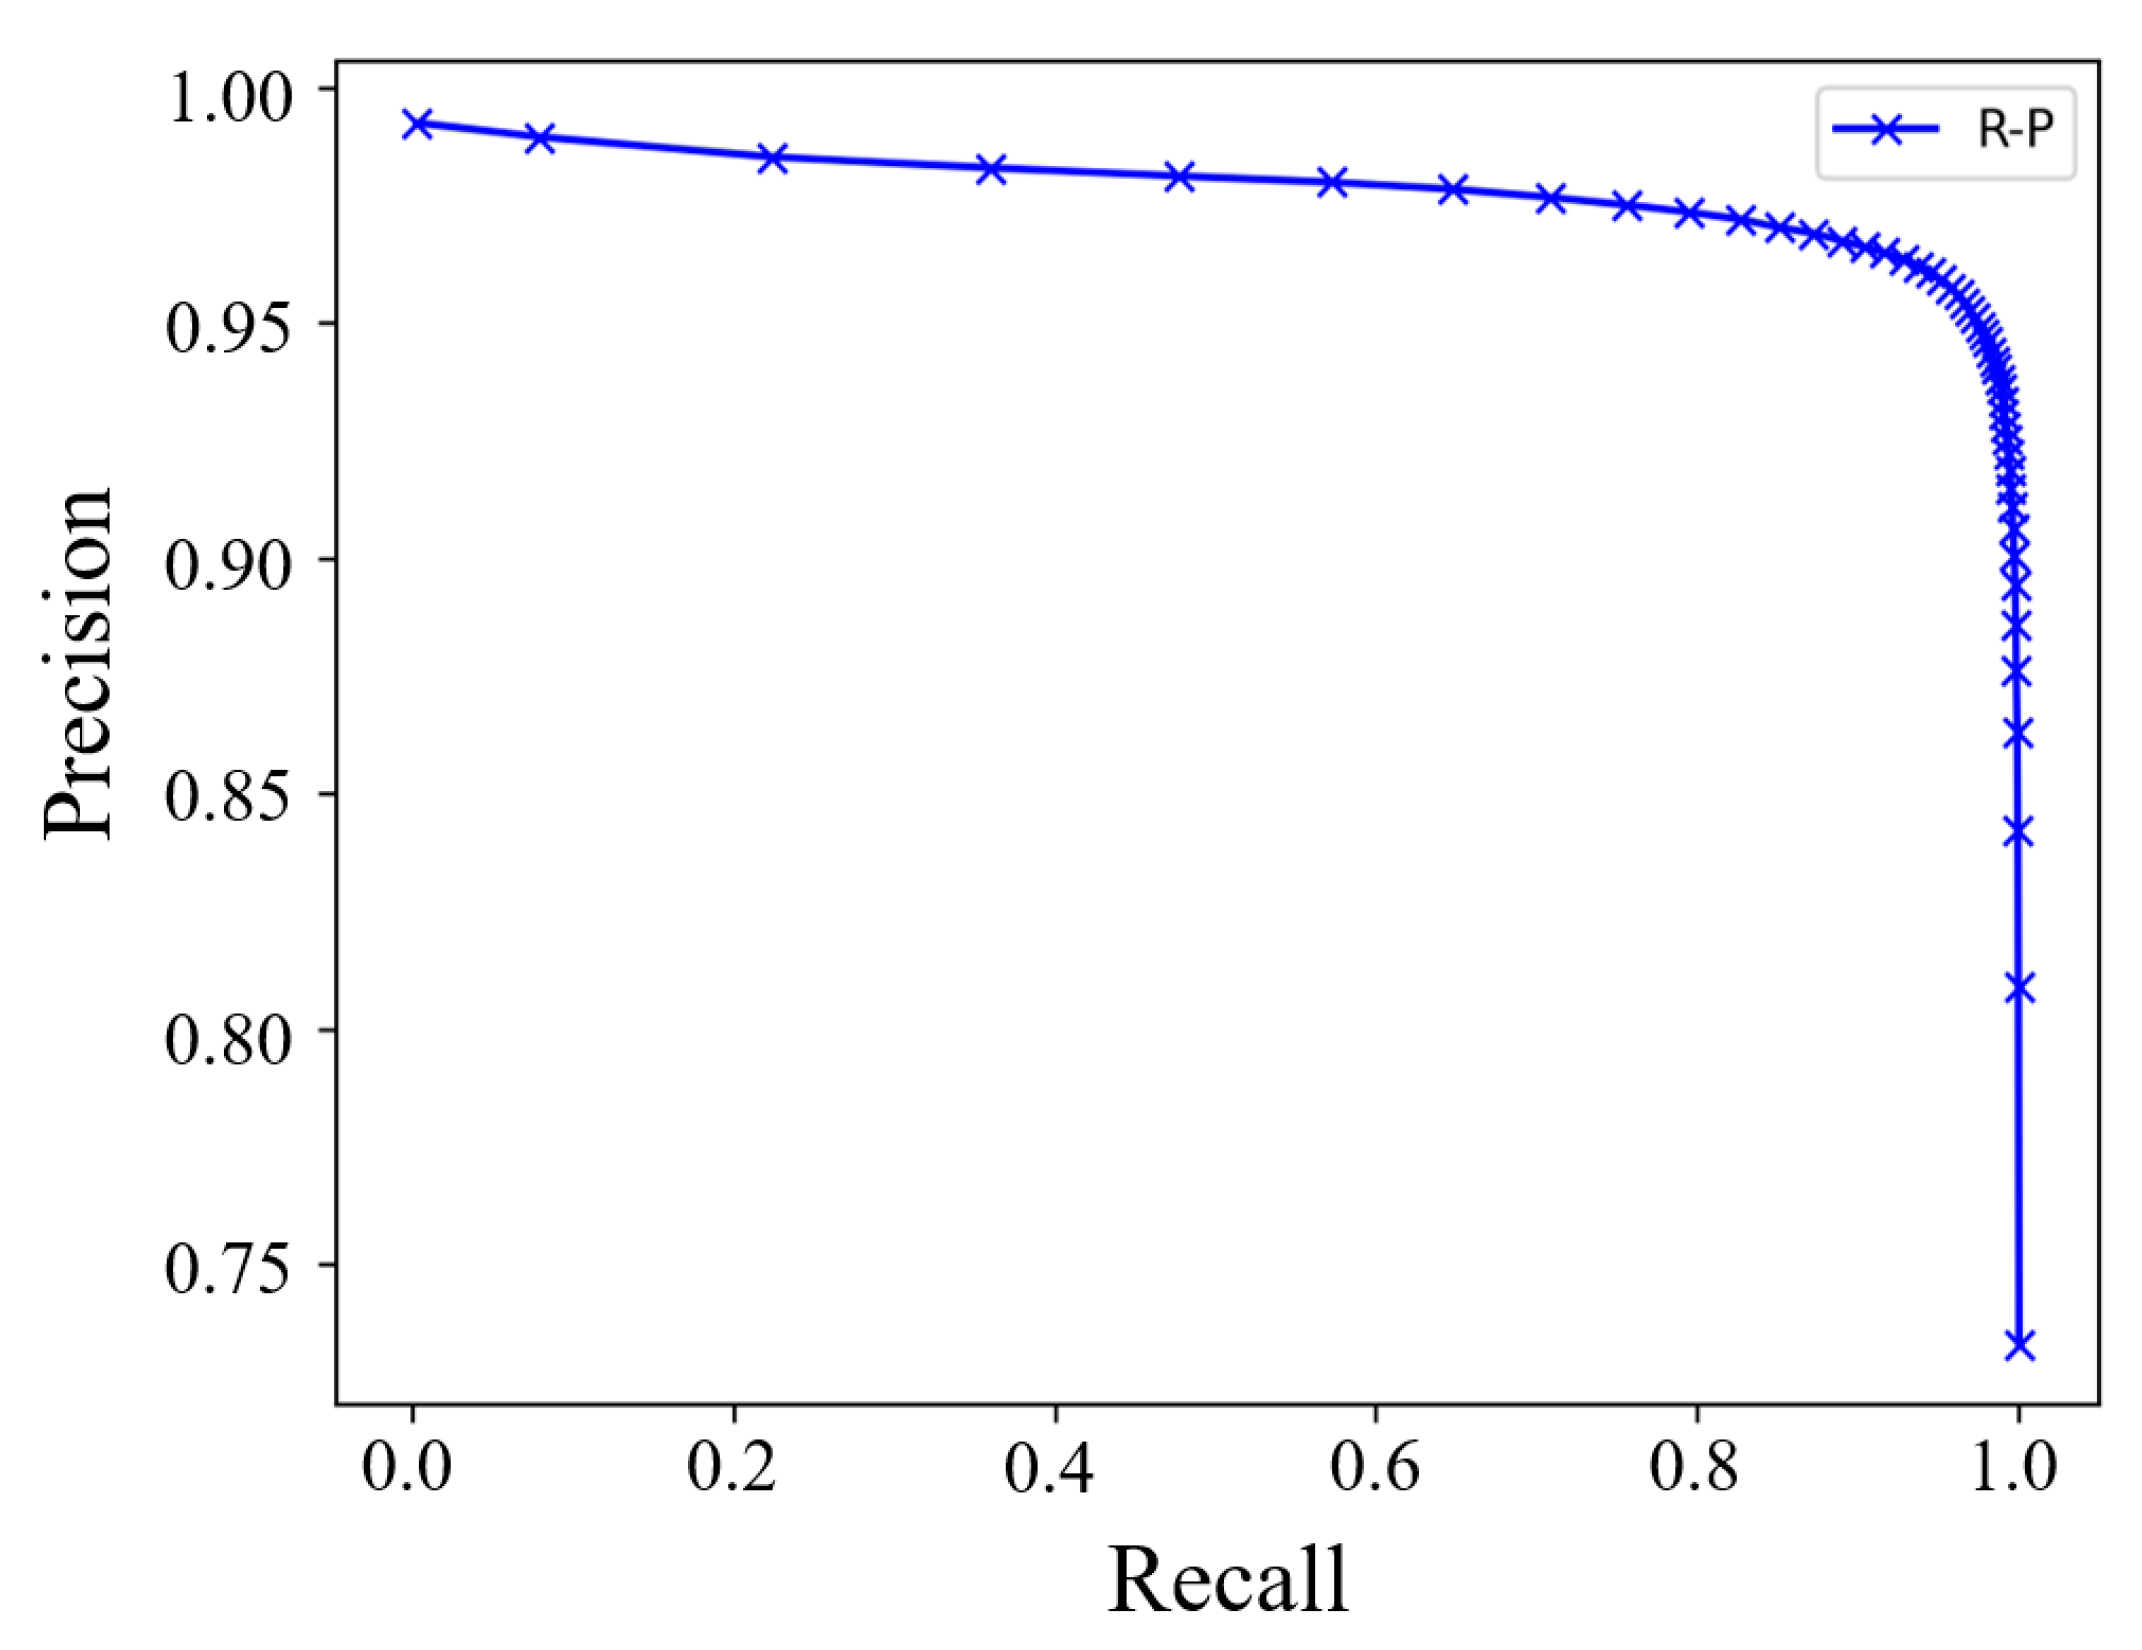
To validate the model’s ability to balance the identification and classification of positive and negative triples in the quality evaluation task, we also analyzed the recall and precision of the SNAQE model during quality evaluation. Figure 4 presents the recall–precision curve of the SNAQE-RotatE model on the FB15K dataset.

Figure 4.
Recall–precision curve.
As depicted in Figure 4, for recall values under 0.85, the model maintains a high and steady level of precision. However, once the recall exceeds 0.85 and continues to rise, the precision starts to drop rapidly. This phenomenon may arise from the model increasingly misclassifying negative triples as positive ones at higher recall levels, increasing the error rate and thus lowering the overall precision. It is noteworthy that when the recall reaches approximately 0.96, the model achieves an optimal balance, maintaining a high precision while ensuring a high recall. This observation indicates that the SNAQE-RotatE model can effectively control noise interference on the FB15K dataset and achieve a good balance between recall and precision, further confirming the effectiveness and reliability of the method in quality evaluation tasks for general-domain KGs.
4.3.2. Performance of the Model on Cybersecurity Dataset
We also evaluated the performance of the PNEQA-based model on the cybersecurity KG dataset to assess its effectiveness in a specific domain. The outcomes, shown in Table 9 and Table 10, demonstrate that the SNAQE model outperforms other negative sampling methods in regard to both accuracy and F1 score.
Table 9.
Evaluation results of different negative sampling methods on Translational Distance-Based Models.
Table 10.
Evaluation results of different negative sampling methods on Semantic Matching-Based Models.
In Translational Distance-Based Models, when the influence of spurious-negative triples was ignored, the best F1 score of 0.911 was achieved by the NSCaching-RotatE model. However, when spurious-negative triples are considered, the model’s quality assessment performance improves noticeably. This demonstrates that spurious-negative triples play a significant role in the quality assessment process. Notably, our proposed SNAQE-RotatE achieved an F1 score of 0.928, which is significantly higher than other models.
In Semantic Matching-Based Models, similar results were observed. Compared to other models, the SNAQE-ComplEx model achieved the best evaluation results, validating the effectiveness and superiority of SNAQE-based models in assessing the quality of cybersecurity KGs.
To further analyze the performance of the SNAQE-based model in quality evaluations across different relation types, we evaluated individual relation categories within the CS13K dataset and reported the model’s precision, recall, and F1 score. Table 11 presents the quality evaluation results of the SNAQE-RotatE model for various relation types.
Table 11.
Assessment outcomes for different relation categories on CS13K dataset.
As shown in Table 11, the SNAQE-RotatE model demonstrates varying levels of performance across distinct categories of relations. For instance, the model achieves higher recall and precision for relations like “hasAttackLocation” and “hasVulnerability”, indicating good identification capability for these relations. In contrast, relations like “indicates” and “belongTo” exhibit relatively lower precision and recall values. This variation can be influenced by several factors. First, there is an imbalance in the number of data samples for different relation types. More common relations, which occupy a larger proportion of the training data, allow the model to learn their features more thoroughly, resulting in higher precision and recall. Conversely, for relation types with fewer samples, the model’s recognition ability is limited, leading to lower evaluation metrics. Second, the semantic complexity and feature differences between relation types also affect the performance of the model. Some relations may have clear distinguishing features, enabling the model to accurately capture and differentiate their semantics, while others may be semantically complex or share a higher similarity, increasing the difficulty of recognition.
The quality evaluation for specific relation types further reveals the applicability of the SNAQE-based models in cybersecurity KGs. This analysis not only helps us understand the model’s limitations across various types of relations but also provides guidance for optimizing cybersecurity KGs.
4.4. Case Study
To validate the performance of the SNAQE model in quality assessment on the cybersecurity knowledge graph dataset CS13K, we conducted a detailed case study. In the experiment, we selected a primitive and analyzed how the model optimizes spurious-negative samples and enhances evaluation performance through comprehensive experiments and visualizations.
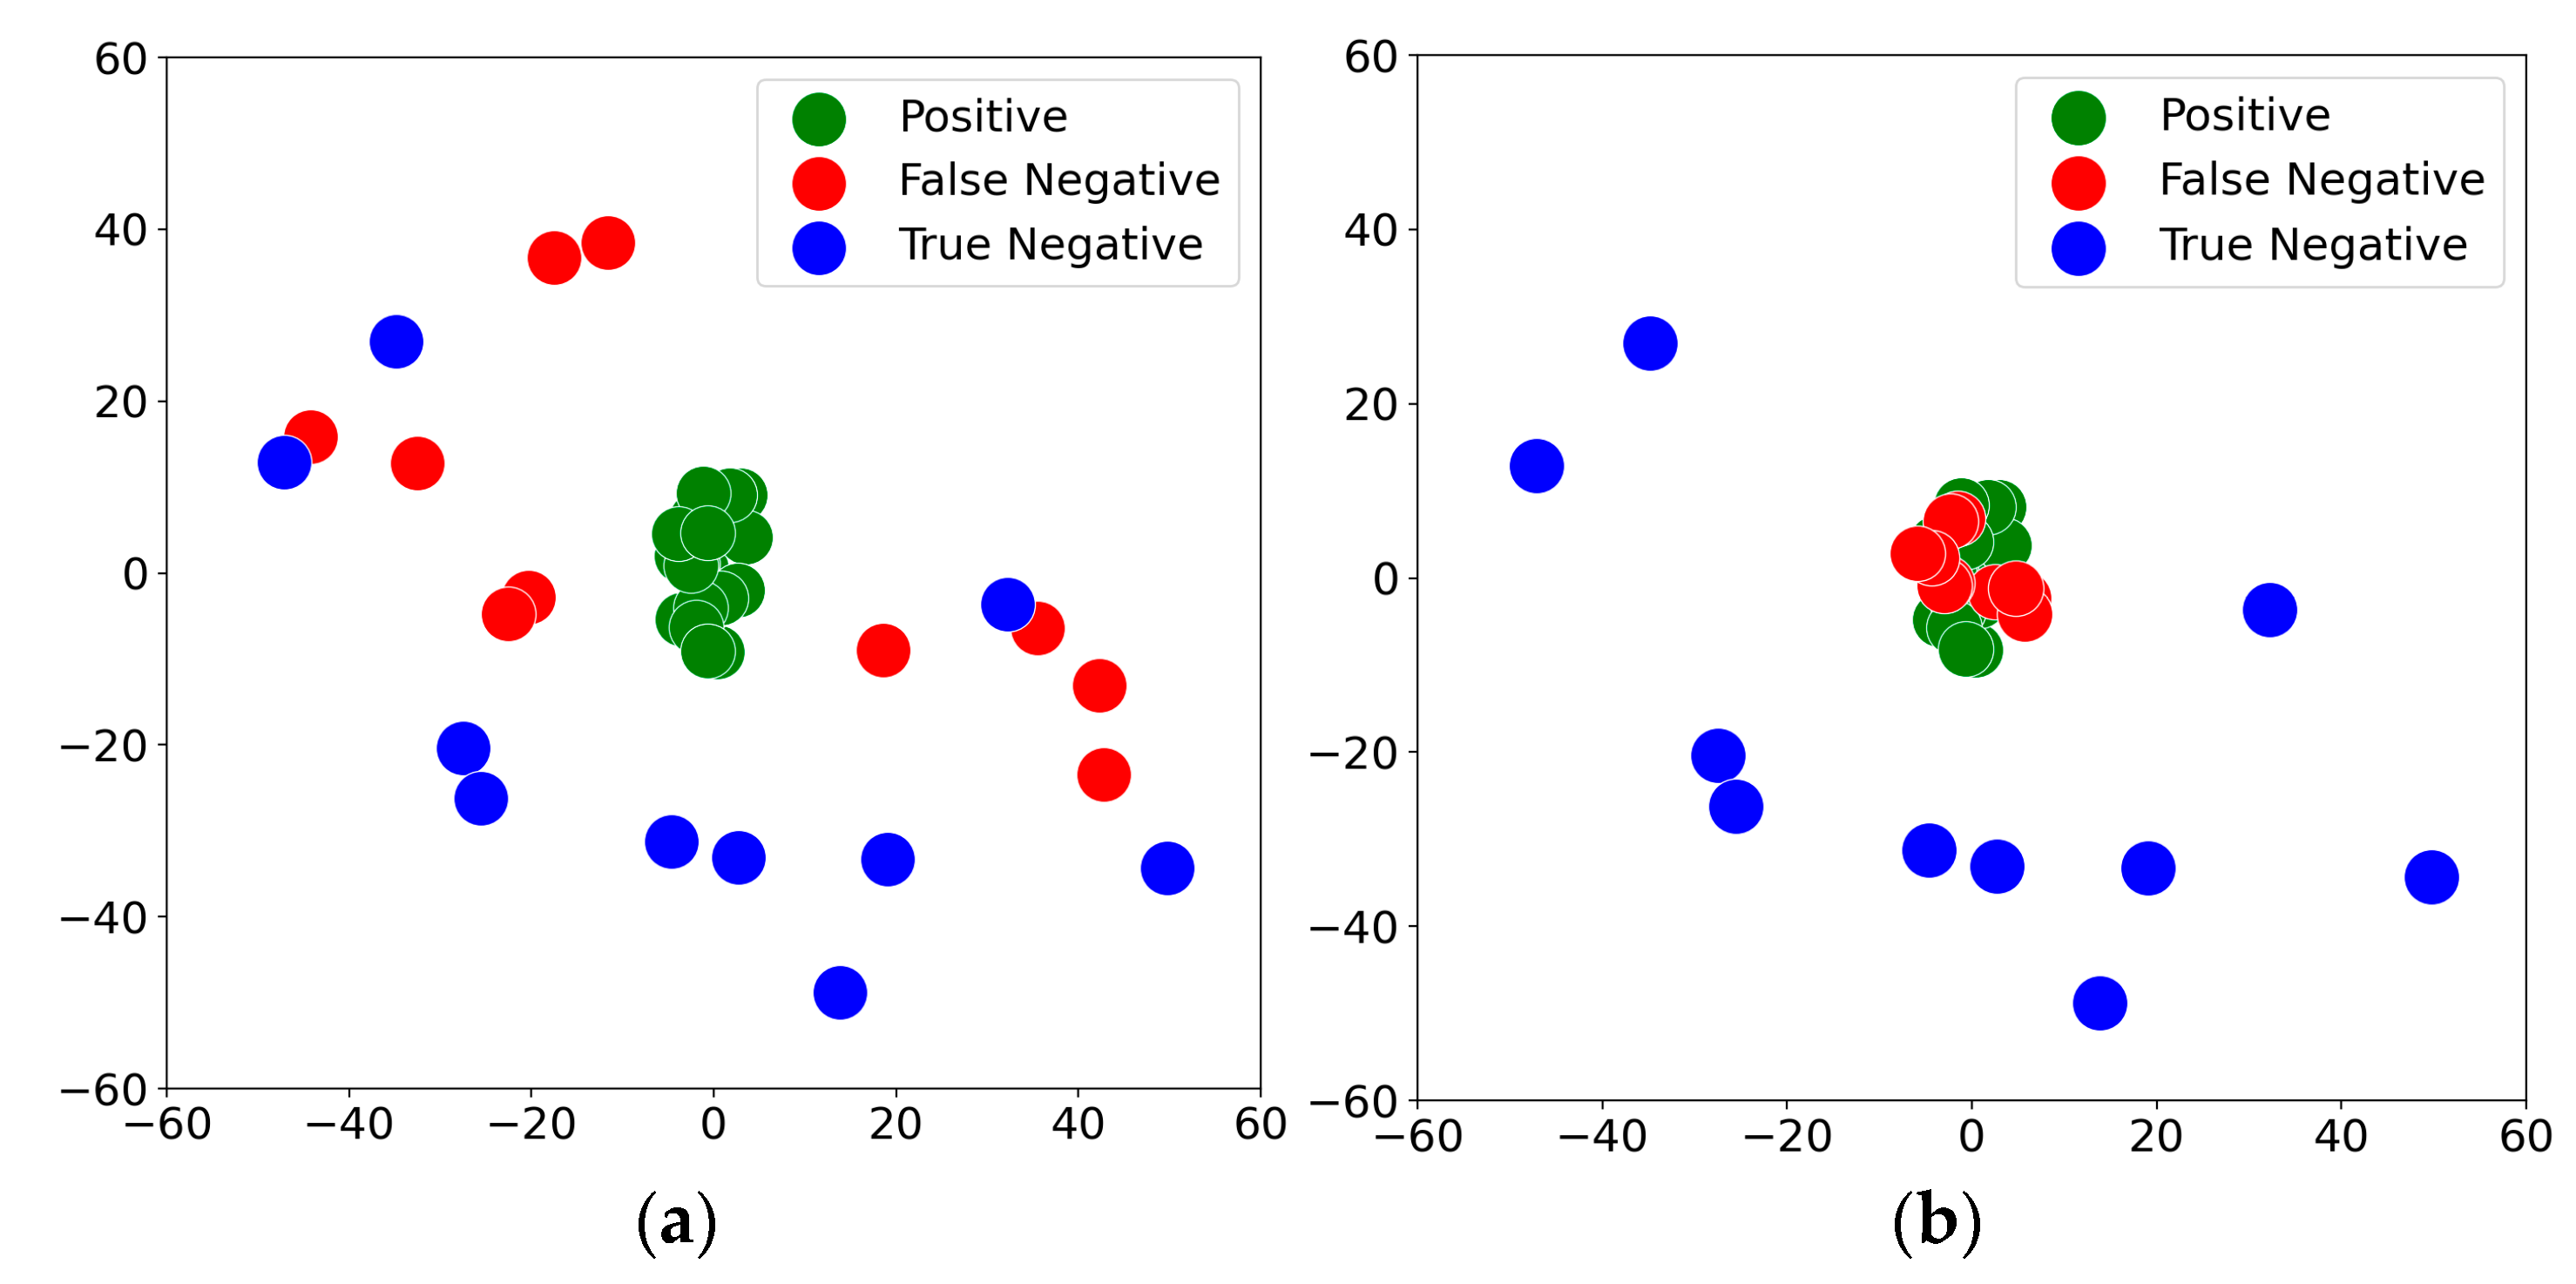
In the experiment, we randomly selected 20 positive triples from the training set, 10 spurious-negative triples, and 10 true-negative triples from the validation and test sets. The selected primitive , where “Stuxnet” is the head entity, and “exploits” is the relation. “Stuxnet” represents a typical network worm widely regarded as an advanced cyberattack tool targeting industrial control systems, while “Exploits” represent the relations between Stuxnet and the vulnerabilities or attack methods it utilizes during its propagation and attack process. We employed 2D t-SNE dimensionality reduction to map the high-dimensional tail entity embeddings into a two-dimensional space, aiming to verify the capability of the SNAQE model in identifying and optimizing spurious-negative samples. The results are shown in Figure 5, where Figure 5a represents the experimental results without spurious-negative triple detection, and Figure 5b represents the results with spurious-negative triple detection. A comparison of Figure 5a,b demonstrates that the SNAQE model effectively moves the embeddings of spurious-negative triples closer to the distribution region of positive triples while pushing true-negative triples farther from the positive distribution region. The analysis of tail entity embeddings under the specific primitive (Stuxnet, exploits) reveals that without spurious-negative triple detection, the model erroneously treats spurious-negative triples as true-negative triples, thereby affecting the training effectiveness to some extent. In contrast, with spurious-negative triple detection, the model shifts the embeddings of “false negatives” closer to the positive triple distribution region, thereby enhancing evaluation performance. The significant differences in embedding distributions indicate that the proposed SNAQE model effectively mitigates the adverse effects of spurious-negative samples on model training and improves the reliability and accuracy of knowledge graph quality evaluation.
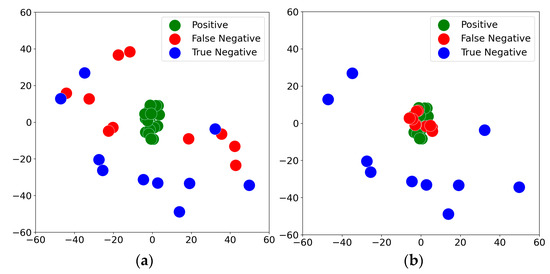
Figure 5.
Two-dimensional t-SNE visualization of tail entity embeddings for the same primitive: (a) w/o SNAQE and (b) SNAQE.
4.5. Ablation Study
To validate the contribution of each component in the SNAQE model, we conducted ablation studies to assess the impact of key components. Table 12 presents the experimental outcomes for the SNAQE-RotatE model.
Table 12.
Ablation study on the SNAQE model.
First, we evaluated the impact of ignoring spurious-negative triples (w/o SNT). When the labels of spurious-negative triples were directly assigned a value of 0, the performance of the model significantly decreased. For the FB15K dataset, omitting the SNT module led to a 3.6% reduction in the F1 score compared to the SNAQE-RotatE model; for the CS13K dataset, the F1 score dropped from 0.928 to 0.896. These results highlight the importance of identifying and optimizing spurious-negative triples. By specifically handling spurious-negative triples, the model can reduce the impact of noisy data and significantly improve F1 score and accuracy in quality evaluation tasks.
Next, we evaluated the contribution of local neighborhood information to the quality evaluation results. After removing local neighborhood information (w/o LocalN), the performance of the model declined. For the FB15K dataset, the accuracy dropped from 0.967 to 0.953, and the F1 score dropped from 0.969 to 0.955. On the CS13K dataset, the F1 score dropped from 0.928 to 0.915. These results demonstrate that the inclusion of local neighborhood information effectively enhances the performance of the model.
Additionally, we validated the impact of different mixing strategies in the adaptive mixup module based on the attention mechanism. We replaced the adaptive mixup strategy with a random mixing strategy (RandomM). The results showed that removing the attention-based adaptive mixup module led to a decrease in model performance. For the FB15K dataset, the F1 score dropped by 3.5%, and for the CS13K dataset, the F1 score dropped from 0.928 to 0.911. These results confirm that the attention-based adaptive mixup strategy can dynamically adjust the mixing weights according to the features of the samples, thereby improving the performance of the model in quality evaluation tasks.
5. Conclusions and Future Works
This paper proposes a spurious-negative sample augmentation-based method for quality evaluation of cybersecurity KGs. The method comprises two key modules: multi-scale spurious-negative triple detection and attention mechanism-based adaptive mixing. The multi-scale spurious-negative triple detection module effectively distinguishes spurious-negative triples from true-negative samples during the negative sampling process, thereby alleviating the noise issues caused by traditional negative sampling methods. The adaptive mixup module utilizes an attention mechanism to select appropriate mixup targets for each spurious-negative sample, generating more precise partial positive samples in the embedding space, thus further enhancing the model’s training effectiveness. Extensive experimental results demonstrate that the SNAQE model demonstrates excellent performance in both general and cybersecurity domain KG quality evaluations, significantly improving the accuracy and F1 score of the model. Notably, it achieves State-of-the-Art results on the FB15K dataset. Despite the notable progress achieved by SNAQE in KG quality evaluation, there is still potential for further enhancement. Future research could explore more diverse negative sampling strategies to improve the model’s ability to distinguish a wider range of spurious-negative samples. Additionally, incorporating more advanced knowledge representation learning models could enable the capture of more complex structural and semantic information in KGs, further enhancing the accuracy of quality evaluation and the applicability of the model.
Author Contributions
Conceptualization, B.C. and Z.S.; methodology, B.C., Z.S., and H.L.; investigation, B.C.; writing—original draft preparation, B.C.; writing—review and editing, Z.S.; visualization, B.C.; supervision, Z.S. and H.L. All authors have read and agreed to the published version of the manuscript.
Funding
This research was funded by the National Natural Science Foundation of China (Grant no. 61771001).
Data Availability Statement
Publicly available datasets were analyzed in this research. The FB15K dataset can be found here (https://huggingface.co/datasets/VLyb/FB15k; accessed on 1 January 2023). The WN18 dataset can be found here (https://huggingface.co/datasets/VLyb/WN18; accessed on 1 January 2023). The CS13K dataset that supports the findings of this study is available from the corresponding author upon reasonable request.
Conflicts of Interest
The authors declare no conflicts of interest.
References
- Jia, Y.; Qi, Y.; Shang, H.; Jiang, R. A practical approach to constructing a knowledge graph for cybersecurity. Engineering 2018, 4, 53–60. [Google Scholar] [CrossRef]
- Zhao, X.; Jiang, R.; Han, Y.; Li, A.; Peng, Z. A survey on cybersecurity knowledge graph construction. Comput. Secur. 2024, 136, 103524. [Google Scholar] [CrossRef]
- Li, H.; Shi, Z.; Pan, C.; Zhao, D.; Sun, N. Cybersecurity knowledge graphs construction and quality assessment. Complex Intell. Syst. 2024, 10, 1201–1217. [Google Scholar] [CrossRef]
- Mendes, P.; Mühleisen, H.; Bizer, C. Sieve: Linked data quality assessment and fusion. In Proceedings of the 2012 Joint EDBT/ICDT Workshops, Berlin, Germany, 30 March 2012; pp. 116–123. [Google Scholar]
- Shi, Z.; Li, H.; Zhao, D.; Pan, C. Research on quality assessment methods for cybersecurity knowledge graphs. Comput. Secur. 2024, 142, 103848. [Google Scholar] [CrossRef]
- Bordes, A.; Usunier, N.; Garcia, D. Translating embeddings for modeling multi-relational data. In Advances in Neural Information Processing Systems, Proceedings of the 27th Annual Conference on Neural Information Processing Systems 2013, Lake Tahoe, NV, USA, 5–8 December 2013; Neural Information Processing Systems Foundation, Inc.: La Jolla, CA, USA, 2013; Volume 26. [Google Scholar]
- Dettmers, T.; Minervini, P.; Stenetorp, P. Convolutional 2D knowledge graph embeddings. In Proceedings of the AAAI Conference on Artificial Intelligence 2018, New Orleans, LA, USA, 2–7 February 2018; Volume 32. [Google Scholar]
- Kadlec, R.; Bajgar, O.; Kleindienst, J. Knowledge base completion: Baselines strike back. arXiv 2017, arXiv:1705.10744. [Google Scholar]
- Sha, Y.; Feng, Y.; He, M.; Liu, S.; Ji, Y. Retrieval-Augmented Knowledge Graph Reasoning for Commonsense Question Answering. Mathematics 2023, 11, 3269. [Google Scholar] [CrossRef]
- Zeng, Z.; Cheng, Q.; Si, Y. Logical Rule-Based Knowledge Graph Reasoning: A Comprehensive Survey. Mathematics 2023, 11, 4486. [Google Scholar] [CrossRef]
- Cao, J.; Fang, J.; Meng, Z.; Liang, S. Knowledge graph embedding: A survey from the perspective of representation spaces. ACM Comput. Surv. 2024, 56, 1–42. [Google Scholar] [CrossRef]
- Xie, R.; Liu, Z.; Lin, F. Does william shakespeare really write hamlet? knowledge representation learning with confidence. In Proceedings of the AAAI Conference on Artificial Intelligence 2018, New Orleans, LA, USA, 2–7 February 2018; Volume 32. [Google Scholar]
- Zhang, Y.; Yao, Q.; Dai, W. AutoSF: Searching scoring functions for knowledge graph embedding. In Proceedings of the 2020 IEEE 36th International Conference on Data Engineering (ICDE), Dallas, TX, USA, 20–24 April 2020; IEEE: New York, NY, USA, 2020; pp. 433–444. [Google Scholar]
- Jia, S.; Xiang, Y.; Chen, X. Triple trustworthiness measurement for knowledge graph. In Proceedings of the World Wide Web Conference, San Francisco, CA, USA, 13–17 May 2019; pp. 2865–2871. [Google Scholar]
- Bougiatiotis, K.; Fasoulis, R.; Aisopos, F. Guiding graph embeddings using path-ranking methods for error detection innoisy knowledge graphs. arXiv 2020, arXiv:2002.08762. [Google Scholar]
- Yang, B.; Yih, W.; He, X. Embedding entities and relations for learning and inference in knowledge bases. arXiv 2014, arXiv:1412.6575. [Google Scholar]
- Trouillon, T.; Dance, C.; Gaussier, É. Knowledge graph completion via complex tensor factorization. J. Mach. Learn. Res. 2017, 18, 1–38. [Google Scholar]
- Wang, Z.; Zhang, J.; Feng, J. Knowledge graph embedding by translating on hyperplanes. In Proceedings of the AAAI Conference on Artificial Intelligence, Québec City, QC, Canada, 27–31 July 2014; Volume 28. [Google Scholar]
- Lin, Y.; Liu, Z.; Sun, M. Learning entity and relation embeddings for knowledge graph completion. In Proceedings of the AAAI Conference on Artificial Intelligence, Austin, TX, USA, 25–30 January 2015; Volume 29. [Google Scholar]
- Balažević, I.; Allen, C.; Hospedales, T. Tucker: Tensor factorization for knowledge graph completion. arXiv 2019, arXiv:1901.09590. [Google Scholar]
- Zhao, Y.; Feng, H.; Gallinari, P. Embedding learning with triple trustiness on noisy knowledge graph. Entropy 2019, 21, 1083. [Google Scholar] [CrossRef]
- Che, F.; Tao, J. M2ixKG: Mixing for harder negative samples in knowledge graph. Neural Netw. 2024, 177, 106358. [Google Scholar] [CrossRef] [PubMed]
- Zhang, J.; Li, Y.; Zou, R.; Zhang, J.; Jiang, R.; Fan, Z.; Song, X. Hyper-relational knowledge graph neural network for next POI recommendation. World Wide Web 2024, 27, 46. [Google Scholar] [CrossRef]
- Chen, X.; Zhang, W.; Yao, Z.; Chen, M.; Tang, S. Negative sampling with adaptive denoising mixup for knowledge graph embedding. In Proceedings of the International Semantic Web Conference, Athens, Greece, 6–10 November 2023; pp. 253–270. [Google Scholar]
- Sun, Z.; Deng, Z.; Nie, J. Rotate: Knowledge graph embedding by relational rotation in complex space. arXiv 2019, arXiv:1902.10197. [Google Scholar]
- Ahrabian, K.; Feizi, A.; Salehi, Y. Structure aware negative sampling in knowledge graphs. arXiv 2020, arXiv:2009.11355. [Google Scholar]
- Zhang, Y.; Yao, Q.; Shao, Y. NSCaching: Simple and efficient negative sampling for knowledge graph embedding. In Proceedings of the 2019 IEEE 35th International Conference on Data Engineering (ICDE), Macau, China, 8–11 April 2019; IEEE: New York, NY, USA, 2019; pp. 614–625. [Google Scholar]
- Niu, G.; Li, B.; Zhang, Y. CAKE: A scalable commonsense-aware framework for multi-view knowledge graph completion. arXiv 2022, arXiv:2202.13785. [Google Scholar]
- Huang, T.; Dong, Y.; Ding, M. Mixgcf: An improved training method for graph neural network-based recommender systems. In Proceedings of the 27th ACM SIGKDD Conference on Knowledge Discovery & Data Mining, Virtual, 14–18 August 2021; pp. 665–674. [Google Scholar]
- Balažević, I.; Allen, C.; Hospedales, T. Hypernetwork knowledge graph embeddings. In Proceedings of the Artificial Neural Networks and Machine Learning–ICANN 2019: Workshop and Special Sessions, Munich, Germany, 17–19 September 2019; Springer International Publishing: Cham, Switzerland, 2019; pp. 553–565. [Google Scholar]
- Shi, Z.; Li, H.; Zhao, D. Research on Relation Classification Tasks Based on Cybersecurity Text. Mathematics 2023, 11, 2598. [Google Scholar] [CrossRef]

Disclaimer/Publisher’s Note: The statements, opinions and data contained in all publications are solely those of the individual author(s) and contributor(s) and not of MDPI and/or the editor(s). MDPI and/or the editor(s) disclaim responsibility for any injury to people or property resulting from any ideas, methods, instructions or products referred to in the content. |
© 2024 by the authors. Licensee MDPI, Basel, Switzerland. This article is an open access article distributed under the terms and conditions of the Creative Commons Attribution (CC BY) license (https://creativecommons.org/licenses/by/4.0/).