Abstract
We focus on detecting anomalies in images where the data distribution is supported by a lower-dimensional embedded manifold. Approaches based on autoencoders have aimed to control their capacity either by reducing the size of the bottleneck layer or by imposing sparsity constraints on their activations. However, none of these techniques explicitly penalize the reconstruction of anomalous regions, often resulting in poor detection. We tackle this problem by adapting a self-supervised learning regime that essentially implements a denoising autoencoder with structured non-i.i.d. noise. Informally, our objective is to regularize the model to produce locally consistent reconstructions while replacing irregularities by acting as a filter that removes anomalous patterns. Formally, we show that the resulting model resembles a nonlinear orthogonal projection of partially corrupted images onto the submanifold of uncorrupted examples. Furthermore, we identify the orthogonal projection as an optimal solution for a specific regularized autoencoder related to contractive and denoising variants. In addition, orthogonal projection provides a conservation effect by largely preserving the original content of its arguments. Together, these properties facilitate an accurate detection and localization of anomalous regions by means of the reconstruction error. We support our theoretical analysis by achieving state-of-the-art results (image/pixel-level AUROC of 99.8/99.2%) on the MVTec AD dataset—a challenging benchmark for anomaly detection in the manufacturing domain.
MSC:
68T07
1. Introduction
The task of anomaly detection (AD) in a broad sense corresponds to searching for patterns that considerably deviate from some concept of normality. The criteria for what is normal and what is an anomaly can be very subtle and depend heavily on the application. Visual AD specifically aims to detect and locate anomalous regions in imagery data, with practical applications in the industrial, medical, and other domains [1,2,3,4,5,6,7,8,9,10,11,12,13,14,15,16,17]. The continuous research in this area has produced a variety of methods ranging from classical unsupervised approaches like PCA [18,19,20], one-class SVM [21], SVDD [22], nearest neighbor algorithms [23,24], and KDE [25] to more recent methods including various types of autoencoders [5,12,26,27,28,29,30,31,32], deep one-class classification [33,34,35], generative models [6,13], self-supervised approaches [1,3,36,37,38,39,40,41], and others [3,7,8,9,10,11,40,41,42,43,44,45,46,47,48,49,50,51,52,53,54,55,56,57,58,59,60,61,62,63,64,65,66,67,68,69,70,71,72,73,74,75,76,77,78,79].
The one-class classifiers [21,22], for example, aim at learning a tight decision boundary around the normal examples in the feature space and define a distance-based anomaly score relative to the center of the training data. The success of this approach strongly depends on the availability of suitable features. Therefore, it usually allows only for the detection of outliers that greatly deviate from the normal structure. In practice, however, we are often interested in more subtle deviations, which require a good representation of the data manifold. The same applies to combined approaches based on training deep neural networks (DNNs) with a one-class objective [35,80,81]. Although this objective encourages the network to concentrate the training data in a small region in the feature space, there is no explicit motivation for anomalous examples to be mapped outside of the decision boundary. In fact, the one-class objective gives preference to models that map its input domain to a narrower region and does not explicitly focus on separating anomalous examples from the normal data.
Recently, deep autoencoders (AEs) have been used for the task of anomaly detection in the visual domain [1,40,41]. Unlike the one-class approaches, they additionally enable the localization of anomalous regions by exploiting the pixel-wise nature of a corresponding training objective. By optimizing for the reconstruction error using anomaly-free examples, a common belief is that the corresponding network should fail to reconstruct anomalous regions in the application phase. Typically, this goal is achieved by controlling the capacity of the model either directly by reducing the size of the bottleneck layer or implicitly by imposing sparsity constraints on parts of the corresponding network [32,82,83,84,85]. However, neither of these techniques explicitly penalizes the reconstruction of anomalous regions, often resulting in poor detection. This is similar to the problem of training with the one-class objective, where no explicit mechanism exists for preventing anomalous examples from being mapped to the normal region. In fact, unsupervised trained AEs aim to compress and accurately reconstruct the input images and do not care much about the actual distinction between normal and anomalous samples. As a result, the reconstruction errors for the anomalous and normal regions can be very similar, preventing reliable detection and localization.
In this paper, we propose a self-supervised learning framework, which introduces discriminative information during training to prevent the good reconstruction of anomalous patterns in the testing phase. We begin with an observation that the abnormality of a region in the image is partially characterized by how well it can be reconstructed from the context of the surrounding pixels. Imagine an image where a small patch has been cut out by setting the corresponding pixel values to zeros. We can try to reconstruct this patch by interpolating the surrounding pixel values according to our knowledge about the distribution of the training data. If the reconstruction significantly deviates from the original content, we consider a corresponding patch to be anomalous and normal otherwise. Following this idea, we feed partially distorted images to the network during training while forcing it to recreate the original content—similar to the task of neural image completion [86,87,88,89,90,91]. However, instead of setting the individual pixel values to zeros—as for the completion task—we apply a patch transformation, which avoids introducing easily detectable artifacts. To succeed, our model must accomplish two different tasks: (a) detection of regions deviating from the expected pattern and (b) recreation of the original content from the uncorrupted areas. The second task, in particular, imposes an important regularization effect on the model. Together, they provide a powerful training signal for an accurate AD.
Technically, our approach can be seen as training a denoising autoencoder (DAE) on artificially corrupted inputs following a specific noise model. Although the general objective of DAEs allows for arbitrary stochastic corruptions, previous works [85,92,93] only considered simple unstructured noise, which can be characterized by the i.i.d. assumption on the distribution of the individual pixels. In contrast, we consider structured noise with spatial dependencies between the corruption variables implemented by a specific form of partial occlusions. Altogether, the resulting training effect regularizes the model to produce locally consistent reconstructions while replacing irregularities, therefore acting as a filter that removes anomalous patterns. Figure 1 illustrates a few examples to give a sense of visual quality of the resulting heatmaps when training according to our approach.
Figure 1.
Anomaly detection results of our approach on a few images from the MVTec AD dataset. The first row shows the input images and the second row an overlay with the predicted anomaly heatmap.
To support our idea, we performed a theoretical analysis of the proposed method, which provided a number of interesting insights. Specifically, we show that the resulting model approximates a mapping, which, with an increasing number of image pixels, converges (stochastically) to the orthogonal projection of partially corrupted images onto the submanifold of normal examples. This is consistent with the findings in [85] showing that, in a non-degenerate case (i.e., for distributions with support of nonzero volume) with i.i.d. pixel noise, the optimal reconstruction is given by a mapping that corrects the noisy inputs by pushing them toward the region of high probability density according to as . These results approach a point mass distribution collapsing to a lower-dimensional manifold, where we talk about projections and establish here the following complementary connection. While the gradient points in the direction of the maximal increase in probability at point , the orthogonal projection onto the data manifold is characterized by the shortest distance between and its projected image. Therefore, we can naturally measure the abnormality of anomalous samples according to their distance from the manifold of normal examples.
Additionally, we investigate the effect of projection mappings on the segmentation accuracy of anomalous regions. Specifically, we analyze the conservation property of the orthogonal projection, which removes anomalous patterns in a way that largely preserves the original content. Furthermore, we establish a close connection of our approach to the previous autoencoding models including the contractive and denoising variants. In particular, we show that the orthogonal projection provides an optimal solution for the reconstruction contractive autoencoder.
The rest of this paper is organized as follows: In Section 2, we outline the main differences between our approach and related methods, concluding with a concise summary of our contributions. In Section 3, we formally introduce the proposed framework including training objective, data generation, and model architecture, followed by a theoretical analysis in Section 4. In Section 5, we evaluate the performance of our approach and provide a conclusion in Section 6.
2. Related Works
The plethora of existing AD methods (see [78] for an overview) can be roughly divided in three groups: probabilistic models, one-class classification methods, and reconstruction models; our approach is a member of the latter. Without going deeper into the details, we note that the first two groups appear less suitable in our case, where the data distribution is supported by a lower-dimensional embedded manifold. Due to this fact, the Lebesgue measure of the data manifold is zero excluding the existence of a density function over the input space, which takes positive values only on the manifold. On the other hand, one-class approaches implicitly assume a nonzero volume of the corresponding data in order to provide accurate detection results, which again violates our assumption about the data distribution.
Here, we focus on the reconstruction methods represented by the regularized AEs including the contractive [84] and denoising [92] variants and a number of self-supervised methods inspired by the task of neural image completion [1,40,41]. The central idea behind the contractive autoencoder (CAE), for example, is to learn a reconstruction mapping composed of encoder and decoder parts by adding a regularization term to the objective, which implicitly promotes a reduction in the magnitude of gradients in direction pointing outside the tangent plane on the data manifold. In contrast, the denoising autoencoder (DAE) aims to minimize the reconstruction error without regularization terms but augments the training procedure by adding stochastic noise to the inputs.
Previous work [85] demonstrated that a DAE with small noise corruption of variance is similar to a CAE with penalty coefficient but where the contraction is imposed explicitly on the whole reconstruction function rather than on the encoder part alone. Our approach is also based on training a model to reconstruct original content from modified inputs but differs from the previous works on DAE by using more involved input modifications beyond the i.i.d. corruption noise. Specifically, the corruptions introduced during training may represent additive noise, stochastic occlusions, and even deterministic modifications (e.g., geometric transformations), allowing for a wider range of anomalous patterns to be detectable during the application phase.
Another group of related methods has been inspired by the task of neural image completion [86,87,88,89,90,91]. This group includes a number of self-supervised methods like LSR [3], RIAD [39], CutPaste [40], InTra [41], DRAEM [38], and SimpleNet [94], which (similar to our approach) aim at training a model to reconstruct the original content from corrupted inputs in either the latent or the input space. The main differences of these methods from our approach are in the choice of data augmentation during training and the specific network architecture of our model, which in summary ked to higher performance in our experiments on the MVTec AD dataset [95]. Another two recent studies (PatchCore) [10] and (PNI) [68] reported impressive results on this benchmark. Both are based on the usage of memory banks comprising locally aware nominal patch-level feature representations extracted from pretrained networks. In contrast, our approach neither requires pretraining nor additional storage room for the memory bank and performs on par with the two methods. In the following, we briefly summarize our contributions.
As our first contribution, we formulated an effective AD framework for a special use case (e.g., natural images), where the normal examples exist on a lower-dimensional submanifold embedded in the input space and are restricted by an additional assumption on the covariance between the spatially close components to vanish with increasing distance. While similar ideas have been used in different domains, our approach distinguishes itself by the specific form of the noise model (implemented by partial occlusions with complex shapes) and the network architecture (SDC-AE and SDC-CCM) that together produce a solution which consistently outperforms previous methods. In particular, we achieved state-of-the-art results for both detection (AUROC of 99.8%) and localization (AUROC of 99.2%) tasks on the MVTec AD dataset—a challenging benchmark for visual anomaly detection in the manufacturing domain.
As our second contribution, we performed a rigorous theoretical analysis of our method, which provided a number of interesting insights. Specifically, we show that with an increasing number of input pixels, the corresponding model resembles the orthogonal projection of partially corrupted images onto the submanifold of uncorrupted examples. This covers various forms of input modifications including partial occlusions and additive noise (see Theorem 1 and Theorem 2). At the same time, orthogonal projection acts as a filter for irregularities by removing anomalous patterns from the inputs in a way that largely preserves the original content (see Proposition 2 and Proposition 3). Together, these properties facilitate the accurate detection and localization of the anomalous regions by means of the reconstruction error, supporting our hypothesis around the training procedure.
As our third contribution, we improved upon the previous understanding of the connections between contractive and denoising autoencoders. Specifically, we identified the nonlinear orthogonal projection as an optimal solution (see Proposition 1), minimizing the training objective of the reconstruction contractive autoencoder (RCAE). On the other hand, our training objective essentially corresponds to training a DAE with a specific noise model, imposing strong spatial correlation on the corruption variables. A corresponding model, in turn, approximates a mapping that (with the increasing number of input pixels) converges stochastically to the orthogonal projection—the optimal solution of the RCAE. In contrast to the previous results [85], our findings extend beyond the i.i.d. variable noise and are not limited by the assumption of small variance.
3. Methodology
In the following, we formally introduce our self-supervised framework for training a model to detect and localize anomalous regions in images. We provide a detailed description of the objective function, the structure of artificially generated anomalies used during training, and the rationale behind our choice of model architecture.
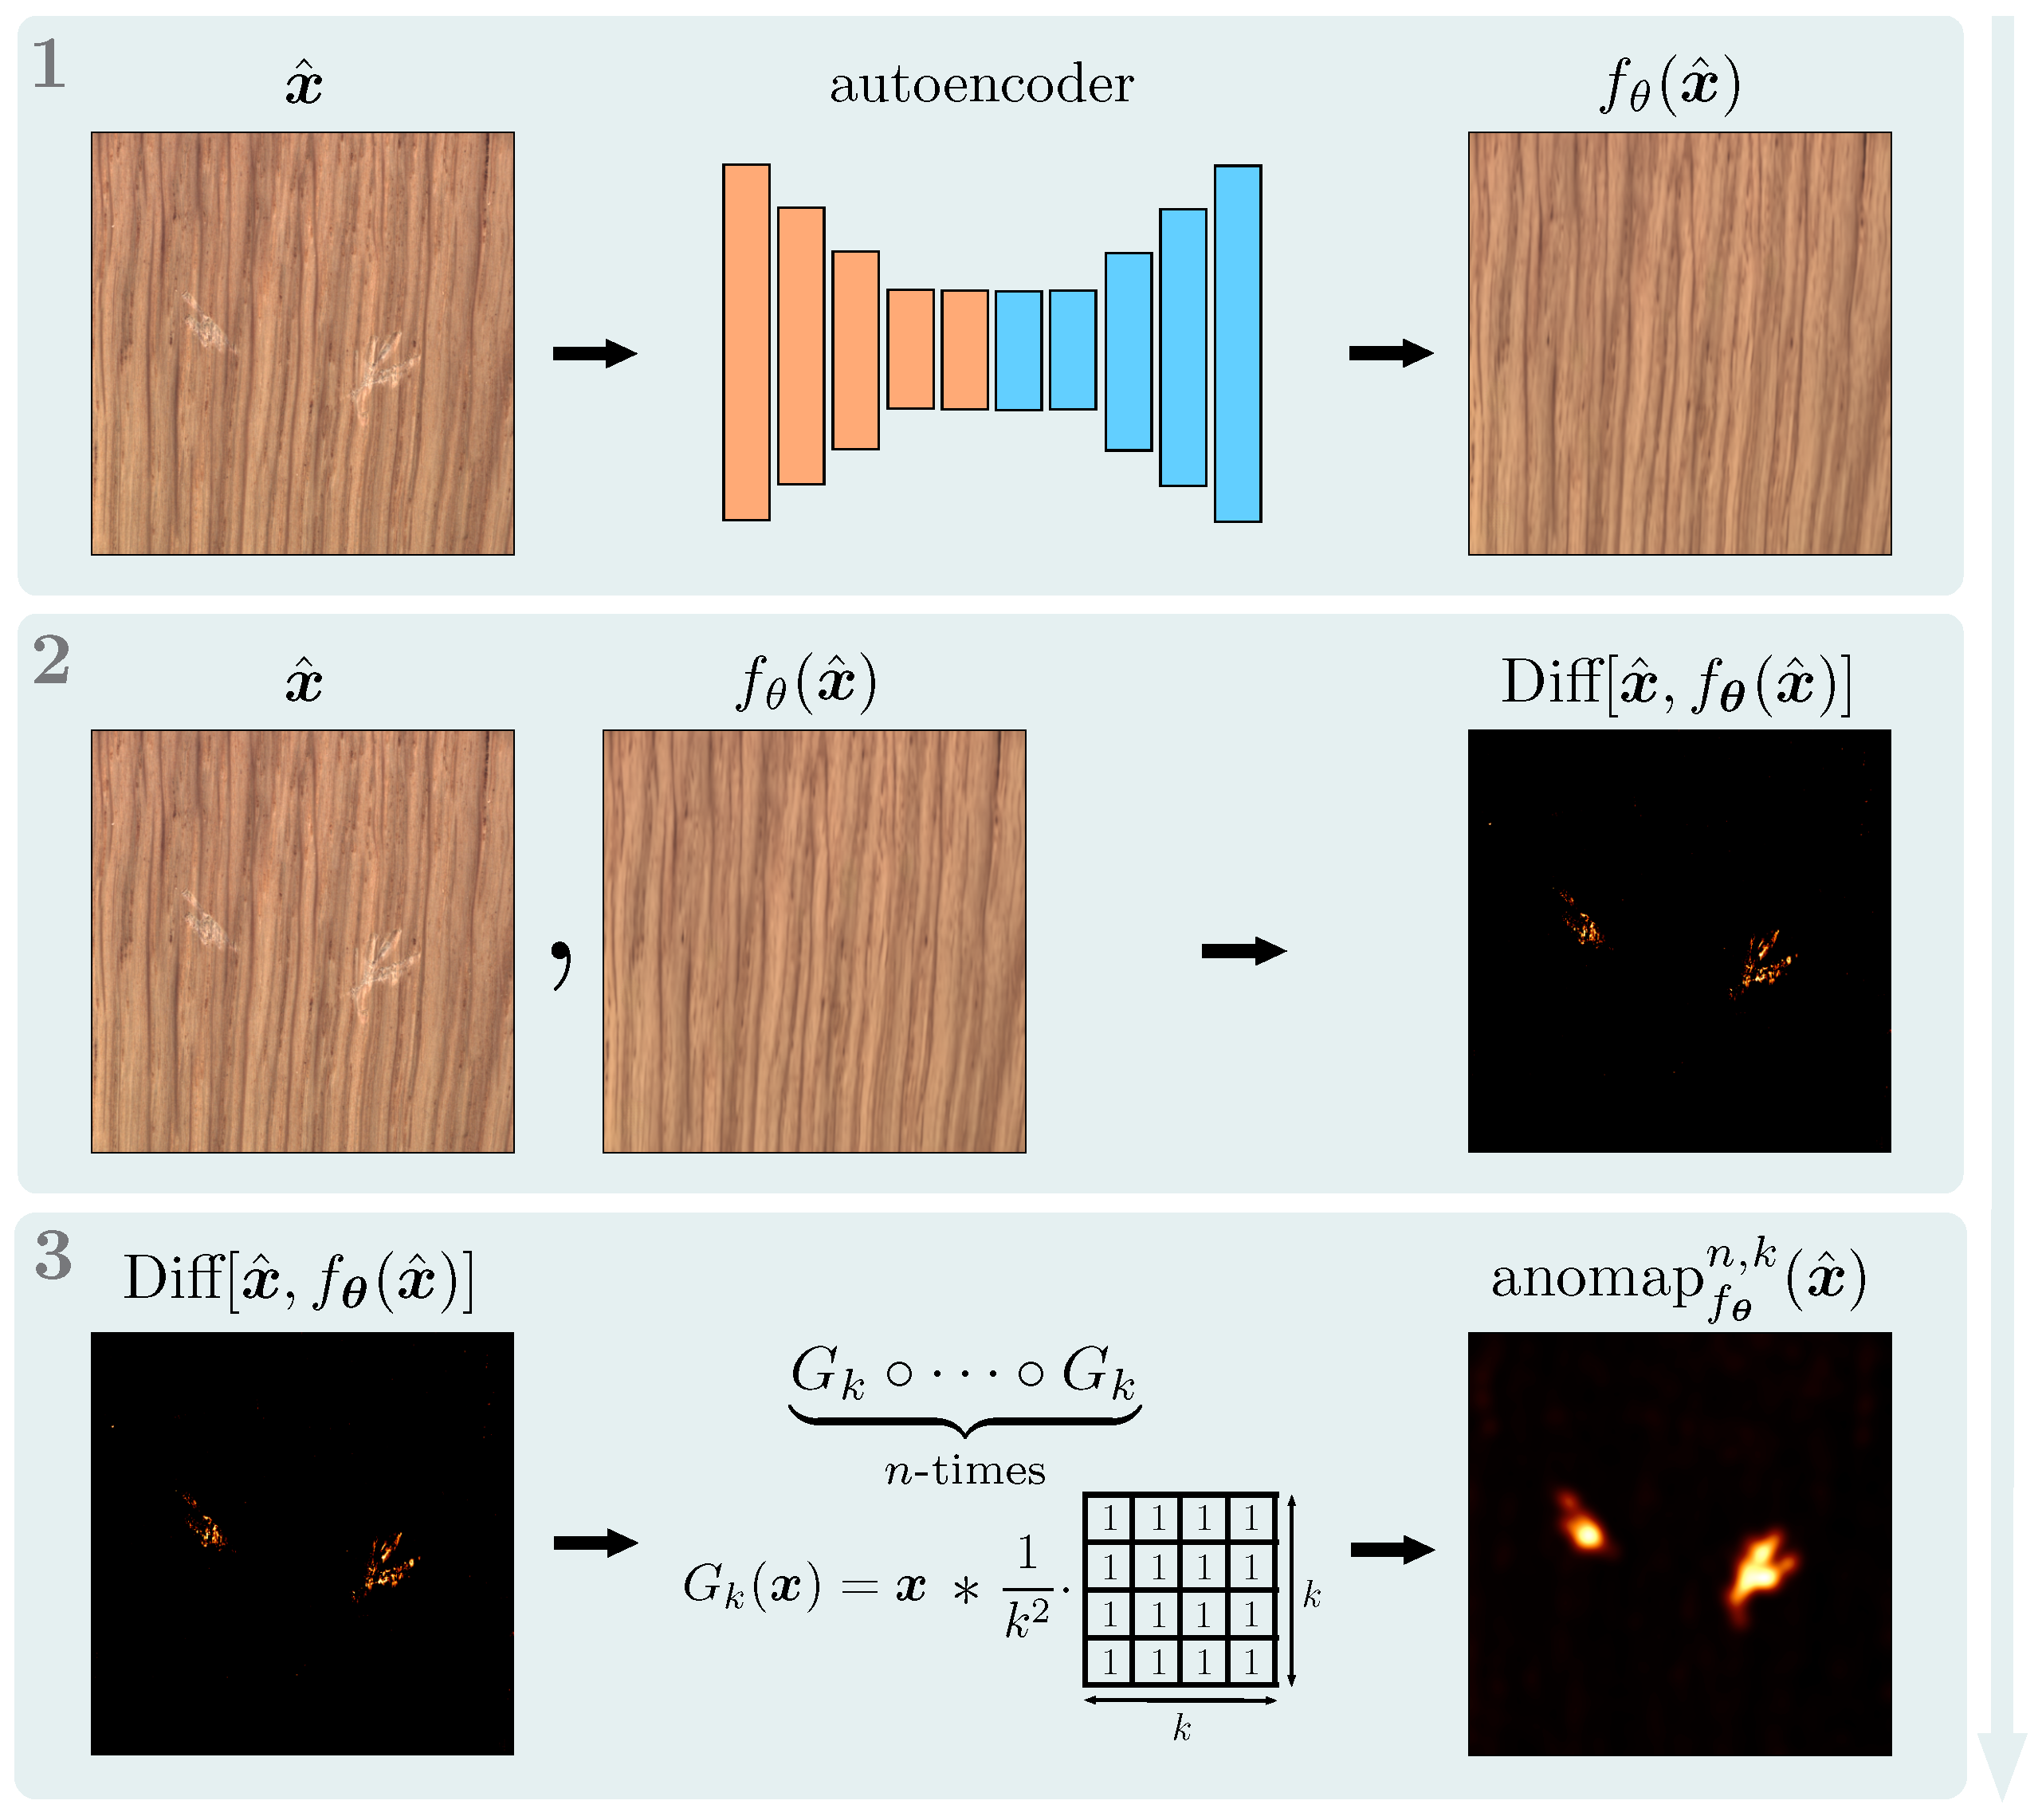
3.1. Training Objective
We identify an autoencoder with input and output tensors corresponding to color images with a parameterized map , . Furthermore, denotes an original (anomaly-free) image, and denotes a copy of that has been partially modified. The modified regions within are encoded through a real-valued mask , while denotes a corresponding complement, with being a tensor of ones. Our goal is to train a model that projects arbitrary inputs from the data space to the submanifold of normal images by minimizing for each triple , with the following objective:
where ⊙ denotes an element-wise tensor multiplication, and is a hyperparameter controlling the importance of the two terms during training. Here, denotes the -norm on a corresponding tensor space. In terms of supervised learning, we feed a partially corrupted image as input to the network, which is trained to recreate the original image representing the ground truth label.
By minimizing the above objective, the corresponding autoencoder aims to interpolate between two different tasks. The first term steers the model to reproduce uncorrupted image regions , while the second term requires the network to correct the corrupted regions by recreating the original content. Altogether, the objective in (1) encourages the model to produce a locally consistent reconstruction of the input while replacing irregularities, acting as a filter for anomalous patterns. Figure 2 shows a few reconstruction examples produced by our model . We can see how normal regions are accurately replicated, while irregularities (e.g., scratches or threads) are replaced by locally consistent patterns. During training, we use a specific procedure to generate corrupted images from normal examples based on randomly generated masks marking the corrupted regions. We provide a detailed description of this process in the next subsection.
Figure 2.
Illustration of the reconstruction effect of our model trained either on the wood, carpet, or grid images (without defects) from the MVTec AD dataset.
Given a trained model , we can perform AD on an input image as follows: First, we compute the difference map between the input and its reconstruction by averaging the pixel-wise squared difference over the color channels according to
The binary segmentation mask can be computed by thresholding the difference map. To obtain a more robust result, we smooth the difference map before thresholding according to the following formula:
where denotes a repeated application of a convolution mapping defined by an averaging filter of size with all entries set to . We treat the numbers , as hyperparameters, where is the identity mapping. By thresholding , we obtain a binary segmentation mask for the anomalous regions. We compute the anomaly score for the entire image from by summing the scores for the individual pixels. Note that for , if we skip the averaging step over the color-channels in (2), this reduces to . Alternatively to the summation, we could take the maximum over the pixel scores, making the anomaly score potentially less sensitive to size variations in the anomalous regions. The complete detection procedure is summarized in Figure 3. In Section 4, we investigate which image corruptions approximately preserve the orthogonality of the corresponding transformations.
Figure 3.
Illustration of our anomaly detection process after the training. Given input , we first, see (1) compute an output by replicating normal regions and replacing irregularities with locally consistent patterns. Then, see (2), we compute a pixel-wise squared difference , which is subsequently averaged over the color channels to produce the difference map . In the last step, see (3), we apply a series of averaging convolutions to the difference map to produce our final anomaly heatmap .
3.2. Generating Artificial Anomalies for Training
We use a self-supervised approach representing the training data as input–output pairs. Here, the ground truth outputs are given by the original images corresponding to the normal examples. The inputs are generated from these images by partially modifying some regions according to the procedure illustrated in Figure 4.
Figure 4.
Illustration of data generation for training. After randomly choosing the number and locations of the patches to be modified, we create new content by gluing the extracted patches with the corresponding replacements. Given a real-valued mask marking corrupted regions within a patch, an original image patch , and a corresponding replacement , we create the next corrupted patch by merging the two patches together according to the formula . All mask shapes are created by applying Gaussian distortion to the same (static) mask, representing a filled disk at the center of the patch with a smoothly fading boundary toward the exterior of the disk.
For each normal example , we first randomly sample the number, the size, and the location of the patches to be modified. In the next step, each randomly selected patch is modified according to the following procedure: First, we create a real-valued mask based on the elastic deformation technique to mark the corrupted regions within the selected patch. Precisely, we start with a static mask shaped as a disk at the center of the patch with a smoothly fading boundary toward the exterior of the disk. We then apply Gaussian distortion (with random parameters) to this mask, resulting in the varying shapes illustrated on the right side in Figure 4. These masks are used to smoothly merge the original patches with the new content given by the replacement patches. Here, we consider two types of replacements. On the one hand, we can use any natural image (sufficiently different from the original patch) as a potential replacement. In our experiments, we used the publicly available Describable Textures Dataset (DTD) [96], consisting of images of varying backgrounds. On the other hand, we can use the extracted patches as replacements after passing them through a Gaussian distortion process, similar to how we create the masking shapes. An important aspect here is that the corresponding corruptions approximately preserve the original color distribution.
Given an input and a replacement , we create a corrupted image by smoothly gluing the two images together according to the formula . In the last step, the patches extracted at the beginning are replaced with their modified versions in the original image. The individual shape masks are embedded in a two-dimensional zero-array at the corresponding locations to create a global mask . During testing phase, there are no input modifications, and images are passed unchanged to the network. Anomalous regions are detected by thresholding the anomaly heatmap defined in Equation (3).
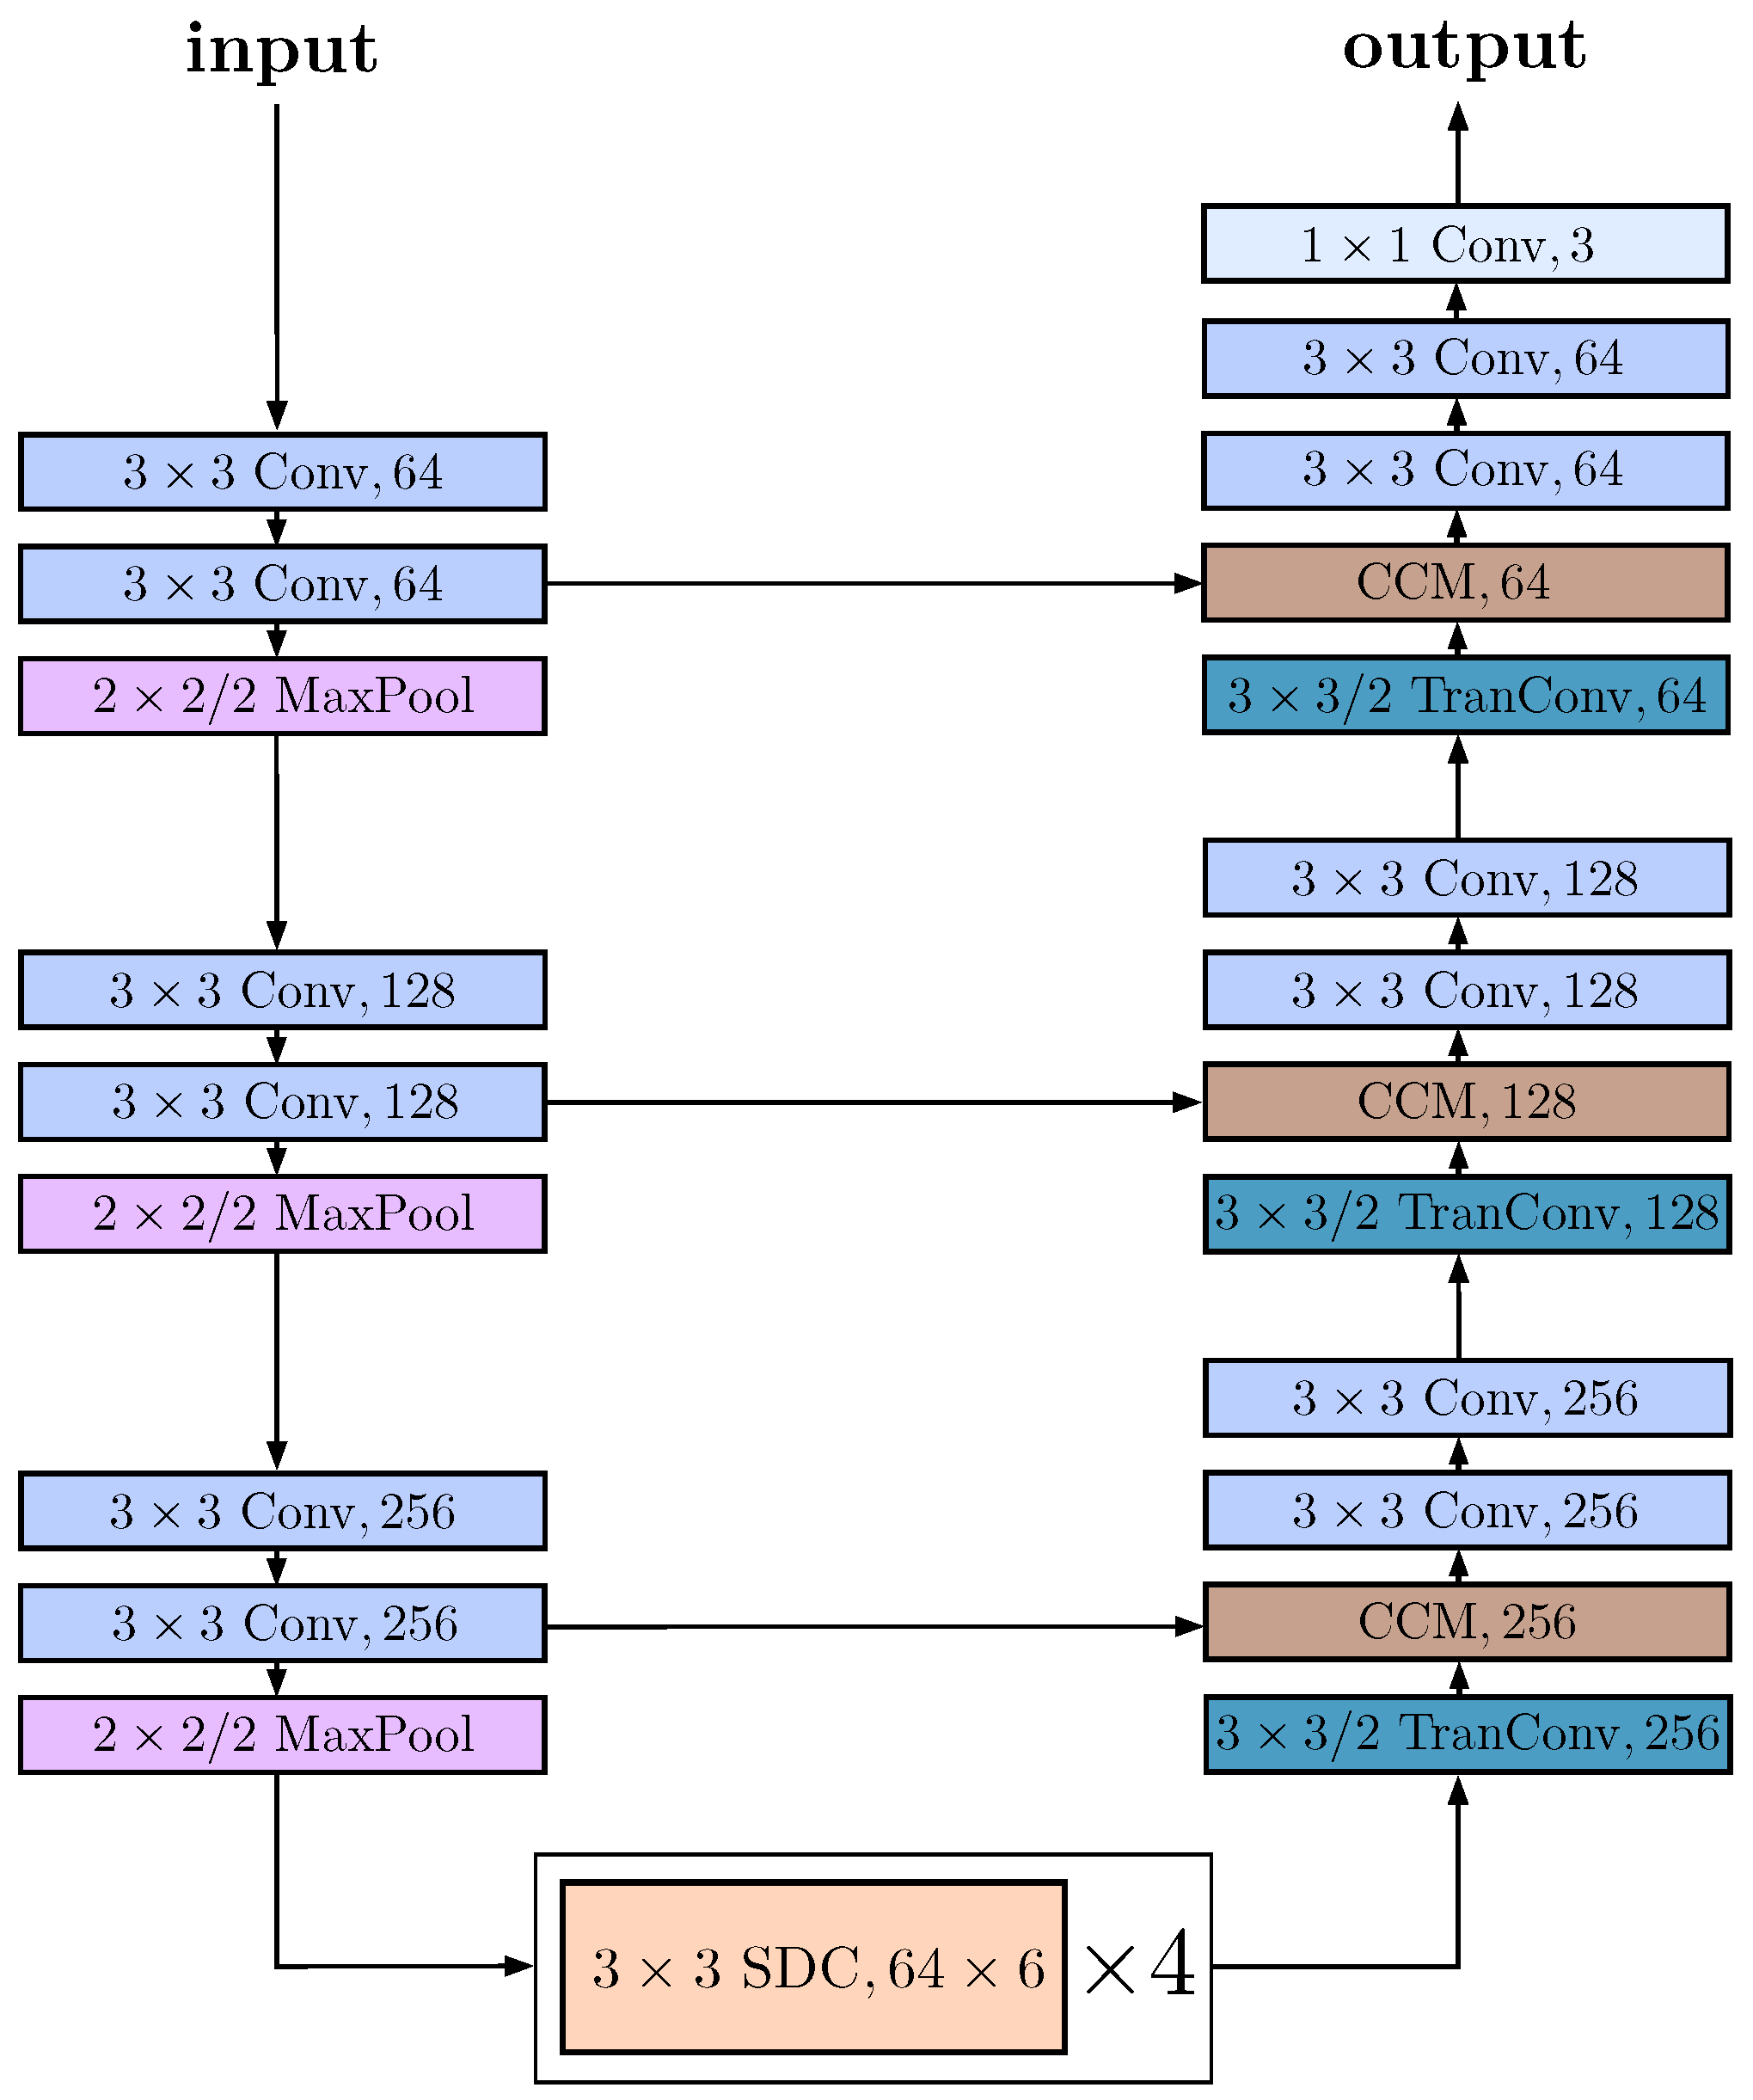
3.3. Model Architecture
We adopt a well-established encoder–decoder architecture commonly used in computer vision tasks such as semantic segmentation [97,98], image inpainting [87,88,89], representation learning [86], and anomaly detection [1,2,91]. Specifically, the encoder is composed of convolutional layers that progressively reduce spatial dimensions while increasing the number of feature maps. Conversely, the decoder gradually restores spatial dimensions while reducing the number of output channels. In contrast to common practices, we also incorporate dilated convolutions [99], which enable the model to efficiently capture long-range dependencies between individual pixels and their local neighborhoods. This modification has two key effects: it allows access to richer contextual information without increasing the network depth and helps address larger anomalous regions that would otherwise be affected by a blind spot phenomenon, as shown in Figure A3 in Appendix I. Due to the interplay between the training objective and the network architecture, the model naturally adopts a filtering behavior by replacing anomalous patterns in the input images with locally consistent reconstructions. We demonstrate the reconstruction effect with several examples in Figure 2.
The overall architecture is summarized in Table 1.
Table 1.
Our network architecture SDC-AE.
Here, after each convolution Conv (except in the last layer), we use batch normalization and rectified linear units (ReLUs) as the activation function. Max-pooling MaxPool is applied to reduce the spatial dimension of the intermediate feature maps. TranConv denotes the convolution transpose operation and also uses batch normalization with ReLUs. In the last layer, we use a sigmoid activation function without batch normalization. refers to a stacked dilated convolution block in which multiple dilated convolutions are stacked together. The corresponding subscript denotes the dilation rates of the six individual convolutions in each stack. After each stack we add an additional convolutional layer with the kernel size and the same number of feature maps as in the stack followed by a batch normalization and ReLU activation. We refer to this baseline architecture as SDC-AE, indicating an autoencoder (AE) that relies on stacked dilated convolutions (SDCs).
In our experiments, we observed that SDC-AE struggled to reproduce finer visual patterns, sometimes resulting in false positive detections. In order to improve the reconstruction ability, we proposed the following adjustment illustrated in Figure 5. Similar to the approach commonly used in image segmentation, we introduce skip connections into the network. However, direct access to the feature maps from earlier stages appears counterproductive, as it may interfere with other parts of the computational flow that are essential for suppressing corrupted regions in intermediate representations. Instead, we combine information from different layers of the network using a specific type of attention mechanism. Specifically, we first compute a tensor of coefficients ranging from zero to one, which we then use to calculate a component-wise convex combination of the individual feature maps. The corresponding procedure is illustrated in Figure 6. The idea behind this approach is that it provides the model with a more explicit mechanism for reusing, refining, or replacing regions of the input based on its assessment of the abnormality of a given region. We consolidate the corresponding computations into a single convex combination module (CCM), highlighted in brown in Figure 5. We refer to this architecture as SDC-CCM.
Figure 5.
Illustration of our network architecture SDC-CCM including the convex combination module (CCM) marked in brown and the skip-connections represented by the horizontal arrows. Without these additional elements, we obtain our baseline architecture SDC-AE.
Figure 6.
Illustration of the CCM module. The module receives two inputs: along the skip connection and from the current layer below. In the first step (image on the left), we compute the squared difference of the two and stack it together with the original values . This combined feature map is processed by two convolutional layers. The first layer uses batch normalization with ReLU activation. The second layer uses batch normalization and a sigmoid activation function to produce a coefficient matrix . In the second step (image on the right), we compute the output of the module as a (component-wise) convex combination , where is a tensor of ones.
In our experiments on the MVTec AD dataset, we observed a significant performance boost in some object categories when using SDC-CCM over SDC-AE. See Figure A4 in Appendix J for a comparison of the reconstruction quality between the models.
4. Theoretical Analysis
In this section, we provide a number of theoretical insights supporting our idea behind the proposed AD method. We begin by establishing a close connection to the related regularized AEs by identifying the orthogonal projection as an optimal solution for the optimization problem of the RCAE. We then investigate the conservation properties of the orthogonal projection with respect to the segmentation accuracy in the context of AD. As our main result, we show that under certain conditions the resulting model approximates a mapping that stochastically converges (with an increasing number of input pixels) to the orthogonal projection of partially corrupted images onto the submanifold of uncorrupted examples.
For the purpose of the following analysis, we identify each projecting autoencoder (PAE) with an idempotent mapping from an input space , to a differentiable manifold , . In the context of AD, we refer to the manifold as the (nonlinear) subspace of normal examples, while each is considered anomalous. In particular, we exploit a generalization of orthogonal projection to nonlinear mappings defined below and illustrated in Figure 7.
Figure 7.
Illustration of the general concept of the orthogonal projection f onto a data manifold . Here, anomalous samples (red dots) are projected to points (blue dots) in a way that minimizes the distance .
Definition 1.
For in a metric space , we call a (nonlinear) mapping , the
orthogonal projection
onto if it satisfies the equality
for all .
Note that the expression in (4) can be written as a set of inequalities. Namely, for , we obtain the following alternative description:
We use form (5) in Section 4.3.
In order to train a PAE, we minimize the following objective
where , and denotes some random data transformation. That is, the expectation in (6) is taken with respect to and . Note how the above objective is related to our training objective in (1). There, we explicitly use a mask only to balance the training with respect to the reconstruction accuracy of normal and anomalous regions. If we fix the value of and set , the objective (1) reduces to minimizing the loss . Here, the shape of mainly determines the properties of the projection map to be learned, which in turn simulates the inverse mapping of the corresponding input corruptions T. Depending on our goal, can be very specific ranging from additive noise (e.g., Gaussian noise) to partial occlusions and elastic deformations. In Section 4.3, we identify a number of input transformations that (asymptotically) preserve the orthogonality of the corresponding projections.
4.1. Connections to Regularized Autoencoders
Typically, an autoencoder is composed from two building blocks: the encoder , which maps the input to some internal representation, and the decoder , which maps back to the input space. The composition is often referred to as the reconstruction mapping. Most of the regularized autoencoders aim to capture the structure of the training distribution based on an interplay between the reconstruction error and the regularization term. They are trained by minimizing the reconstruction loss on the training data either by directly adding a regularization term to the objective or by introducing the regularization through some kind of data augmentation.
Specifically, the contractive autoencoder (CAE) [84] is trained to minimize the following regularized reconstruction loss
where is a weighting hyperparameter, and is the Frobenius norm of the Jacobian of the encoder .
The denoising autoencoder (DAE) [92], on the other hand, is trained to minimize the following denoising criterion
where represents some additive noise, and the expectation is over the training distribution and the corruption noise. Specifically, the term noise includes additive (e.g., isotropic Gaussian noise) and non-additive transformation (e.g., masking pepper-noise). However, the unifying feature of the considered corruptions is that the transformations of the individual entries in the input are statistically independent. In contrast, in (6), we consider more complex modifications, which result in the strong spatial correlation of the corruption variables). Note that the general objective of the DAE allows for arbitrary stochastic corruptions. However, previous theoretical investigations including [85] focused on (mostly additive) unstructured noise, which can be characterized by the i.i.d. assumption on the distribution of the individual pixels. The results in [85] demonstrate that there is close connection between the CAE and DAE when the standard deviation of the corruption noise approaches zero . More precisely, under some technical assumptions, the objective of the DAE can be written as
as . That is, for a small variance of the corruption noise, the DAE becomes similar to a CAE with penalty coefficient but where the contraction is imposed explicitly on the whole reconstruction mapping f. This connection motivated the authors to define the RCAE, a variation of the CAE by minimizing the following objective:
where the regularization term affects the whole reconstruction mapping. Finally, a common variant of the SAE applies an penalty on the hidden unit activations, effectively making them saturate toward zero—similar to the effect in the CAE.
We now show that a PAE, realized by the orthogonal projection onto the submanifold of normal examples, is an optimal solution that minimizes the objective of the RCAE in (10). We provide a formal proof in Appendix F.
Proposition 1.
Let be an orthogonal projection onto with respect to an -norm, . Then, is an optimal solution to the following optimization problem:
where , and is a placeholder denoting either the Frobenius or the spectral norm.
Note that the objective in the above proposition is slightly more general than that in (10) allowing the use of the spectral norm. Although being closely related to each other, the Frobenius and the spectral norm might have different effects on the optimization. Namely, the spectral norm measures the maximal scale by which a unit vector is stretched by a corresponding linear transformation and is determined by the maximal singular value, while the Frobenius norm measures the overall distortion of the unit circle taking into account all the singular values. In a more general sense, Proposition 1 implies a close connection between the PAE and other types of regularized autoencoders (see Figure 8 for an overview).
Figure 8.
Illustration of the connections between the different types of regularized autoencoders. For a small variance of the corruption noise, the DAE becomes similar to the CAE. This, in turn, gives rise to the RCAE, where the contraction is imposed explicitly on the whole reconstruction mapping. A special instance of PAE given by the orthogonal projection yields an optimal solution for the optimization problem of the RCAE. On the other hand, the training objective for PAE can be seen as an extension of DAE to more complex input modifications beyond additive noise. Finally, a common variant of the sparse autoencoder (SAE) applies an penalty on the hidden units, resulting in saturation toward zero similar to the CAE.
Orthogonal projection, in particular, appears to be an appropriate choice with respect to the shared goals of the autoencoding models discussed in this section. In Section 4.3.2, we show that in the limit when the dimensionality of the inputs goes to infinity, the DAE converges stochastically to the orthogonal projection when restricted to the specific noise corruptions.
4.2. Conservation Effect of Orthogonal Projections
Here, we focus on the subtask of AD regarding the segmentation of anomalous regions in the inputs. In the following, we identify each image tensor with a column vector , where and denote a set of pixel indices and its complement, respectively. We write to denote a restriction of a vector to the indices in S.
Consider an that has been generated by a (partial) modification , from an . We define the modified region as the set of disagreeing indices according to
There is some ambiguity about what might be considered an anomalous region, which motivates the following definition:
Definition 2.
Let , be a data manifold. Given , we define the set of anomalous regions in as the areas of smallest disagreement according to
We refer to each as an anomalous region to the pair as an anomalous patternand to as an anomalous sample.
We now provide some explanation of the motivation of our definition of anomalous patterns. Consider an example of binary sequences restricted by a condition that the pattern “11” is forbidden. For example, the sequence (0, 1, 0, 1, 1, 1, 1, 0) is invalid because it contains “11”. If we define the anomalous region as the smallest subset of indices that need to be corrected in order for the point to be projected to the data manifold, we encounter the following ambiguity problem. Namely, there are three different ways to correct the above example using minimal number of changes:
(0, 1, 0, 1, 0, 1, 0, 0); (0, 1, 0, 0, 1, 0, 1, 0); and (0, 1, 0, 1, 0, 0, 1, 0), which we denote as , and , respectively. All three sequences correspond to orthogonal projections to the feasible set, where . However,
That is, there are multiple anomalous patterns giving rise to the same corrupted point . In particular, the anomalous regions in are not uniquely determined and depend on the structure of . Based on this observation, we highlight a special projection map below, which maximally preserves the content of its arguments.
Definition 3.
For , , we call an idempotent mapping , the
conservative projection
onto with respect to the -norm if, for each pair with and , it satisfies the following properties:
The next proposition relates the conservation properties of orthogonal projections for different -norms. See Figure 9 for an illustration. A corresponding proof is provided in Appendix G.
Figure 9.
Illustration of the conservation effect of the orthogonal projections with respect to different -norms. Here, the anomalous sample is orthogonally projected onto the manifold (depicted by a red ellipsoid) according to for . The remaining three colors (green, blue, and yellow) represent rescaled unit circles around with respect to , and -norms. The intersection points of each circle with mark the orthogonal projection of onto for the corresponding norm. We can see that projections for lower p-values better preserve the content in according to the higher sparsity of the difference , which results in smaller modified regions .
Proposition 2.
Let , be a data manifold and be an anomalous sample. Furthermore, let and , where corresponds to the orthogonal projection of onto with respect to the -norm. For all , , the following statements are true:
The above proposition shows that orthogonal projection with respect to the -norm is more conservative for lower values regarding the preservation of normal regions. However, -norm has practical advantages over the -norm regarding the optimization process and is, therefore, often a better choice. Furthermore, the orthogonal projection with respect to the -norm (unlike the conservative projection) is not maximally preserving in general. We show later, however, that within the limit of the increasing input dimensionality, the conservative and the orthogonal projections (with respect to -norm) disagree only on a zero-measure probability set.
While Proposition 2 describes the conservation properties of orthogonal projections relative to each other, the following proposition specifies (asymptotically) how accurate the corresponding reconstruction error is in describing the anomalous region. As an auxiliary concept, we here introduce the notion of a transition set (illustrated in Figure 10), which glues the disconnected parts of an input together. We provide more details in Appendix H.
Figure 10.
Illustration of the concept of a transition set. Consider a 2D image tensor identified with a column vector , , which is partitioned according to (gray area) and (union of light blue and dark blue areas). The transition set B (dark blue area) glues the two disconnected sets S and together such that is feasible.
Proposition 3.
Let , be the orthogonal projection with respect to an -norm, and with a finite set of states , . Consider an that has been generated from via partial modification with for some , . Furthermore, let denote a transition set from S to . For all , the following holds true:
where grows asymptotically according to .
When projecting corrupted points onto the data manifold, we would like the transition set B around the anomalous region S to be as small as possible. The inequality in (15) implicitly upper-bounds the number of entries in the normal region that are not preserved by the projection. This is mostly practical for lower values of p and least informative in the case . Namely, provides a trivial upper bound, since for . For , for example, the interpretation is the simplest in the case of finite sequences of binary values. The number of disagreeing components is then upper-bounded by the number , corresponding to the size of the transition set, which, in turn, is determined by the form of the underlying data distribution.
To summarize, we showed that orthogonal projection with respect to the -norm preserves the normal regions more accurately for smaller p-values. Furthermore, we identified the conservative projection as the one that is maximally preserving (unlike the orthogonal projection). As previously mentioned, we show in Section 4.3 that within the limit (when the dimensionality of the input vectors goes to infinity), the -conservative and the -orthogonal projection are the same up until a zero-measure probability set.
4.3. Convergence Guarantees for Input Corruptions
In the following, we specify a range of input modifications that (approximately) preserve the orthogonality of the corresponding projections. In the context of image processing, the plethora of existing data augmentation techniques can be roughly divided into five groups: affine transformations, color jittering, mixing strategies, elastic deformations, and additive noise. Here, we characterize each image transformation either as a partial modification (of any type) or as a modification affecting the entire image represented by the additive noise methods. Image mixing strategies like MixUp can simply be seen as a transformation with additive noise, while CutMix is an example of partial modification. On the other hand, linear and affine data transformations like shift, rotation, or color-channel permutation, in general, do not preserve orthogonality.
For the purpose of the subsequent analysis, we identify the image tensors in our input space with a multivariate random variable corresponding to Markov random fields (MRFs) [100,101,102,103,104,105,106,107,108]. In particular, we assume that the variables representing the individual pixels are organized in a two-dimensional grid. Based on this view, we consider sequences of spaces of increasing dimensionality , representing images of gradually increasing size by adding new nodes along the rows and columns of the grid. Furthermore, we use the notation to denote the distance between the variables and in a corresponding MRF graph G defined by the number of edges on a shortest path connecting the two nodes.
4.3.1. Partial Modification
The following theorem describes the technical conditions under which a corresponding partial modification corresponds to the orthogonal projection. We provide a formal proof in Appendix D.
Theorem 1.
Consider a pair of independent MRFs over identically distributed variables with finite fourth moment , variance and vanishing covariance
for all . Furthermore, let be a copy of that has been partially modified, where for some , . The following is true,
provided the inequality
holds for all .
Given two samples and a corrupted copy , Theorem 1 describes how the expression approaches a true statement when the dimensionality of the embedding space goes to infinity. In particular, can be identified with the image of under the conservative projection . That is,
Therefore, the conservative projection converges stochastically to the orthogonal projection (compare to the definition of the orthogonal projection in (5)), while the inequality in (18) controls the maximal size of corrupted regions by taking into account the distribution of normal examples. On the other hand, Equation (19) suggests that (in the limit) the orthogonal and the conservative projection disagree at most on a subset of the data manifold , which has a zero probability measure under the training distribution.
4.3.2. Additive Noise
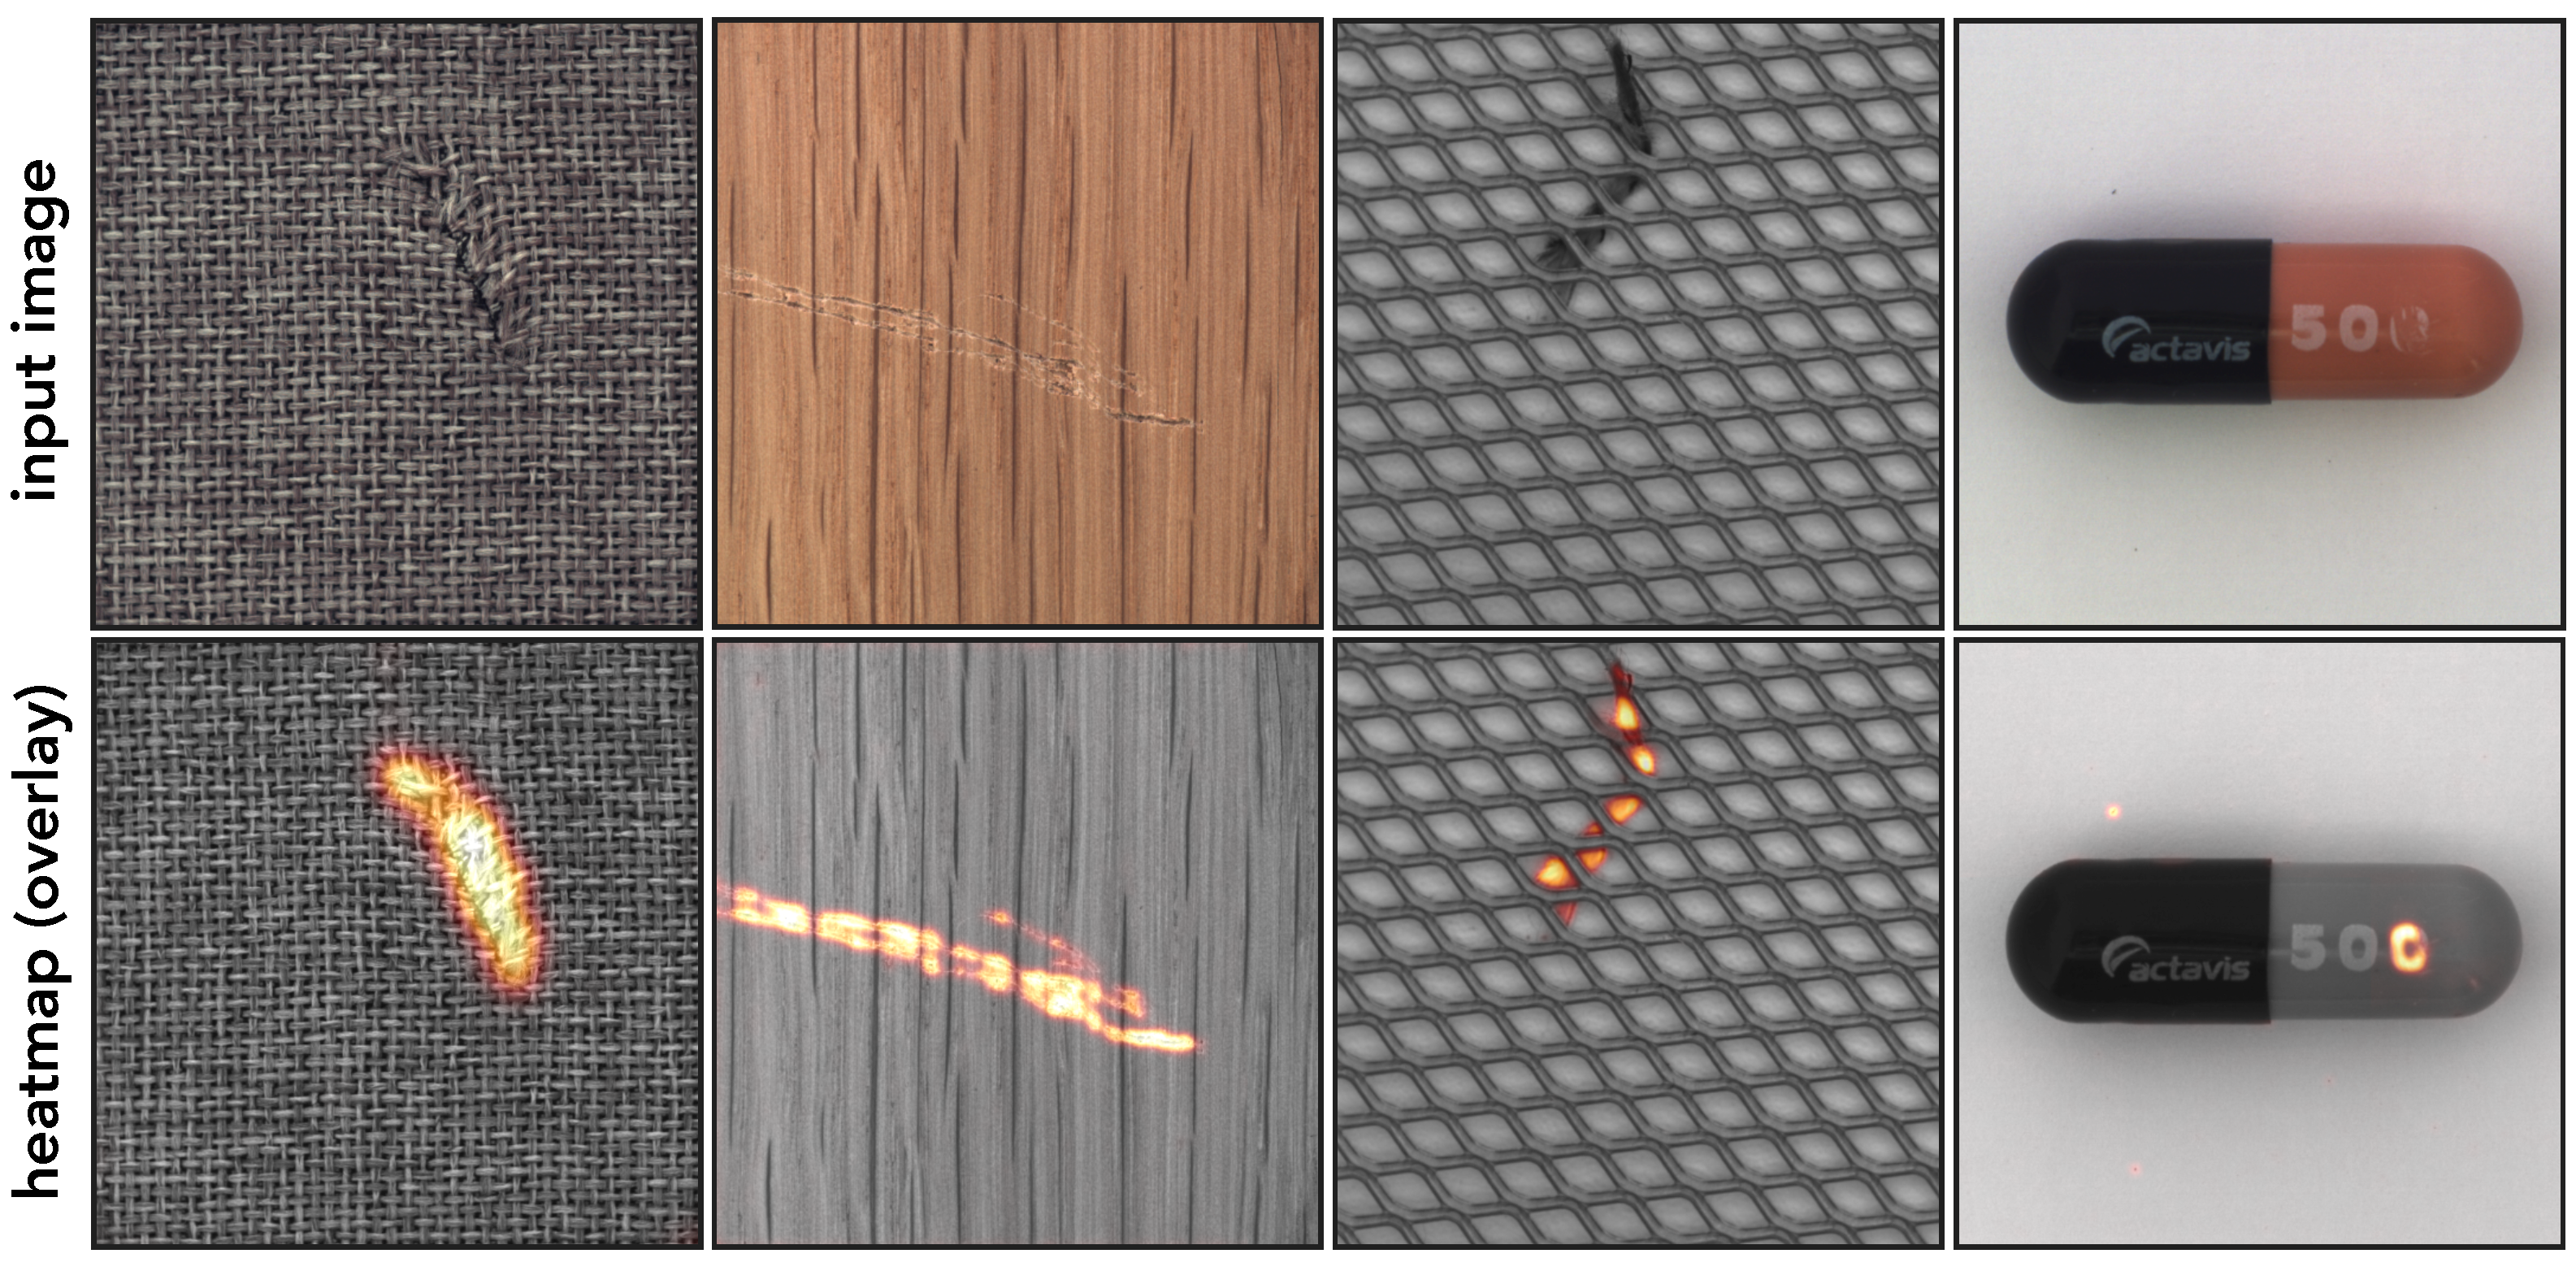
The following theorem describes the technical conditions under which the denoising process (with additive noise) corresponds to the orthogonal projection. We provide a formal proof in Appendix E.
Theorem 2.
Consider a pair of independent MRFs over identically distributed variables with finite fourth moment , variance , and vanishing covariance
for all . Furthermore, let be another MRF, where is an additive noise vector of i.i.d. variables with and . Then, the following holds true:
provided
In the special example of isotropic Gaussian noise , the condition in (22) is reduced to . Here, again, can be identified with the image of the conservative projection, which removes the specific type of noise from its arguments. The equation in (21) then implies its convergence to the orthogonal projection.
5. Experiments
In our experiments, we used the publicly available MVTec AD dataset [95,109]—a popular benchmark for anomaly detection in the manufacturing domain. It provides a diverse dataset with significant variations in materials and anomaly types, organized into 5 texture categories and 10 object categories. Each category encompasses multiple classes of anomalies, with the number of training examples ranging up to several hundred images. For a detailed technical description of the dataset, we direct the reader to the original publication [109]. During training, we artificially increased the amount of data by applying simple data augmentations, such as rotation and flipping, depending on the category. We used 5% of the data as a validation set. For the sake of reproducibility, we mention that for the transistor category, we used a random image rotation by multiples of 90 degrees, in addition to the artificial corruptions, during training. This made the training procedure considerably more challenging, but it proved essential for detecting missing objects.
For each category, we trained a separate model based on the proposed architectures (SDC-AE and SDC-CCM). For both models, we used the same image resolution of pixels for texture and pixels for object categories and the Adam optimizer [110] with initial learning rate of . Note that our model architecture makes no assumptions about the size of the input images. The SDC-AE architecture, in particular, is fully convolutional and can be applied to any input size that is a multiple of the network’s stride after training. However, the input size is an important hyperparameter that influences the final performance of the anomaly detection. The resolution choices of 512 × 512 and 256 × 256 pixels appeared to work well with the considered dataset.
We report the pixel-level and the image-level AUROC metric to illustrate both segmentation and recognition performance in Table 2 and Table 3, respectively. We compare our results (for SCD-AE and SDC-CCM) with a number of previous methods like AnoGAN [6], VAE [9], and LSR [3], including top-ranking algorithms such as RIAD [39], CutPaste [40], InTra [41], DRAEM [38], SimpleNet [94], PatchCore [10], MSFlow [111], and PNI [68]. Our method achieves high performance with both architectures. However, SDC-CCM significantly outperforms SDC-AE in the cable, capsule, and transistor categories due to a reduction in false positive detections, supporting our idea about the CCM module. To further validate our choice of network architecture, we describe an additional ablation study in Appendix I. This study demonstrates the importance of dilated convolutions and the use of fine-grained information from earlier layers in subsequent layers, either through skip connections or the proposed CCM module. To give a sense of the visual quality of the resulting anomaly heatmaps produced by our method, we show a few additional examples in Figure 11.
Table 2.
Experimental results for anomaly segmentation measured with pixel-level AUROC on the MVTec AD dataset.
Table 3.
Experimental results for anomaly recognition measured with image-level AUROC on the MVTec AD dataset.
Figure 11.
Illustration of our anomaly segmentation results (with SDC-CCM) as an overlay of the original image and the anomaly heatmap. Each row shows three random examples from a category (carpet, grid, leather, transistor, and cable) in the MVTec AD dataset. In each pair, the first image represents the input to the model and the second image a corresponding anomaly heatmap.
6. Conclusions
We focused on an important use case for anomaly detection, where the data distribution is supported by a lower-dimensional manifold, and the covariance between neighboring input components vanishes as the distance increases. Our self-supervised approach aims to learn a reconstruction model that repairs artificially corrupted inputs based on a specific form of stochastic occlusions. The resulting training effect regularizes the model to produce locally consistent reconstructions while replacing irregularities, thus acting as a filter that removes anomalous patterns. We demonstrated the effectiveness of our approach by achieving state-of-the-art results on the MVTec AD dataset, a challenging benchmark for visual anomaly detection in the manufacturing domain.
Additionally, we performed a theoretical analysis of the proposed method, providing several interesting insights. As our main result, we showed that as the dimensionality of the inputs increases, the corresponding model approximates a mapping that stochastically converges to the orthogonal projection of partially corrupted inputs onto the submanifold of uncorrupted examples. (According to our training objective in (1), an optimal solution is given by a model , such that . Therefore, does not necessarily lie in and the corresponding approximation error depends on the variance of given ). If the covariance between the input variables (with increasing distance) rapidly approaches zero, the orthogonal projection maps its input in a way that largely preserves the original content, supporting our intuition about the filtering behavior of the model. Therefore, we can jointly perform the detection and localization of corrupted regions using the pixel-wise reconstruction error.
Furthermore, we deepened the understanding of the relationship between regularized autoencoders. Specifically, we showed that the orthogonal projection provides an optimal solution for the RCAE, which was demonstrated to be equivalent to the DAE for small variance in the corruption noise. Our results extend this equivalence to more complex input modifications beyond i.i.d. pixel corruptions and provide a unifying perspective on the regularized autoencoders that is not limited by the assumption of small variance.
Author Contributions
Conceptualization, A.B.; Methodology, A.B.; Software, A.B.; Validation, A.B.; Formal Analysis, A.B.; Investigation, A.B., S.N. and K.-R.M.; Writing—Original Draft, A.B.; Writing—Review and Editing, A.B., S.N. and K.-R.M.; Funding Acquisition, K.-R.M. All authors have read and agreed to the published version of this manuscript.
Funding
A.B., S.N. and K.-R.M. acknowledge support from the German Federal Ministry of Education and Research (BMBF) for BIFOLD under grant Nr. BIFOLD24B. K.-R.M. was also supported by the Institute of Information & communications Technology Planning & Evaluation (IITP) grants funded by the Korea government (MSIT) (No. RS-2019-II190079, Artificial Intelligence Graduate School Program, Korea University and No. RS-2024-00457882, AI Research Hub Project) and by the German Federal Ministry for Education and Research (BMBF) under grants 01IS14013B-E and 01GQ1115.
Data Availability Statement
No new data were created or analyzed in this study.
Conflicts of Interest
The authors declare no conflicts of interest. The funders had no role in the design of this study; in the collection, analyses, or interpretation of data; in the writing of this manuscript; or in the decision to publish the results.
Abbreviations
The following abbreviations are used in this manuscript:
| AD | Anomaly Detection |
| AE | Autoencoder |
| CAE | Contractive Autoencoder |
| DAE | Denoising Autoencoder |
| CCM | Convex Combination Module |
| DNN | Deep Neural Network |
| PAE | Projecting Autoencoder |
| RCAE | Reconstruction Contractive Autoencoder |
| SDC | Stacked Dilated Convolutions |
Appendix A. Auxiliary Statements
In order to prove the formal statements in the main body of this paper, we first introduce a set of auxiliary statements including Theorem A1 and Corollary A1, which themselves provide an additional contribution. For convenience, we extend our notation as follows: Given a vector , a set of indices , and its complement , we interpret the restriction in two different ways depending on the context either as an element or as an element , where the indices in are set to zeros, that is, , and vice versa. Given such notation, we can write .
Lemma A1.
Consider an , and , . The following holds true for all
The proof follows directly by writing
Lemma A2.
For all with for some non-empty sets , , the following holds true for all
Proof.
where, in step , we used Lemma A1 and our assumption . □
Appendix B. Weak Law of Large Numbers for MRFs
Here, we derive a version of the weak law of large numbers adjusted to our case of MRFs with identically distributed but nonindependent variables.
Theorem A1
(Weak Law of Large Numbers for MRFs). Let be a sequence of MRFs over identically distributed variables with finite variance and vanishing covariance
Then the following is true:
Proof.
First, we reorganize the individual terms in the definition of variance as follows:
Let . Since for , there is an , such that for all satisfying , we obtain . Later, we consider . Therefore, we can assume and split the inner sum of the covariance term in the last equation in two sums as follows: Here, we abbreviate the index set and by and , respectively. That is,
where, in the last step, we used, on the one hand, the Cauchy–Schwarz inequality , and, on the other hand, an upper bound L on the cardinality of the running index set in the second sum. Altogether, we obtain the following estimation:
Since the first two terms on the right-hand side converge to zero (for ), and is chosen arbitrarily small, this implies
Finally, for all ,
where in step , we used Chebyshev’s inequality. The convergence
follows from Equation (A5). □
Appendix C. Corollary of Theorem A1
Applying Theorem A1 to our discussion in this paper, we obtain the following useful Corollary.
Corollary A1.
where , , is the angle between the two vectors, and denotes a subset of the variable indices.
Consider a pair of independent MRFs over identically distributed variables with finite fourth moment and vanishing covariance according to
for all . The following statements are true:
Proof.
First, we prove statement in (A8). By setting , we have
On the other hand, we have
Since we assumed , it holds that
Furthermore, due to our assumption in (A7),
That is, the variables satisfy all the requirements in Theorem A1. Applying this Theorem directly to the above derivations proves the claim in (A8).
Now, we prove the statement in (A9). For this purpose, we set . It holds that
On the other hand, we obtain
It remains to be shown that the corresponding variance is finite and that the covariance vanishes. The following holds:
On the other hand,
Based on the above derivations, we now analyze the covariance term,
in the limit . Because of our assumption in (A7), the terms , and converge against , and , respectively. It follows:
Therefore, . Finally, by writing out
and using the independence assumption of and , we can see that the degree of each monomial is upper-bounded by 4. Due to our assumption of a finite fourth moment, this implies . Altogether, the variables satisfy the requirements in Theorem A1. Applying this theorem directly to the above derivations proves the claim in (A9).
The statement in (A10) can be proven in a similar way. Alternatively, we can use the statements in and and apply the limit algebra of convergence in probability
which implies .
Similarly, we prove the statement in (A11) as follows:
□
Appendix D. Proof of Theorem 1
Proof.
Consider the case
where we assume the first inequality to be true and the last inequality holds due to . This implies that
Consider now the following derivation:
where, in the second step, we use . Therefore, it follows from (A16) that
Using the above derivations, we now upper-bound the probability of the corresponding events, where denotes a joint probability distribution over :
where, in step , we use the fact that all the sets in the union are disjoint. Note that we use a short notation and , which runs over all previously defined terms (including ). Next, we consider the above derivations in the limit for , with a fixed ratio . The following holds:
where, in step , we can swap the limit and the sum signs because the series converges for all . The last step follows from Corollary A1. To summarize, we have just shown that
According to Lemma A2, the following holds:
Together, it follows from (A17) and (A18) that
Note that in the above derivation can be identified with the image of under the conservative projection. In order to prove the following equality (where ),
it suffices to show that for all pairs , the following implication holds true:
Namely, the following holds:
where, in step , we use our Definition 3 of the conservative projection. □
Appendix E. Proof of Theorem 2
Lemma A3.
Let , where . Then, the following holds true:
Proof.
The following holds:
□
We now prove Theorem 2. First, we show that
It holds:
It follows that
That is,
We can represent and as a union of disjoint sets according to
and
We obtain a similar representation for and . Now, we consider the above derivations in the limit .
We look at the individual terms on the right-hand side of the equation in (A22) separately.
where, in step , we use the fact that all the sets are disjoint. In step , we swap the limit and the sum signs because the two sums are finite for all . In the last step, we use the weak law of big numbers and its variant for dependent variables with vanishing covariance. Similarly, we obtain
Therefore,
Applying Lemma A3 to the above equation completes the proof:
Appendix F. Proof of Proposition 1
In order to prove Proposition 1 in the main body of this paper, we first introduce a set of auxiliary statements.
Lemma A4.
Let , be idempotent. Then, the equality
holds for all .
Proof.
For any , there is with . It follows that
where, in the penultimate step, we use the idempotency assumption, and, in the last step, . □
Lemma A5.
Let be a differentiable manifold and be differentiable mappings such that for all . Then, the equality
holds true for all , .
Proof.
Let and . Since is a differentiable manifold, there exists a parametrization , such that are differentiable. Because for holds, there exists such that . It follows:
□
Lemma A6.
Let be a differentiable manifold. Consider an orthogonal projection f and another projection g onto . The following holds true for all :
Proof.
Let be fixed. Because , each can be represented as a sum of two vectors , where , . In particular, holds. It follows that
where, in step , we use the orthogonality of f, according to which for all , and for all (according to Lemma A5). In step , we use the fact that the supremum of a corresponding term is achieved for , since , and we can always find a with . In step , we use the following argument: . □
Corollary A2.
Let be a differentiable manifold. Consider an orthogonal projection f and another projection g onto . The following holds true for all :
Proof.
The proof follows directly from Lemma A6. Namely, based in the geometric interpretation, the singular values of matrix A correspond to the length of the major axis of the ellipsoid , which is given by the image of the Euclidian unit ball under the linear transformation A. If the inequality holds for all , is completely contained within . Let and , denote the positive singular values (in descending order) of A and B, respectively. Then, this implies for all . It follows that
In particular, since for all , the singular vectors lying in (and the corresponding singular values) are the same for both matrices. □
Now, we can prove the statement in Proposition 1. Note that any idempotent mapping satisfies and (according to Lemma A5 and Corollary A2) and for all and . Since minimizes both terms of the sum in (11), it is an optimal solution.
Appendix G. Proof of Proposition 2
Consider the plot in Figure 9 illustrating the unit circles with respect to the -norm for centered around the point . Now, choose some p and increase the radius of the unit circle around until it touches the set D, which it represents the submanifold of normal examples. Note that the touching points correspond to the orthogonal projections of onto D with respect to the -norm. For , there are two possible cases for the position of touching points independent of the shape of D. In the first case, the nunit circle touches D at one of its corners. Without loss of generality, assume that this corner is the point for some . This implies that and ; that is, . However, since all norms are equal at the corners of the circle, it also holds that for . On the other hand, if the touching point lies on a side (or on an edge in the higher-dimensional case) of the circle, it implies . Obviously, we also obtain . Consider now an orthogonal projection of D onto spanned by a pair of axes. Note that each circle for at such a touching point has a nonzero curvature toward the interior of the circle. See Figure 9 for an illustration. This implies that the touching point with respect to the -norm must lie within the rectangular triangle shaped by the touching points , and the lines through these points parallel to the two axes. In particular, for all , the touching point lies in a smaller triangle shaped by the points , and the lines through these points parallel to the coordinated axes. For the plot in Figure 9, this means that lies on a red curve between the points and implying . Since this argument is independent of our choice of the axes, it proves statement .
In order to prove the statement in , we provide a counterexample for the equality. Consider an example of a Markov chain describing a simple random walk on the one-dimensional grid of integers illustrated in Figure A1. Precisely, we consider a sequence of i.i.d variables with values in and define a Markov chain according to with . Finally, we define the set of normal examples as the set of all feasible configurations for subsequences of length 5. We can see that there is a mismatch between and . This provides a counterexample for the claim that orthogonal projection maximally preserves uncorrupted regions.
Figure A1.
Illustration of a counterexample for the claim that orthogonal projections maximally preserve normal regions in the inputs. Here, is the modified version of the original input according to the partition and denotes the orthogonal projection of onto with respect to the -norm. This example also shows that orthogonality property is dependent on our choice of the distance metric.
Appendix H. Proof of Proposition 3
In the following, we naturally generalize some properties of Markov chains to the two-dimensional case of MRFs, where the nodes are organized in a grid-like structure similar to that of the Ising model. Here, we omit a formal definition and provide only an idea, which is sufficient for our purposes. Informally, we introduce the notion of the order of an MRF by relating the definition for Markov chains to the width of the corresponding Markov blanket. Furthermore, we generalize the notion of irreducible Markov chains to irreducible MRFs by assuming that each state is reachable from any other state on the chain subgraphs of the MRF, where each node on the chain is farther (with respect to the topology of the MRF graph G) to the start node than all of the previous nodes according to the metric . That is, . Note that the notion of a state at position i on the path now also involves the values of the variables in the neighborhood (corresponding to the Markov blanket) of in the MRF. Essentially, this property is covered by our assumption on the variables being identically distributed with vanishing covariance. Based on this informal extension, we introduce an auxiliary concept that we refer to as the transition set. Consider first a Markov chain of the order with a finite set of possible states . Then, the maximal number of steps required to reach a state from a state is upper-bounded by , that is, by a constant independent of the graph size of the MRF. Namely, when traveling from one node to another, we see at most combinations of states with , which locally affect our path. The shortest path would have no redundant configurations . Therefore, given two patterns and , we can always find (for sufficiently large numbers ) a sequence , such that . This example can be generalized to the MRF by considering the transitions between the individual nodes that respect the values of the surrounding variables in their neighborhoods (or Markov blankets). Basically, this corresponds to considering Markov chains with an increased set of states upper-bounded by . We refer to the set of pixels B as a transition set. See Figure A2 for an illustration.
Figure A2.
Illustration of the concept of a transition set on two examples with different shapes. Each of the two images represents an MRF , of the Markov order with nodes corresponding to the individual pixels with values from a finite set of states , . The grey area marks the corrupted region , where the union of the dark blue and light blue areas is the complement marking the normal region. The dark blue part of corresponds to the transition set . denotes (loosely) the width at the thickest part of the tube B around S.
Now, we can prove the statement in Proposition 3. In the following, we use the notation . Consider now for some feasible . Provided is sufficiently greater than K, we can always find a feasible transition set B such that . It follows that
where, in the penultimate step, we use .
Now, we show . Without loss of generality, we assume that S and B have a square shape with equal-length sides, as illustrated in the right part in Figure A2. That is, each side of the grey square has length . The area of the region corresponding to B is then given by , where W is a graph-independent constant. Furthermore, by putting the last equation in the inequality and solving the resulting quadratic equation, we obtain a criterion that guarantees the existence of a feasible transition set B.
Appendix I. Ablation Study on the Impact of Architectural Components
To highlight the benefits of our model architecture, we performed an additional ablation study on several categories of the MVTec AD dataset. In this study, we compared different architectures, including U-net, SDC-AE, SDC-AE with skip connections, and SDC-CCM. For consistency, we used the same hyperparameters , in Equation (3) when evaluating performance, except for the ’transistor’ category, where . The corresponding results are presented in the tables below. Note that U-net-small refers to a simplified version of U-net [98], where the middle layers with the smallest resolution were removed to roughly match the number of layers in SDC-AE and SDC-CCM. This modification resulted in a significant performance boost, suggesting that the original U-net may be too deep. The evaluation results underscore the importance of utilizing fine-grained information from the earlier layers in the network, either through skip connections or the proposed CCM module.
Table A1.
Experimental results for anomaly segmentation measured with pixel-level AUROC on the MVTec AD dataset.
Table A1.
Experimental results for anomaly segmentation measured with pixel-level AUROC on the MVTec AD dataset.
| Category | U-Net | U-Net-Small | SDC-AE | SDC-AE (+Skip) | SDC-CCM |
|---|---|---|---|---|---|
| carpet | 65.7 ± 0.81 | 99.4 ± 0.02 | 99.6 ± 0.02 | 99.4 ± 0.03 | 99.4 ± 0.09 |
| grid | 70.3 ± 1.94 | 99.6 ± 0.00 | 99.6 ± 0.00 | 99.6 ± 0.00 | 99.6 ± 0.00 |
| leather | 80.3 ± 0.80 | 99.6 ± 0.03 | 99.4 ± 0.08 | 99.1 ± 0.36 | 99.4 ± 0.07 |
| tile | 58.6 ± 1.16 | 98.4 ± 0.10 | 97.9 ± 0.00 | 98.5 ± 0.08 | 98.4 ± 0.25 |
| cable | 89.4 ± 0.10 | 96.8 ± 0.09 | 94.5 ± 0.05 | 97.7 ± 0.26 | 98.1 ± 0.16 |
| transistor | 87.1 ± 0.49 | 88.5 ± 0.20 | 89.2 ± 0.17 | 91.0 ± 0.27 | 91.3 ± 0.84 |
| avg. all | 75.2 ± 11.25 | 97.05 ± 0.07 | 96.7 ± 3.79 | 97.6 ± 2.99 | 97.7 ± 2.98 |
Table A2.
Experimental results for anomaly recognition measured with image-level AUROC on the MVTec AD dataset.
Table A2.
Experimental results for anomaly recognition measured with image-level AUROC on the MVTec AD dataset.
| Category | U-Net | U-Net-Small | SDC-AE | SDC-AE (+Skip) | SDC-CCM |
|---|---|---|---|---|---|
| carpet | 39.5 ± 0.58 | 99.2 ± 0.24 | 99.3 ± 0.04 | 99.4 ± 0.00 | 99.6 ± 0.25 |
| grid | 84.2 ± 0.13 | 100 ± 0.00 | 100 ± 0.00 | 100 ± 0.00 | 100 ± 0.00 |
| leather | 77.4 ± 3.45 | 98.0 ± 1.24 | 99.0 ± 0.19 | 97.9 ± 0.82 | 99.4 ± 0.15 |
| tile | 81.6 ± 0.78 | 98.9 ± 0.18 | 98.5 ± 0.05 | 99.6 ± 0.41 | 99.6 ± 0.25 |
| cable | 57.0 ± 0.66 | 93.6 ± 0.23 | 67.4 ± 1.64 | 94.2 ± 0.03 | 96.2 ± 0.16 |
| transistor | 64.5 ± 1.94 | 97.6 ± 0.02 | 81.2 ± 1.54 | 97.2 ± 0.19 | 96.6 ± 0.38 |
| avg. all | 67.4 ± 15.70 | 97.9 ± 0.32 | 90.9 ± 12.4 | 98.1 ± 1.98 | 98.6 ± 1.55 |
Finally, we note that dilated convolutions allow access to more context within the image, which in some cases improves upon the reconstruction quality. In particular, models without dilated convolutions (without SDC) suffer from the blind spot illustrated in Figure A3. This might occur in larger anomalous regions due to the insufficient context provided by the normal areas, ultimately resulting in predictions that average all possibilities.
Figure A3.
Illustration of the importance of modeling long-range dependencies facilitated by dilated convolutions for achieving accurate reconstruction. We can observe how the reconstruction of the model without the SDC modules (middle image) suffers from a blind spot effect toward the center of the corrupted region. This happens due to the insufficient context provided by the normal areas, forcing the model to predict an average of all possibilities.
Appendix J. Illustration of Qualitative Improvement in Reconstruction When Using SDC-CCM over SDC-AE
As outlined in the main body of this paper, in order to achieve high detection and localization performance based on the reconstruction error, the model must replace corrupted regions in the input images with a different content. At the same time, it is important to reproduce uncorrupted regions as accurately as possible to reduce the chance of false positive detections. In this sense, the overall reconstruction quality of the original content during training correlates strongly with the ability of the corresponding model to detect anomalous samples. We compared the reconstruction performance of two model architecture, which we refer to as SDC-AE and SDC-CCM in this paper. During our empirical evaluation, we observed that while SDC-AE generally achieved good reconstruction, it could sometimes result in a higher number of false positive detections compared to SDC-CCM. For example, it struggled to reproduce normal regions that were characterized by frequent changes in the gradient along neighboring pixel values in two object categories, “cable” and “transistor”, from the MVTec AD dataset. In contrast, SDC-CCM accurately reconstructs these regions, resulting in a significant reduction in false positive detections. We show several examples in Figure A4. Similarly, we observed an improvement in reconstruction quality for texture categories. However, the corresponding heatmaps show similar quality. We provide a few examples in Figure A5.
Figure A4.
Illustration of the qualitative improvement when using SDC-CCM over SDC-AE. We show six examples: three from the "cable" category and three from the "transistor" category of the MVTec AD dataset. Each row displays the original image, the reconstruction produced by SDC-CCM (reconstruction II), the reconstruction produced by SDC-AE (reconstruction I), the anomaly heatmap from SDC-CCM (anomaly heatmap II), and the anomaly heatmap from SDC-AE (anomaly heatmap I). Note the significant improvement in the quality of the heatmaps.
Figure A5.
Illustration of the qualitative improvement when using SDC-CCM over SDC-AE on texture categories from the MVTec AD dataset. We show five examples, one from each of the following categories: “carpet”, “grid”, “leather”, “tile”, and “wood”. Each row displays the original image, the reconstruction produced by SDC-CCM (reconstruction II), the reconstruction produced by SDC-AE (reconstruction I), the anomaly heatmap from SDC-CCM (anomaly heatmap II), and the anomaly heatmap from SDC-AE (anomaly heatmap I).
References
- Haselmann, M.; Gruber, D.P.; Tabatabai, P. Anomaly Detection Using Deep Learning Based Image Completion. In Proceedings of the 17th IEEE International Conference on Machine Learning and Applications, ICMLA 2018, Orlando, FL, USA, 17–20 December 2018; Wani, M.A., Kantardzic, M.M., Mouchaweh, M.S., Gama, J., Lughofer, E., Eds.; IEEE: Piscataway, NJ, USA, 2018; pp. 1237–1242. [Google Scholar]
- Bergmann, P.; Löwe, S.; Fauser, M.; Sattlegger, D.; Steger, C. Improving Unsupervised Defect Segmentation by Applying Structural Similarity to Autoencoders. In Proceedings of the 14th International Joint Conference on Computer Vision, Imaging and Computer Graphics Theory and Applications, VISIGRAPP 2019, Volume 5: VISAPP, Prague, Czech Republic, 25–27 February 2019; Trémeau, A., Farinella, G.M., Braz, J., Eds.; SciTePress: Setúbal Municipality, Portugal, 2019; pp. 372–380. [Google Scholar]
- Wang, L.; Zhang, D.; Guo, J.; Han, Y. Image Anomaly Detection Using Normal Data only by Latent Space Resampling. Appl. Sci. 2020, 10, 8660. [Google Scholar] [CrossRef]
- Bergmann, P.; Fauser, M.; Sattlegger, D.; Steger, C. Uninformed Students: Student-Teacher Anomaly Detection with Discriminative Latent Embeddings. In Proceedings of the 2020 IEEE/CVF Conference on Computer Vision and Pattern Recognition, CVPR 2020, Seattle, WA, USA, 13–19 June 2020; pp. 4182–4191. [Google Scholar]
- Venkataramanan, S.; Peng, K.; Singh, R.V.; Mahalanobis, A. Attention Guided Anomaly Localization in Images. In Proceedings of the Computer Vision—ECCV 2020—16th European Conference, Glasgow, UK, 23–28 August 2020; Proceedings, Part XVII; Lecture Notes in Computer Science. Vedaldi, A., Bischof, H., Brox, T., Frahm, J., Eds.; Springer: Berlin/Heidelberg, Germany, 2020; Volume 12362, pp. 485–503. [Google Scholar]
- Schlegl, T.; Seeböck, P.; Waldstein, S.M.; Schmidt-Erfurth, U.; Langs, G. Unsupervised Anomaly Detection with Generative Adversarial Networks to Guide Marker Discovery. In Proceedings of the Information Processing in Medical Imaging—25th International Conference, IPMI 2017, Boone, NC, USA, 25–30 June 2017; Proceedings; Lecture Notes in Computer Science. Niethammer, M., Styner, M., Aylward, S.R., Zhu, H., Oguz, I., Yap, P., Shen, D., Eds.; Springer: Berlin/Heidelberg, Germany, 2017; Volume 10265, pp. 146–157. [Google Scholar]
- Napoletano, P.; Piccoli, F.; Schettini, R. Anomaly Detection in Nanofibrous Materials by CNN-Based Self-Similarity. Sensors 2018, 18, 209. [Google Scholar] [CrossRef]
- Böttger, T.; Ulrich, M. Real-time texture error detection on textured surfaces with compressed sensing. Pattern Recognit. Image Anal. 2016, 26, 88–94. [Google Scholar] [CrossRef]
- Liu, W.; Li, R.; Zheng, M.; Karanam, S.; Wu, Z.; Bhanu, B.; Radke, R.J.; Camps, O.I. Towards Visually Explaining Variational Autoencoders. In Proceedings of the 2020 IEEE/CVF Conference on Computer Vision and Pattern Recognition, CVPR 2020, Seattle, WA, USA, 13–19 June 2020; pp. 8639–8648. [Google Scholar]
- Roth, K.; Pemula, L.; Zepeda, J.; Schölkopf, B.; Brox, T.; Gehler, P.V. Towards Total Recall in Industrial Anomaly Detection. In Proceedings of the IEEE/CVF Conference on Computer Vision and Pattern Recognition, CVPR 2022, New Orleans, LA, USA, 18–24 June 2022; pp. 14298–14308. [Google Scholar]
- Wan, Q.; Gao, L.; Li, X.; Wen, L. Industrial Image Anomaly Localization Based on Gaussian Clustering of Pretrained Feature. IEEE Trans. Ind. Electron. 2022, 69, 6182–6192. [Google Scholar] [CrossRef]
- Chen, X.; Konukoglu, E. Unsupervised Detection of Lesions in Brain MRI using constrained adversarial auto-encoders. arXiv 2018, arXiv:1806.04972. [Google Scholar]
- Schlegl, T.; Seeböck, P.; Waldstein, S.M.; Langs, G.; Schmidt-Erfurth, U. f-AnoGAN: Fast unsupervised anomaly detection with generative adversarial networks. Med. Image Anal. 2019, 54, 30–44. [Google Scholar] [CrossRef]
- Tan, J.; Hou, B.; Day, T.; Simpson, J.M.; Rueckert, D.; Kainz, B. Detecting Outliers with Poisson Image Interpolation. In Proceedings of the Medical Image Computing and Computer Assisted Intervention—MICCAI 2021—24th International Conference, Strasbourg, France, 27 September–1 October 2021; Proceedings, Part V; Lecture Notes in Computer Science. de Bruijne, M., Cattin, P.C., Cotin, S., Padoy, N., Speidel, S., Zheng, Y., Essert, C., Eds.; Springer: Berlin/Heidelberg, Germany, 2021; Volume 12905, pp. 581–591. [Google Scholar]
- Zimmerer, D.; Isensee, F.; Petersen, J.; Kohl, S.; Maier-Hein, K.H. Unsupervised Anomaly Localization Using Variational Auto-Encoders. In Proceedings of the Medical Image Computing and Computer Assisted Intervention—MICCAI 2019—22nd International Conference, Shenzhen, China, 13–17 October 2019; Proceedings, Part IV; Lecture Notes in Computer Science. Shen, D., Liu, T., Peters, T.M., Staib, L.H., Essert, C., Zhou, S., Yap, P., Khan, A.R., Eds.; Springer: Berlin/Heidelberg, Germany, 2019; Volume 11767, pp. 289–297. [Google Scholar]
- Abati, D.; Porrello, A.; Calderara, S.; Cucchiara, R. Latent Space Autoregression for Novelty Detection. In Proceedings of the IEEE Conference on Computer Vision and Pattern Recognition, CVPR 2019, Long Beach, CA, USA, 16–20 June 2019; pp. 481–490. [Google Scholar]
- Defard, T.; Setkov, A.; Loesch, A.; Audigier, R. PaDiM: A Patch Distribution Modeling Framework for Anomaly Detection and Localization. In Proceedings of the Pattern Recognition. ICPR International Workshops and Challenges, Virtual Event, 10–15 January 2021; Proceedings, Part IV; Lecture Notes in Computer Science. Bimbo, A.D., Cucchiara, R., Sclaroff, S., Farinella, G.M., Mei, T., Bertini, M., Escalante, H.J., Vezzani, R., Eds.; Springer: Berlin/Heidelberg, Germany, 2020; Volume 12664, pp. 475–489. [Google Scholar]
- Hotelling, H. Analysis of a complex of statistical variables into principal components. J. Educ. Psychol. 1933, 24, 417–441. [Google Scholar] [CrossRef]
- Schölkopf, B.; Smola, A.J.; Müller, K. Nonlinear Component Analysis as a Kernel Eigenvalue Problem. Neural Comput. 1998, 10, 1299–1319. [Google Scholar] [CrossRef]
- Hoffmann, H. Kernel PCA for novelty detection. Pattern Recognit. 2007, 40, 863–874. [Google Scholar] [CrossRef]
- Schölkopf, B.; Platt, J.C.; Shawe-Taylor, J.; Smola, A.J.; Williamson, R.C. Estimating the Support of a High-Dimensional Distribution. Neural Comput. 2001, 13, 1443–1471. [Google Scholar] [CrossRef] [PubMed]
- Tax, D.M.J.; Duin, R.P.W. Support Vector Data Description. Mach. Learn. 2004, 54, 45–66. [Google Scholar] [CrossRef]
- Knorr, E.M.; Ng, R.T.; Tucakov, V. Distance-Based Outliers: Algorithms and Applications. VLDB J. 2000, 8, 237–253. [Google Scholar] [CrossRef]
- Ramaswamy, S.; Rastogi, R.; Shim, K. Efficient Algorithms for Mining Outliers from Large Data Sets. In Proceedings of the 2000 ACM SIGMOD International Conference on Management of Data, Dallas, TX, USA, 16–18 May 2000; Chen, W., Naughton, J.F., Bernstein, P.A., Eds.; ACM: New York, NY, USA, 2000; pp. 427–438. [Google Scholar]
- Parzen, E. On estimation of a probability density function and mode. Ann. Math. Statist 1962, 33, 106–1076. [Google Scholar] [CrossRef]
- Principi, E.; Vesperini, F.; Squartini, S.; Piazza, F. Acoustic novelty detection with adversarial autoencoders. In Proceedings of the 2017 International Joint Conference on Neural Networks, IJCNN 2017, Anchorage, AK, USA, 14–19 May 2017; pp. 3324–3330. [Google Scholar]
- Chalapathy, R.; Menon, A.K.; Chawla, S. Robust, Deep and Inductive Anomaly Detection. In Proceedings of the Machine Learning and Knowledge Discovery in Databases—European Conference, ECML PKDD 2017, Skopje, Macedonia, 18–22 September 2017; Proceedings, Part I; Lecture Notes in Computer Science. Ceci, M., Hollmén, J., Todorovski, L., Vens, C., Dzeroski, S., Eds.; Springer: Berlin/Heidelberg, Germany, 2017; Volume 10534, pp. 36–51. [Google Scholar]
- Kieu, T.; Yang, B.; Guo, C.; Jensen, C.S. Outlier Detection for Time Series with Recurrent Autoencoder Ensembles. In Proceedings of the Twenty-Eighth International Joint Conference on Artificial Intelligence, IJCAI 2019, Macao, China, 10–16 August 2019; Kraus, S., Ed.; 2019; pp. 2725–2732. [Google Scholar]
- Zhou, C.; Paffenroth, R.C. Anomaly Detection with Robust Deep Autoencoders. In Proceedings of the 23rd ACM SIGKDD International Conference on Knowledge Discovery and Data Mining, Halifax, NS, Canada, 13–17 August 2017; ACM: New York, NY, USA, 2017; pp. 665–674. [Google Scholar]
- Zong, B.; Song, Q.; Min, M.R.; Cheng, W.; Lumezanu, C.; Cho, D.; Chen, H. Deep Autoencoding Gaussian Mixture Model for Unsupervised Anomaly Detection. In Proceedings of the 6th International Conference on Learning Representations, ICLR 2018, Vancouver, BC, Canada, 30 April–3 May 2018. [Google Scholar]
- Kim, K.H.; Shim, S.; Lim, Y.; Jeon, J.; Choi, J.; Kim, B.; Yoon, A.S. RaPP: Novelty Detection with Reconstruction along Projection Pathway. In Proceedings of the 8th International Conference on Learning Representations, ICLR 2020, Addis Ababa, Ethiopia, 26–30 April 2020. [Google Scholar]
- Deng, J.; Zhang, Z.; Marchi, E.; Schuller, B.W. Sparse Autoencoder-Based Feature Transfer Learning for Speech Emotion Recognition. In Proceedings of the 2013 Humaine Association Conference on Affective Computing and Intelligent Interaction, ACII 2013, Geneva, Switzerland, 2–5 September 2013; pp. 511–516. [Google Scholar]
- Erfani, S.M.; Rajasegarar, S.; Karunasekera, S.; Leckie, C. High-dimensional and large-scale anomaly detection using a linear one-class SVM with deep learning. Pattern Recognit. 2016, 58, 121–134. [Google Scholar] [CrossRef]
- Kim, M.; Kim, J.; Yu, J.; Choi, J.K. Active anomaly detection based on deep one-class classification. Pattern Recognit. Lett. 2023, 167, 18–24. [Google Scholar] [CrossRef]
- Ruff, L.; Görnitz, N.; Deecke, L.; Siddiqui, S.A.; Vandermeulen, R.A.; Binder, A.; Müller, E.; Kloft, M. Deep One-Class Classification. In Proceedings of the 35th International Conference on Machine Learning, ICML 2018, Stockholmsmässan, Stockholm, Sweden, 10–15 July 2018; Proceedings of Machine Learning Research. Dy, J.G., Krause, A., Eds.; 2018; Volume 80, pp. 4390–4399. [Google Scholar]
- Golan, I.; El-Yaniv, R. Deep Anomaly Detection Using Geometric Transformations. In Proceedings of the Advances in Neural Information Processing Systems 31: Annual Conference on Neural Information Processing Systems 2018, NeurIPS 2018, Montréal, QC, Canada, 3–8 December 2018; Bengio, S., Wallach, H.M., Larochelle, H., Grauman, K., Cesa-Bianchi, N., Garnett, R., Eds.; pp. 9781–9791. [Google Scholar]
- Tack, J.; Mo, S.; Jeong, J.; Shin, J. CSI: Novelty Detection via Contrastive Learning on Distributionally Shifted Instances. In Proceedings of the Advances in Neural Information Processing Systems 33: Annual Conference on Neural Information Processing Systems 2020, NeurIPS 2020, Virtual, 6–12 December 2020; Larochelle, H., Ranzato, M., Hadsell, R., Balcan, M., Lin, H., Eds.; [Google Scholar]
- Zavrtanik, V.; Kristan, M.; Skocaj, D. DRÆM—A discriminatively trained reconstruction embedding for surface anomaly detection. In Proceedings of the 2021 IEEE/CVF International Conference on Computer Vision, ICCV 2021, Montreal, QC, Canada, 10–17 October 2021; pp. 8310–8319. [Google Scholar]
- Zavrtanik, V.; Kristan, M.; Skocaj, D. Reconstruction by inpainting for visual anomaly detection. Pattern Recognit. 2021, 112, 107706. [Google Scholar] [CrossRef]
- Li, C.; Sohn, K.; Yoon, J.; Pfister, T. CutPaste: Self-Supervised Learning for Anomaly Detection and Localization. In Proceedings of the IEEE Conference on Computer Vision and Pattern Recognition, CVPR 2021, Virtual, 19–25 June 2021; pp. 9664–9674. [Google Scholar]
- Pirnay, J.; Chai, K. Inpainting Transformer for Anomaly Detection. In Proceedings of the Image Analysis and Processing—ICIAP 2022—21st International Conference, Lecce, Italy, 23–27 May 2022; Proceedings, Part II; Lecture Notes in Computer Science. Sclaroff, S., Distante, C., Leo, M., Farinella, G.M., Tombari, F., Eds.; Springer: Berlin/Heidelberg, Germany, 2022; Volume 13232, pp. 394–406. [Google Scholar]
- Lee, S.; Lee, S.; Song, B.C. CFA: Coupled-Hypersphere-Based Feature Adaptation for Target-Oriented Anomaly Localization. IEEE Access 2022, 10, 78446–78454. [Google Scholar] [CrossRef]
- Kim, D.; Park, C.; Cho, S.; Lee, S. FAPM: Fast Adaptive Patch Memory for Real-time Industrial Anomaly Detection. arXiv 2022, arXiv:2211.07381. [Google Scholar]
- Bae, J.; Lee, J.; Kim, S. Image Anomaly Detection and Localization with Position and Neighborhood Information. arXiv 2022, arXiv:2211.12634. [Google Scholar]
- Tsai, C.; Wu, T.; Lai, S. Multi-Scale Patch-Based Representation Learning for Image Anomaly Detection and Segmentation. In Proceedings of the IEEE/CVF Winter Conference on Applications of Computer Vision, WACV 2022, Waikoloa, HI, USA, 3–8 January 2022; pp. 3065–3073. [Google Scholar]
- Zou, Y.; Jeong, J.; Pemula, L.; Zhang, D.; Dabeer, O. SPot-the-Difference Self-supervised Pre-training for Anomaly Detection and Segmentation. In Proceedings of the Computer Vision—ECCV 2022—17th European Conference, Tel Aviv, Israel, 23–27 October 2022; Proceedings, Part XXX; Lecture Notes in Computer Science. Avidan, S., Brostow, G.J., Cissé, M., Farinella, G.M., Hassner, T., Eds.; Springer: Berlin/Heidelberg, Germany, 2022; Volume 13690, pp. 392–408. [Google Scholar]
- Li, N.; Jiang, K.; Ma, Z.; Wei, X.; Hong, X.; Gong, Y. Anomaly Detection Via Self-Organizing Map. In Proceedings of the 2021 IEEE International Conference on Image Processing, ICIP 2021, Anchorage, AK, USA, 19–22 September 2021; pp. 974–978. [Google Scholar]
- Salehi, M.; Sadjadi, N.; Baselizadeh, S.; Rohban, M.H.; Rabiee, H.R. Multiresolution Knowledge Distillation for Anomaly Detection. In Proceedings of the IEEE Conference on Computer Vision and Pattern Recognition, CVPR 2021, Virtual, 19–25 June 2021; pp. 14902–14912. [Google Scholar]
- Deng, H.; Li, X. Anomaly Detection via Reverse Distillation from One-Class Embedding. In Proceedings of the IEEE/CVF Conference on Computer Vision and Pattern Recognition, CVPR 2022, New Orleans, LA, USA, 18–24 June 2022; pp. 9727–9736. [Google Scholar]
- Rudolph, M.; Wehrbein, T.; Rosenhahn, B.; Wandt, B. Asymmetric Student-Teacher Networks for Industrial Anomaly Detection. In Proceedings of the IEEE/CVF Winter Conference on Applications of Computer Vision, WACV 2023, Waikoloa, HI, USA, 2–7 January 2023; pp. 2591–2601. [Google Scholar]
- Cao, Y.; Wan, Q.; Shen, W.; Gao, L. Informative knowledge distillation for image anomaly segmentation. Knowl. Based Syst. 2022, 248, 108846. [Google Scholar] [CrossRef]
- Zhang, K.; Wang, B.; Kuo, C.J. PEDENet: Image anomaly localization via patch embedding and density estimation. Pattern Recognit. Lett. 2022, 153, 144–150. [Google Scholar] [CrossRef]
- Wan, Q.; Gao, L.; Li, X.; Wen, L. Unsupervised Image Anomaly Detection and Segmentation Based on Pretrained Feature Mapping. IEEE Trans. Ind. Inform. 2023, 19, 2330–2339. [Google Scholar] [CrossRef]
- Wan, Q.; Cao, Y.; Gao, L.; Shen, W.; Li, X. Position Encoding Enhanced Feature Mapping for Image Anomaly Detection. In Proceedings of the 18th IEEE International Conference on Automation Science and Engineering, CASE 2022, Mexico City, Mexico, 20–24 August 2022; pp. 876–881. [Google Scholar]
- Zheng, Y.; Wang, X.; Deng, R.; Bao, T.; Zhao, R.; Wu, L. Focus Your Distribution: Coarse-to-Fine Non-Contrastive Learning for Anomaly Detection and Localization. In Proceedings of the IEEE International Conference on Multimedia and Expo, ICME 2022, Taipei, Taiwan, 18–22 July 2022; pp. 1–6. [Google Scholar]
- Gudovskiy, D.A.; Ishizaka, S.; Kozuka, K. CFLOW-AD: Real-Time Unsupervised Anomaly Detection with Localization via Conditional Normalizing Flows. In Proceedings of the IEEE/CVF Winter Conference on Applications of Computer Vision, WACV 2022, Waikoloa, HI, USA, 3–8 January 2022; pp. 1819–1828. [Google Scholar]
- Kim, Y.; Jang, H.; Lee, D.; Choi, H. AltUB: Alternating Training Method to Update Base Distribution of Normalizing Flow for Anomaly Detection. arXiv 2022, arXiv:2210.14913. [Google Scholar]
- Yi, J.; Yoon, S. Patch SVDD: Patch-Level SVDD for Anomaly Detection and Segmentation. In Proceedings of the Computer Vision—ACCV 2020—15th Asian Conference on Computer Vision, Kyoto, Japan, 30 November–4 December 2020; Revised Selected Papers, Part VI; Lecture Notes in Computer Science. Ishikawa, H., Liu, C., Pajdla, T., Shi, J., Eds.; Springer: Berlin/Heidelberg, Germany, 2020; Volume 12627, pp. 375–390. [Google Scholar]
- Hu, C.; Chen, K.; Shao, H. A Semantic-Enhanced Method Based On Deep SVDD for Pixel-Wise Anomaly Detection. In Proceedings of the 2021 IEEE International Conference on Multimedia and Expo, ICME 2021, Shenzhen, China, 5–9 July 2021; pp. 1–6. [Google Scholar]
- Yang, M.; Wu, P.; Feng, H. MemSeg: A semi-supervised method for image surface defect detection using differences and commonalities. Eng. Appl. Artif. Intell. 2023, 119, 105835. [Google Scholar] [CrossRef]
- Yan, Y.; Wang, D.; Zhou, G.; Chen, Q. Unsupervised Anomaly Segmentation Via Multilevel Image Reconstruction and Adaptive Attention-Level Transition. IEEE Trans. Instrum. Meas. 2021, 70, 5015712. [Google Scholar] [CrossRef]
- Collin, A.; Vleeschouwer, C.D. Improved anomaly detection by training an autoencoder with skip connections on images corrupted with Stain-shaped noise. In Proceedings of the 25th International Conference on Pattern Recognition, ICPR 2020, Virtual Event/Milan, Italy, 10–15 January 2021; pp. 7915–7922. [Google Scholar]
- Tao, X.; Zhang, D.; Ma, W.; Hou, Z.; Lu, Z.; Adak, C. Unsupervised Anomaly Detection for Surface Defects with Dual-Siamese Network. IEEE Trans. Ind. Inform. 2022, 18, 7707–7717. [Google Scholar] [CrossRef]
- Liu, T.; Li, B.; Zhao, Z.; Du, X.; Jiang, B.; Geng, L. Reconstruction from edge image combined with color and gradient difference for industrial surface anomaly detection. arXiv 2022, arXiv:2210.14485. [Google Scholar]
- Kim, D.; Jeong, D.; Kim, H.; Chong, K.; Kim, S.; Cho, H. Spatial Contrastive Learning for Anomaly Detection and Localization. IEEE Access 2022, 10, 17366–17376. [Google Scholar] [CrossRef]
- Huang, C.; Xu, Q.; Wang, Y.; Wang, Y.; Zhang, Y. Self-Supervised Masking for Unsupervised Anomaly Detection and Localization. arXiv 2022, arXiv:2205.06568. [Google Scholar] [CrossRef]
- Liznerski, P.; Ruff, L.; Vandermeulen, R.A.; Franks, B.J.; Kloft, M.; Müller, K.R. Explainable Deep One-Class Classification. In Proceedings of the 9th International Conference on Learning Representations, ICLR 2021, Virtual Event, 3–7 May 2021. [Google Scholar]
- Bae, J.; Lee, J.; Kim, S. PNI: Industrial Anomaly Detection using Position and Neighborhood Information. In Proceedings of the IEEE/CVF International Conference on Computer Vision, ICCV 2023, Paris, France, 1–6 October 2023; pp. 6350–6360. [Google Scholar]
- Schlüter, H.M.; Tan, J.; Hou, B.; Kainz, B. Natural Synthetic Anomalies for Self-supervised Anomaly Detection and Localization. In Proceedings of the Computer Vision—ECCV 2022—17th European Conference, Tel Aviv, Israel, 23–27 October 2022; Proceedings, Part XXXI; Lecture Notes in Computer Science. Avidan, S., Brostow, G.J., Cissé, M., Farinella, G.M., Hassner, T., Eds.; Springer: Berlin/Heidelberg, Germany, 2022; Volume 13691, pp. 474–489. [Google Scholar]
- Dehaene, D.; Frigo, O.; Combrexelle, S.; Eline, P. Iterative energy-based projection on a normal data manifold for anomaly localization. In Proceedings of the 8th International Conference on Learning Representations, ICLR 2020, Addis Ababa, Ethiopia, 26–30 April 2020. [Google Scholar]
- Höner, J.; Nakajima, S.; Bauer, A.; Müller, K.R.; Görnitz, N. Minimizing Trust Leaks for Robust Sybil Detection. In Proceedings of the 34th International Conference on Machine Learning, ICML 2017, Sydney, NSW, Australia, 6–11 August 2017; Proceedings of Machine Learning Research. Precup, D., Teh, Y.W., Eds.; 2017; Volume 70, pp. 1520–1528. [Google Scholar]
- Song, J.W.; Kong, K.; Park, Y.I.; Kim, S.G.; Kang, S. AnoSeg: Anomaly Segmentation Network Using Self-Supervised Learning. arXiv 2021, arXiv:2110.03396. [Google Scholar]
- Kohlbrenner, M.; Bauer, A.; Nakajima, S.; Binder, A.; Samek, W.; Lapuschkin, S. Towards Best Practice in Explaining Neural Network Decisions with LRP. In Proceedings of the 2020 International Joint Conference on Neural Networks, IJCNN 2020, Glasgow, UK, 19–24 July 2020; pp. 1–7. [Google Scholar]
- Lee, Y.; Kang, P. AnoViT: Unsupervised Anomaly Detection and Localization with Vision Transformer-Based Encoder-Decoder. IEEE Access 2022, 10, 46717–46724. [Google Scholar] [CrossRef]
- Jiang, J.; Zhu, J.; Bilal, M.; Cui, Y.; Kumar, N.; Dou, R.; Su, F.; Xu, X. Masked Swin Transformer Unet for Industrial Anomaly Detection. IEEE Trans. Ind. Inform. 2023, 19, 2200–2209. [Google Scholar] [CrossRef]
- Wu, J.; Chen, D.; Fuh, C.; Liu, T. Learning Unsupervised Metaformer for Anomaly Detection. In Proceedings of the 2021 IEEE/CVF International Conference on Computer Vision, ICCV 2021, Montreal, QC, Canada, 10–17 October 2021; pp. 4349–4358. [Google Scholar]
- Jiang, X.; Liu, J.; Wang, J.; Nie, Q.; Wu, K.; Liu, Y.; Wang, C.; Zheng, F. SoftPatch: Unsupervised Anomaly Detection with Noisy Data. In Proceedings of the NeurIPS, New Orleans, LA, USA, 28 November–9 December 2022. [Google Scholar]
- Ruff, L.; Kauffmann, J.R.; Vandermeulen, R.A.; Samek, W.; Kloft, M.; Dietterich, T.G.; Müller, K.R. A Unifying Review of Deep and Shallow Anomaly Detection. Proc. IEEE 2021, 109, 756–795. [Google Scholar] [CrossRef]
- Kauffmann, J.; Müller, K.R.; Montavon, G. Towards explaining anomalies: A deep Taylor decomposition of one-class models. Pattern Recognit. 2020, 101, 107198. [Google Scholar] [CrossRef]
- Chong, P.; Ruff, L.; Kloft, M.; Binder, A. Simple and Effective Prevention of Mode Collapse in Deep One-Class Classification. In Proceedings of the 2020 International Joint Conference on Neural Networks, IJCNN 2020, Glasgow, UK, 19–24 July 2020; pp. 1–9. [Google Scholar]
- Hu, C.; Feng, Y.; Kamigaito, H.; Takamura, H.; Okumura, M. One-class Text Classification with Multi-modal Deep Support Vector Data Description. In Proceedings of the 16th Conference of the European Chapter of the Association for Computational Linguistics: Main Volume, EACL 2021, Online, 19–23 April 2021; Merlo, P., Tiedemann, J., Tsarfaty, R., Eds.; Association for Computational Linguistics: Stroudsburg, PA, USA, 2021; pp. 3378–3390. [Google Scholar]
- Ranzato, M.A.; Boureau, Y.l.; Cun, Y. Sparse Feature Learning for Deep Belief Networks. In Proceedings of the Advances in Neural Information Processing Systems, Vancouver, Canada, 3–6 December 2007; Platt, J., Koller, D., Singer, Y., Roweis, S., Eds.; Curran Associates, Inc.: New York, NY, USA, 2007; Volume 20. [Google Scholar]
- Le, Q.V.; Ngiam, J.; Coates, A.; Lahiri, A.; Prochnow, B.; Ng, A.Y. On optimization methods for deep learning. In Proceedings of the 28th International Conference on Machine Learning ICML 2011, Bellevue, WA, USA, 28 June–2 July 2011; Getoor, L., Scheffer, T., Eds.; pp. 265–272. [Google Scholar]
- Rifai, S.; Vincent, P.; Muller, X.; Glorot, X.; Bengio, Y. Contractive Auto-Encoders: Explicit Invariance During Feature Extraction. In Proceedings of the 28th International Conference on Machine Learning, ICML 2011, Bellevue, WI, USA, 28 June–2 July 2011; Omnipress: Madison, WI, USA, 2011; pp. 833–840. [Google Scholar]
- Alain, G.; Bengio, Y. What regularized auto-encoders learn from the data-generating distribution. J. Mach. Learn. Res. 2014, 15, 3563–3593. [Google Scholar]
- Pathak, D.; Krähenbühl, P.; Donahue, J.; Darrell, T.; Efros, A.A. Context Encoders: Feature Learning by Inpainting. In Proceedings of the 2016 IEEE Conference on Computer Vision and Pattern Recognition, CVPR 2016, Las Vegas, NV, USA, 27–30 June 2016; pp. 2536–2544. [Google Scholar]
- Iizuka, S.; Simo-Serra, E.; Ishikawa, H. Globally and locally consistent image completion. ACM Trans. Graph. 2017, 36, 107:1–107:14. [Google Scholar] [CrossRef]
- Yu, J.; Lin, Z.; Yang, J.; Shen, X.; Lu, X.; Huang, T.S. Generative Image Inpainting with Contextual Attention. In Proceedings of the 2018 IEEE Conference on Computer Vision and Pattern Recognition, CVPR 2018, Salt Lake City, UT, USA, 18–22 June 2018; pp. 5505–5514. [Google Scholar]
- Liu, G.; Reda, F.A.; Shih, K.J.; Wang, T.; Tao, A.; Catanzaro, B. Image Inpainting for Irregular Holes Using Partial Convolutions. In Proceedings of the Computer Vision—ECCV 2018—15th European Conference, Munich, Germany, 8–14 September 2018; Proceedings, Part XI; Lecture Notes in Computer Science. Ferrari, V., Hebert, M., Sminchisescu, C., Weiss, Y., Eds.; Springer: Berlin/Heidelberg, Germany, 2018; Volume 11215, pp. 89–105. [Google Scholar]
- Yu, J.; Lin, Z.; Yang, J.; Shen, X.; Lu, X.; Huang, T.S. Free-Form Image Inpainting with Gated Convolution. In Proceedings of the 2019 IEEE/CVF International Conference on Computer Vision, ICCV 2019, Seoul, Republic of Korea, 27 October–2 November 2019; pp. 4470–4479. [Google Scholar]
- Bhattad, A.; Rock, J.; Forsyth, D.A. Detecting Anomalous Faces with ‘No Peeking’ Autoencoders. arXiv 2018, arXiv:1802.05798. [Google Scholar]
- Vincent, P.; Larochelle, H.; Bengio, Y.; Manzagol, P. Extracting and composing robust features with denoising autoencoders. In Proceedings of the Machine Learning, Proceedings of the Twenty-Fifth International Conference (ICML 2008), Helsinki, Finland, 5–9 June 2008; ACM International Conference Proceeding, Series. Cohen, W.W., McCallum, A., Roweis, S.T., Eds.; ACM: New York, NY, USA, 2008; Volume 307, pp. 1096–1103. [Google Scholar]
- Kascenas, A.; Pugeault, N.; O’Neil, A.Q. Denoising Autoencoders for Unsupervised Anomaly Detection in Brain MRI. In Proceedings of the 5th International Conference on Medical Imaging with Deep Learning, PMLR, Zurich, Switzerland, 6–8 July 2022; Volume 172, pp. 653–664. [Google Scholar]
- Liu, Z.; Zhou, Y.; Xu, Y.; Wang, Z. SimpleNet: A Simple Network for Image Anomaly Detection and Localization. In Proceedings of the IEEE/CVF Conference on Computer Vision and Pattern Recognition, CVPR 2023, Vancouver, BC, Canada, 17–24 June 2023; pp. 20402–20411. [Google Scholar]
- Bergmann, P.; Batzner, K.; Fauser, M.; Sattlegger, D.; Steger, C. The MVTec Anomaly Detection Dataset: A Comprehensive Real-World Dataset for Unsupervised Anomaly Detection. Int. J. Comput. Vis. 2021, 129, 1038–1059. [Google Scholar] [CrossRef]
- Cimpoi, M.; Maji, S.; Kokkinos, I.; Mohamed, S.; Vedaldi, A. Describing Textures in the Wild. In Proceedings of the IEEE Conference on Computer Vision and Pattern Recognition (CVPR), Columbus, OH, USA, 23–28 June 2014. [Google Scholar]
- Badrinarayanan, V.; Kendall, A.; Cipolla, R. SegNet: A Deep Convolutional Encoder-Decoder Architecture for Image Segmentation. IEEE Trans. Pattern Anal. Mach. Intell. 2017, 39, 2481–2495. [Google Scholar] [CrossRef]
- Ronneberger, O.; Fischer, P.; Brox, T. U-Net: Convolutional Networks for Biomedical Image Segmentation. In Proceedings of the Medical Image Computing and Computer-Assisted Intervention—MICCAI 2015—18th International Conference, Munich, Germany, 5–9 October 2015; Proceedings, Part III; Lecture Notes in Computer Science. Navab, N., Hornegger, J., III, Wells, W.M., Frangi, A.F., Eds.; Springer: Berlin/Heidelberg, Germany, 2015; Volume 9351, pp. 234–241. [Google Scholar]
- Schuster, R.; Wasenmüller, O.; Unger, C.; Stricker, D. SDC—Stacked Dilated Convolution: A Unified Descriptor Network for Dense Matching Tasks. In Proceedings of the IEEE Conference on Computer Vision and Pattern Recognition, CVPR 2019, Long Beach, CA, USA, 16–20 June 2019; pp. 2556–2565. [Google Scholar]
- Koller, D.; Friedman, N. Probabilistic Graphical Models: Principles and Techniques—Adaptive Computation and Machine Learning; The MIT Press: Cambridge, MA, USA, 2009. [Google Scholar]
- Wainwright, M.J.; Jordan, M.I. Graphical Models, Exponential Families, and Variational Inference. Found. Trends Mach. Learn. 2008, 1, 1–305. [Google Scholar] [CrossRef]
- Lafferty, J. Conditional random fields: Probabilistic models for segmenting and labeling sequence data. In Proceedings of the ICML, Williamstown, MA, USA, 28 June–1 July 2001; Morgan Kaufmann: Burlington, MA, USA, 2001; pp. 282–289. [Google Scholar]
- Bauer, A.; Görnitz, N.; Biegler, F.; Müller, K.R.; Kloft, M. Efficient Algorithms for Exact Inference in Sequence Labeling SVMs. IEEE Trans. Neural Netw. Learn. Syst. 2014, 25, 870–881. [Google Scholar] [CrossRef] [PubMed]
- Bauer, A.; Braun, M.L.; Müller, K.R. Accurate Maximum-Margin Training for Parsing with Context-Free Grammars. IEEE Trans. Neural Netw. Learn. Syst. 2017, 28, 44–56. [Google Scholar] [CrossRef]
- Bauer, A.; Nakajima, S.; Müller, K.R. Efficient Exact Inference with Loss Augmented Objective in Structured Learning. IEEE Trans. Neural Netw. Learn. Syst. 2017, 28, 2566–2579. [Google Scholar] [CrossRef]
- Bauer, A.; Nakajima, S.; Görnitz, N.; Müller, K.R. Optimizing for Measure of Performance in Max-Margin Parsing. IEEE Trans. Neural Netw. Learn. Syst. 2019, 21, 2680–2684. [Google Scholar] [CrossRef] [PubMed]
- Bauer, A.; Nakajima, S.; Görnitz, N.; Müller, K.R. Partial Optimality of Dual Decomposition for MAP Inference in Pairwise MRFs. In Proceedings of the Machine Learning Research, Naha, Japan, 16–18 April 2019; Proceedings of Machine Learning Research. Chaudhuri, K., Sugiyama, M., Eds.; Volume 89, pp. 1696–1703. [Google Scholar]
- Bauer, A.; Nakajima, S.; Müller, K.R. Polynomial-Time Constrained Message Passing for Exact MAP Inference on Discrete Models with Global Dependencies. Mathematics 2023, 11, 2628. [Google Scholar] [CrossRef]
- Bergmann, P.; Fauser, M.; Sattlegger, D.; Steger, C. MVTec AD—A Comprehensive Real-World Dataset for Unsupervised Anomaly Detection. In Proceedings of the IEEE Conference on Computer Vision and Pattern Recognition, CVPR 2019, Long Beach, CA, USA, 16–20 June 2019; pp. 9592–9600. [Google Scholar]
- Kingma, D.P.; Ba, J. Adam: A Method for Stochastic Optimization. In Proceedings of the 3rd International Conference on Learning Representations, ICLR 2015, San Diego, CA, USA, 7–9 May 2015; Bengio, Y., LeCun, Y., Eds.; Conference Track Proceedings. [Google Scholar]
- Zhou, Y.; Xu, X.; Song, J.; Shen, F.; Shen, H.T. MSFlow: Multi-Scale Flow-based Framework for Unsupervised Anomaly Detection. arXiv 2023, arXiv:2308.15300. [Google Scholar]
Disclaimer/Publisher’s Note: The statements, opinions and data contained in all publications are solely those of the individual author(s) and contributor(s) and not of MDPI and/or the editor(s). MDPI and/or the editor(s) disclaim responsibility for any injury to people or property resulting from any ideas, methods, instructions or products referred to in the content. |
© 2024 by the authors. Licensee MDPI, Basel, Switzerland. This article is an open access article distributed under the terms and conditions of the Creative Commons Attribution (CC BY) license (https://creativecommons.org/licenses/by/4.0/).