1. Introduction
Road traffic crashes have a significant impact on public health, causing the loss of 1.3 million lives per year worldwide, as reported by the World Health Organization [
1]. Furthermore, these accidents also have substantial economic consequences, accounting for approximately 3% of gross domestic product in most countries. Therefore, it is crucial to establish a safe transportation system that takes the vulnerability of road users to serious injuries in daily life into consideration. However, comprehensively considering all components can be challenging, and despite efforts to address this issue, traffic accidents remain a significant public safety issue. To reduce the number and severity of these incidents, researchers have been working on accident analysis and prediction for several decades. By identifying the factors that contribute to accidents and developing strategies to prevent them, governments, communities, and individuals can improve road safety and reduce the number of fatalities and injuries [
2,
3]. Centralized traffic management refers to a system where traffic control and management activities are coordinated and controlled from a central location [
4,
5]. Advanced technologies in centralized traffic management can facilitate the identification of traffic accident hotspots, analyze accident data to understand accident patterns and causes, and develop targeted interventions to address those issues. For example, by investing in better road design, traffic signals, and pedestrian crossings, governments can reduce the risk of accidents and create safer environments for all road users. Additionally, advanced driver assistance systems, such as automatic emergency braking and lane departure warning systems, can help prevent accidents caused by human error. Governments can also mandate the use of safety features to further reduce the risk of injuries and fatalities in the event of an accident.
As a result, increasing the accuracy of accident prediction in transportation systems is expected to eliminate fatal crashes and reduce serious injuries through warnings and preventive measures. In recent years, there have been two primary approaches to addressing this problem: causal analysis methods and statistical methods. Statistical methods focus on identifying correlations or associations between variables based on historical data, while causal analysis methods seek to understand the underlying mechanisms or factors that contribute to traffic risks. In other words, statistical methods primarily make predictions based on patterns and trends observed in historical data. In contrast, causal analysis methods aim to establish cause-and-effect relationships between variables, and their predictions are based on understanding the causal mechanisms that drive the observed outcomes. As this study focuses on improving the accuracy of traffic risk prediction, statistical methods are summarized in related works.
However, the data attributes that are related to traffic accidents are rather complex and heterogeneous. Factors such as geographical location, road network, traffic patterns, weather conditions, and specific areas of interest need to be considered in traffic accident prediction. Road characteristics, such as road types, road design, and road infrastructure, also influence the occurrence and severity of traffic accidents. Additionally, traffic conditions, such as traffic volume, traffic density, traffic speed, time period, and traffic congestion, can impact the likelihood of traffic accidents. Simply combining multiple deep learning modules might not effectively handle multi-source information. While recurrent neural network (RNN) architectures, including long short-term memory (LSTM), are commonly used for time series prediction, the problems of gradient explosion and vanishing remain unresolved. Moreover, the model output is primarily influenced by the nearest time series input. In contrast, a dilated convolutional network can build deep convolutional connections to extract higher-order hidden information and large convolutional kernels to extract features over long periods. This allows for the indirect expansion of convolutional kernels without increasing computing costs [
6,
7]. To improve accident prediction accuracy, we propose a novel deep learning method called attention-based residual dilated network (ARDN). This method utilizes LSTM to model sequence relationships and an attention mechanism to focus on key information. The dilated residual network is designed to extract complex feature information. Finally, the dataset of natural language descriptions and points of interest is fused through information encoding. We conducted experiments on datasets collected from Austin and Houston, and compared this method with a series of machine learning and deep learning methods to verify its validity. The highlights of this work are as follows:
- (1)
To address the complexity of traffic accident data, this approach considers diverse data sources to capture complex patterns.
- (2)
To overcome the limitations of traditional RNN architectures, the dilated residual network is adopted to capture long-range dependencies. Introducing an attention mechanism for key information further enhances prediction accuracy.
- (3)
Through the comparison of experiments conducted on two datasets, the results show superiority over baselines.
The remainder of the paper is organized as follows:
Section 2 presents a detailed overview of the model’s architecture and its components;
Section 3 provides information about the experiments, including dataset description, baselines, algorithms comparison, and ablation study; and
Section 4 summarizes this paper and conceptualizes future work.
2. Related Works
Statistical methods have been widely used to predict traffic accidents by examining patterns, trends, and underlying factors [
8]. Regression models have been commonly used to analyze the risk factors associated with traffic accidents [
9,
10,
11]. However, these models rely on pre-defined assumptions regarding the underlying probability data distribution and the dependent relationships among various variables which may not always align with the actual circumstances [
12]. Machine learning methods offer a more flexible and robust approach as they can adapt to evolving circumstances without rigid pre-assumed relationships among variables. By using machine learning algorithms, transportation systems can analyze vast amounts of data to identify patterns and relationships that might be challenging to uncover using traditional statistical methods.
Thus, a series of machine learning methods are listed as follows. To identify the factors that influence the severity of accidents at intersections, a logistics model with a heavy-tail distribution was adopted to fit the dataset [
13]. The goal of this study was to develop countermeasures that can help mitigate the risk of severe crashes. A support vector machine (SVM) model was adopted to analyze the severity of injuries sustained during accidents and predict the severity of individual crashes [
14]. The results verified that the SVM model provides better prediction results than the ordered probit model. To further enhance the prediction ability, a fuzzy C-means based SVM has been proposed to predict the severity level of crashes [
15]. The experiments demonstrate that this model outperforms the SVM model in terms of accuracy and F1 scores. This is because the fuzzy c-means clustering algorithm helps to enhance the prediction ability. Then, a comparison between Bayesian network and regression models has been conducted to analyze accident severity [
16]. By comparing the results, it was concluded that the Bayesian network model is more effective in predicting the severity of accidents than the regression model. To analyze traffic accidents, researchers have utilized decision trees to extract decision structures from available datasets [
17]. The results indicated that the decision tree is capable of extracting more relevant rules from the same dataset. In addition, a comparison between binary logistic regression and decision tree was conducted using a motorcycle accident dataset [
18]. The results suggest that the performances of the two models are similar in predicting the identified factors. To explore the relationship between risk factors and accident severity, a severity causation network has been proposed that integrates information entropy and the Bayesian network [
19]. This method can significantly enhance the feasibility of predicting crash severity. Furthermore, the effectiveness of various models, such as classification and regression tree models [
20,
21], log binomial regression [
22,
23], and the rule-based mining method [
24], were also verified through real-world datasets. These studies confirm the potential of machine learning models to contribute to the prediction of traffic accidents.
With the prosperity of artificial intelligence, deep learning methods have emerged as a powerful tool in a wide range of applications, including time series prediction [
25,
26]. By leveraging the capabilities of deep neural networks, deep learning models have demonstrated improved accuracy and more precise prediction results [
27]. The artificial neural network (ANN) has been widely used in this domain through employing a multi-layer perceptron architecture with sigmoid activation and linear output neurons to fit multi-dimensional mapping relationships. Comparative studies using different evaluation metrics, such as the R-value, root mean square error, mean absolute error, and sum of square error, have consistently shown that ANN provides superior prediction results compared with other methods, such as genetic algorithms and pattern search [
28]. Additionally, a convex combination algorithm has been proposed to train the neural network model for accident severity prediction. A modified pruning method for function approximation algorithms has also been developed to optimize the network structure [
29]. The experimental results have demonstrated that this approach achieves comparable classification accuracy when compared to fully connected networks and ordered logit models. To capture temporal correlations from traffic accident records, recurrent neural networks (RNN) have been employed to predict traffic accident severity. The RNN model has demonstrated better performance when compared with other models, such as multilayer perceptron and Bayesian logistic regression [
30]. In recent years, a feature matrix to gray image algorithm has been designed to convert traffic accident features into gray images containing combination relationships. A convolutional neural network-based approach has then been proposed to predict traffic accident severity [
31]. This method has demonstrated improved accuracy when compared with other methods. To leverage multi-source datasets, a spatio-temporal convolutional long short-term memory network has been proposed to predict citywide short-term crash risk [
32]. The results indicated that this approach surpasses the benchmark techniques when it comes to predicting various crash risks. Additionally, deep accident prediction (DAP) encompasses several components that capture interrelationships within multiple data sources, leading to a better performance than several baseline models [
33]. Overall, these learning-based methods have shown promising results regarding predicting the severity of traffic accidents and identifying the factors that contribute to them. These findings can help improve traffic safety by enabling the development of effective countermeasures [
34,
35].
3. Methods
3.1. The Overall Architecture
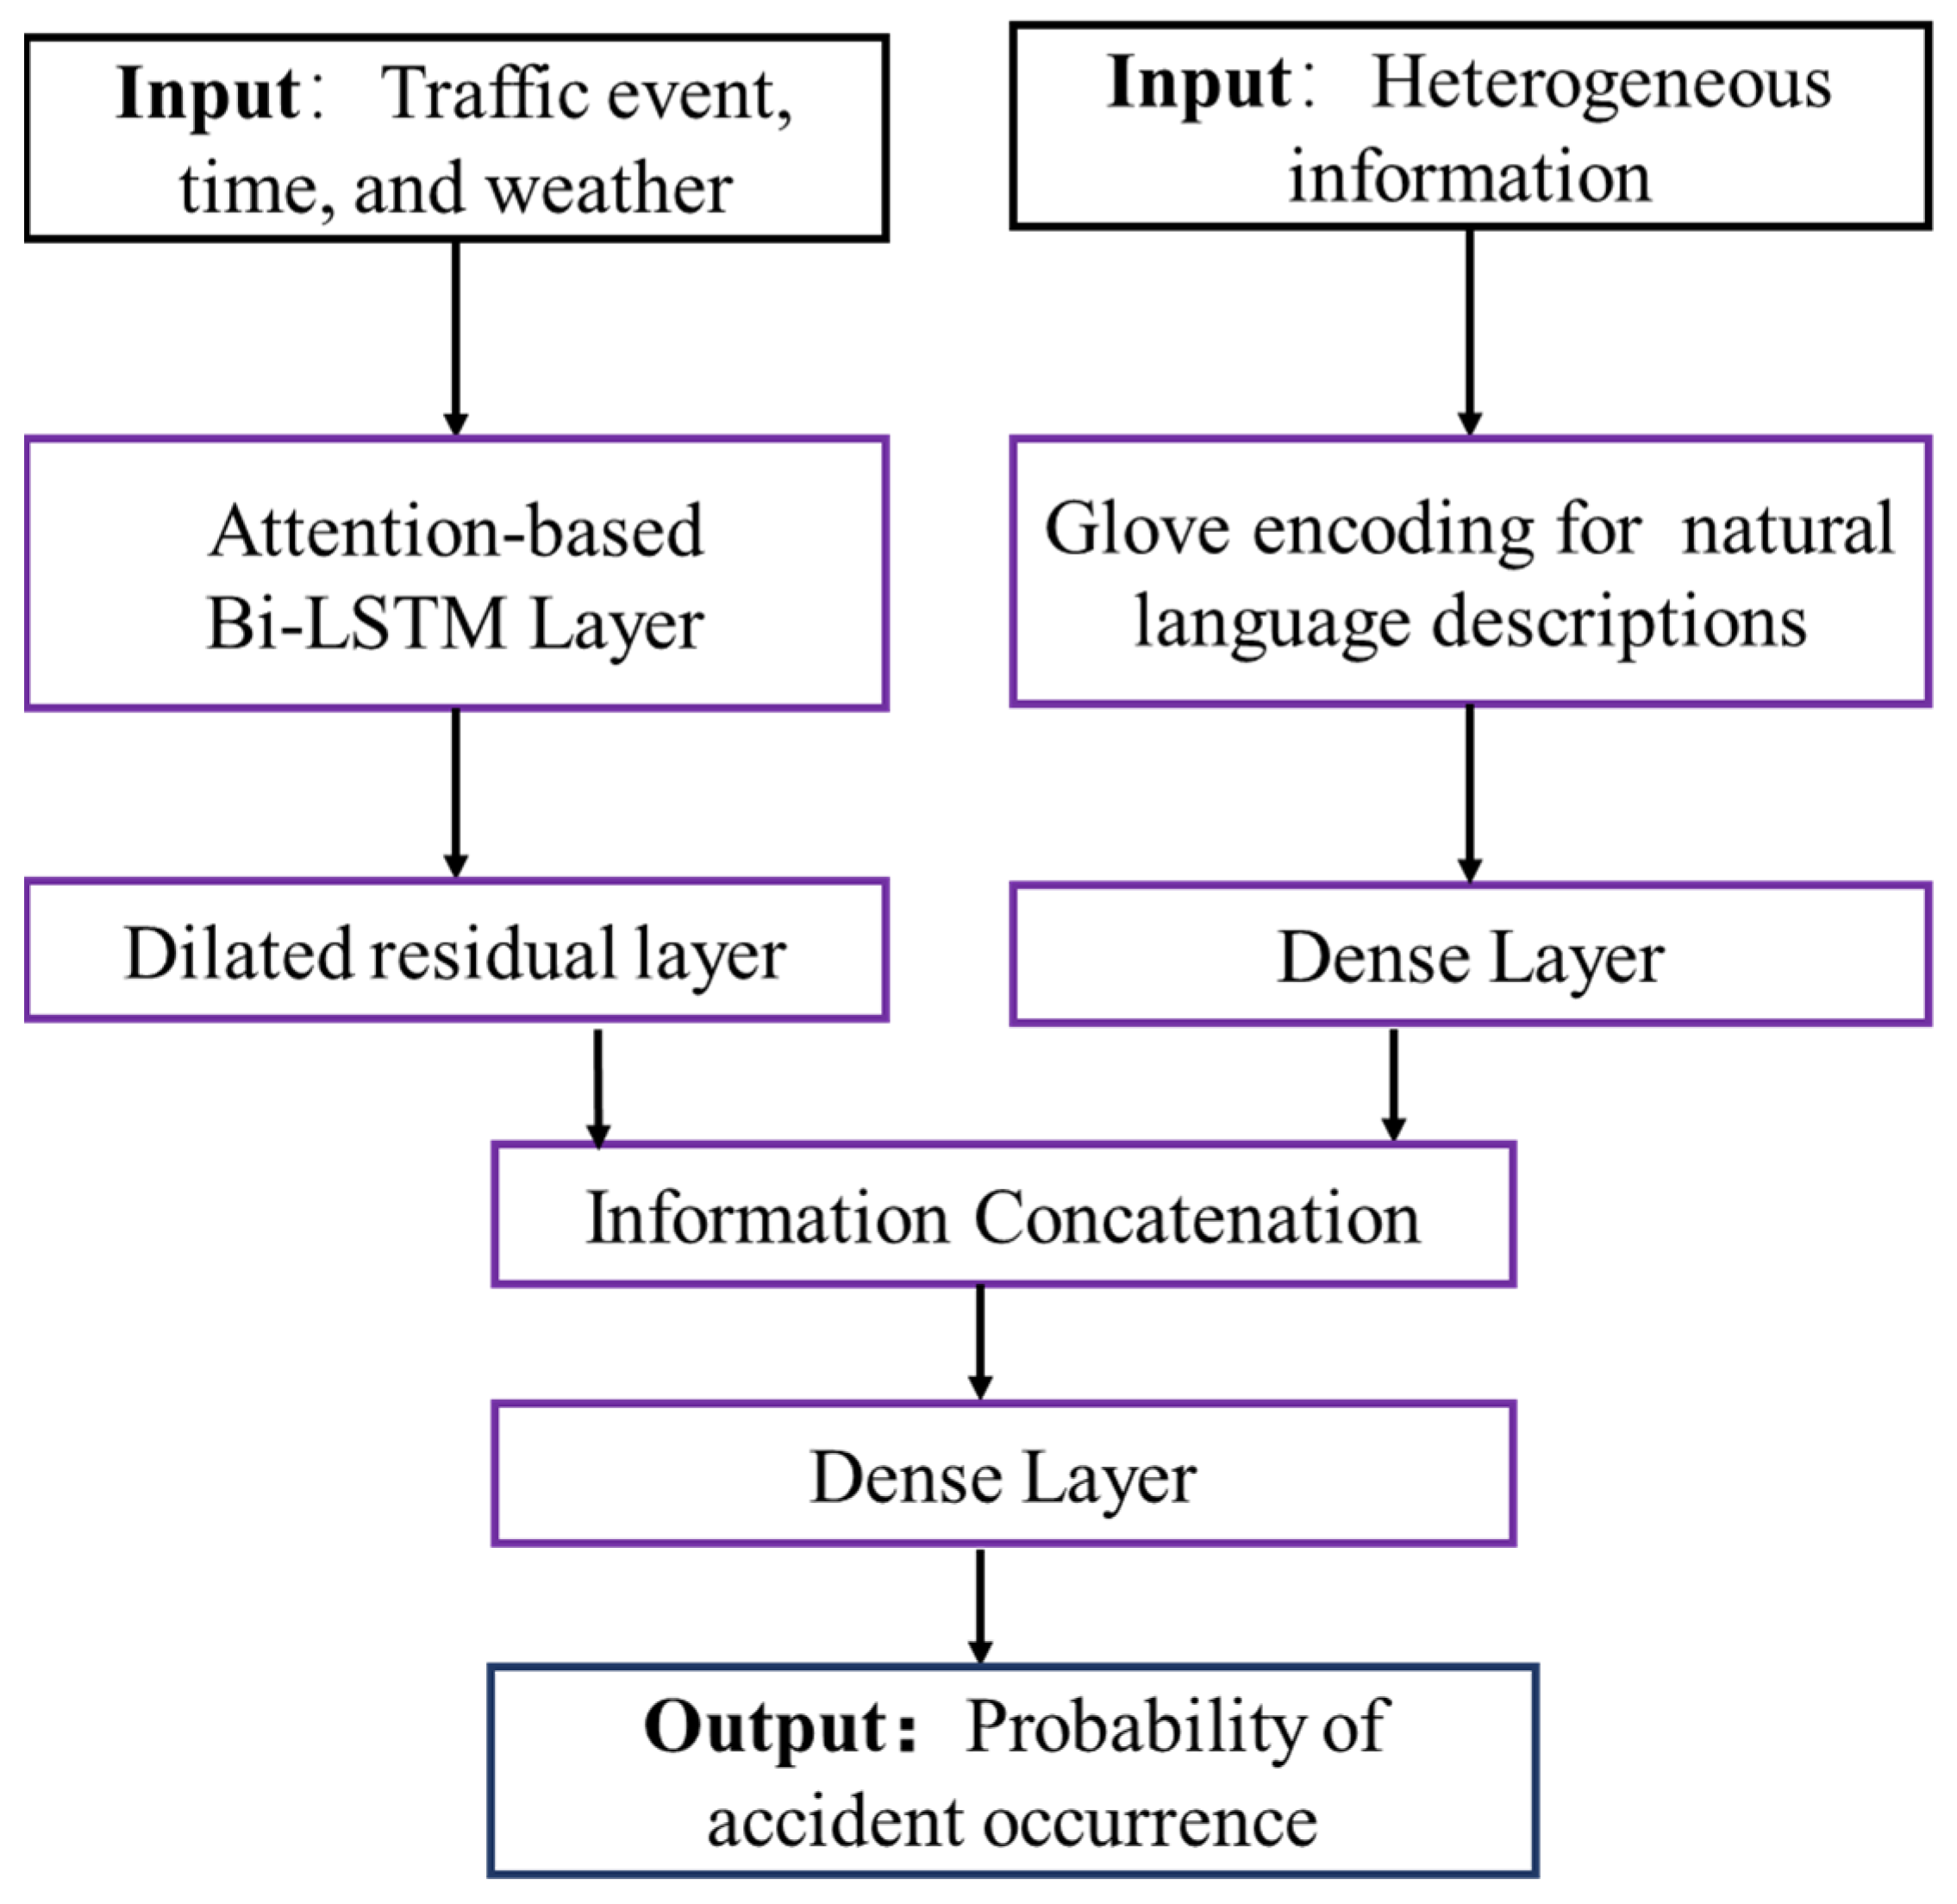
This paper proposes a novel learning-based approach to extract spatial–temporal information and generate highly accurate predictions, as shown in
Figure 1. The proposed model includes an attention-based dilated residual layer that effectively extracts time series information from input traffic data.
The input traffic data comprises several important factors, including descriptions of traffic events, time, and weather information [
33,
36,
37]. The details are listed as follows:
- (1)
Traffic event data. This includes the frequency of available traffic events during the current 15 min interval, such as accidents, broken vehicles, lane blockages, and flow incidents.
- (2)
Time information. This is a critical component of the input traffic data and includes factors such as weekdays, hour of the day, and day or night. For example, weekdays can be represented as numerical variables (e.g., 1 for weekday, 2 for weekend, etc.), hour of the day can be represented as categorical variables (e.g., morning, afternoon, evening, and night), and day or night can be represented as binary variables (e.g., 0 for day and 1 for night).
- (3)
Weather information. This is represented as numerical variables (temperature, pressure, humidity, visibility, wind speed, and precipitation amount) or binary variables (rain, snow, fog, and hail).
Overall, the input traffic data is formulated as a comprehensive vector denoted by
which includes all the aforementioned factors. In addition, a dense network is incorporated to enable the learning of information from heterogeneous data sources, including natural language descriptions of historical traffic events and points-of-interest data. To handle the heterogeneous information effectively, Glove encoding is utilized to encode the raw information into word vectors, which is described in
Section 3.4. The proposed model has the capability to effectively extract information from these data sources and generate highly accurate predictions based on this information.
3.2. Attention-Based Bi-LSTM Layer
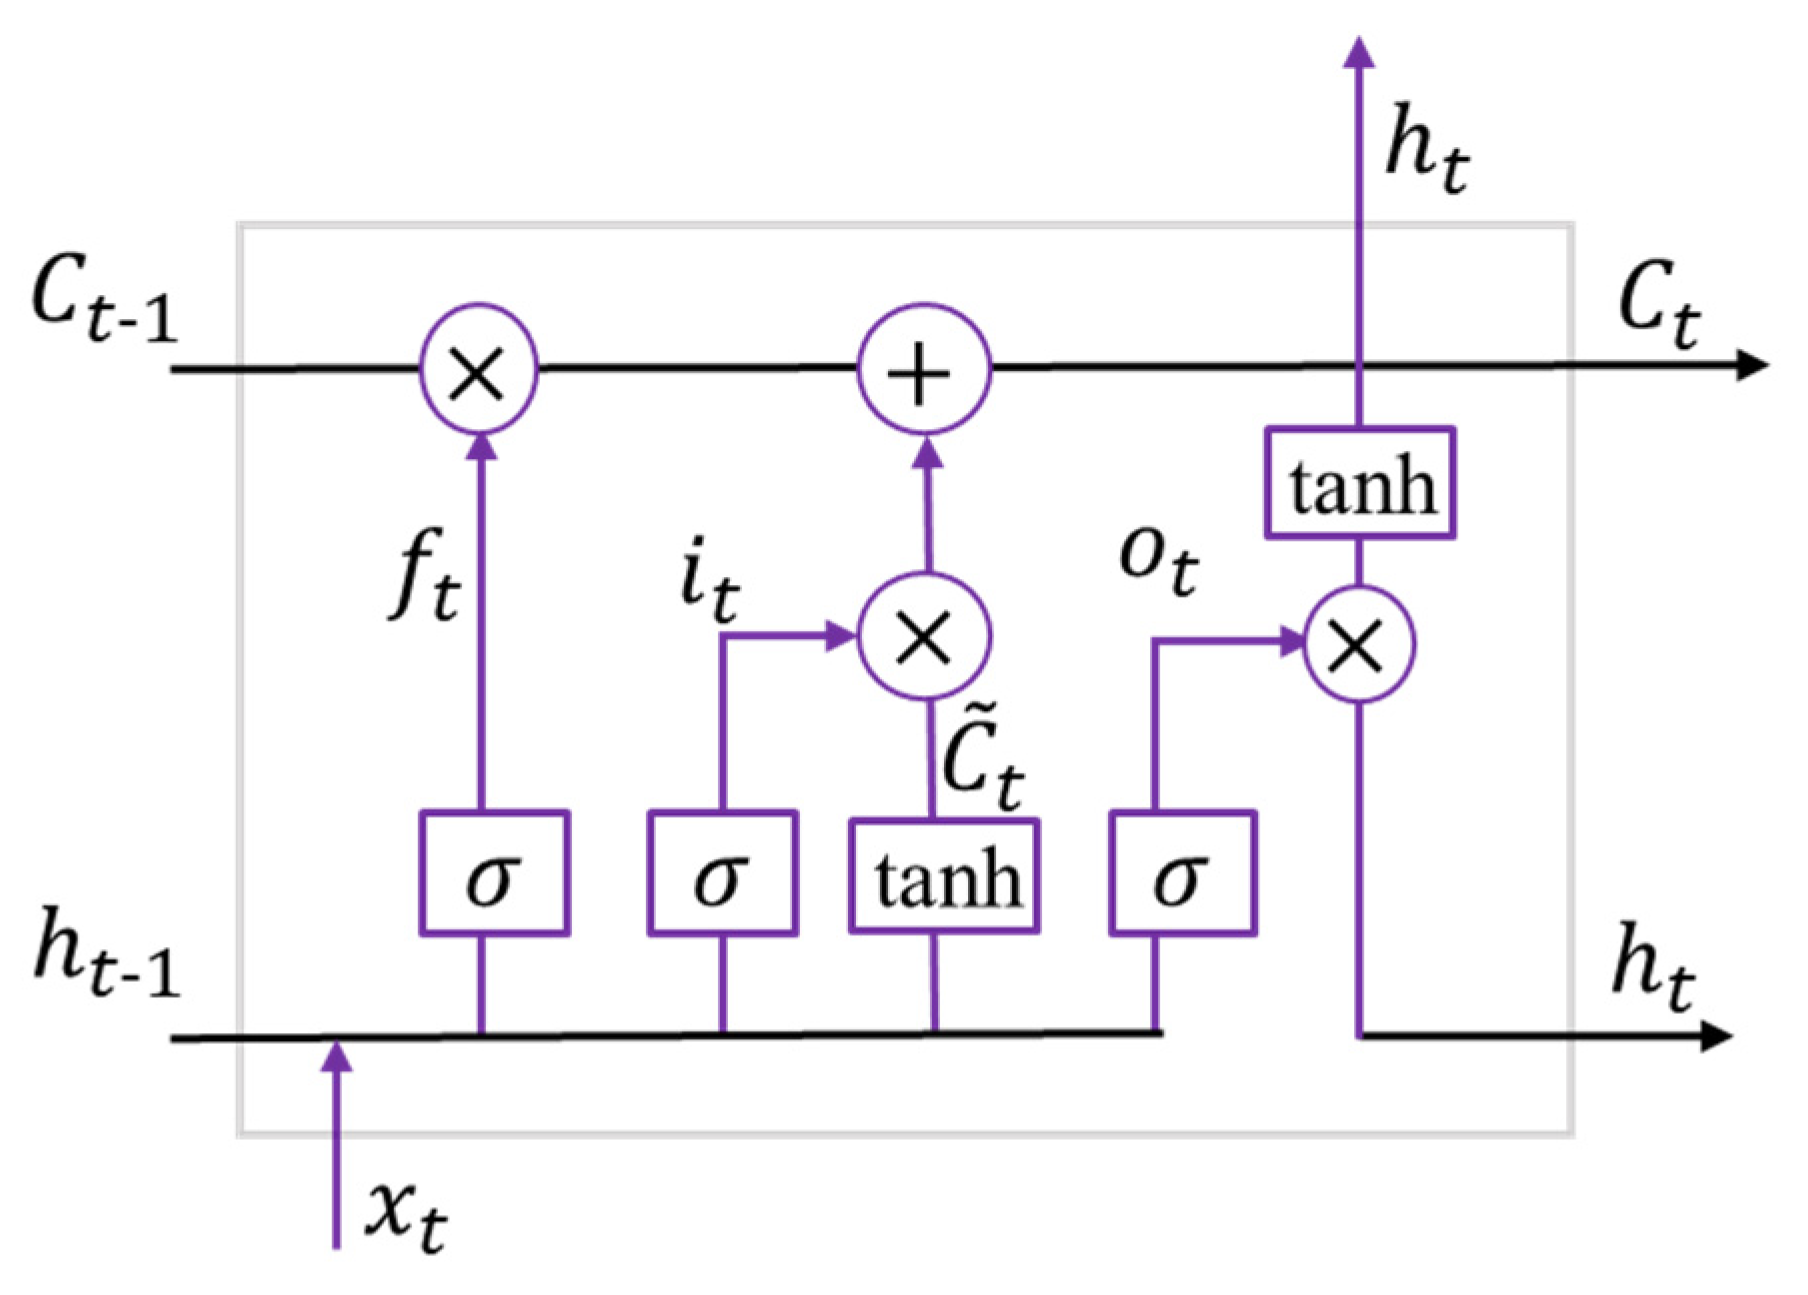
Long short-term memory is a popular type of neural network that is designed to capture temporal relationships within sequential data. It is composed of memory units that accumulate historical information through self-connections. Each memory unit consists of three gates: the input gate, the forget gate, and the output gate, as shown in
Figure 2. The input gate controls the information flow into the memory unit, while the forget gate and output gate regulate the information flow within the memory unit. The details are listed as follows:
The forget gate determines which information from the previous cell state should be discarded. This gate concatenates the previous hidden state and the current input , then outputs information through the sigmoid function, which is multiplied with the previous cell state . The next step is to update the cell state of the layer. A tanh layer is used to produce an updated value within the interval [−1, 1], which can either strengthen or weaken some cell states. The output value of the sigmoid layer is multiplied by the output of the tanh layer, acting as a scaling function. The new cell state is then generated according to the output of the forget gate and the update gate . Finally, the sigmoid layer determines the information of to acquire the output . Based on the given formula, the memory unit allows for linear updates. Consequently, the current state of the hidden layer can be obtained by combining the nonlinear tanh function with the information from the output gate.
Although LSTM effectively models sequential information, it is limited to encoding information in only one direction, usually from front to back. This limitation can be overcomed by using Bi-LSTM, which can capture the semantics of a sequence in both directions, as illustrated in
Figure 3. Furthermore, when dealing with datasets that contain information regarding varying dimensions, the challenge lies in extracting important information that can contribute to improved model performance.
Originally proposed in the field of visual research, the attention mechanism simulates the way that the human brain focuses its attention on important regions and disregards less relevant parts [
38]. The core idea behind the attention mechanism is to allocate more attention to key parts and less attention to other parts by rationally allocating brain resources [
39]. This helps exclude the influence of non-key factors and improve the quality of feature extractions in the hidden layer. The attention mechanism achieves this by using a probability weight distribution to calculate the probability weights of feature vectors at different time steps in the sequence. By utilizing the attention mechanism, we can effectively extract the most important information from the sequence, leading to better model performance. The first step is to adopt a learnable matrix to calculate the similarity between the query and each key:
where
represents the output of Bi-LSTM and
represent the learnable parameters. This produces a weight value
, which is then normalized through the softmax function. Then, the corresponding values are multiplied by their weights and the sum is taken to generate the output:
In sum, this module is composed of Bi-LSTM and an attention mechanism. The former can effectively address the issue of gradient explosion and vanishment while maintaining high accuracy. The latter plays a critical role in mapping the query to a series of key-value pairs, assigning a higher weight to important parts of the data. This helps identify relevant information and improve the accuracy of the predictions. Finally, the output is transmitted to the next dilated residual layer for further refinement. In addition, as depicted in
Figure 3, the flow of data through hidden layers allows information to pass through the network from input layers to output layers. The connections between nodes in different layers are associated with weights that determine the strength of the connection. These weights are adjusted during the training process through backpropagation, allowing the network to learn from input data and optimize the prediction performance by adjusting the weights.
3.3. Dilated Residual Layer
Although LSTM is designed to retain important information in its memory gate, convolutional neural networks (CNNs) have shown promise in retaining long-term memories in a more realistic manner. For instance, models such as WaveNet [
6] and temporal convolutional networks (TCNs) [
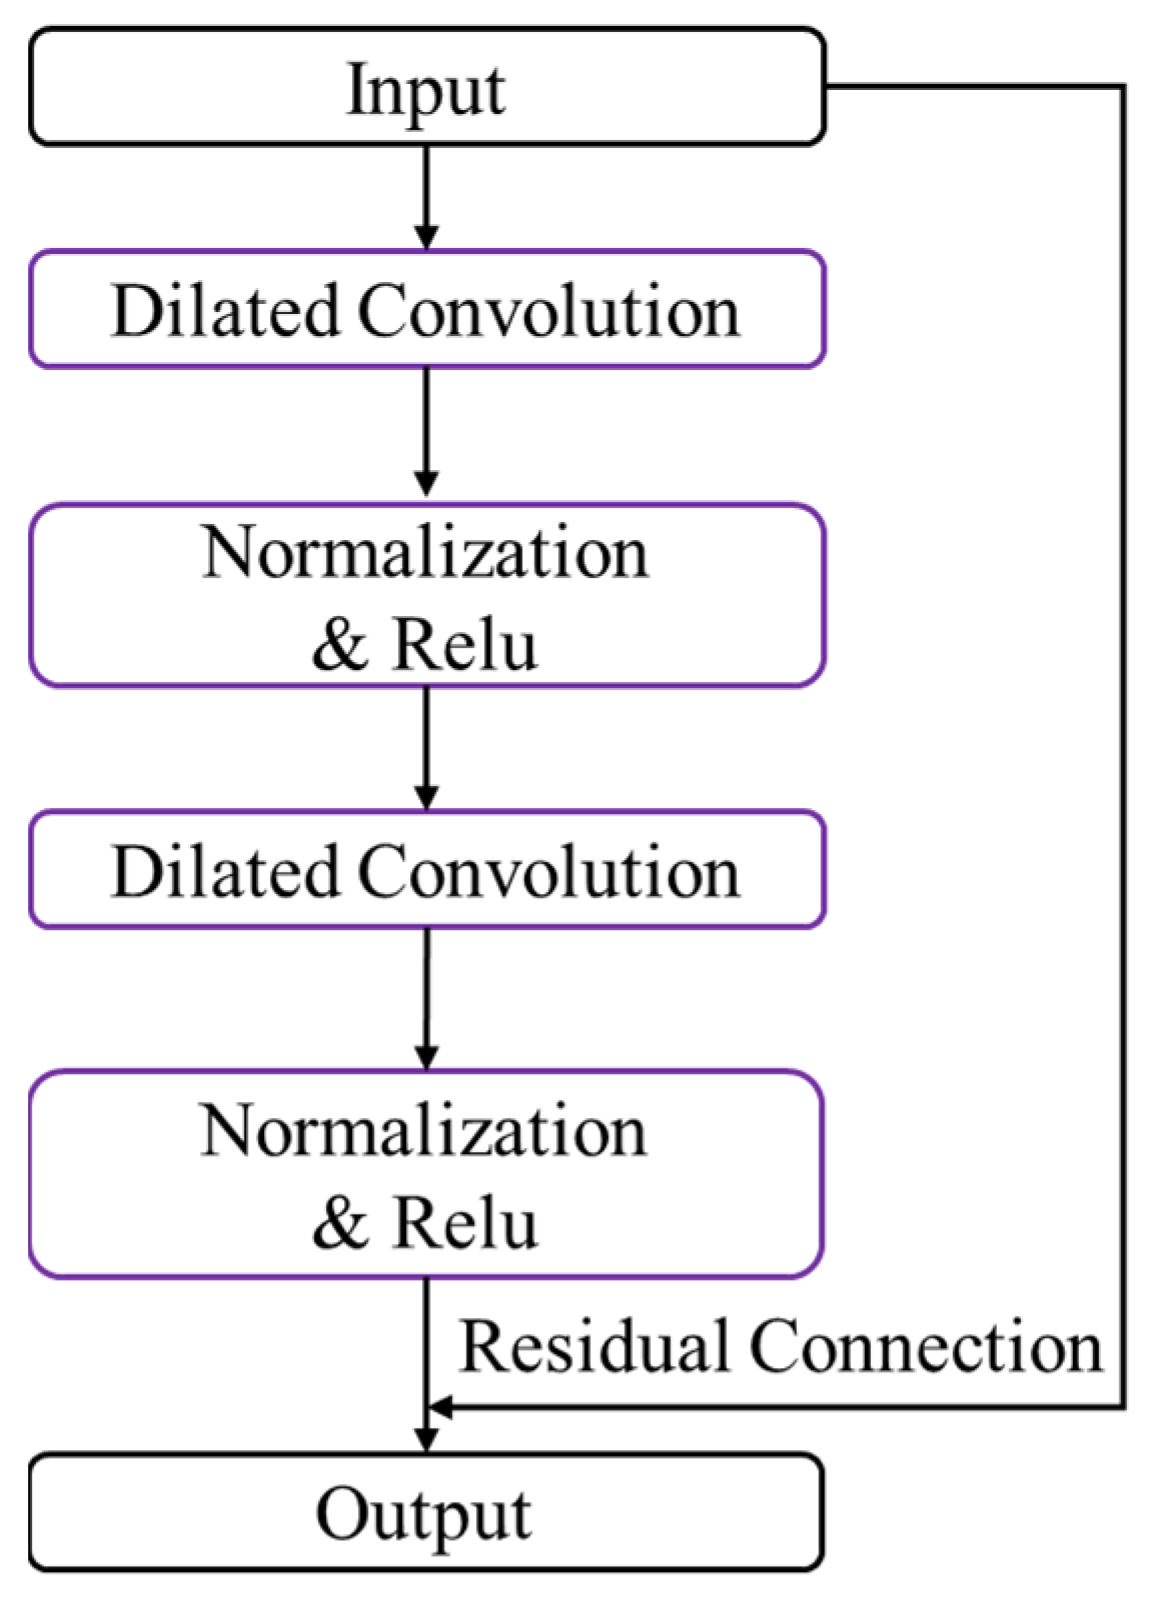
7] have demonstrated better performance than RNNs and LSTMs based on a range of datasets. The dilated residual layer is a key component that combines dilated convolution and residual connection to achieve high performance in sequence modeling tasks, as shown in
Figure 4.
Dilated convolutional networks use a dilation rate parameter in addition to the convolution kernel size which indicates the degree of expansion that will be transmitted to the next dilated residual layer. This allows the network to capture long-range dependencies in the input sequence, which is particularly important in tasks such as speech recognition or language modeling. As the number of layers in the network increases, the convolution window becomes larger, and the number of empty holes in the convolution window also increases, leading to an even larger receptive field. This approach enables neural networks to retain long-term memories more effectively than traditional RNNs.
Residual connection is a powerful technique adopted in neural network architectures to improve training convergence [
40]. It allows information from earlier layers to bypass the intervening layers and directly connect to later layers, enabling the network to learn more complex representations of the input sequence. This process is repeated for each layer, with the feature information of the previous layer being added to the feature graph of each subsequent layer.
To further enhance the performance of the network, this layer uses normalization and ReLU nonlinear functions. After each convolution operation, dropout is applied for regularization to prevent overfitting.
3.4. Heterogeneous Feature Encoding Layer
To improve the understanding of natural language descriptions of historical traffic events, the well-trained Glove model [
41] is employed to encode raw information into word vectors through unsupervised learning. This approach measures the similarity between words by calculating the Euclidean distance between their respective vectors, and is designed to capture vector differences that correspond to linear structures through different vectors. The core procedure for the Glove model involves constructing a word co-occurrence matrix from the input text corpus, computing the probability distribution of word pairs from the matrix, and training the model using an iterative optimization process. Once trained, the word vectors can be used as feature representations for downstream machine learning tasks, capturing semantic and syntactic relationships between words.
Then, this method calculates the average values of these word vectors to represent each region. A dense network is then used to obtain a fixed-length feature vector that captures important information for classification. Point-of-interest information is also considered to enhance the understanding of traffic events. This approach enables effective processing and analysis of natural language descriptions of historical traffic events.
3.5. Output and Optimization
As illustrated in
Figure 1, this method integrates information from the dilated residual layer and heterogeneous feature encoding. The fully connected layer, also known as the dense layer, is utilized to concatenate information as it is capable of learning complex patterns from input data. This method is differentiable, allowing us to use the back-propagation algorithm for training. Specifically, we employ the Adam optimizer to minimize the binary cross-entropy during several iterations of learning. The formulation is given below:
where
denotes the total number of samples in the training set,
represents the sign function to determine whether the sample is true or not, and
refers to the predicted probability of the occurrence of an accident. By minimizing this objective function, we can improve the performance of the model and enhance its ability to accurately predict the likelihood of accidents.
4. Experiment
In this section, we validate the effectiveness of the proposed ARDN method through experiments conducted on the datasets collected from two large cities. Python was chosen as the programming language to solve the traffic accident prediction problem, and the Keras framework was utilized to implement the deep learning algorithm. The experiment is organized as follows.
Section 4.1 describes the datasets adopted in this work.
Section 4.2 lists the baselines and evaluation criteria.
Section 4.3 compares the proposed ARDN method with a series of baselines.
Section 4.4 displays the implications for practice. Finally, the ablation experiment is conducted in
Section 4.5 to verify the validity of the algorithm components.
4.1. Data Description
This study aims to predict the probability of traffic accidents occurring within a specific 15 min window. The datasets used in this study was obtained from the website:
https://smoosavi.org/datasets/ (accessed on 1 June 2022). The data were collected from multiple data providers, including several APIs that provide streaming traffic event data. These APIs capture and broadcast traffic events from various sources, such as the US and state Departments of Transportation, law enforcement agencies, traffic cameras, and traffic sensors within the road networks [
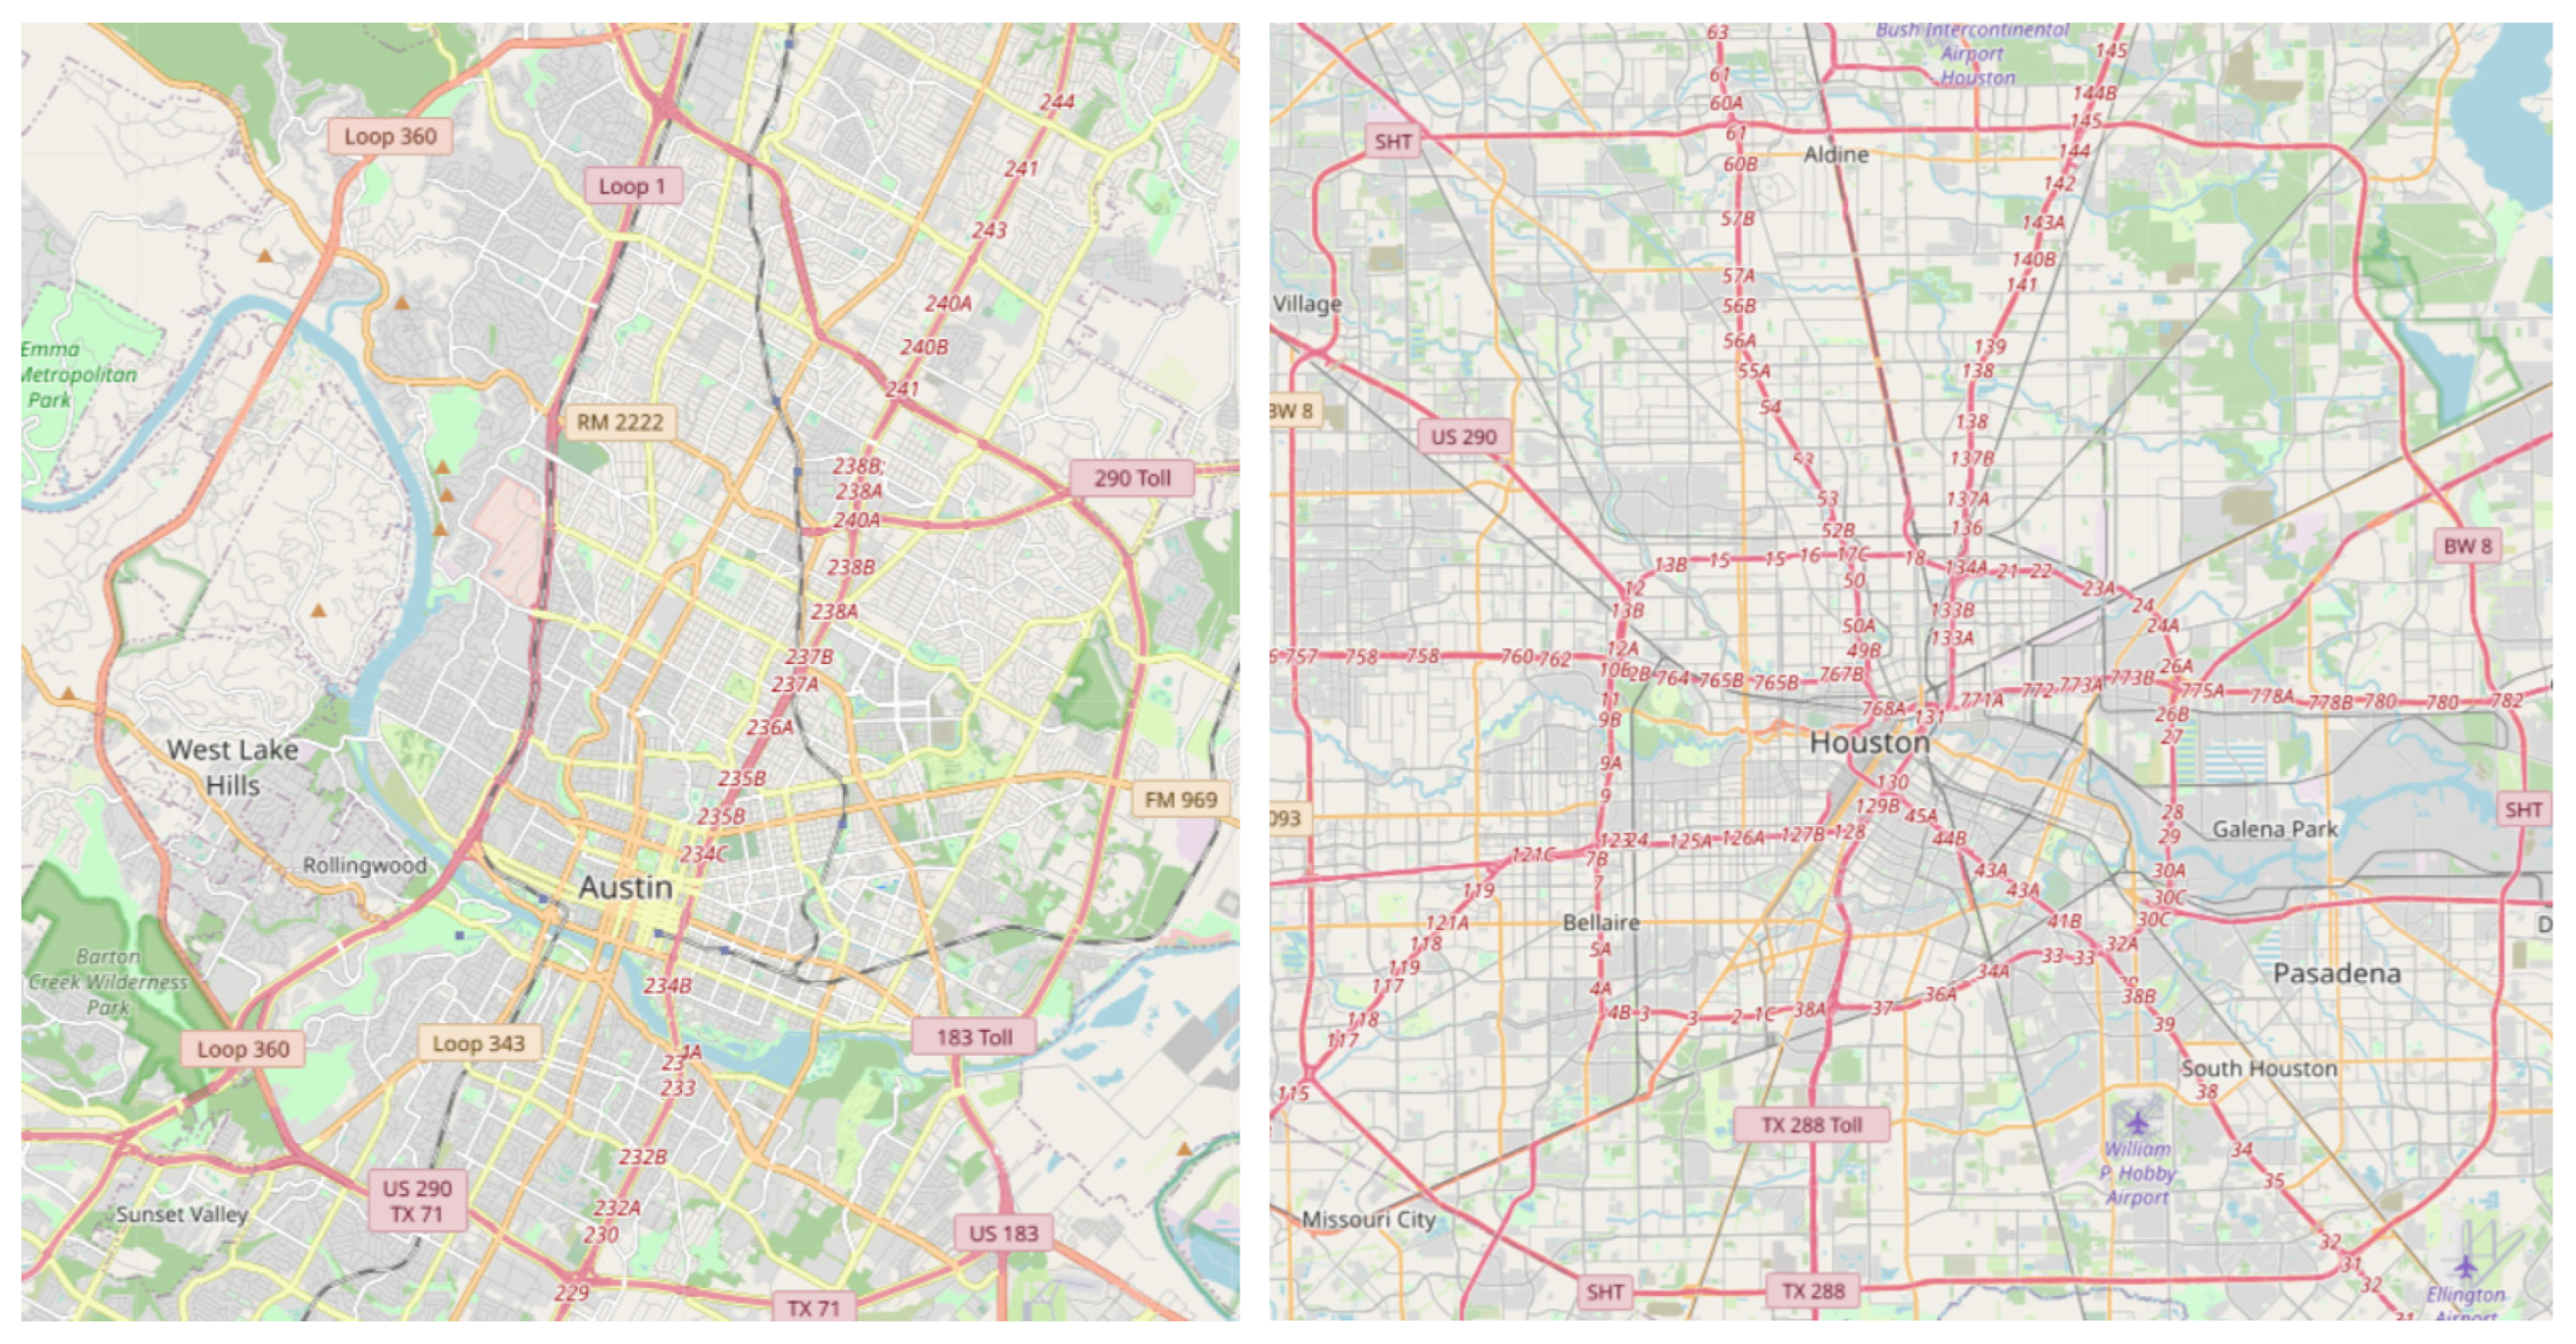
37]. The datasets provide detailed information on each geographical region with a size of 5 km × 5 km per 15 min interval in Austin and Houston [
33].
Figure 5 depicts the road networks of the two cities, which was obtained from the website:
www.openstreetmap.org/ (accessed on 15 April 2023). They include various traffic-related events occurring during the current interval, such as traffic events, time, and weather attributes. To predict the label of the next time interval, the time series information of the last eight time intervals, i.e., two hours, is adopted in this work.
4.2. Baseline and Ealuation Criteria
This section aims to compare the effectiveness of our proposed methods against five baselines:
- (1)
Logistic regression is a statistical method used for binary classification where the goal is to predict the probability of an event occurring using a logistic function.
- (2)
Gradient boosting [
42] is a machine learning technique that builds an ensemble of weak predictive models, such as decision trees, in a sequential manner. It uses gradient descent optimization to minimize the loss function, combining the predictions of multiple weak models to make a final prediction.
- (3)
Xgboost [
43] is an optimized implementation of gradient boosting. It uses a variety of regularization techniques to prevent overfitting and provides additional features such as parallel processing and handling of missing values.
- (4)
ANN consists of interconnected nodes organized in layers, where each node performs a mathematical operation on its inputs and passes the result to the next layer.
- (5)
DAP [
33] was proposed in a previous study [
33] and incorporates data augmentation and preprocessing techniques to improve the accuracy of traffic accident prediction.
To ensure fair comparisons, we set several hyper parameters to fixed values, including a learning rate of 0.01 and an early stop threshold of 10. The early stop method was used to prevent overfitting by limiting the number of training iterations. In particular, during the implementation of ARDP, we used a dropout rate of 0.3, an embedding dimension of 128, and a kernel size of 3. The dropout rate of 0.3 was chosen to introduce regularization and prevent overfitting during training. The embedding dimension of 128 was selected as a trade-off between model complexity and representation capacity. The kernel size of 3 was used to capture local spatial–temporal patterns in the input data.
To evaluate the performance of our proposed methods and the baselines, we adopted F1 scores as evaluation criteria which are computed based on precision and recall rate. Precision measures the proportion of positive examples predicted by the binary classifier that are real positive examples, while recall measures the proportion of real positive cases in the test set that are correctly identified by the binary classifier. Precision and recall rate are often in conflict with each other. Adopting F1 scores as evaluation criteria provides a more comprehensive measure of the performance of the different methods, defined as follows:
where Precision is the ratio of true positive predictions to the total number of positive predictions and Recall is the ratio of true positive predictions to the total number of actual positive cases in the test set.
4.3. Discussion on the Results
Table 1 and
Table 2 present the experimental results obtained from the Austin and Houston datasets, respectively. The first column indicates the algorithm used for the experiment, while the remaining columns show the F1 score for each class, i.e., non-accident, accident, and weighted average. Based on the results presented in these tables, it can be concluded that the ARDN is the most effective method for predicting accident occurrences in both the Austin and Houston datasets. The following conclusions can be drawn.
Most algorithms perform well regarding predicting non-accidents as accidents tend to be special cases and algorithms often err on the side of non-accidents. This highlights the need for more accurate algorithms that predict accidents specifically.
Gradient boosting and Xgboost outperform logistic regression models as tree-based models can improve accuracy and efficiency by automatically processing missing values, outliers, feature selection, and feature fusion.
The F1 scores for accidents are generally lower than those of non-accidents, indicating that algorithms are better at identifying non-accident data points. This emphasizes the importance of developing algorithms that are specifically designed to accurately identify accidents.
Among all the comparison results, the ARDN method performs the best, achieving the highest F1 scores for both datasets. This is attributed to its ability to effectively capture relationships within time-series information using dilated residual networks and attention mechanisms. The attention mechanism allows the model to focus on the most relevant regions and time intervals, thus improving the accuracy of the predictions. By using dilated convolutions, the network can capture long-range dependencies across the input data. These results demonstrate the potential of the proposed model to improve the accuracy of accident prediction.
The proposed method addresses the complexity and heterogeneity of traffic accident data by proposing a deep learning approach that takes diverse data sources into account to capture the complexity of traffic accident patterns, including the geographical location, road characteristics, and traffic conditions. Compared with previous deep learning methods, this method overcomes limitations in several ways. Firstly, RNN architectures might suffer from issues like gradient explosion and vanishing and primarily rely on the nearest time series input. In contrast, our proposed dilated residual network is designed to extract complex features over long periods, achieving indirect expansion of convolutional kernels without increasing computing costs. Secondly, we introduce an attention mechanism that allows the model to focus on important information within the data. This attention-based approach enhances the model’s ability to capture relevant features and relationships, leading to more accurate predictions. This attention mechanism helps overcome the limitations of traditional RNN methods that may not effectively capture important information within the data.
4.4. Implications for Practice
According to the proposed method, high accuracy traffic risk prediction has practical significance in various ways. Traffic accidents result in significant casualties and property losses. Accurate traffic risk prediction facilitates timely measures to prevent accidents, thereby reducing casualties and property losses. It enables traffic management departments and practitioners to understand the patterns and trends of accidents, leading to the implementation of preventive measures. For example, patrolling high-risk areas, improving road designs and infrastructure, adjusting traffic flow, and warning drivers about accident-prone areas can all contribute to reducing the occurrence of accidents.
Moreover, accurate traffic risk prediction allows traffic management departments to allocate resources more effectively and optimize safety management strategies. Prioritizing police and rescue resources in areas with high accident rates and high-risk roads and making timely adjustments to routes, speed limits, and intersection designs can improve the effectiveness of traffic safety management. Traffic accidents often cause congestion and delays on roads, impacting traffic flow and road capacity. Accurate traffic risk prediction can provide advance warnings about areas prone to accidents, enabling measures to reduce the impact on traffic flow and road capacity, thereby improving overall traffic efficiency.
Finally, an interactive dashboard can be utilized as a valuable tool to alert drivers to potential risks on the road ahead. This dashboard can display real-time information about traffic conditions, road characteristics, and other relevant data, which can help drivers make informed decisions and take appropriate precautions while driving. For example, the dashboard can provide visual cues or audible warnings to drivers when approaching areas with a high risk of accidents, such as accident-prone intersections or stretches of road with a history of frequent collisions. By proactively informing drivers about potential risks, the dashboard can assist in reducing the occurrence of accidents and enhancing overall road safety. Additionally, the dashboard can consider weather conditions, road construction, and other relevant factors to provide comprehensive and accurate risk alerts to drivers. Furthermore, the dashboard can be integrated with other advanced driver assistance systems or connected vehicle technologies to provide a holistic approach to traffic risk prediction and prevention. This integration can enhance the effectiveness of the dashboard in alerting drivers to potential risks and preventing accidents.
4.5. Ablation Experiment
Furthermore, we conducted ablation experiments to assess the effectiveness of the various components of our proposed method. For this purpose, we trained and evaluated two baseline models alongside our proposed method. The first baseline, named No-Hetero, is the proposed method without the natural language description of historical traffic events and point-of-interest information. The second baseline, named No-RDN, uses a fully connected layer instead of the dilated residual layer. The results of experiments are presented in
Figure 6 and
Figure 7. It can be observed that the proposed method ADRN outperforms the two baselines in terms of F1 scores for accident prediction. These results highlight the importance of the various components within the ADRN method and demonstrate that the dilated residual layer contributes to the improved performance. A dilated convolutional network can cover a larger area of the input data which increases the effective receptive field of the filter. Thus, it can expand the effective receptive field of the convolutional filters and allow the network to consider a broader local region.
In summary, ablation experiments confirm that the various components we have introduced are essential for achieving state-of-the-art performance in traffic accident prediction.
5. Conclusions
Providing reliable and precise predictions can help inform policymakers and decisionmakers by analyzing the factors that contribute to traffic accidents. Therefore, we proposed a deep learning approach for traffic risk prediction using LSTM, attention mechanism, dilated residual network, and a Glove encoding technique. The experimental results of the datasets from Austin and Houston demonstrated the effectiveness of the proposed method in extracting important information from multiple sources and outperforming other baselines. Therefore, our approach has the potential to provide reliable and precise predictions that can inform policymakers and decisionmakers about the factors that contribute to traffic accidents.
This research builds upon previous studies in the field of traffic accident prediction by integrating multiple deep learning techniques and natural language processing. While previous research has focused on traditional RNNs, which might include the problems of gradient explosion and vanishing, we adopt the dilated residual network to extract complex features over long periods and utilize the attention-based approach to further enhance the model’s ability. By accurately predicting traffic accidents, policymakers and decisionmakers can proactively allocate resources to high-risk areas, implement targeted preventive measures, and improve traffic management strategies. This can help reduce the number of accidents, save lives, and reduce economic losses associated with traffic accidents.
This research has limitations but suggests options for future studies. Firstly, the proposed method relies heavily on the availability and accuracy of data from various sources, which might have inherent biases or inaccuracies. Secondly, the study is based on data from Austin and Houston, which might not be fully representative of other regions. Further research could explore the generalizability of the proposed method to other locations and datasets. Additionally, machine learning methods, including deep learning techniques, may encounter challenges in delivering highly interpretable results. Interpretable models are important for policymakers and decisionmakers to understand the underlying factors that contribute to traffic accidents and make informed decisions. Therefore, future work could consider integrating causal inference techniques with machine learning approaches to gain a deeper understanding of the underlying causal mechanisms driving traffic accidents. This could potentially lead to the development of more robust and interpretable predictive models that can provide insights into causal relationships among various factors that influence traffic accidents.


