Abstract
Trip recommendation for groups of tourists (TRGT) is a challenging task in tourism since many tourists travel in groups, inducing social interaction and bringing various social benefits. However, TRGT must address various real-life constraints such as limited time for touring, cost, etc. TRGT aims to design personalized tours that meet the preferences of all group members by addressing a variety of tourists’ requirements that may sometimes result in conflicts and stress for the group members. TRGT should satisfy that both the preferences of group members need to be achieved as much as possible and the preferences of group members need to be achieved as evenly as possible. In this paper, we present a methodology for tackling the TRGT problem by reducing it to the Cooperative Location Set Cover Problem (CLSCP), formulated as an integer linear program. The CLSCP aims to select a group of facilities that can satisfy, in aggregate, all demand points. To tackle the CLSCP, we present a new method based on detecting frequent patterns. We also demonstrate the efficiency of the proposed methodology by presenting extensive experimental tests.
Keywords:
recommender systems; cooperative location set cover problem; group trip recommendation; frequent pattern mining; MSC:
90B60
1. Introduction
Nowadays, trip recommendation is one of the most important intelligent services for improving user experiences and reducing labor costs in the tourism industry. Trip recommendation is guided by tourist interests and aims to relieve the great number of users/tourists (over one billion tourists travel each year, according to the 2015 annual report of the United Nations World Tourism Organization) from the time and efforts needed to plan visiting places of interest (POIs) by recommending sequences of POIs based (i) on users’ profiles and preferences, (ii) on POIs’ characteristics, (iii) on previous users’ trips, and on other contextual factors. Since tourists abandon standard tour packages in favor of personalized travel itineraries [1,2], the growing importance of POI recommender systems has recently been recognized [3], since arranging independent tours based on tourist guidebooks and/or websites takes a long time.
A lot of models are proposed in the literature to learn the impact of such constraints. Most of them assume a single tourist and aim to recommend personalized itineraries. In the literature, such recommendations are provided by intelligent systems [4,5], although there are other approaches, e.g., recommendations provided by information sharing [6]. However, many tourists travel in groups since traveling together induces social interaction and brings various social benefits, such as family and social capital [7]. Also, traveling in a group supports sustainable tourism.
On the other hand, one of the biggest challenges for traveling in a group is to design personalized tours that meet the preferences of all the members of the group by addressing a variety of tourists requirements that may sometimes result in conflicts and stress for the group members [8]. Trip recommendation for groups of tourists (TRGT) is a complex and time-consuming task. Besides choosing the POIs, several constraints should be satisfied. Such constraints include time constraints, budget constraints, and diversity constraints (visiting POIs from different categories). This constraint satisfaction problem is computationally intractable, and usually it is reduced to the orienteering problem [9].
An early approach to tackling the TRGT is based on aggregating all members’ preferences into a virtual member profile and then transforming the problem to its single member version. This approach is applied to various domains, adopting various aggregation strategies, such as the average strategy [10] or the least misery strategy [11], which assumes a group tends to be as happy as its least happy member.
Most methodologies proposed in the literature for the TRGT problem are based on reducing it to the orienteering problem, the traveling salesman problem, or the vehicle routing problem [12]. These problems have origins in the operational research community, where the objective is to find the optimal path according to a metric of optimality. The principal aim, though, is to consider the personalized interests of the members of the group and not a generalized metric concept.
In this paper, we consider the customized preferences of each member of a group, and we tackle the TRGT problem by reducing it to the cooperative location set cover problem (CLSCP), defined within the operational research field and formulated as an integer linear program [13]. The CLSCP aims to select a group of facilities that can satisfy, in aggregate, all demand points. This problem differs from the well-known location set cover problem (LSCP) in the fact that each demand point is not covered by its closest facility (individual coverage) but by the cooperation of some of the available facilities (cooperative coverage), and a demand point is considered satisfied when the aggregate coverage level exceeds a given threshold. To tackle the CLSCP, we present a new method based on association rule mining that detects frequent itemsets.
The proposed method is suitable for situations in which tourists know the list of must-visit and preferred points. Also, tourists should be aware of their restrictions and budgets (in terms of money, distance, and time).
In what follows, we first present the related work. Then, we present the definition of the cooperative location set cover problem and the proposed methodology. Finally, we present experimental tests and conclude.
2. Related Work
Trip recommendation systems for groups have been proposed for various application domains, such as music [14], TV programs [10], etc. For example, McCarthy [15] proposes a situated restaurant recommender system for recommending restaurants to groups of people all desiring to dine together, based both on the location of these people as well as their culinary preferences. Restaurants/POIs are stored in a database as feature-value pairs. The features represent information for the restaurant. Individual user profiles consist of preferences indicating how important each restaurant feature is to the user. Recommendation is extracted by a heuristic arbitration algorithm, which first ranks restaurants for each user based on comparison to the average preferences of this user over all restaurants and then calculates the group preference for each restaurant by simply summing the individual preferences of the users of the group.
There are only a few methodologies proposed in the literature for the TRGT problem. Ardissono, Goy [16] propose a recommender system that recommends attractions/POIs by considering the preferences of heterogeneous tourist groups. Attractions/POIs are stored in a database as feature-value pairs. Preferences are not described for each member of the group but for homogeneous subgroups, whose members have similar characteristics and are represented by subgroup models. A subgroup model consists of (i) the socio-demographic information of its members, (ii) the system’s estimates of the subgroup requirements on the features of attractions/POIs, (iii) the evaluation/rank of features of attractions/POIs, and (iv) the probability distribution that specifies the likelihood that the subgroup prefers an attraction/POI given a certain feature-value pair. When the user asks for the list of attractions/POIs corresponding to a certain selection criterion, the system displays a recommendation list ranked according to generated subgroup models by using fuzzy evaluation functions. The recommendations are grounded in explanations addressing the possibly conflicting requirements of the group members. Finally, after the user selects certain attractions/POIs from the recommendation list, the system offers an interactive agenda for the user to schedule a tour complying with constraints.
Kinoshita and Heisuke [17] propose a methodology that tries to satisfy two objectives: the preferences of group members need to be achieved as much as possible (total utility of the group—TUG objective), as well as the preferences of group members need to be achieved as evenly as possible (fairness of individual members—FIM objective). The methodology, by using an evolutionary algorithm, first automatically generates a large number of combinations of attractions/POIs, then evaluates these combinations based on attractions/POIs’ characteristics stored in a database, and finally outputs several high scoring combinations as Pareto optimal solutions. Attractions’/POIs’ characteristics stored in the database are expressed as evaluation scores based on certain adjectives. The evaluation scores represent whether the preferences of the group members are achieved. The methodology is not able to handle the FIM objective properly, and it is not able to handle the sequencing and time allocation for each attraction/POI.
Garcia, Sebastia [18] propose a recommender system that recommends a list of tourist activities for a single tourist or group of tourists in a city by maintaining a group profile and combining individual user profiles via intersection or aggregation mechanisms.
Anagnostopoulos, Atassi [19] propose a methodology aiming at meeting the overall group’s tastes (the FIM objective) as well as satisfying a given time and budget constraint. The methodology is based on a generalization of the orienteering problem.
Zheng and Liao [20] propose a methodology that considers a spatial-temporal route structure for handling the known two potential conflicting objectives, i.e., TUG and FIM. The methodology includes POI selection and sequencing, represented by discrete variables, as well as the time spent in POIs, represented by a continuous variable. The methodology is based on a heuristic algorithm in which ant colony optimization (ACO) and a differential evolution algorithm (DEA) evolve discrete and continuous variables, respectively. The methodology optimizes multi-objective solutions by adopting Pareto optimality.
In [21,22,23], a methodology is proposed that is based on the negotiation of tourists in the group. Each user in a group is represented by a personal agent, who knows the user’s preferences and acts on her behalf when trying to agree on items (POIs) with other agents. In order to reach agreements, the agents engage in a cooperative negotiation process.
A current aim of research in group trip recommendations is to provide tour recommendations that include POIs from different categories to avoid “sensory overload” and address conflicting preferences of the members of a group. Most of the work presented in the literature concerns recommendations for single tourist itineraries. For example, in Gionis, Lappas [24], the authors take into account the POI’s categories and consider some relaxed constraints for the POI’s sequential ordering. In Bolzoni, Helmer [25], the authors proposed an algorithm that groups POIs into categories by considering their proximity and maximizes the utility score of recommended POIs by selecting a subset of individual POIs from each POI’s cluster, thus limiting the number of times that each POI category is visited. Considering POI categories is also important for the TRGT problem. For example, in Kargar and Lin [26], a heuristic greedy algorithm is proposed that recommends multi-day tours to a group of tourists meeting requirements regarding distance, time, monetary budget, and POI categories. The main objective is to cover an equal (and maximum) number of preferred POIs for all tourists, i.e., TUG and FIM objectives. Also, the algorithm can handle cases when some tourists in the group (like parents) might have weaker preferences versus other tourists in the group (like children).
3. Cooperative Location Set Cover Problem (CLSCP)
The CLSCP aims to select a group of facilities that can satisfy, in aggregate, all demand points. Recent papers on cooperative cover include Karatas [27], Bagherinejad, Bashiri [28], and Morohosi and Furuta [29].
Each facility emits a “signal”, which decays over the distance, and each demand point observes the aggregated signal emitted by all facilities. It is assumed that a demand point is covered if its aggregated signal exceeds a given threshold; thus, facilities cooperate to provide coverage, as opposed to the classical coverage location model, where coverage is only provided by the closest facility (individual coverage). The aspect of cooperation may also refer to alternative choices when there is a facility failure or congestion.
Consider that facilities represent POIs and demand points represent tourists. Let be the discrete set of tourists that want to travel together, with . Let be the set of points of interest, with . The distance between and is represented by .
represents the preference (signal emitted) of a tourist at a distance from the point of interest . The overall preference level of tourist for points of interest vector , where and is the total number of selected points of interest (decision variable) or is a pre-defined parameter, is given as:
Let be the threshold preference level, which indicates that the tourist is considered satisfied. A tourist is considered satisfied by the points of interest vector , if . Therefore, in the case of the TRGT problem, the aim is to find the appropriate subset of points of interest (POIs) that satisfy the predefined level of preferences of each tourist .
4. Proposed Methodology
The proposed methodology tries to satisfy both the TUG objective (the preferences of group members need to be achieved as much as possible) and the FIM objective (the preferences of group members need to be achieved as evenly as possible). Moreover, the proposed methodology tries to meet requirements regarding time, monetary budget, and diversity of POI’s categories. Every member of a group of tourists has some preferences in common with the other members of the same group (e.g., destination, budget, duration of the trip, preferred means of transport, etc.). However, conflicting preferences may also exist between members of the same group, and the tour itinerary recommendation must address many of them.
The proposed methodology is based on reducing the TRGT problem to the CLSCP described above. A cooperative location set cover problem is considered such that a group of tourists (demand points) are satisfied by observing the aggregated signal “emitted” by a set of POIs (facilities). POIs are divided into categories based on their similarity level. A tourist is covered if her/his aggregated signal exceeds a user-defined threshold concerning each specific criterion (e.g., time, budget, preference, etc.); thus, POIs cooperate to provide coverage to the group of tourists.
We have developed a new heuristic algorithm for tackling the CLSCP problem instead of using an exact method as in Berman, Drezner [13]. This is due to reduced complexity. The developed algorithm is based on extracting frequent items, which is the base task of association rule mining. Similar heuristic techniques have already been used for other location analysis problems [30,31].
A lot of algorithms have been presented in the literature for extracting frequent items with various time complexities (see Chee, Jaafar [32] for a survey). The choice of such an algorithm is not critical to the proposed methodology. We used the apriori algorithm during the tests.
The proposed methodology is presented below:
- Input Matrices:
- POI’s classification matrix (a matrix that shows which POI category each POI belongs to, such as Table 1).
- Preference Matrix (a matrix that shows the preference values assigned to each POI by each group member, such as Table 2).
- Binary Matrix: a matrix derived by discretization of the preference matrix based on a user-defined threshold. Each cell value that is below this threshold equals 0, otherwise 1, as in Table 3.
- User-defined thresholds:
- Preference threshold (the values depend on the input dataset). The FIM objective could be adjusted by defining a maximum value for this threshold.
- The binary threshold is used to discretize the preference matrix into a binary matrix. A high value guarantees that the extracted frequent itemsets consist of POIs that are highly ranked.
- Phase 1.
Form the binary matrix that is used as input to the association rule mining algorithm deference.
- Phase 2.
Perform association rule mining to “Binary Matrix” in order to extract the set of frequent items.
- Phase 3.
Select the most frequent itemset by calculating the number of users (rows) that it covers and, also, by selecting columns that belong to different classes based on the “POI’s classification matrix”.
- Phase 4.
Find the users (rows) that are satisfied during Phase 3 and add the assigned preference values stored in the “Preference Matrix” for each of them, by using the “Preference threshold”.
- Phase 5.
Remove the rows (users) that are satisfied during Phase 4 and then go to Phase 2, considering for each frequent itemset only the columns that have not been already selected in previous iterations.
- Phase 6.
Terminate the process when all rows (users) are satisfied based on the “Preference threshold” or there are no frequent itemsets to consider.
Formally, the input to the methodology is an matrix , where T is the number of tourists in a group and P is the number of POIs. Each cell of holds:
- (1)
- the preference () of tourist for the POI
- (2)
- the time () the tourist wishes at least to spend at POI
- (3)
- the budget () that the tourist wishes at most to spend for POI .
The Algorithm 1 that implements the proposed methodology is as following:
| Algorithm 1 The proposed methodology |
| Input |
| Discretize values based on into binary values |
| Extract frequent itemsets of based on discretized values |
| Step 1. Do until all tourists are covered |
| Step 2. For each frequent itemset do |
| Step 3. For each tourist do |
| Step 4. For each column do |
| End for |
| End for |
| End for |
| Step 5. For each frequent itemset do |
| If |
| Then |
| End for |
| Step 6. Find frequent itemset where |
Detailed Example
In what follows, we present an analytic example of the proposed methodology. Table 1 is a matrix that contains the category (class) that each POI belongs to. POIs are divided into classes based on similarity levels. All POIs that belong to a specific class have common characteristics. The similarity between POIs that belong to the same class might depend on diverse factors, and hence, in some cases, classes might be wider and might contain less similar POIs, whereas, in other cases, POIs of the same class might be more similar. Given a group of tourists and a set of POIs for which the tourists have expressed their level of preference (Table 2), we apply the apriori algorithm to extract the frequent itemsets (e.g., [POI_1, POI_2], [POI_1, POI_3], etc.). A user-defined binary threshold is used to transform Table 2 into a binary matrix (Table 3) that can be used as input to the apriori algorithm. The binary threshold is set to 4, i.e., any value in Table 2 higher or equal to 4 is transformed to 1, while any other value is transformed to 0. The value of the binary threshold depends on the given dataset and the user’s preferences. The minimum support parameter of the apriori algorithm (i.e., the minimum accepted percentage of records in a dataset that contain a frequent item) represents the percentage of tourists in a group that have expressed positive preference for a specific combination of POIs (i.e., a frequent item). The minimum support threshold is set to 30, and the frequent itemsets extracted by applying the apriori algorithm are shown in Table 4 along with their corresponding support values. Frequent itemsets represent combinations of POIs for which some tourists have expressed positive preference (Table 4).

Table 1.
POI’s Classification Matrix.
Table 1.
POI’s Classification Matrix.
| POI | Class |
|---|---|
| POI_1 | Class_1 |
| POI_2 | Class_2 |
| POI_3 | Class_1 |
| POI_4 | Class_1 |
| POI_5 | Class_2 |
Table 2.
Preferences Matrix.
Table 2.
Preferences Matrix.
| POI_1 | POI_2 | POI_3 | POI_4 | POI_5 | |
|---|---|---|---|---|---|
| Tourist_1 | 10 | 2 | 10 | 4 | 1 |
| Tourist_2 | 2 | 9 | 2 | 5 | 6 |
| Tourist_3 | 8 | 5 | 1 | 3 | 10 |
| Tourist_4 | 1 | 2 | 3 | 2 | 6 |
| Tourist_5 | 5 | 7 | 8 | 1 | 4 |
Table 3.
Binary Matrix.
Table 3.
Binary Matrix.
| POI_1 | POI_2 | POI_3 | POI_4 | POI_5 | |
|---|---|---|---|---|---|
| Tourist_1 | 1 | 0 | 1 | 1 | 0 |
| Tourist_2 | 0 | 1 | 0 | 1 | 1 |
| Tourist_3 | 1 | 1 | 0 | 0 | 1 |
| Tourist_4 | 0 | 0 | 0 | 0 | 1 |
| Tourist_5 | 1 | 1 | 1 | 0 | 1 |
Table 4.
Frequent Itemsets.
Table 4.
Frequent Itemsets.
| Frequent Itemset | Minimum Support |
|---|---|
| [POI_1, POI_2] | 40 |
| [POI_1, POI_3] | 40 |
| [POI_1, POI_2, POI_5] | 40 |
| [POI_1, POI_5] | 40 |
| [POI_2, POI_5] | 60 |
In each iteration, the proposed method tries to select the best frequent itemset, i.e., the frequent itemset with the highest minimum support that satisfies as many members of the group of tourists as possible. In this example, the frequent itemset [POI_2, POI_5] has the highest support value (ms = 60%). Each tourist is considered satisfied if the aggregate preference calculated by adding the values stored in the “Preference Matrix”, is greater than the “Preference threshold” which is set to 10 (see Table 5). As a result, 3 out of 5 tourists are satisfied by the selection of [POI_2, POI_5], and the next step considers only the tourists that remain unsatisfied. In the next iteration, the frequent itemset with the highest minimum support is selected, excluding those that were already selected during previous iterations.
Table 5.
Proposed Method.
At the same time, the proposed method tries to provide diverse results and avoid selecting POIs that belong to the same group as POIs selected in previous iterations. During the second iteration, there are four frequent itemsets with the same minimum support, i.e., 40%, and the selection is based on the diversity of the categories of POIs. During the previous iteration, POIs that belong to Class_2 were selected, since POI_2 and POI_5 belong to Class_2. Therefore, during the second iteration, the frequent itemset containing POIs that belong to Class_1 will be preferred [POI_1, POI_3]. The procedure stops when all tourists are satisfied, i.e., all rows are covered.
5. Performance Evaluation
We have conducted experimental tests to demonstrate the efficiency of the proposed methodology. More specifically, we have evaluated the proposed approach by using:
- The LearNext dataset [33], which is usually used as a benchmark in group tourism recommendations [19,34]. This dataset contains:
- The POIs in three different Italian cities (Florence, Pisa, and Rome) are divided into categories, from which we can produce the POI’s classification matrix and
- the trajectories of users, which consist of the user IDs, the POIs’ IDs, and the number of photos taken. In order to form the preference matrix, we consider the preference level for a POI as the number of photos taken in that POI, which is already used as a method in [19].
- A subset of this dataset concerning Pisa is formed by randomly selecting 50 tourists and 50 candidate POIs for recommendation.
- Synthetic data are generated by the ΙΒΜ quest market-basket synthetic data generator, with 20 rows and 50 columns forming transactions of 10 POIs on average.
In the group tourist recommendation literature, the performance evaluation of proposed methods is usually based on the average and the standard deviation of the utility over all members of a group [35]. We enriched the list of evaluation metrics by considering not only the average utility of a group but the individuals’ utility level as well, as well as the well-known precision and recall evaluation metrics. In the presented experimental tests, we formed groups of tourists of different sizes, ranging from 20 to 13,412 members.
More specifically, given the list of all POIs, and the list of recommended POIs by the proposed methodology , where , we evaluate the proposed method by using the following metrics (Table 6) concerning the TUG objective:
Table 6.
Evaluation Metrics.
Experimental tests consider only preference constraints and not cost or time constraints, since the LearNext dataset does not provide such information. Therefore, only the criterion is used during Step 5 of the proposed algorithm presented in the previous section.
Figure 1, Figure 2, Figure 3 and Figure 4 present the evaluation of the proposed method based on the above-mentioned six evaluation measures for the synthetic data. Figure 1 shows the average preference per tourist and the average variation of preference per tourist, both in the initial set and the recommended set, with respect to the preference threshold (pthres). The binary threshold (discr) is set to 0 for all the experiments, i.e., all the POIs ranked by a tourist are considered, because of the sparsity of the datasets. It is shown that iappt and rappt tend to be identical, i.e., the preferences of group members are achieved as much as possible both in the initial preference matrix and in its submatrix formed by the recommended POIs (the minimum support threshold is set to 10%). As far as the variation of preferences is concerned, the recommended set obtained by the proposed method has always a lower value for the recommended set of POIs, which means that the preferences of group members are achieved as evenly as possible (FIM objective), exhibiting lower variation than in the initial preference matrix (the minimum support threshold is set to 10%). Figure 3 shows the precision and recall levels with respect to the pthres. Precision (appt) is always 1, which means that the proposed method recommends POIs that the tourists prefer, while recall (arpt) is high (0.95), which means that the method recommends almost all POIs that are explicitly preferred by the tourists.
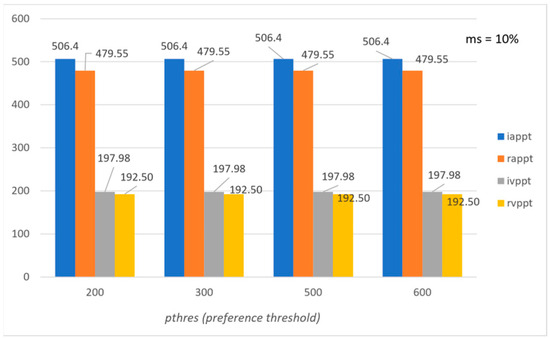
Figure 1.
Average preference and variation of preference level per tourist with respect to pthres (synthetic data).
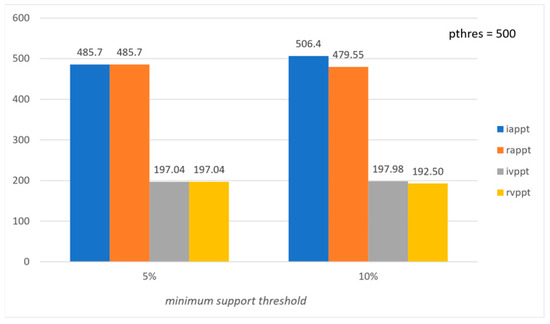
Figure 2.
Average preference and variation of preference level per tourist with respect to ms (synthetic data).
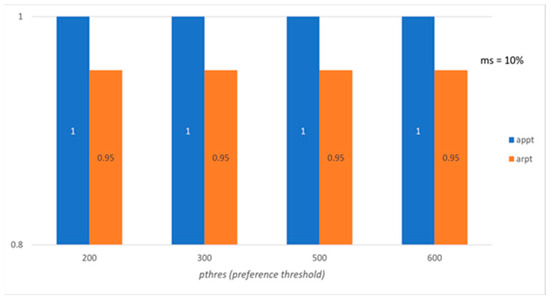
Figure 3.
Average precision and recall per tourist with respect to pthres (synthetic data).
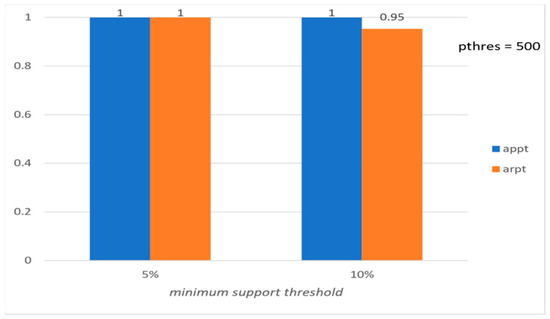
Figure 4.
Average precision and recall per tourist with respect to ms (synthetic data).
Figure 2 and Figure 4 show the values of the six evaluation measures with respect to the minimum support threshold (the preference threshold is set to 500). Note that the ideal values of both the preference threshold and the minimum support threshold depend on the input dataset. Figure 2 and Figure 4 show that the performance of the proposed method is quite stable for a range of minimum support threshold values. It is obvious, though, that a great difference, e.g., vs. , would affect the performance because of the decrease in extracted frequent patterns.
Figure 5, Figure 6, Figure 7 and Figure 8 present the corresponding evaluation of the proposed method based on the above-mentioned six evaluation measures for the subset of the LearNext dataset, containing 50 rows (tourists) and 50 columns (POIs) concerning Pisa. The results show the effectiveness of the proposed approach, and we should highlight the fact that precision (appt) and recall (arpt) equal 1.
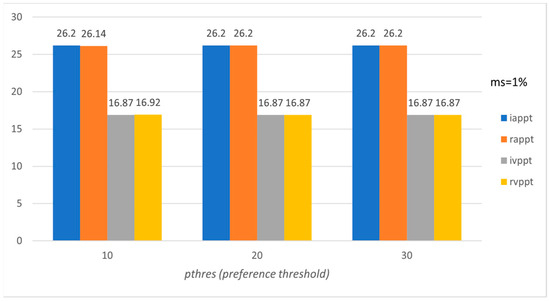
Figure 5.
Average preference and variation of preference level per tourist with respect to pthres (Pisa’s subset).
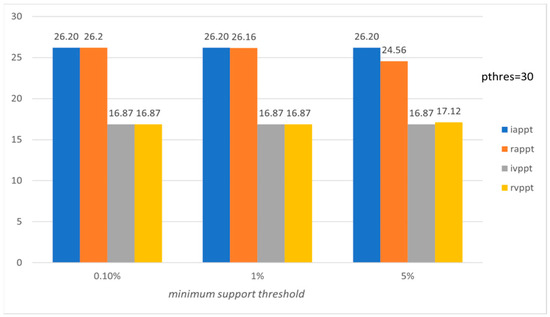
Figure 6.
Average preference and variation of preference level per tourist with respect to ms (Pisa’s subset).
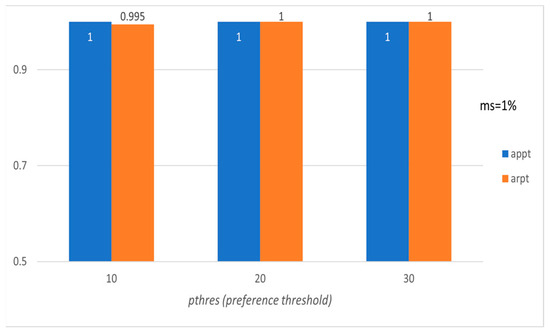
Figure 7.
Average precision and recall per tourist with respect to pthres (Pisa’s subset).
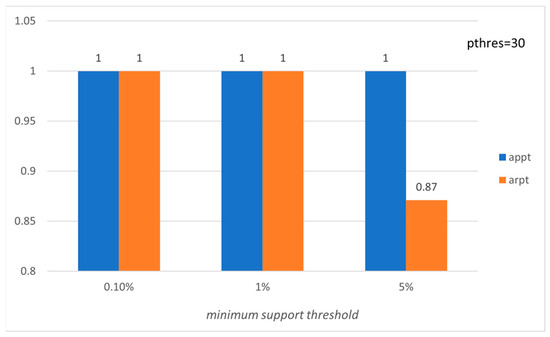
Figure 8.
Average precision and recall per tourist with respect to ms (Pisa’s subset).
Figure 9, Figure 10, Figure 11, Figure 12, Figure 13, Figure 14, Figure 15, Figure 16, Figure 17, Figure 18, Figure 19 and Figure 20 present the corresponding evaluation of the proposed method based on the above-mentioned six evaluation measures for the entire LearNext dataset, which contains data for three different Italian cities (Florence, Pisa, and Rome). The obtained results in this large-scale dataset are affected by the fact that the LearNext dataset [33] is quite sparse. For instance, concerning the Florence subset, which consists of 7000 users and 918 POIs, less than 5 of them are ranked by a tourist on average. In such cases, there are many methods proposed in the literature [36,37,38] that can handle sparsity problems even in cases where there are no records for a user (the cold-start recommendation problem). Therefore, by using such methods, the results can be further improved.
Figure 9.
Average preference and variation of preference level per tourist with respect to pthres (PISA).
Figure 10.
Average preference and variation of preference level per tourist with respect to ms (PISA).
Figure 11.
Average preference and variation of preference level per tourist with respect to pthres (ROME).
Figure 12.
Average preference and variation of preference level per tourist with respect to ms (ROME).
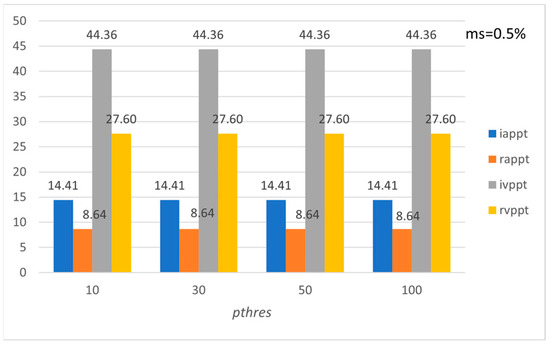
Figure 13.
Average preference and variation of preference level per tourist with respect to pthres (FLORENCE).
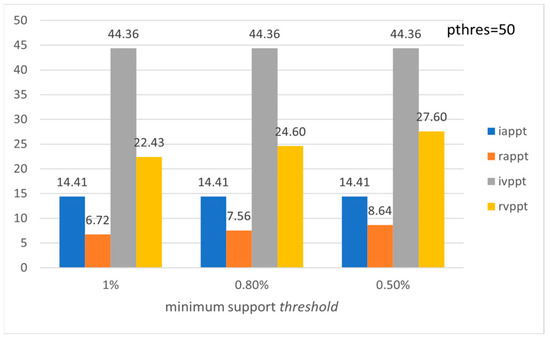
Figure 14.
Average preference and variation of preference level per tourist with respect to ms (FLORENCE).
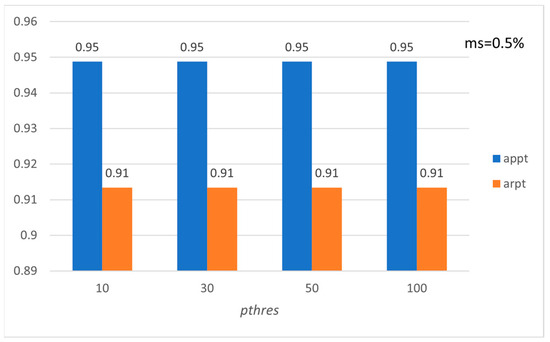
Figure 15.
Average precision and recall per tourist with respect to pthres (PISA).
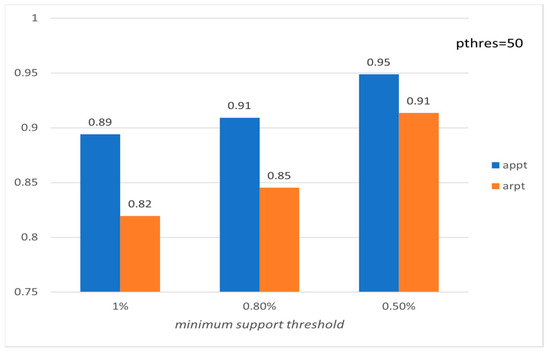
Figure 16.
Average precision and recall per tourist with respect to ms (PISA).
Figure 17.
Average precision and recall per tourist with respect to pthres (ROME).
Figure 18.
Average precision and recall per tourist with respect to ms (ROME).
Figure 19.
Average precision and recall per tourist with respect to pthres (FLORENCE).
Figure 20.
Average precision and recall per tourist with respect to ms (FLORENCE).
Figure 15, Figure 16, Figure 17, Figure 18, Figure 19 and Figure 20 show the corresponding precision and recall levels. Based on the experimental results, it seems that in large data sets, the preference and minimum support thresholds do not significantly affect the performance.
Figure 9, Figure 10, Figure 11, Figure 12, Figure 13 and Figure 14 show the average preference and variation in preference per tourist both in the initial entire set of Pisa’s, Rome’s, and Florence’s POIs and for the subset formed by using the recommended set of POIs. Note that the metrics are calculated for the entire set of tourists in the LearNext dataset (up to 13,412 tourists concerning Rome), while usually in the literature the performance evaluation is based on a subset of tourists, e.g., tourists who have visited at least a minimum number of POIs [19]. Figure 9, Figure 11 and Figure 13 show the performance with respect to preference threshold given a specific minimum support threshold, and Figure 10, Figure 12 and Figure 14 show the performance with respect to minimum support threshold given a specific preference threshold.
The above results show that the proposed method efficiently handles such cases since iappt and rappt metrics are quite similar. The latter also holds for the ivppt and rvppt metrics. Also, appt and arpt metrics show that, on average, most of the recommended POIs are preferred by the tourists in the group, while, on average, most of the POIs preferred by the tourists are recommended by the system.
6. Discussion
The proposed reduction of the TRGT problem to the CLSCP problem has proven to be efficient based on the experimental results. We used a diverse set of evaluation metrics that showed the efficacy of our method both on large datasets and on smaller ones. We used measures that either have been used for evaluating similar methods or are introduced in this paper to evaluate the proposed method.
Also, the proposed method appears to be efficient for very sparse input preference matrices. To tackle the problem of sparse input preference matrices, some researchers evaluate similar methods based on a subset of tourists, e.g., tourists who have visited at least a minimum number of POIs [19].
It seems that the proposed method satisfies both the TUG objective, i.e., preferences of group members achieved as much as possible both in the initial preference matrix and in its submatrix formed by the recommended POIs, and the FIM objective, i.e., preferences of group members achieved as evenly as possible both in the initial preference matrix and in its submatrix formed by the recommended POIs. Also, most of the recommended POIs are preferred by the tourists in the group, while most of the preferred POIs are recommended by the system.
The proposed approach, based on the reduction of the TRGT problem to the CLSCP problem, can handle multiple constraints. The proposed method, as implemented by the algorithm presented in Section 4, can handle cost and time constraints, as well as POI’s category. Also, the proposed method adopts the SUM aggregation model (note that optimizing for the sum or the average are equivalent to each other). However, the proposed approach can handle any other model [39] by modifying Step 4 of the presented algorithm. For instance, the following code implements the LEAST MISERY model:
| Step 4. | For each column do |
| … | |
| End for |
Most methodologies proposed in the literature for the TRGT problem are based on reducing it to operational research models (e.g., the orienteering problem), where the objective is to find the optimal path according to a metric of optimality. Therefore, such methodologies constitute hard problems. For instance, the orienteering problem is APX-hard [40] in general. On the other hand, with respect to the solution of linear programming models using variants of Simplex, it was shown theoretically that exponential cases exist within the class of network problems [41]. Thus, many researchers exploit soft computing, such as genetic algorithms and machine learning, to tackle the high complexity.
The proposed method is a suboptimal method that reduces time complexity while at the same time efficiently satisfying multiple competing objectives, such as TUG and FIM objectives, as well as cost, time, and POI’s category constraints. The time complexity of the proposed method applied to an input binary preference matrix, pref(T,P), is dominated by the time complexity of extracting frequent itemsets. The time complexity of the used algorithm is , where are the examined sets of candidate frequent itemsets (which can be further reduced by using more efficient techniques as in [42,43].
For instance, in Table 7 the quality of the solution and the execution time are presented for both the proposed approach and the approach presented in [19], both adopting the SUM aggregation model. The approach presented in [19] exhibits the best results by exploiting (1) the best user meta-algorithm (BUMA), (2) an ant-colony optimization algorithm (ACO), and (3) the best ratio plus plus (BR++) greedy heuristic [19]. It is very important to note that the group size for the proposed method is the entire set of tourists in the LearNext dataset (13,412/7000/1718), while it is only 20 for the approach presented in [19]. Also, the entire set of POIs is taken into consideration for the proposed approach. Moreover, the size of the datasets used during evaluation of the proposed method (13412/7000/1718) is considerably larger than those (1872/905/134) used during evaluation of the approach presented in [19]. Even using those smaller datasets, many algorithms checked in [19], including the optimal one, fail to terminate in a reasonable time [19].
Table 7.
Comparison with other methods.
Since the LearNext dataset [33] is quite sparse, we also form subsets of ROME, FLORENCE and PISA datasets, having 1794, 891, and 103 instances, respectively, that consist of those tourists that have ranked at least 10 POIs for both ROME and FLORENCE datasets and 8 for the PISA one. The results for the proposed method are shown in Table 4.
Finally, we randomly formed five subsets of each of ROME, FLORENCE, and PISA datasets. To compare with the method presented in [19], each such subset consists of only 20 tourists. The results for the proposed method are shown in Table 7.
Of course, since the proposed method is not optimal, it has limitations. For instance, some tourists (demand points) are not covered. The number of uncovered tourists depends on the number of tourists; for instance, it is 0% for small datasets (PISA subset and synthetic dataset) and 79% for the ROME dataset (pthres = 10). However, even in the latter case, the quality of the result (rappt) should be evaluated with respect to the initial average preference per tourist (iappt), as shown in the input preference matrix (see previous section).
7. Conclusions
It was proven that the proposed method is efficient based on the experimental results. The preferences of group members were achieved as much as possible and as evenly as possible. Also, most of the recommended POIs are preferred by the tourists in the group, while most of the preferred POIs are recommended by the system.
The accuracy of the proposed method achieved by the setup presented in this paper is grounds for applying it to extended problems, such as those considering more constraints. We plan to extend the proposed method in order to handle more constraints apart from cost, time, and POI category, such as the location of tourists in the group and POI sequencing.
Moreover, we plan to check the proposed method by exploiting more information about tourists, such as personal and demographic information data or feedback about the satisfaction of tourists regarding their previous interactions with the recommendation process. Also, we plan to exploit the method presented in [38] in order to tackle sparsity problems. The above extensions could further improve the results of the proposed method.
Thus, the proposed approach, based on the reduction of the TRGT problem to the CLSCP problem, is a new approach that can be easily extended for handling various constraints and aggregation models, while at the same time, as a suboptimal method, it exhibits low time complexity even for large datasets.
Author Contributions
Conceptualization, G.T.; methodology, B.B. and G.T.; validation, A.P.; resources, A.P.; writing, G.T., B.B. and A.P.; visualization, G.T. and B.B. All authors have read and agreed to the published version of the manuscript.
Funding
This research received no external funding.
Data Availability Statement
Publicly available datasets were analyzed in this study. This data can be found here: http://hpc.isti.cnr.it/~muntean/datasets/LearNext.tar.gz, accessed on 15 February 2023.
Acknowledgments
The authors would like to thank Anastasios Tsimakis for his invaluable support during the implementation of the proposed method.
Conflicts of Interest
The authors declare no conflict of interest.
References
- Hyde, K.F.; Lawson, R. The Nature of Independent Travel. J. Travel Res. 2003, 42, 13–23. [Google Scholar] [CrossRef]
- Tsaur, S.-H.; Yen, C.-H.; Chen, C.-L. Independent tourist knowledge and skills. Ann. Tour. Res. 2010, 37, 1035–1054. [Google Scholar] [CrossRef]
- Gavalas, D.; Konstantopoulos, C.; Mastakas, K.; Pantziou, G. A survey on algorithmic approaches for solving tourist trip design problems. J. Heuristics 2014, 20, 291–328. [Google Scholar] [CrossRef]
- Chaudhari, K.; Thakkar, A. A Comprehensive Survey on Travel Recommender Systems. Arch. Comput. Methods Eng. 2020, 27, 1545–1571. [Google Scholar] [CrossRef]
- Sánchez, P.; Bellogín, A. Point-of-Interest Recommender Systems Based on Location-Based Social Networks: A Survey from an Experimental Perspective. ACM Comput. Surv. 2022, 54, 1–37. [Google Scholar] [CrossRef]
- Tatsiopoulos, C.; Boutsinas, B. Automatic knowledge exchanging between tourists via mobile devices. J. Hosp. Tour. Technol. 2010, 1, 163–173. [Google Scholar] [CrossRef]
- Minnaert, L.; Maitland, R.; Miller, G. Tourism and social policy: The Value of Social Tourism. Ann. Tour. Res. 2009, 36, 316–334. [Google Scholar] [CrossRef]
- Jameson, A. More than the sum of its members: Challenges for group recommender systems. In Proceedings of the Working Conference on Advanced Visual Interfaces, Gallipoli, Italy, 25–28 May 2004; Association for Computing Machinery: Gallipoli, Italy, 2004; pp. 48–54. [Google Scholar]
- Vansteenwegen, P.; Van Oudheusden, D. The Mobile Tourist Guide: An OR Opportunity. OR Insight 2007, 20, 21–27. [Google Scholar] [CrossRef]
- Yu, Z.; Zhou, X.; Hao, Y.; Gu, J. TV Program Recommendation for Multiple Viewers Based on user Profile Merging. User Model. User-Adapt. Interact. 2006, 16, 63–82. [Google Scholar] [CrossRef]
- O’connor, M.; Cosley, D.; Konstan, J.A.; Riedl, J. PolyLens: A Recommender System for Groups of Users. In Proceedings of the ECSCW 2001: Seventh European Conference on Computer Supported Cooperative Work, Bonn, Germany, 16–20 September 2001; Prinz, W., Ed.; Springer: Dordrecht, The Netherlands, 2001; pp. 199–218. [Google Scholar]
- Lim, K.H.; Chan, J.; Karunasekera, S.; Leckie, C. Tour recommendation and trip planning using location-based social media: A survey. Knowl. Inf. Syst. 2019, 60, 1247–1275. [Google Scholar] [CrossRef]
- Berman, O.; Drezner, Z.; Krass, D. Cooperative cover location problems: The planar case. IIE Trans. 2009, 42, 232–246. [Google Scholar] [CrossRef]
- Crossen, A.; Budzik, J.; Hammond, K.J. Flytrap: Intelligent group music recommendation. In Proceedings of the 7th International Conference on Intelligent User Interfaces, San Francisco, CA, USA, 13–16 January 2002; Association for Computing Machinery: San Francisco, CA, USA, 2002; pp. 184–185. [Google Scholar]
- McCarthy, J.F. Pocket restaurantfinder: A situated recommender system for groups. In Proceedings of the Workshop on Mobile ad-hoc Communication at the 2002 ACM Conference on Human Factors in Computer Systems, Lausanne, Switzerland, 9–11 June 2002. [Google Scholar]
- Ardissono, L.; Goy, A.; Petrone, G.; Segnan, M.; Torasso, P. Intrigue: Personalized recommendation of tourist attractions for desktop and hand held devices. Appl. Artif. Intell. 2003, 17, 687–714. [Google Scholar] [CrossRef]
- Kinoshita, Y.; Heisuke, Y. A tour route planning support system with consideration of the preferences of group members. In Proceedings of the 2008 IEEE International Conference on Systems, Man and Cybernetics, Singapore, 12–15 October 2008. [Google Scholar]
- Garcia, I.; Sebastia, L.; Onaindia, E. On the design of individual and group recommender systems for tourism. Expert Syst. Appl. 2011, 38, 7683–7692. [Google Scholar] [CrossRef]
- Anagnostopoulos, A.; Atassi, R.; Becchetti, L.; Fazzone, A.; Silvestri, F. Tour recommendation for groups. Data Min. Knowl. Discov. 2017, 31, 1157–1188. [Google Scholar] [CrossRef]
- Zheng, W.; Liao, Z. Using a heuristic approach to design personalized tour routes for heterogeneous tourist groups. Tour. Manag. 2019, 72, 313–325. [Google Scholar] [CrossRef]
- Villavicencio, C.; Schiaffino, S.; Diaz-Pace, J.A.; Monteserin, A.; Demazeau, Y.; Adam, C. A MAS Approach for Group Recommendation Based on Negotiation Techniques. In Advances in Practical Applications of Scalable Multi-agent Systems; The PAAMS Collection; Springer International Publishing: Cham, Switzerland, 2016. [Google Scholar]
- Schiaffino, S.; Godoy, D.; Pace, J.A.D.; Demazeau, Y. A MAS-Based Approach for POI Group Recommendation in LBSN. In Advances in Practical Applications of Agents, Multi-Agent Systems, and Trustworthiness; The PAAMS Collection; Springer International Publishing: Cham, Switzerland, 2020. [Google Scholar]
- Garcia, I.; Sebastia, L.; Onaindia, E. A Negotiation Approach for Group Recommendation. In Proceedings of the International Conference on Artificial Intelligence (ICAI-2009), Las Vegas, NA, USA, 13–16 July 2009. [Google Scholar]
- Gionis, A.; Lappas, T.; Pelechrinis, K.; Terzi, E. Customized tour recommendations in urban areas. In Proceedings of the 7th ACM International Conference on Web Search and Data Mining, New York, NY, USA, 24–28 February 2014; Association for Computing Machinery: New York, NY, USA, 2014; pp. 313–322. [Google Scholar]
- Bolzoni, P.; Helmer, S.; Wellenzohn, K.; Gamper, J.; Andritsos, P. Efficient itinerary planning with category constraints. In Proceedings of the 22nd ACM SIGSPATIAL International Conference on Advances in Geographic Information Systems, Dallas, TX, USA, 4–7 November 2014; Association for Computing Machinery: Dallas, TX, USA, 2014; pp. 203–212. [Google Scholar]
- Kargar, M.; Lin, Z. A socially motivating and environmentally friendly tour recommendation framework for tourist groups. Expert Syst. Appl. 2021, 180, 115083. [Google Scholar] [CrossRef]
- Karatas, M. A multi-objective facility location problem in the presence of variable gradual coverage performance and cooperative cover. Eur. J. Oper. Res. 2017, 262, 1040–1051. [Google Scholar] [CrossRef]
- Bagherinejad, J.; Bashiri, M.; Nikzad, H. General form of a cooperative gradual maximal covering location problem. J. Ind. Eng. Int. 2018, 14, 241–253. [Google Scholar] [CrossRef]
- Morohosi, H.; Furuta, T. Two Approaches to Cooperative Covering Location Problem and Their Application to Ambulance Deployment. In Operations Research Proceedings 2015; Springer International Publishing: Cham, Switzerland, 2017. [Google Scholar]
- Panteli, A.; Boutsinas, B.; Giannikos, I. On solving the multiple p-median problem based on biclustering. Oper. Res. 2021, 21, 775–799. [Google Scholar] [CrossRef]
- Panteli, A.; Boutsinas, B.; Giannikos, I. On Set Covering Based on Biclustering. Int. J. Inf. Technol. Decis. Mak. 2014, 13, 1029–1049. [Google Scholar] [CrossRef]
- Chee, C.-H.; Jaafar, J.; Aziz, I.A.; Hasan, M.H.; Yeoh, W. Algorithms for frequent itemset mining: A literature review. Artif. Intell. Rev. 2019, 52, 2603–2621. [Google Scholar] [CrossRef]
- Baraglia, R.; Muntean, C.I.; Nardini, F.M.; Silvestri, F. LearNext: Learning to predict tourists movements. In Proceedings of the 22nd ACM international conference on Information & Knowledge Management, San Francisco, CA, USA, 27 October–1 November 2013; Association for Computing Machinery: San Francisco, CA, USA, 2013; pp. 751–756. [Google Scholar]
- Muntean, C.I.; Nardini, F.M.; Silvestri, F.; Baraglia, R. On Learning Prediction Models for Tourists Paths. ACM Trans. Intell. Syst. Technol. 2015, 7, 1–34. [Google Scholar] [CrossRef]
- Garcia, I.; Sebastia, L.; Onaindia, E.; Guzman, C. A Group Recommender System for Tourist Activities. In E-Commerce and Web Technologies; Springer: Berlin/Heidelberg, Germany, 2009. [Google Scholar]
- Shaw, G.; Xu, Y.; Geva, S. Using Association Rules to Solve the Cold-Start Problem in Recommender Systems. In Advances in Knowledge Discovery and Data Mining; Springer: Berlin/Heidelberg, Germany, 2010. [Google Scholar]
- Rashid, A.M.; Karypis, G.; Riedl, J. Learning preferences of new users in recommender systems: An information theoretic approach. J. Sigkdd. Explor. Newsl. 2008, 10, 90–100. [Google Scholar] [CrossRef]
- Panteli, A.; Boutsinas, B. Addressing the Cold-Start Problem in Recommender Systems Based on Frequent Patterns. Algorithms 2023, 16, 182. [Google Scholar] [CrossRef]
- Masthoff, J. Group Recommender Systems: Combining Individual Models. In Recommender Systems Handbook; Ricci, F., Ed.; Springer: Boston, MA, USA, 2011; pp. 677–702. [Google Scholar]
- Blum, A.; Chawla, S.; Karger, D.R.; Lane, T.; Meyerson, A.; Minkoff, M. Approximation Algorithms for Orienteering and Discounted-Reward TSP. SIAM J. Comput. 2007, 37, 653–670. [Google Scholar] [CrossRef]
- Megiddo, N. On the Complexity of Linear Programming; IBM Thomas J. Watson Research Division: Yorktown Heights, NY, USA, 1986. [Google Scholar]
- Han, J.; Pei, J.; Yin, Y.; Mao, R. Mining Frequent Patterns without Candidate Generation: A Frequent-Pattern Tree Approach. Data Min. Knowl. Discov. 2004, 8, 53–87. [Google Scholar] [CrossRef]
- Boutsinas, B.; Siotos, C.; Gerolimatos, A. Distributed Mining of Association Rules based on reducing the support threshold. Int. J. Artif. Intell. Tools 2008, 17, 1109–1129. [Google Scholar] [CrossRef]
Disclaimer/Publisher’s Note: The statements, opinions and data contained in all publications are solely those of the individual author(s) and contributor(s) and not of MDPI and/or the editor(s). MDPI and/or the editor(s) disclaim responsibility for any injury to people or property resulting from any ideas, methods, instructions or products referred to in the content. |
© 2023 by the authors. Licensee MDPI, Basel, Switzerland. This article is an open access article distributed under the terms and conditions of the Creative Commons Attribution (CC BY) license (https://creativecommons.org/licenses/by/4.0/).