2. Materials and Methods
These methodological steps were followed:
The V4 region was selected as a group of four countries for the analysis. The first reason was the similar historical, political, and economic development of Czechia, Hungary, Poland, and Slovakia [
53]. All countries belong between emerging markets and Central European Countries. Secondly, it was focused on transport enterprises and targeted to deliver a cross-country study, not only an investigation of one country. Mazanec [
2] proves that Visegrad Group provides relevant background to assess the business performance of the transport sector and that it is possible to use these countries as the entire region.
The provided investigation is a fraction of comprehensive research that focuses on the implementation framework of Industry 4.0. This part assesses profitability in an individual sector within the V4 region before and during the COVID-19 pandemic, including the consequences of Industry 4.0 during the crisis. Previous research confirms the striking effect of smart sensors as tools of I4.0 individually to balance the profit of Czech, Hungarian, Polish, and Slovak enterprises [
54]. That is how the period 2016–2021 was chosen. Molendowski et al. [
55] also confirm this period to justify the Industry 4.0 concept. The research will be followed by an extension and analysis of the post-COVID-19 period, 2022–2023, to indicate changes caused by overcoming the crisis.
- 2.
Creation and structure of a sample
The data was gained from the ORBIS database, which is provided by Bureau van Dijk. The database supplies information on more than 400 million large-scale private and public enterprises [
56]. It was focused only on enterprises from NACE H, specifically, H.49 Land transport and transport via pipelines, H.50 Water transport, and H.51 Air transport. The origin set contained missing cases because of various strict legislative rules for accounting [
57]. This fact caused an unbalanced sample according to countries. But the data was proven by national financial authorities when included in the ORBIS database. Leys et al. [
58] recommend following a two-step procedure to deal with outliers. First, it is necessary to detect the possible candidates by using appropriate quantitative tools. Then, to manage outliers and decide whether to keep, remove, or recode these values based on qualitative information. In this exploration, the outliers were not removed to show a relevant sample, reflecting the actual situation in the transport sector during the analyzed period. Thus, the final sample from the V4 region included 159 Czech enterprises, 48 Hungarian enterprises, 8 Polish enterprises, and 319 Slovak enterprises. Together, 534 enterprises were available to compute all the chosen ratios of profitability. In addition, 332 selected enterprises have applied Industry 4.0, and 202 selected enterprises have not applied Industry 4.0 within the transport sector.
The classification shown in
Table 2 is based on the ORBIS database. To be categorized as a medium, large, or very large enterprise, an enterprise must satisfy the requirements shown in the table. If not, the company was categorized as a small enterprise [
59].
Table 3 covers the structure of the final sample based on ORBIS classification criteria.
- 3.
Choice of profitability ratios
This article focused on the profitability of transport enterprises. Six rations were selected to gain a comprehensive spectrum of the mentioned area.
Table 4 involves these indicators, the algorithm of the calculation, and the abbreviation used. All indicators were computed with earnings before tax (EBT) because of the use of enterprises from different countries [
60].
- 4.
Disclosure of a shift
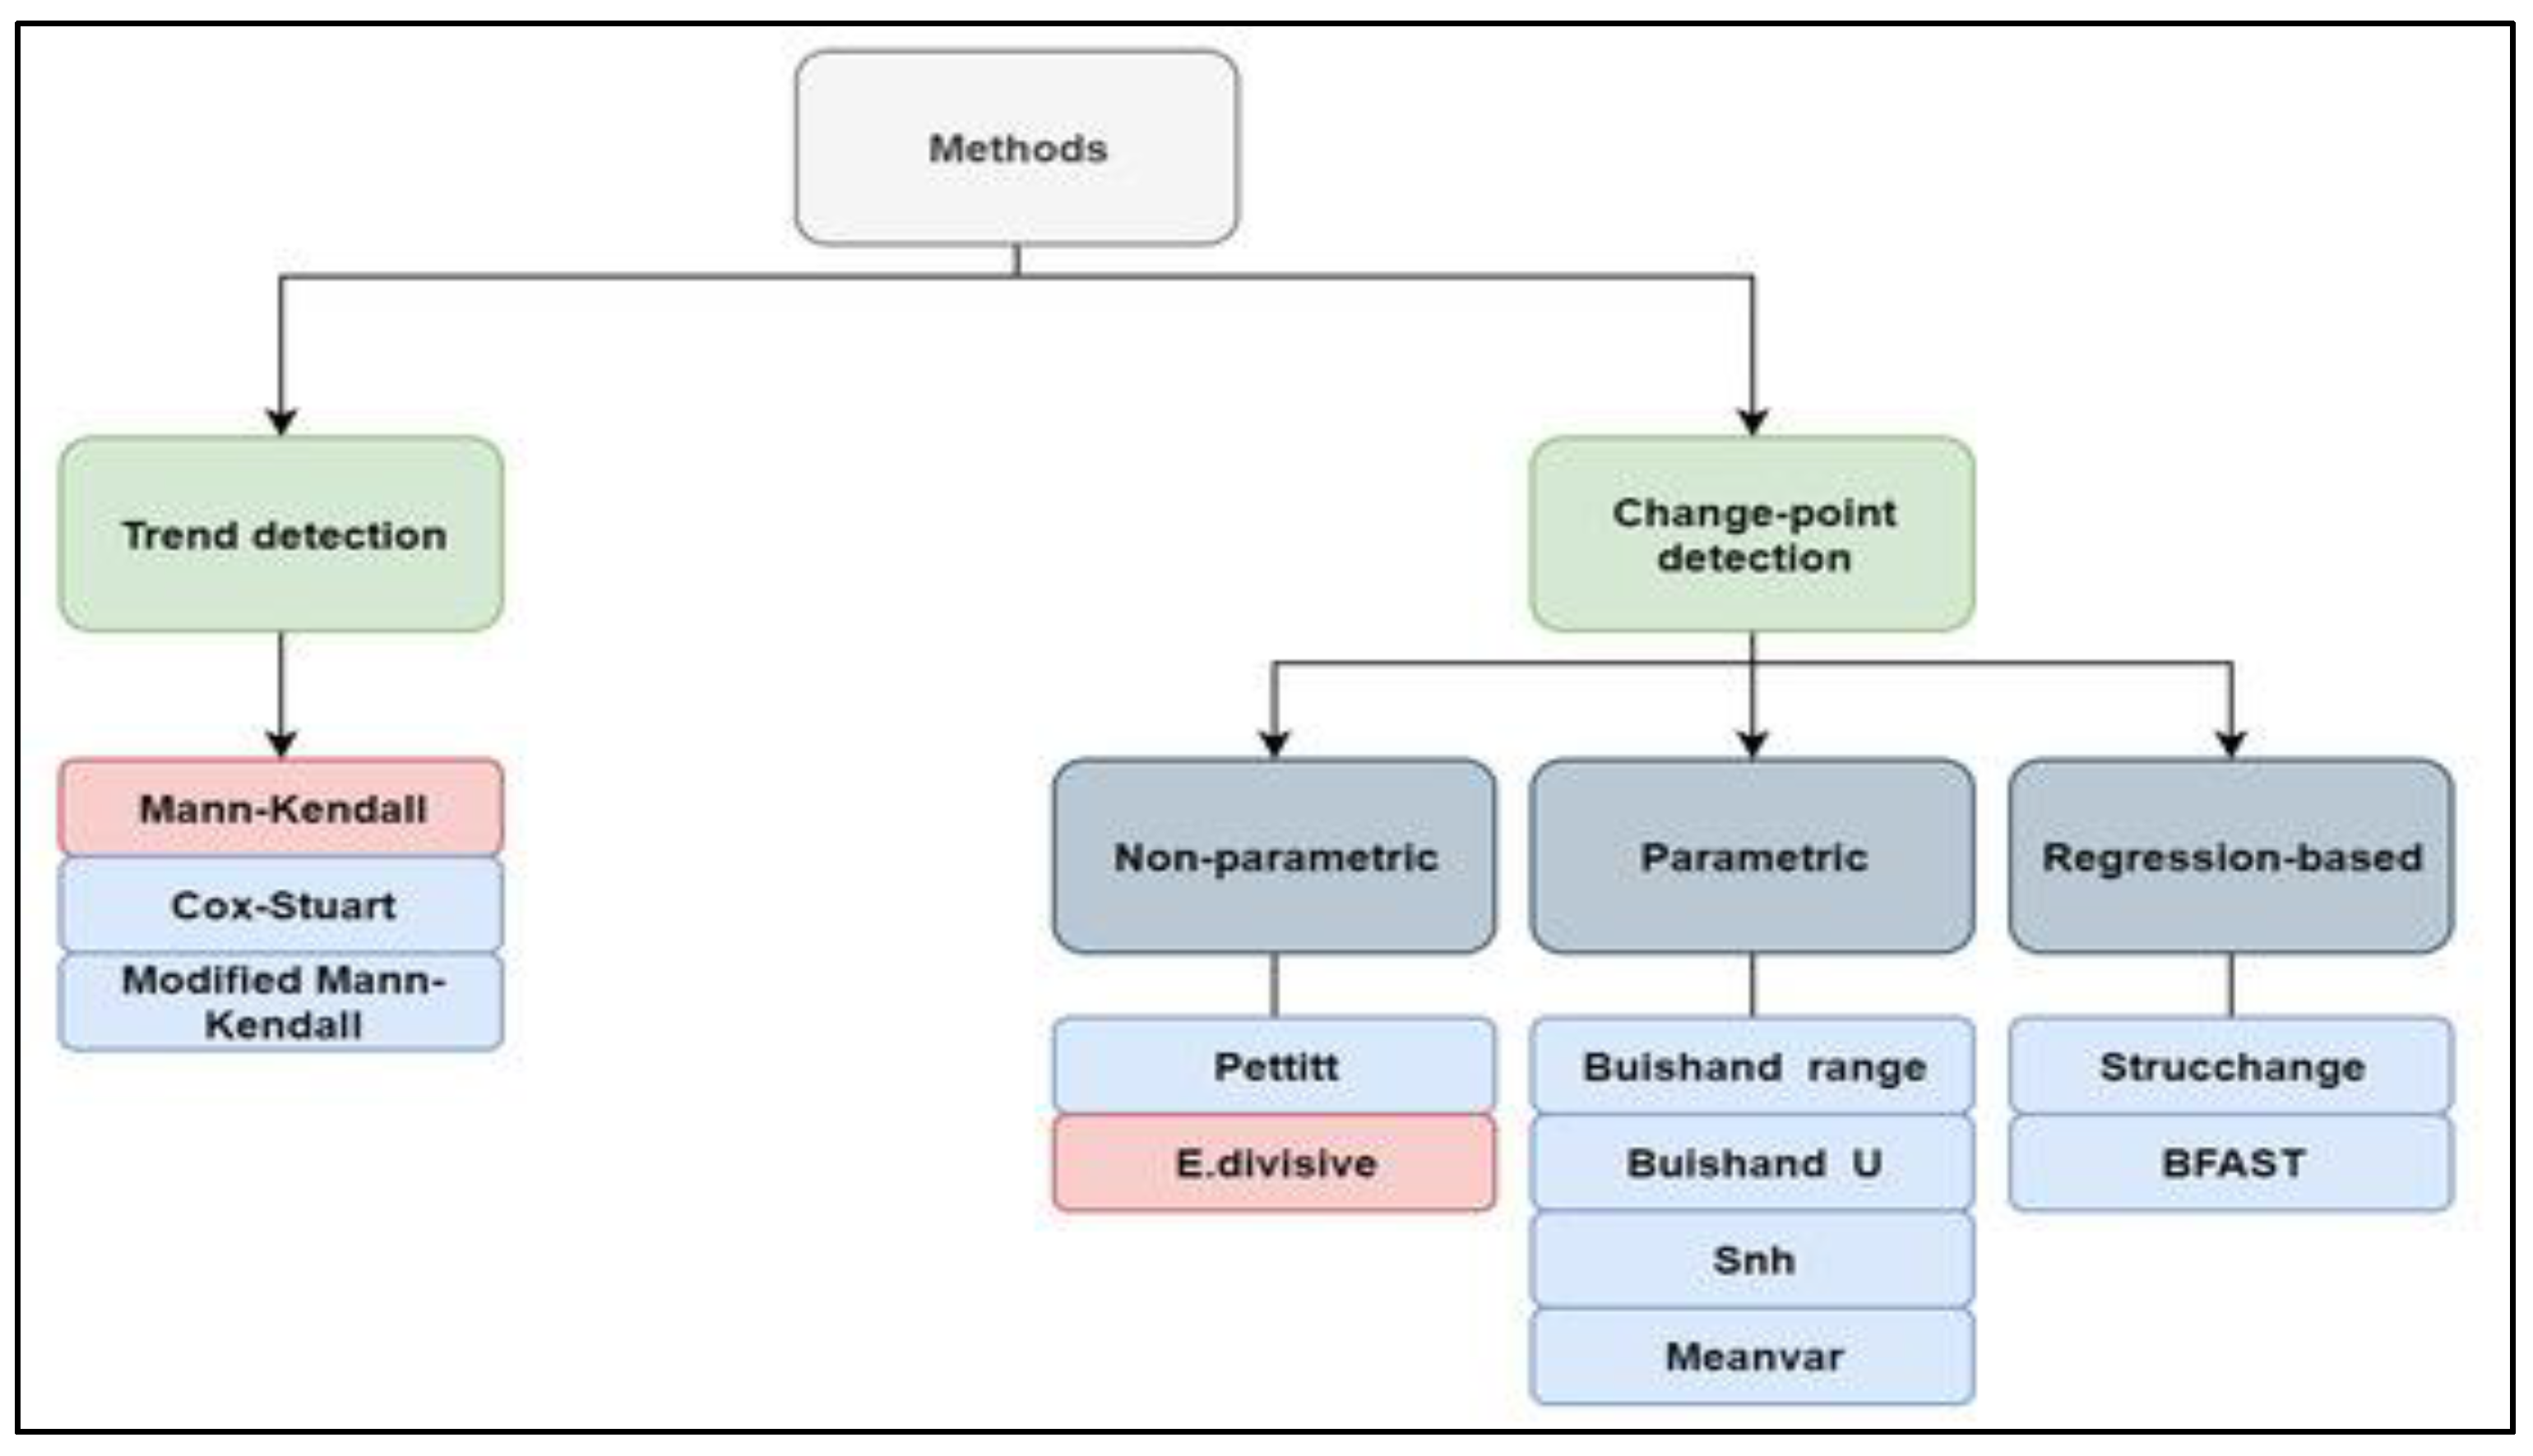
Behavioural economics has led to a new way of looking at economics and finance [
73]. Thus, the unusual assessment of profitability ratios by time series was used. A practical problem in time-ordered observations is looking for statistical techniques for gradual and/or abrupt changes in data distribution over time [
74,
75]. The process of identifying an abrupt change, usually due to distributional or structural change, is called change-point detection, where change-point refers to a period in which the behaviour of observations somehow changes. Gradual changes are, however, considered smooth departures from past norms [
75]. Many methods have been recommended for trend detection and change-point detection. Militino et al. [
75] summarise potential methods for both groups (
Figure 2).
The pink boxes in
Figure 2 highlight the available methods for univariate and multivariate settings. Musa et al. [
76] note that multivariate and panel data are mostly used to investigate the temporal evolution of different units of the same sector or market, characterised by an extensive cross-sectional structure across several periods. The panel format of data allows for the analysis of time series for every entity in a cross-sectional selection. Multivariable analyses use more sophisticated statistical methods than univariable analyses. But we have realised univariate solutions in this investigation. In addition, this research focuses only on finding change points (specific shifts), not gradual changes. Assume a situation where there is a single change-point in
. Change-point detection methods look for a possible time
such that
where
and
are the distributions of
and
respectively. In this case, the null hypothesis
claims that the distribution of
does not change over time, while the alternative hypothesis
assumes a change in the distribution of
at time
[
75].
The normal distribution was not tested for univariate in the development of profitability ratios for every enterprise in the sample. That is how the nonparametric sign test (Pettitt’s test) was used to detect shifts with the 100,000 Monte Carlo simulations.
This test is based on Mann–Whitney two-sample test and its statistic is defined as:
Under the null hypothesis and for each
, the distribution of
is symmetric around zero with
. It is expected to have large values for
when there is a shift in data. Considering continuous observations, it is
where
is the corresponding rank of the data point
[
75,
77]. The approximate
p-value is
and the value of
provided by equation 1 is considered the most probable change point [
78]. Positive and negative sights were tested for each enterprise. The analysis allows for formulating hypotheses as follows:
Hypothesis 0 (H0). ROA, ROC, ROE, ROS, ROR, and ROW are homogeneous.
Hypothesis 1 (H1). There is a date at which there is a positive (or negative) shift in the ROA, ROC, ROE, ROS, ROR, and ROW.
The values of the individual terms of the observed time series (ROA, ROC, ROE, ROS, ROR, and ROW) reflect only the natural variability of the studied variable. They are unaffected by external factors if one cannot reject the null hypothesis. If one can reject the null hypothesis, the implication is that there is a cause that has affected the development of ROA, ROC, ROE, ROS, ROR, and ROW in a positive or negative direction. In this case, the application of Industry 4.0 is discussed as an influencing factor.
- 5.
Confirmation of a dependency
The shifts in the development of profitability ratios were detected, and then the dependency between two nominal variables was tested. The Pearson chi-square (
) test determines the existence or non-existence of independence between two variables [
79]. It was run to identify the dependency between a shift in profitability (positive, negative, or no shift) and applying Industry 4.0 (yes or no). The basic idea underlying this is to compare the observed data values with the expected values if the prerequisites are met. The assumption of 80% of expected observations must be equal to or higher than value 5, and the second assumption of all cells of expected counts must be higher than value 1 [
80].
The following hypotheses were verified:
Hypothesis 0 (H0). The variable shift in ROA (ROC, ROE, ROS, ROR, or ROW) and the variable applying Industry 4.0 are independent.
Hypothesis 2 (H2). There is a link between the variable shift in ROA (ROC, ROE, ROS, ROR, or ROW) and the variable applying Industry 4.0.
In addition, contingency coefficients for nominal variables were calculated.
where
is test statistic from Pearson
test,
is the number of total observations,
is the number of rows,
is the number of columns [
59].
Musova et al. [
81], Dzurikova and Zvarikova [
82] set the limits for the strength of the contingency coefficients as follows:
computed coefficient weak link.
computed coefficient medium link.
computed coefficient strong link.
The significance of coefficients was also proven to rule out the possibility of randomness of dependency in the used sample. The hypotheses for testing the significance of coefficients were as follows:
Hypothesis 0 (H0). Computed coefficient is not statistically significant.
Hypothesis 3 (H3). Computed coefficient is statistically significant.
- 6.
Confirmation of a proportion
This part extends the research of Durana and Valaskova [
54] to confirm a positive shift in a specific proportion of enterprises that applied Industry 4.0 through the used sample. It used the same methodology as in the mentioned research (one-proportion z-test) for ROA, ROC, ROE, ROS, ROR, and ROW.
Svabova et al. [
83] noted that the null hypothesis was that the proportion of character
in the population was equal to the constant
(a test proportion). The alternative hypothesis in this exploration was that the proportion of character
was greater than the chosen constant. The proportion occurred in the population at a higher rate than was assumed.
An assumption of the
-test is that the size of the sample must be sufficiently large while considering the occurrence of the required character within it. The fulfilment of this assumption is very important to use the approximation of the distribution of the test statistics using the normal distribution. The sample is large enough if:
where:
where
is the number of enterprises with positive shifts in the chosen profitability ratios and
is the total range of the used sample.
The test statistic
is defined as:
The test statistic may be greater than the standard normal distribution z2α for the upper-tailed hypothesis. Thus, one should reject the null hypothesis and accept the alternative hypothesis. The test proportion π0 was set at level 0.25. This meant that it should have been a derived conclusion for 25% of transport enterprises in the V4 region.
The percentage volume was determined because of a recent conclusion at a global level that the four technology groups of Industry 4.0 technologies (artificial vision and artificial intelligence, additive manufacturing and robotics, big data and advanced analytics, and the Internet of Things) may contribute to improving efficiency by an average of 15–25% in the processes where they are integrated within enterprises [
84]. This research may add that Industry 4.0 is successful not only in efficiency but also in profitability.
The hypotheses for testing the significance of coefficients were as follows:
Hypothesis 0 (H0). 25% of enterprises involved in Industry 4.0 had positive shifts in ROA (ROC, ROE, ROS, ROR, or ROW).
Hypothesis 4 (H4). More than 25% of enterprises involved in Industry 4.0 had positive shifts in ROA (ROC, ROE, ROS, ROR, or ROW).
3. Results
Firstly, descriptive characteristics (maximum, minimum, mean, standard deviation, and median) for each ratio and each year were calculated (
Table 5).
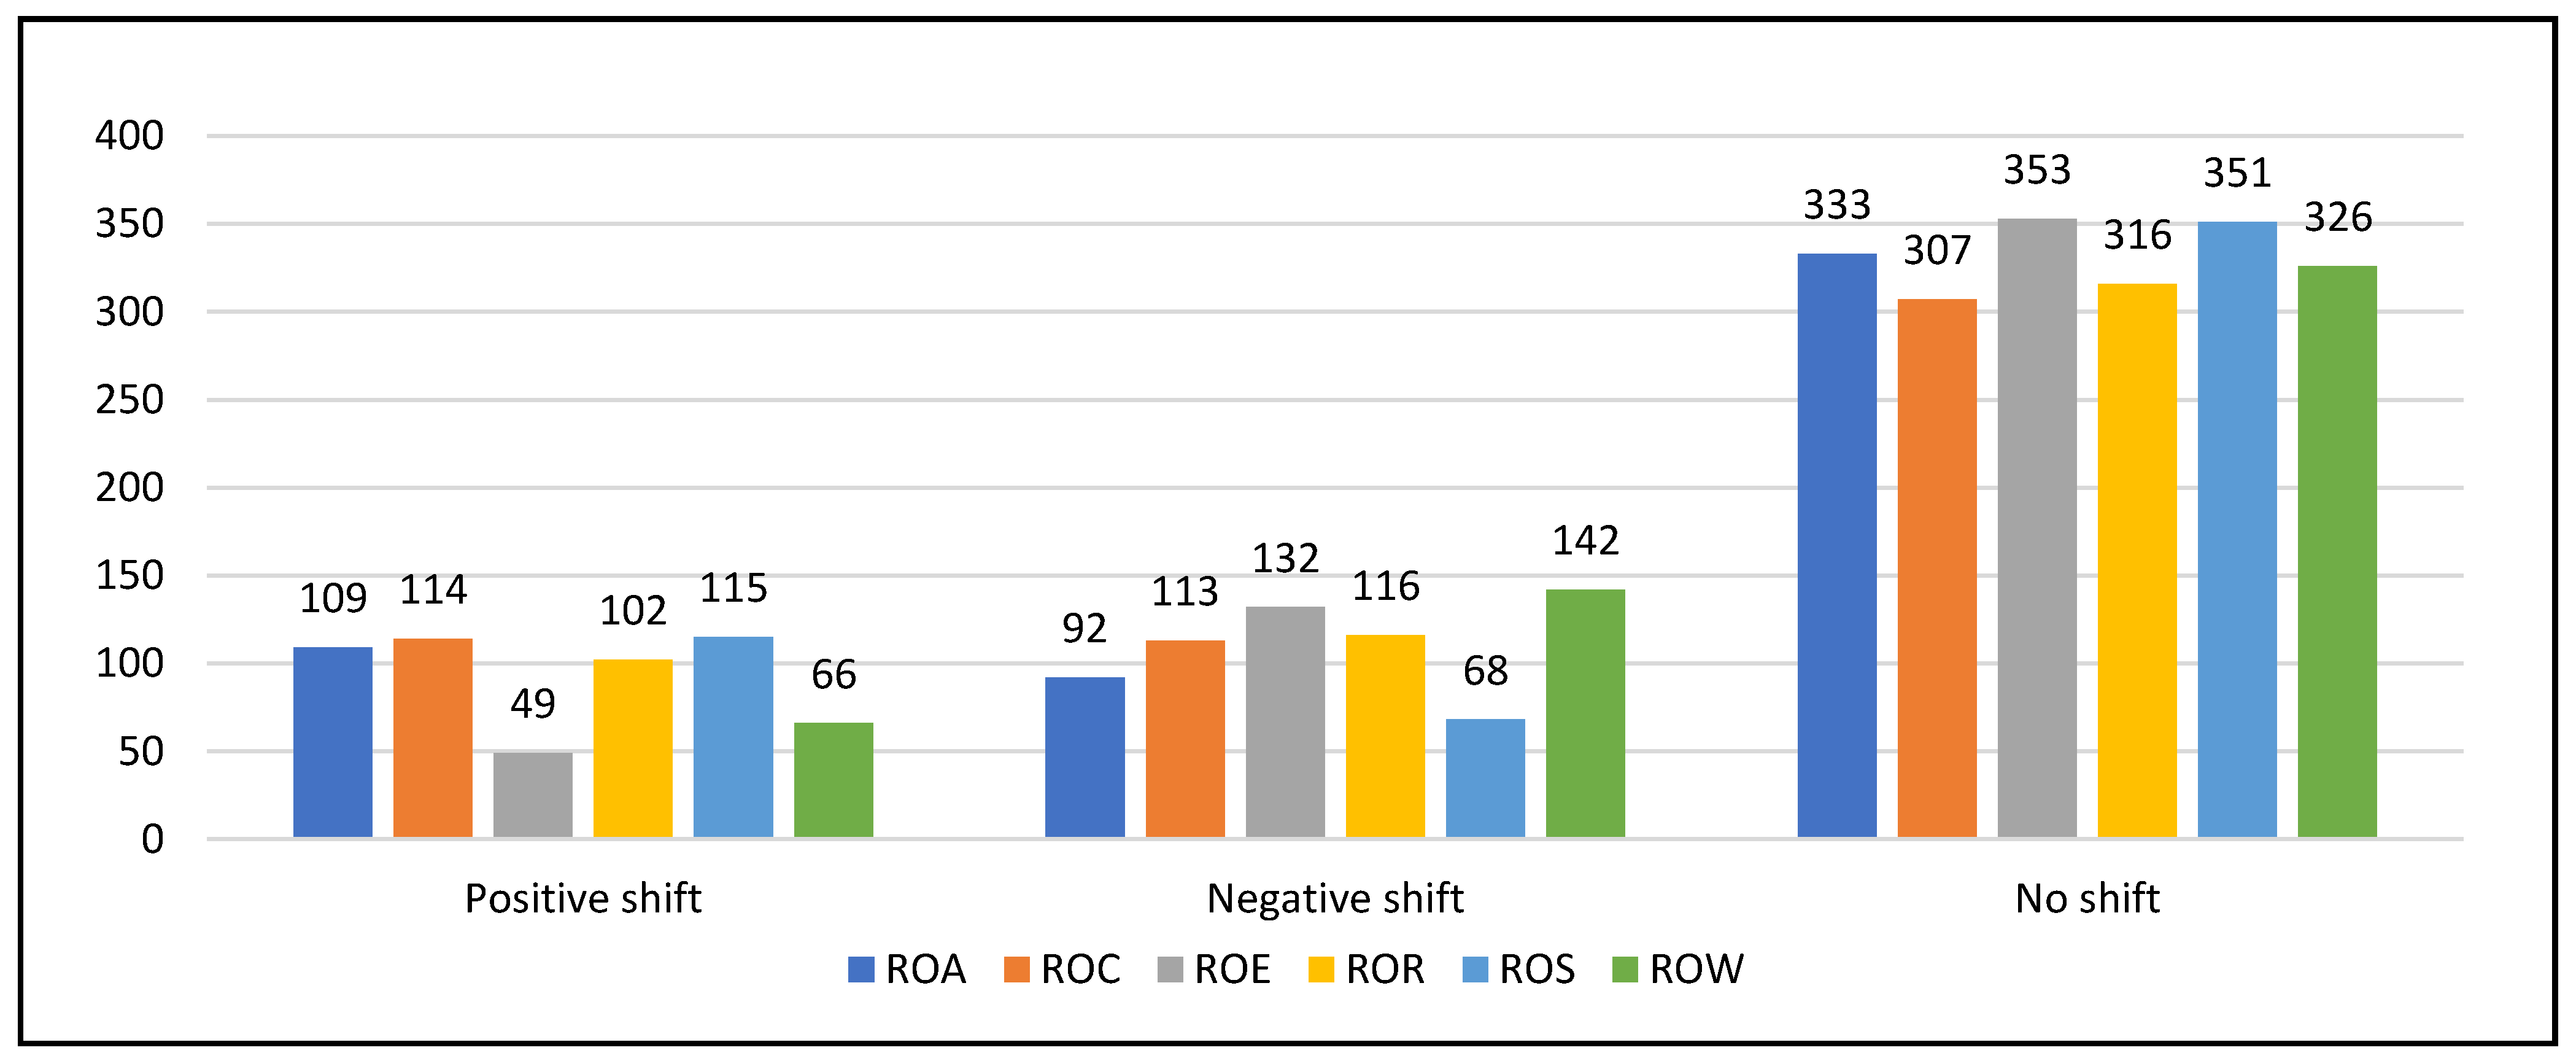
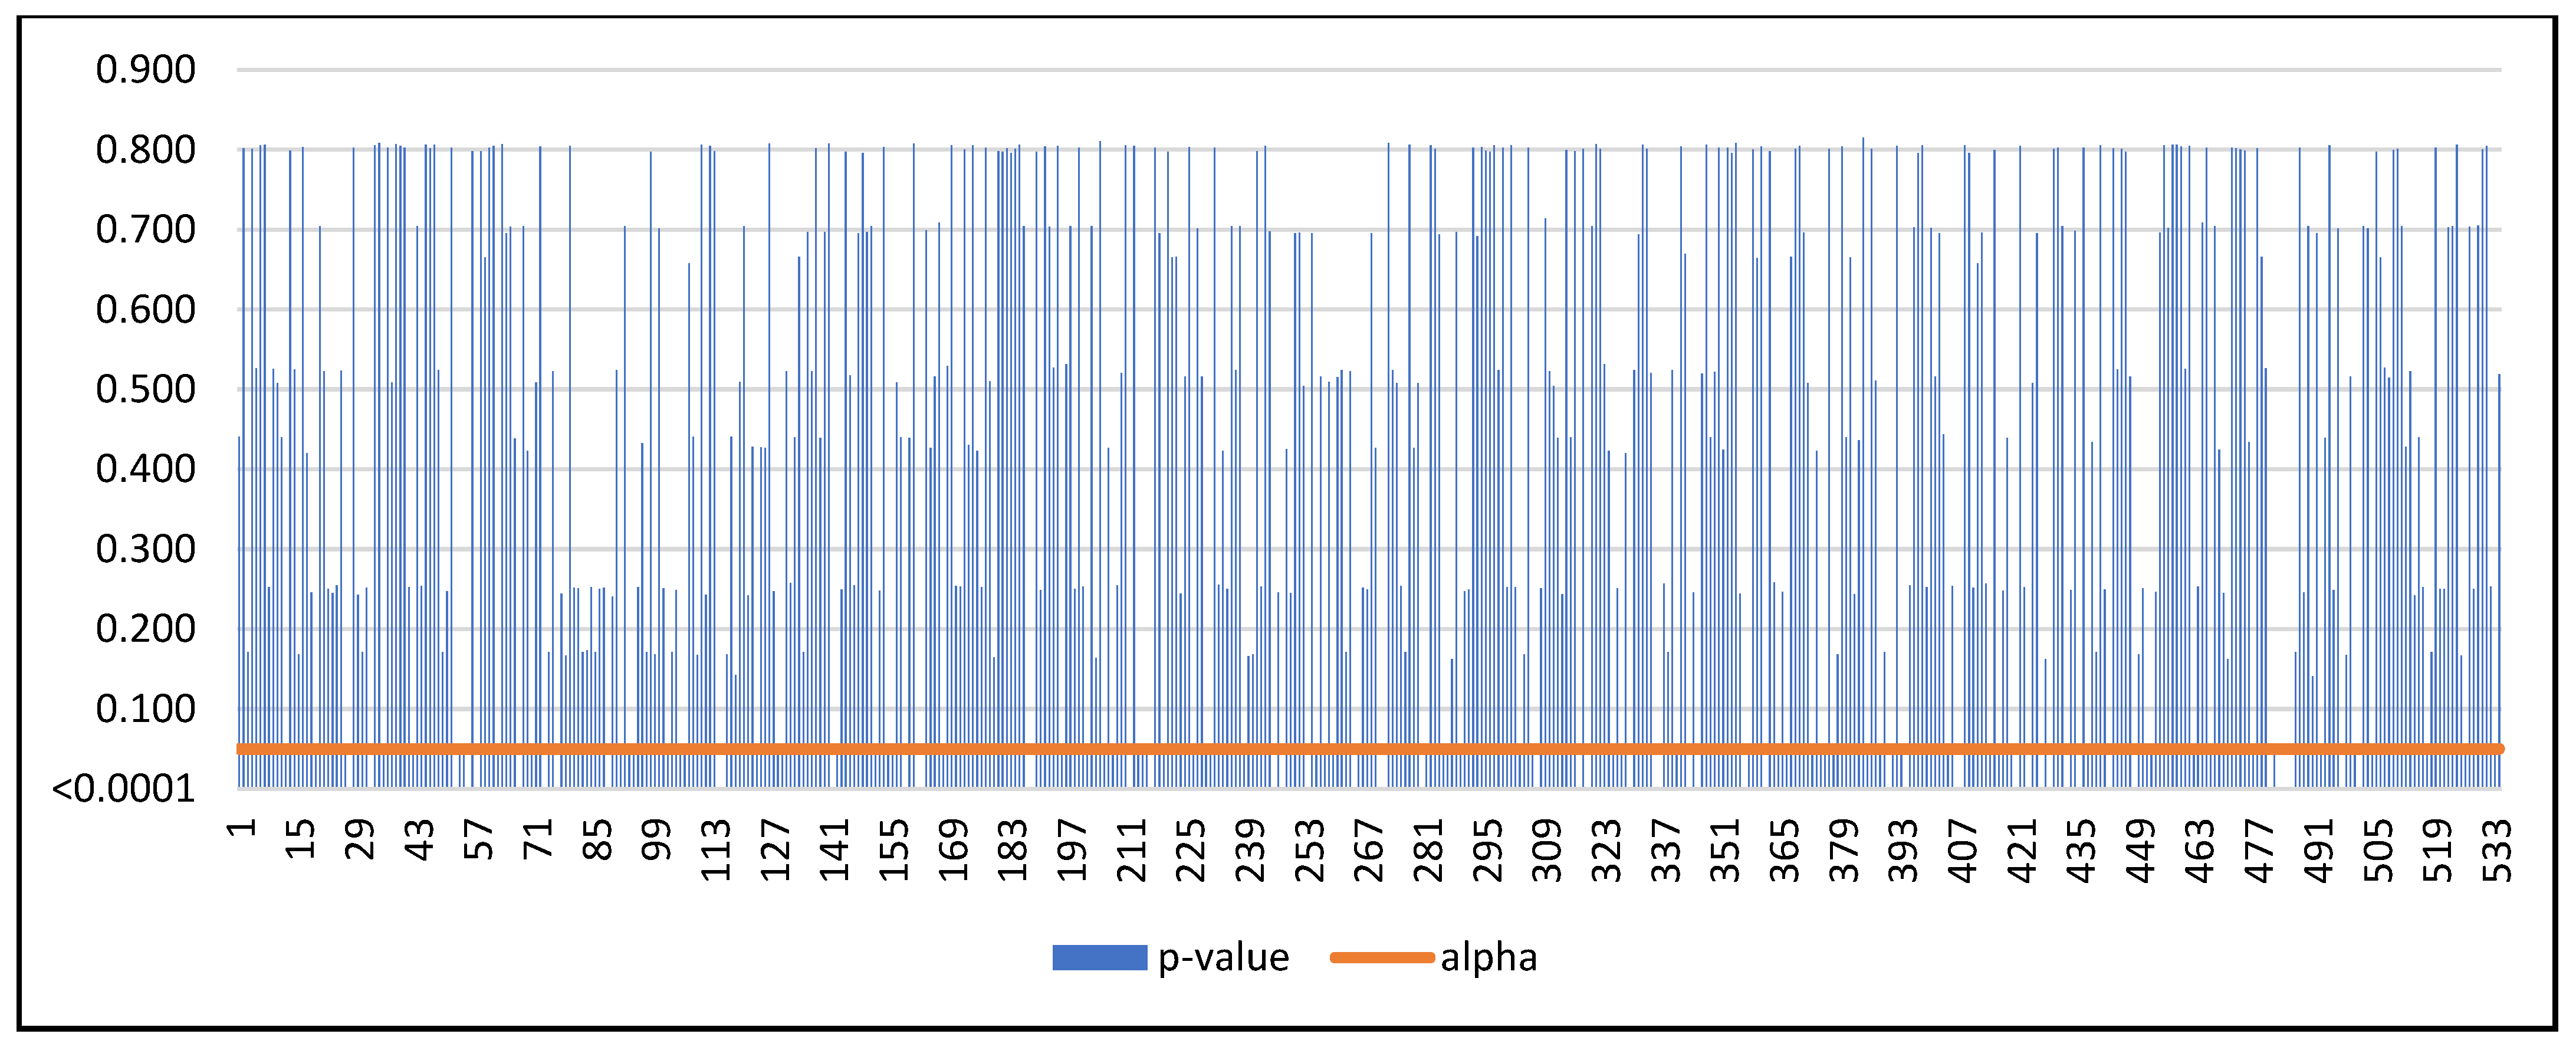
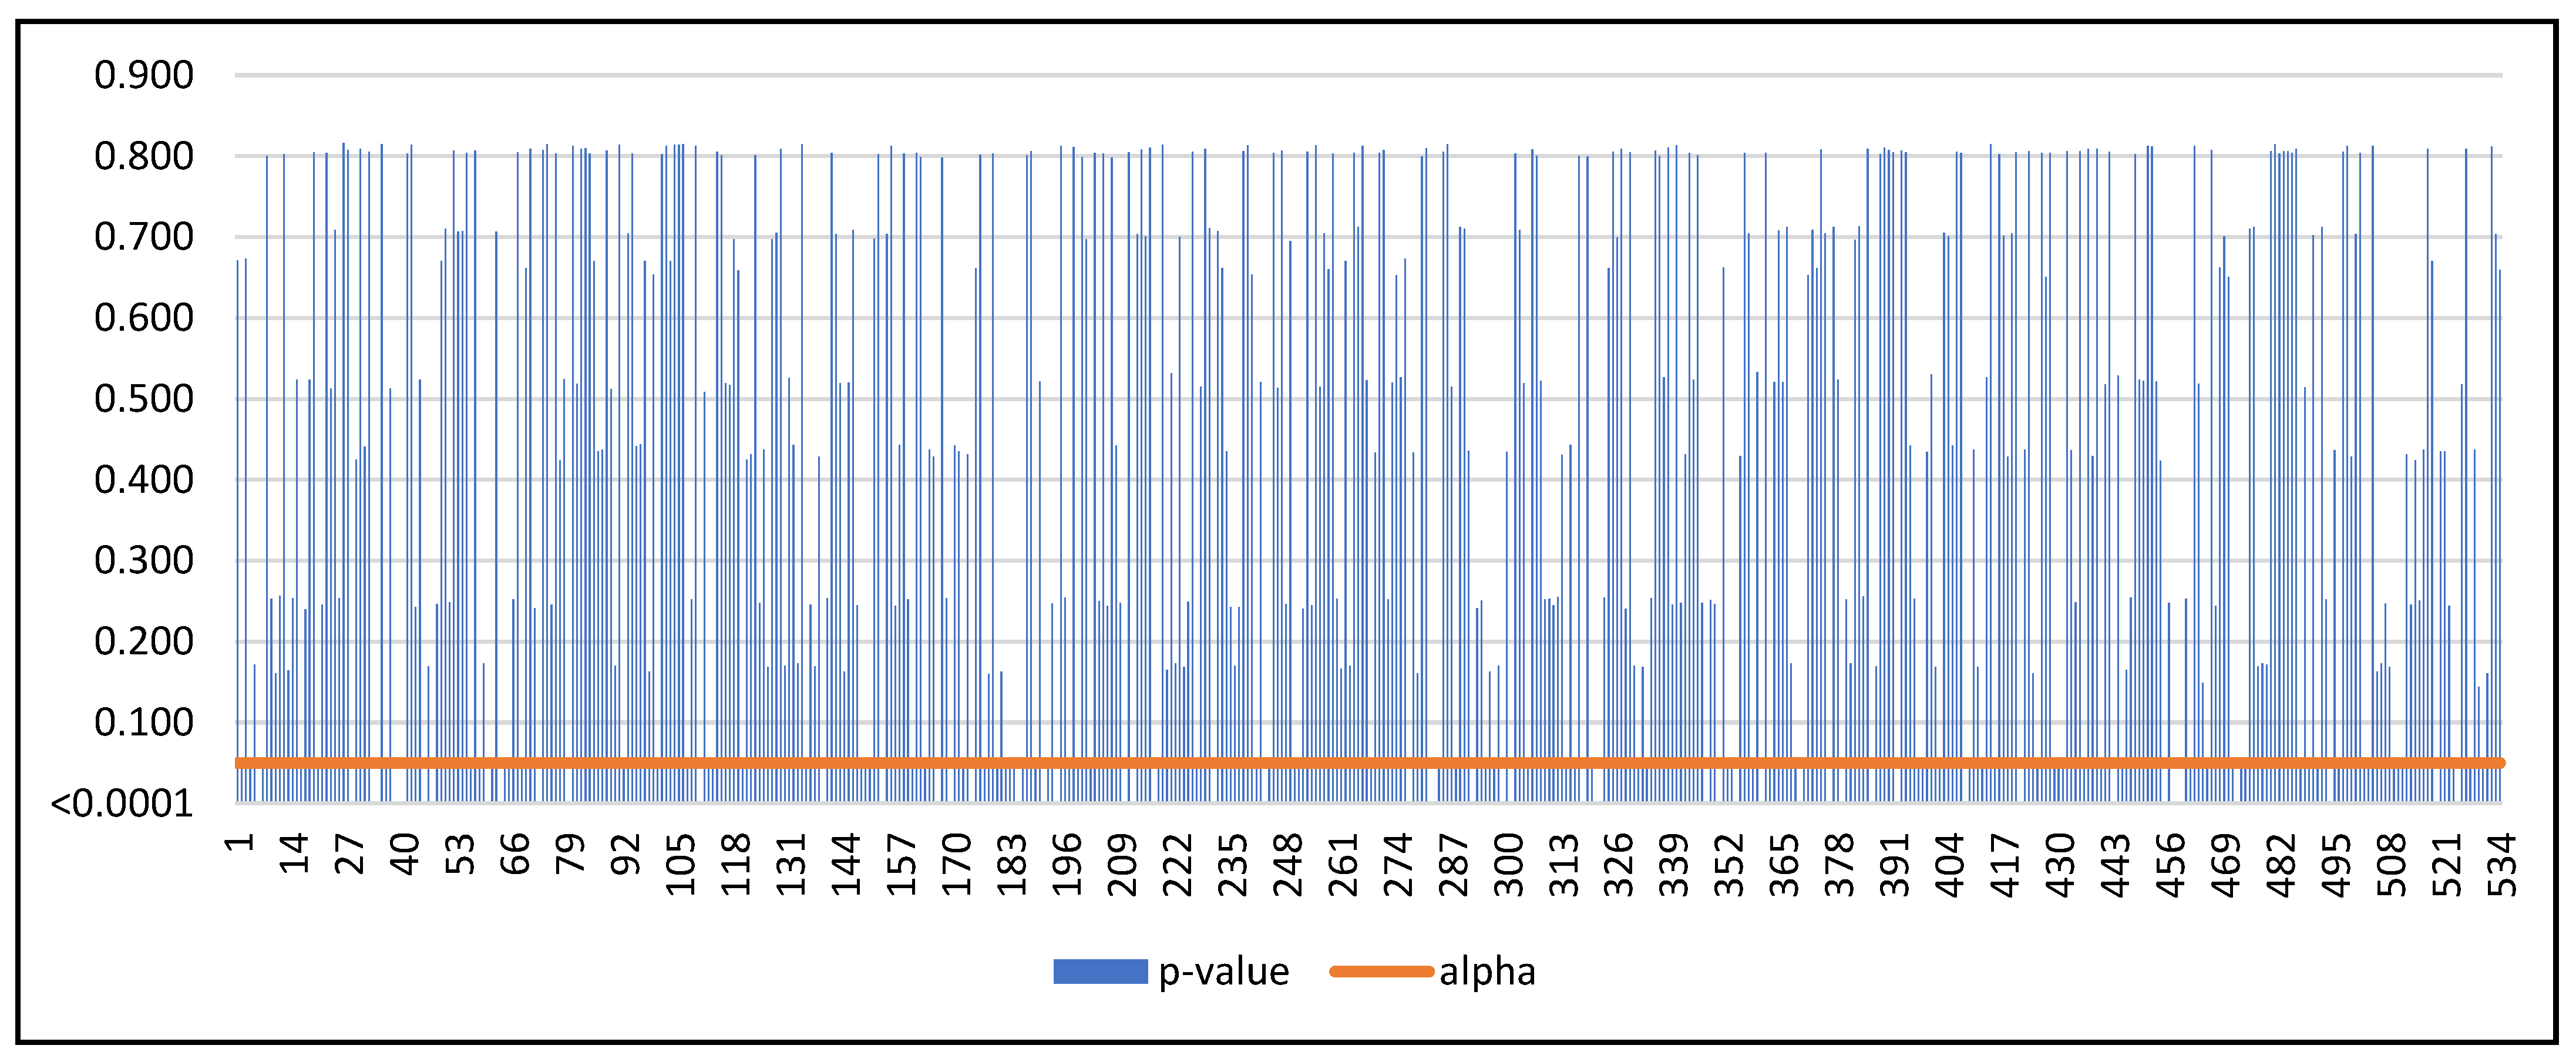
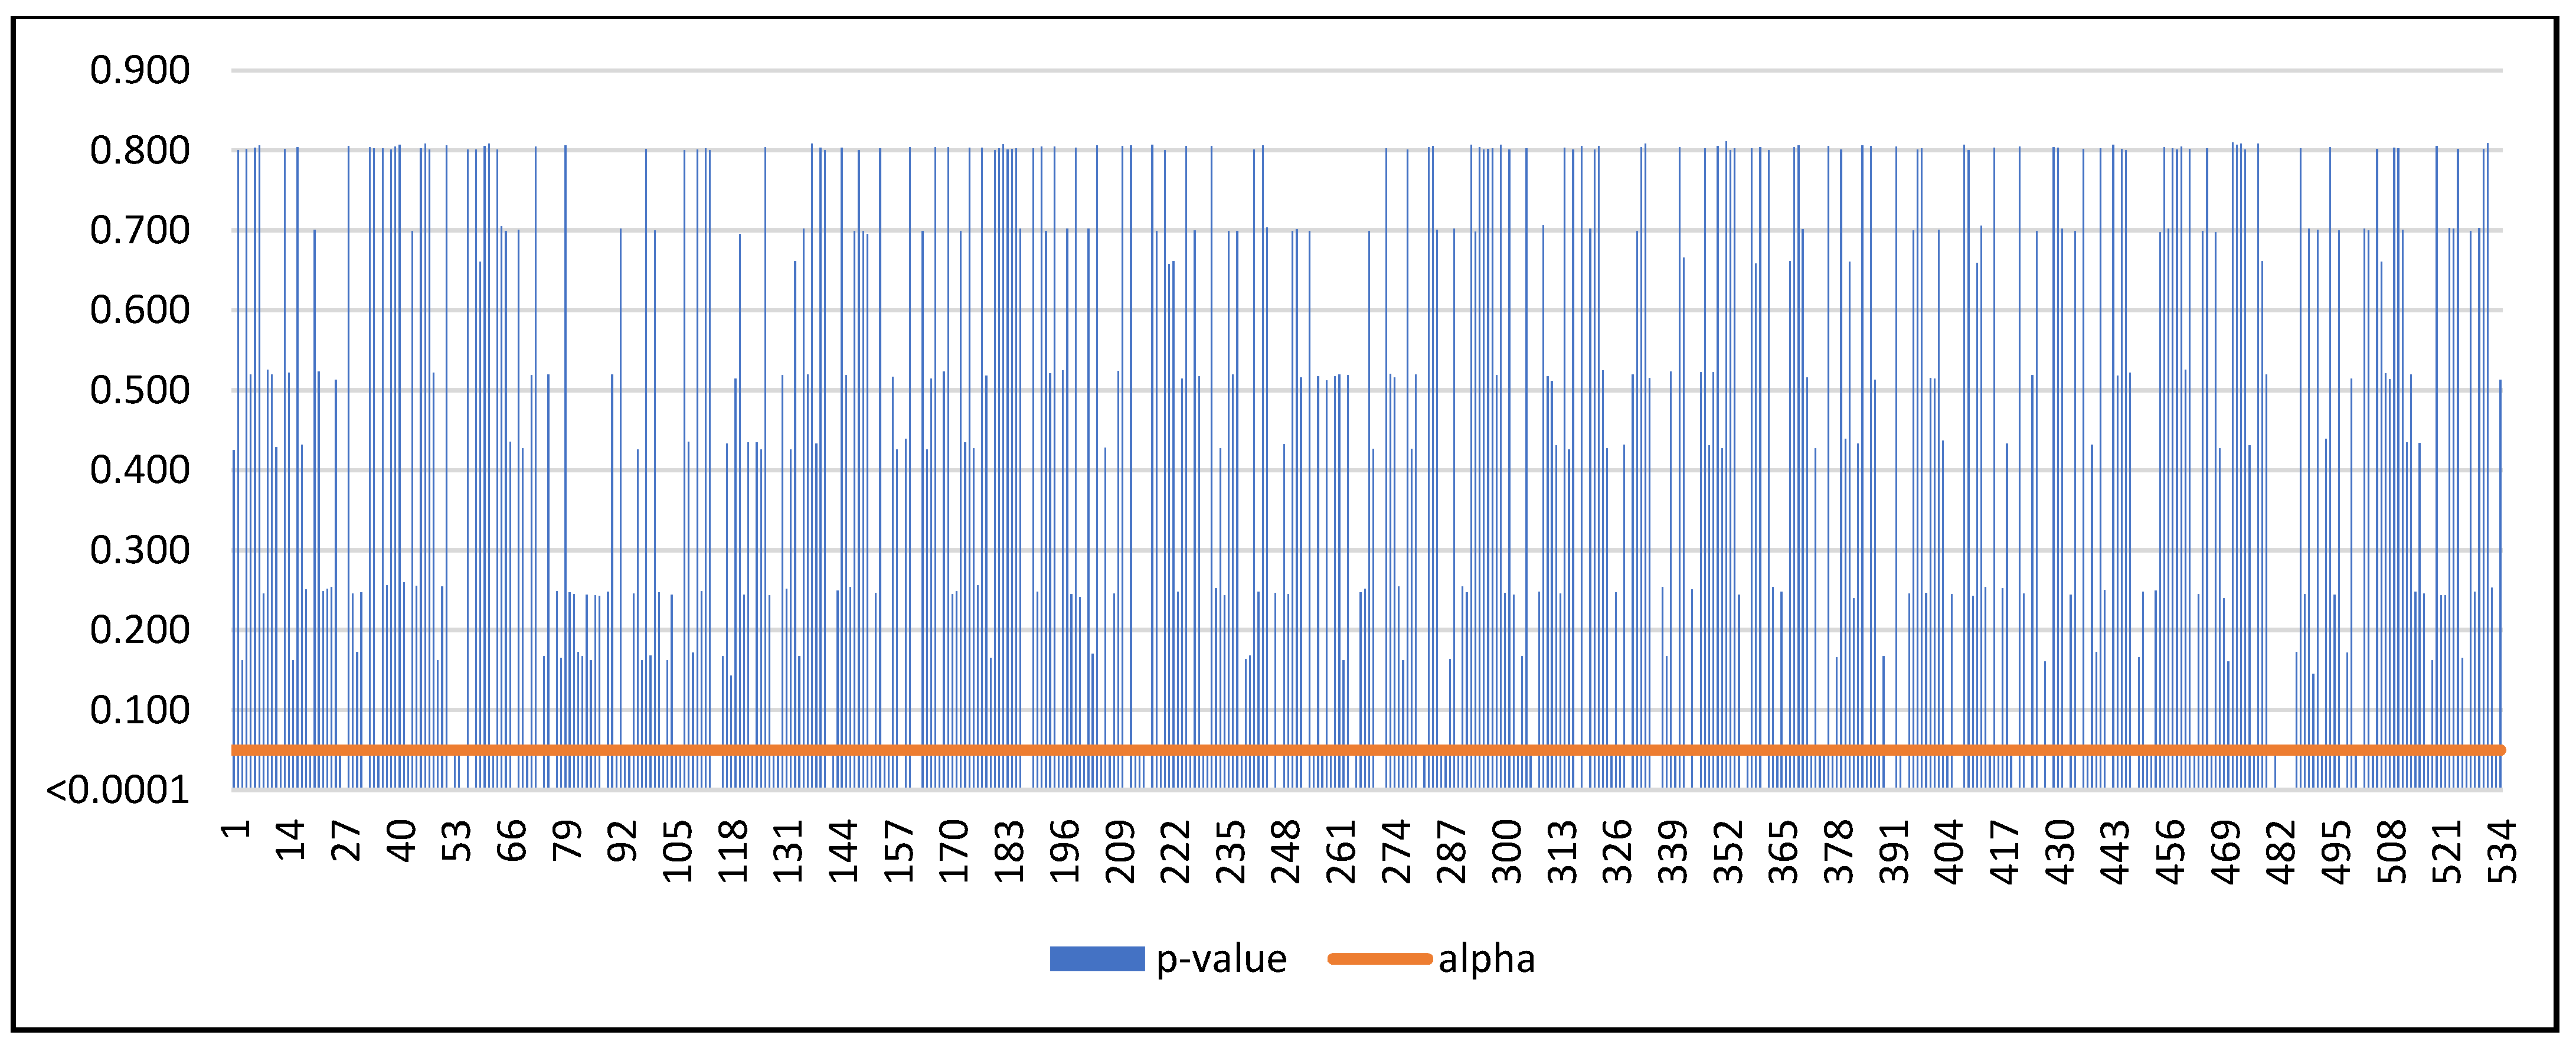
Secondly, Pettit’s test was run to identify shifts in all profitability ratios from 2016–2021.
Figure 3 sums up the number of enterprises with specific categories of shifts for the sample of transport enterprises. The computed
-values of the individual tests are demonstrated in the next sections of this chapter.
It was tested for upper and lower alternative hypotheses with 100,000 Monte Carlo simulations, and the following hypotheses were formulated for ROA for each enterprise in the V4 region:
H0. The development of ROA was homogeneous during 2016–2021.
H1a. There is a date at which there is a positive (or negative) shift in the ROA.
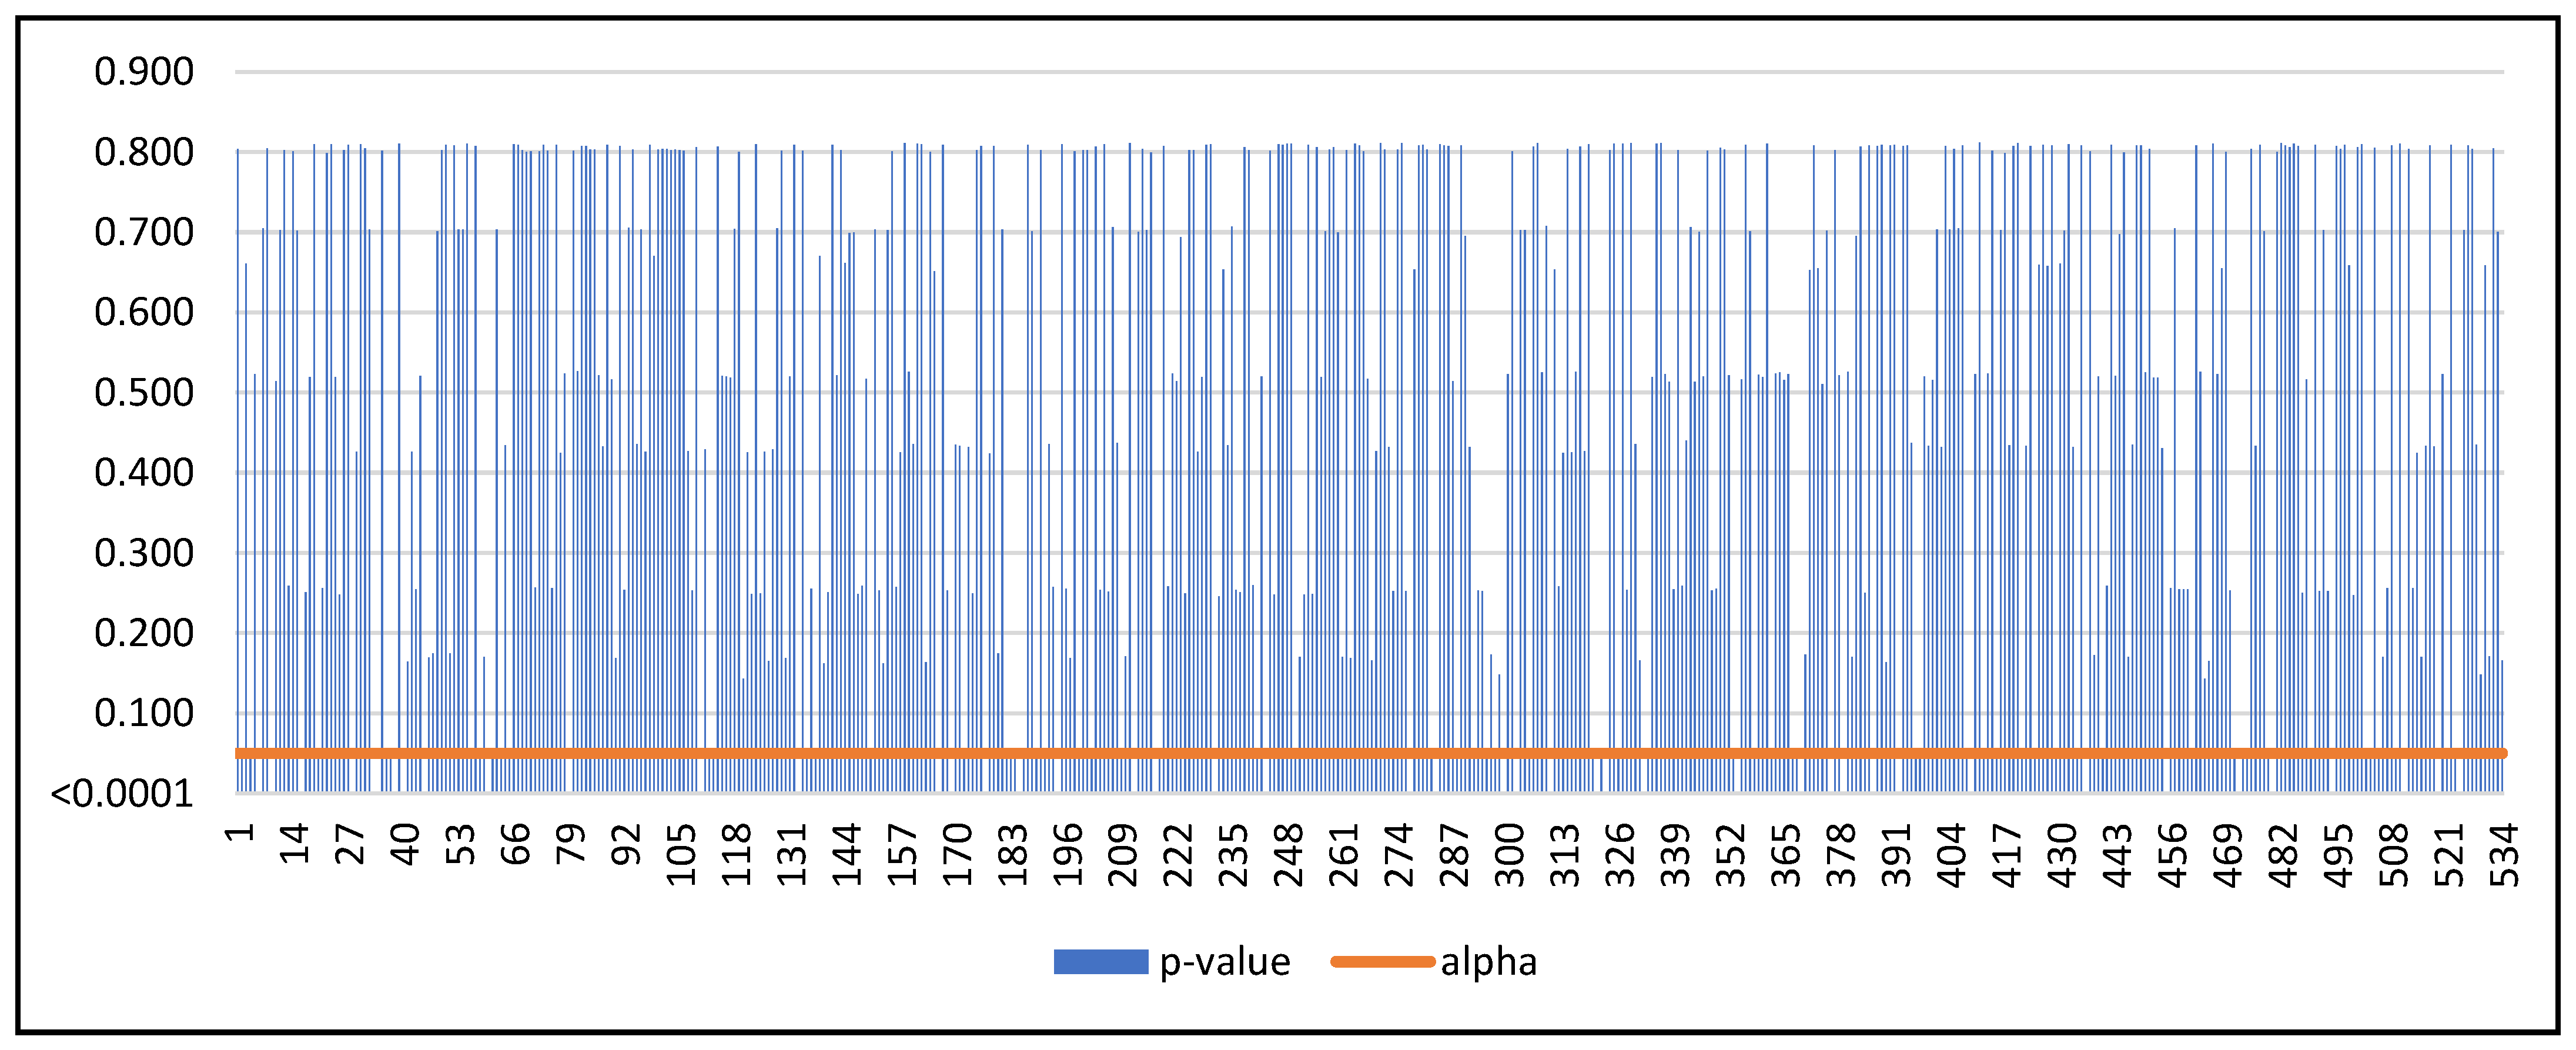
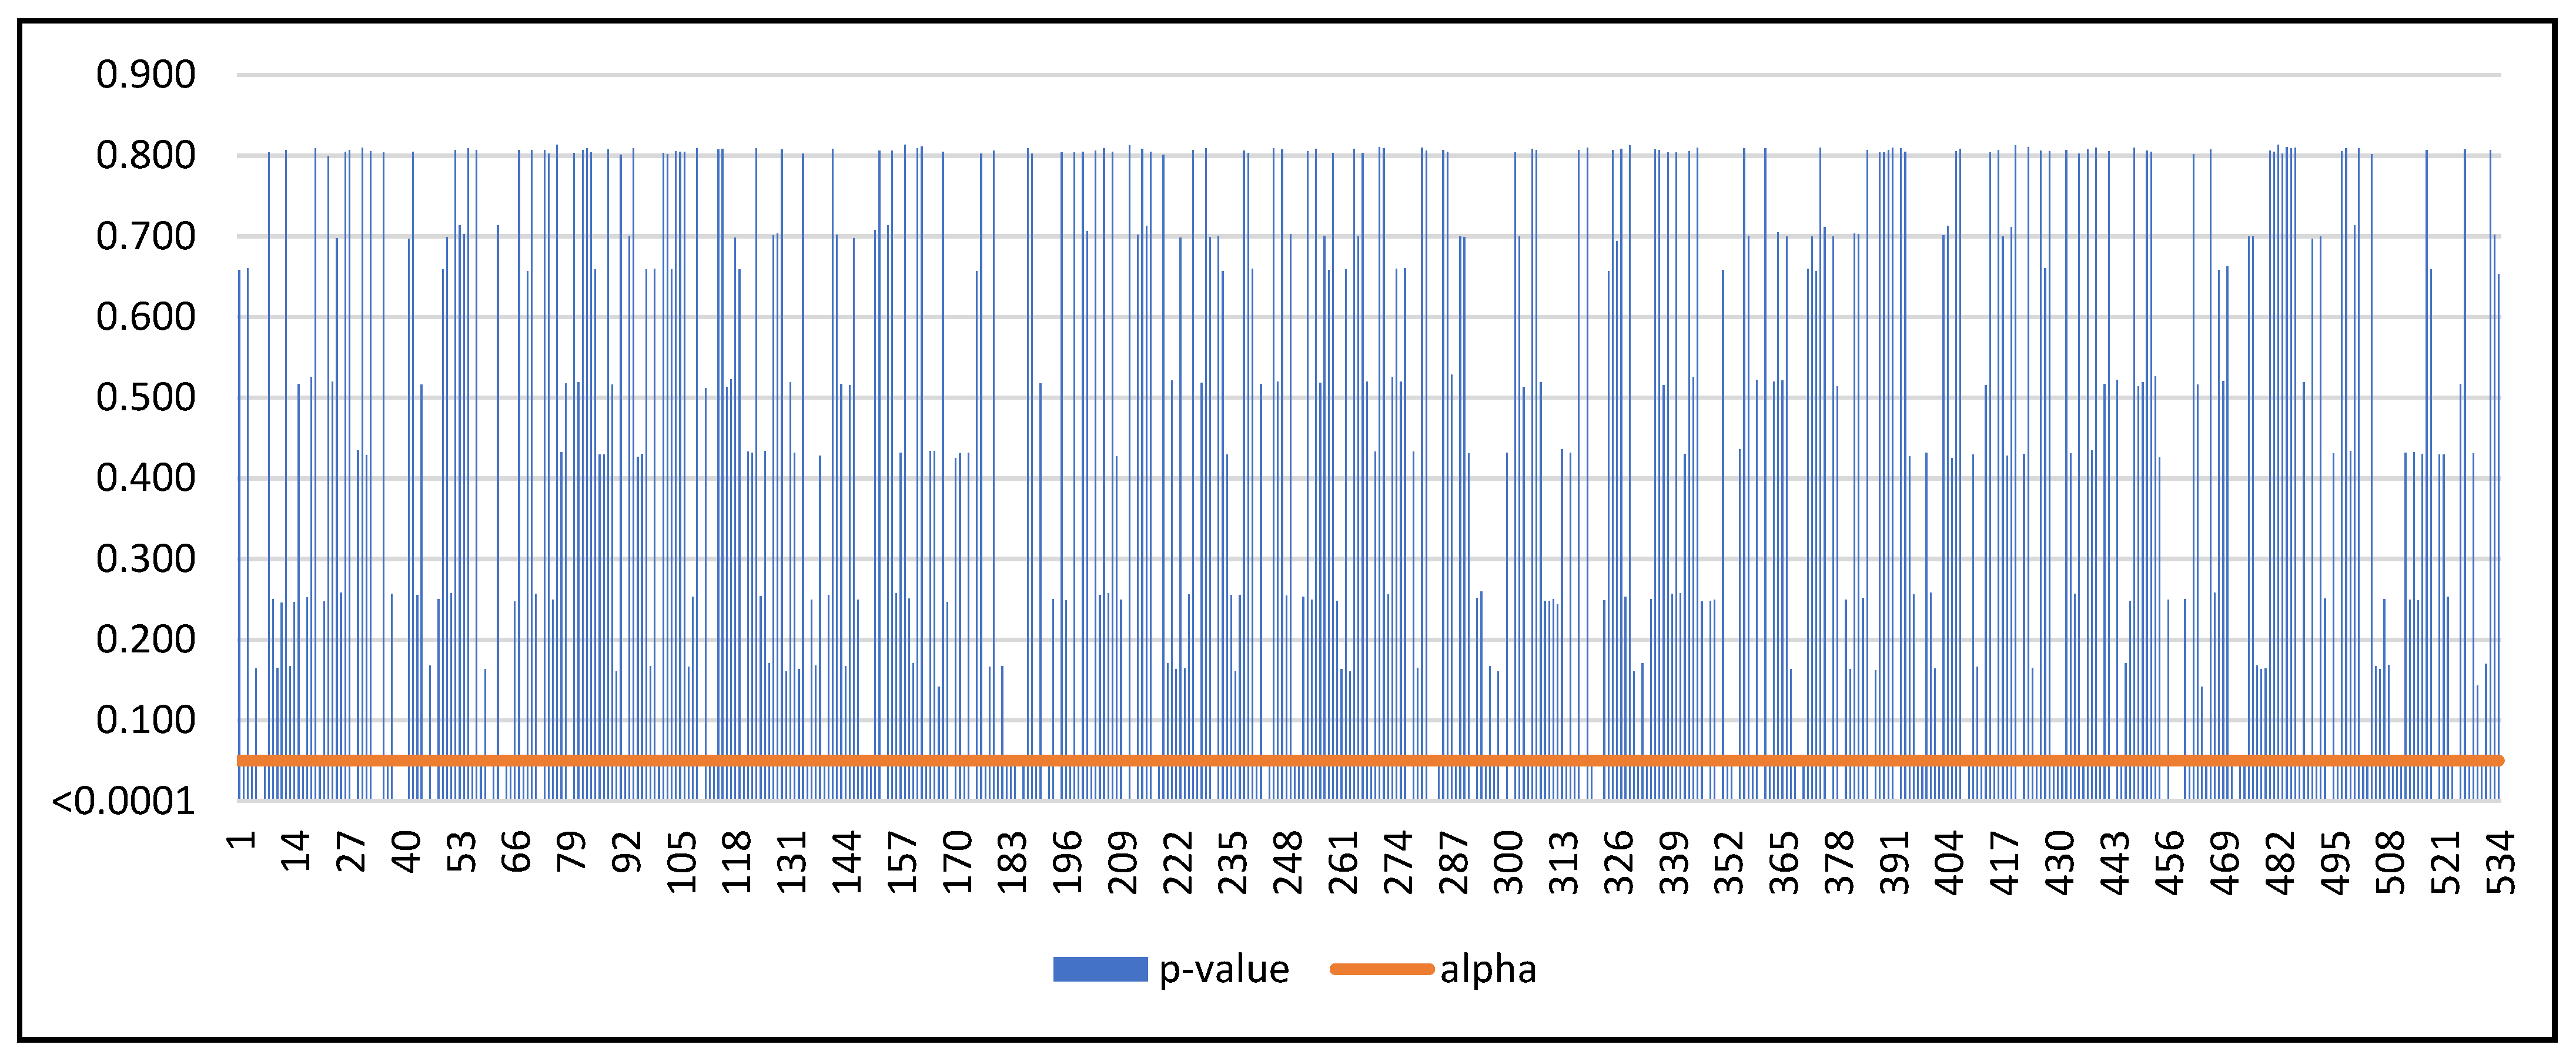
If the computed
-value is lower than the significance level alpha, one should reject the null hypothesis and accept the alternative hypothesis based on
Figure 4 and
Figure 5. One hundred and nine (109) transport enterprises with positive shifts in ROA were detected. Ninety-two (92) transport enterprises with a negative shift in ROA were identified. If the computed
-value was greater than the significance level alpha, we could not reject the null hypothesis based on
Figure 4 and
Figure 5. Three hundred thirty-three (333) transport enterprises were classified with no shift in ROA if there was no positive or negative shift disclosed.
Then a crosstabulation based on shifts in ROA and the approach of the enterprises from the transport sector to Industry 4.0 was made (
Table 6).
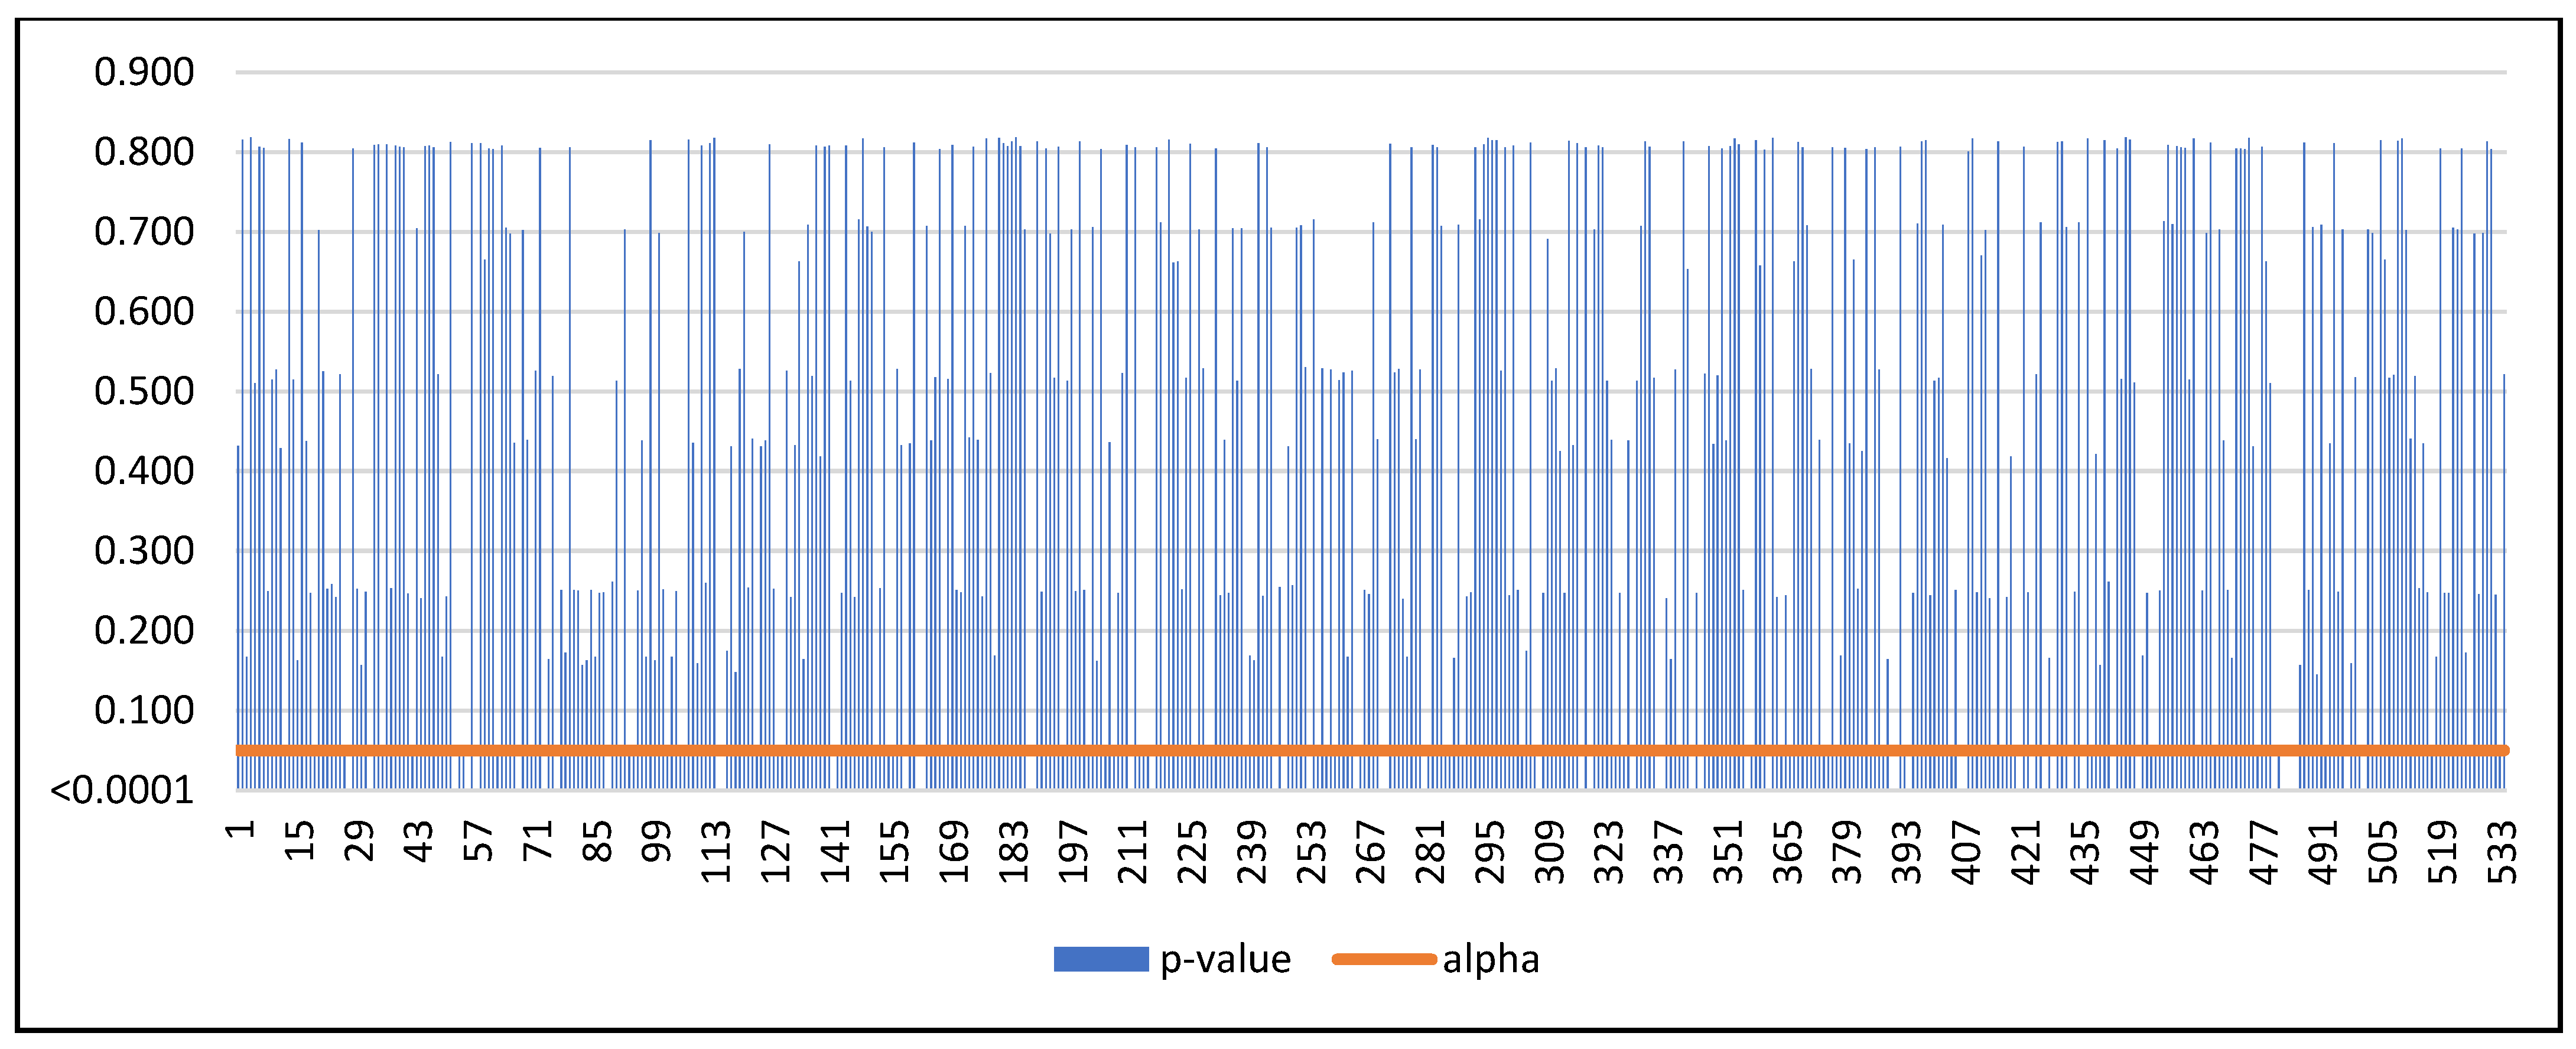
It was tested for upper and lower alternative hypotheses with 100,000 Monte Carlo simulations, and the following hypotheses were formulated for ROC for each enterprise in the V4 region:
H0. The development of ROC was homogeneous during 2016–2021.
H1b. There is a date at which there is a positive (or negative) shift in the ROC.
Suppose the computed
-value is lower than the significance level alpha. In that case, one should reject the null hypothesis and accept the alternative hypothesis based on
Figure 6 and
Figure 7. 114 transport enterprises with positive shifts in ROC were detected. One hundred and thirteen (113) transport enterprises with a negative shift in ROC were identified. If the computed
-value was greater than the significance level alpha, we could not reject the null hypothesis based on
Figure 6 and
Figure 7. 307 transport enterprises were classified with no shift in ROC if there was no positive or negative shift disclosed.
Then a crosstabulation based on shifts in ROC and the approach of the enterprises from the transport sector to Industry 4.0 was made (
Table 7).
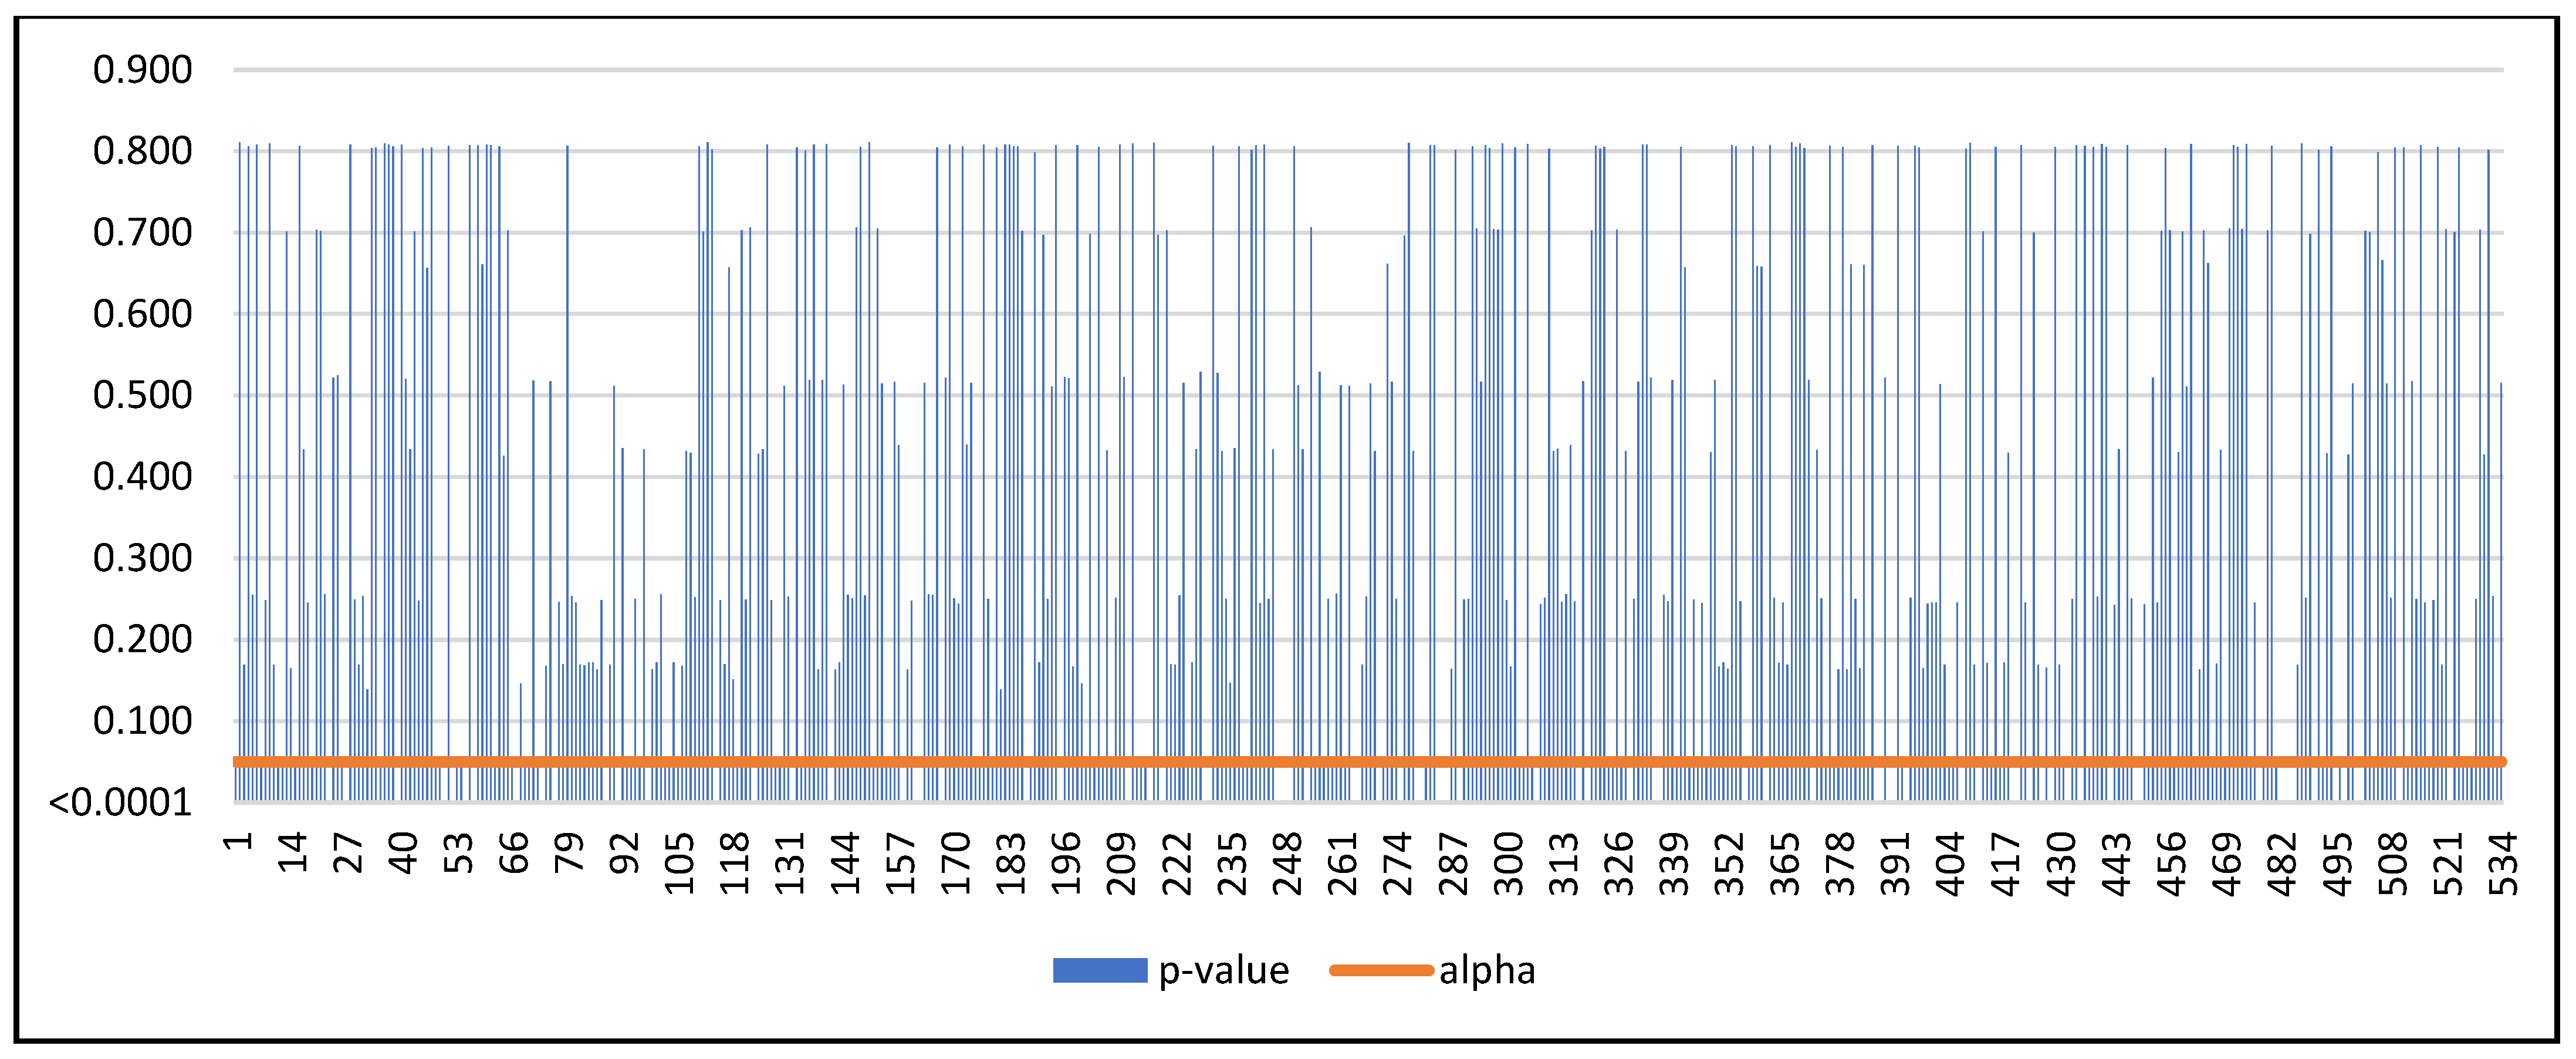
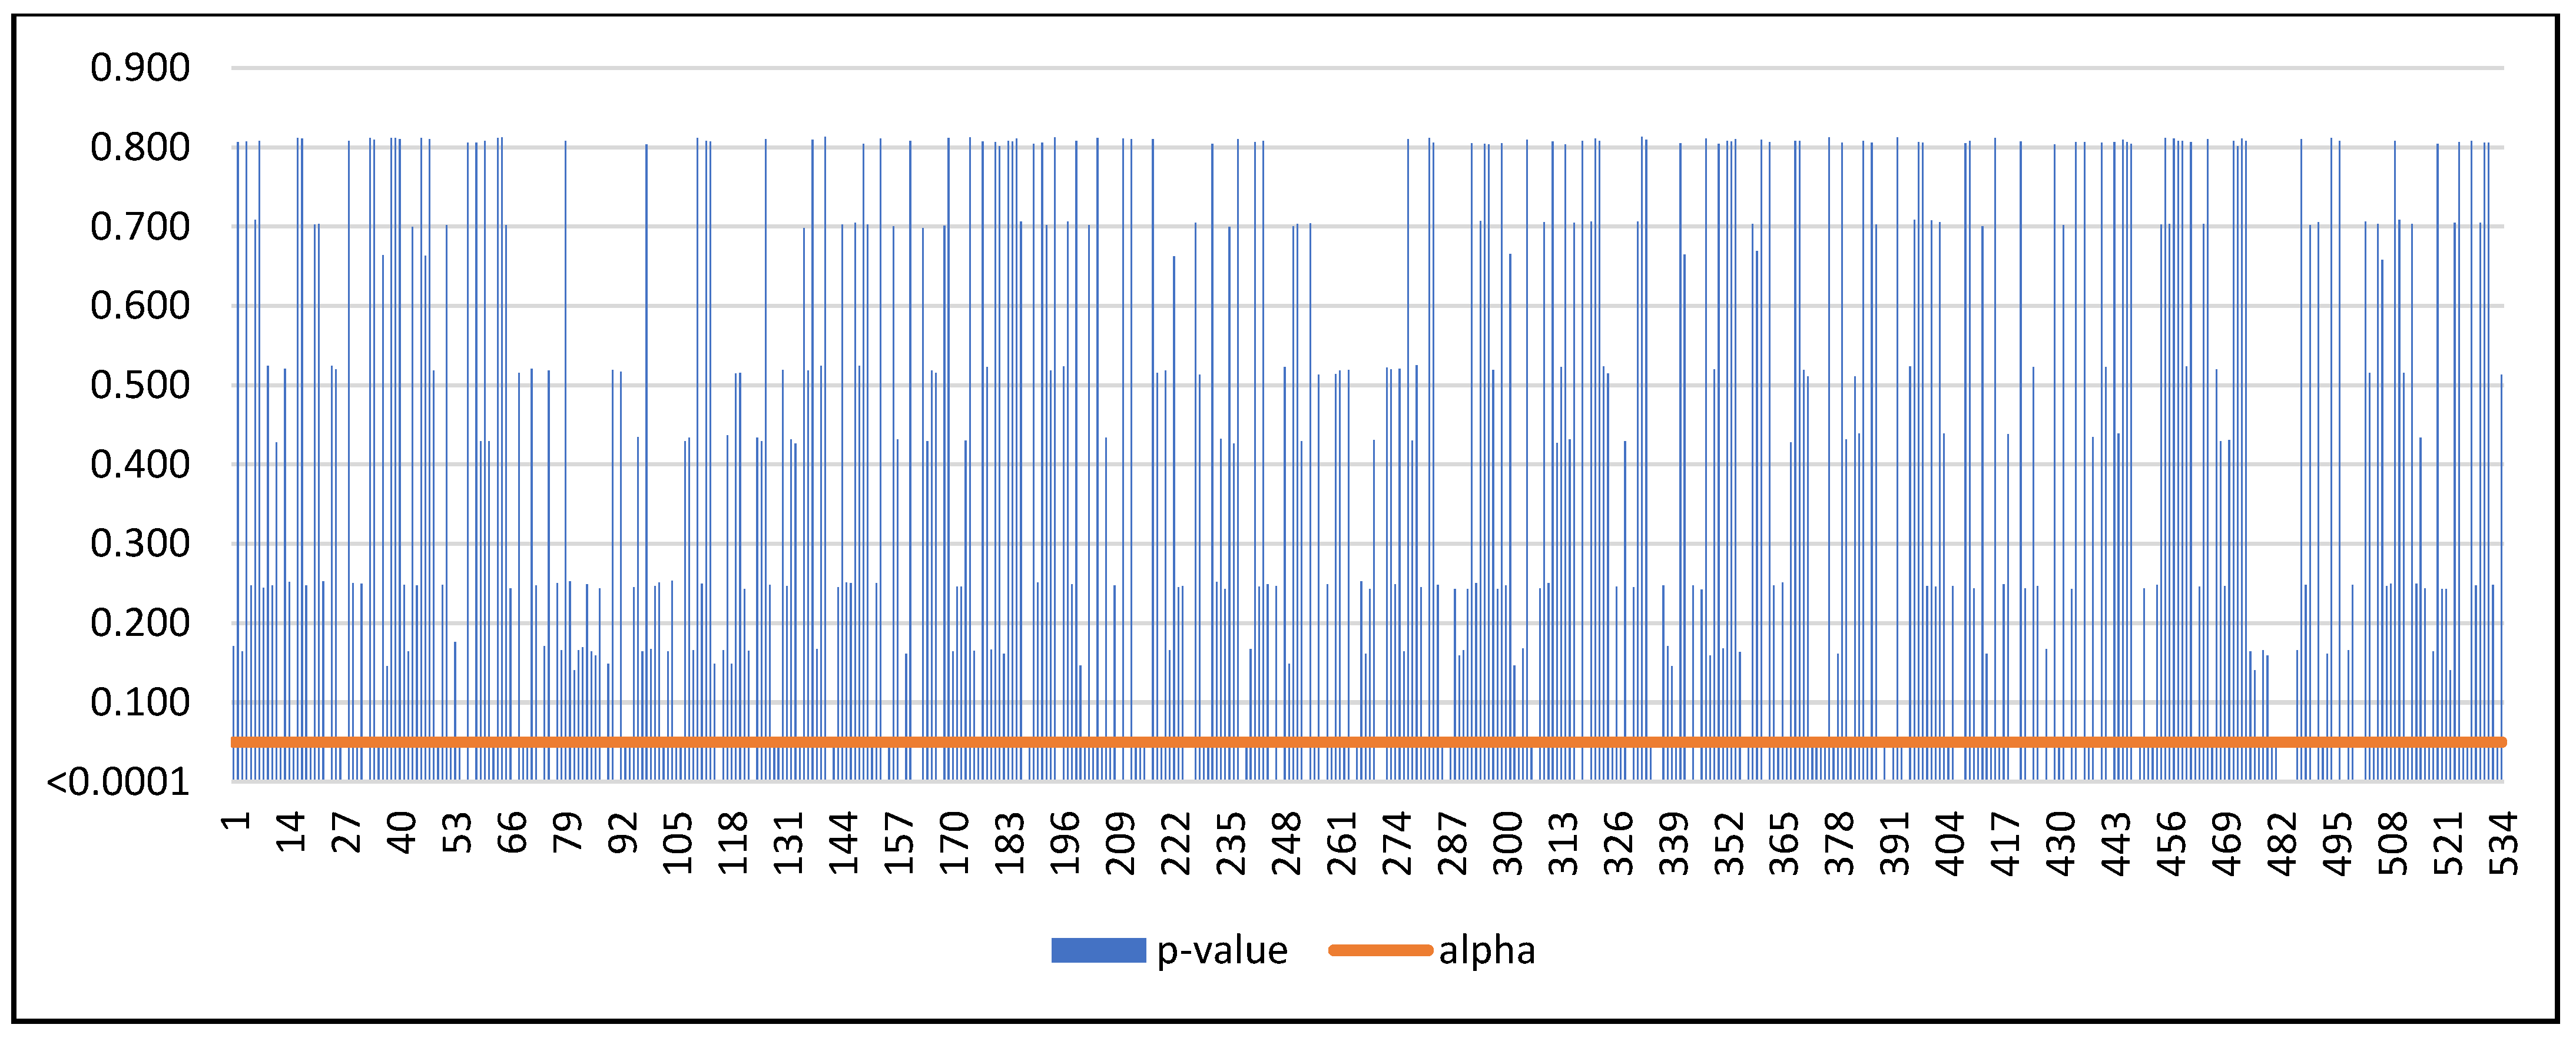
It was tested for upper and lower alternative hypotheses with 100,000 Monte Carlo simulations, and the following hypotheses were formulated for ROE for each enterprise in the V4 region:
H0. The development of ROE was homogeneous during 2016–2021.
H1c. There is a date at which there is a positive (or negative) shift in the ROE.
Suppose the computed
-value is lower than the significance level alpha. In that case, one should reject the null hypothesis and accept the alternative hypothesis based on
Figure 8 and
Figure 9. 49 transport enterprises with positive shifts in ROE were detected. One hundred and thirty-two (132) transport enterprises with a negative shift in ROE were identified. If the computed
-value was greater than the significance level alpha, we could not reject the null hypothesis based on
Figure 8 and
Figure 9. 353 transport enterprises were classified with no shift in ROE if there was no positive or negative shift disclosed.
Then a crosstabulation based on shifts in ROE and the approach of the enterprises from the transport sector to Industry 4.0 was made (
Table 8).
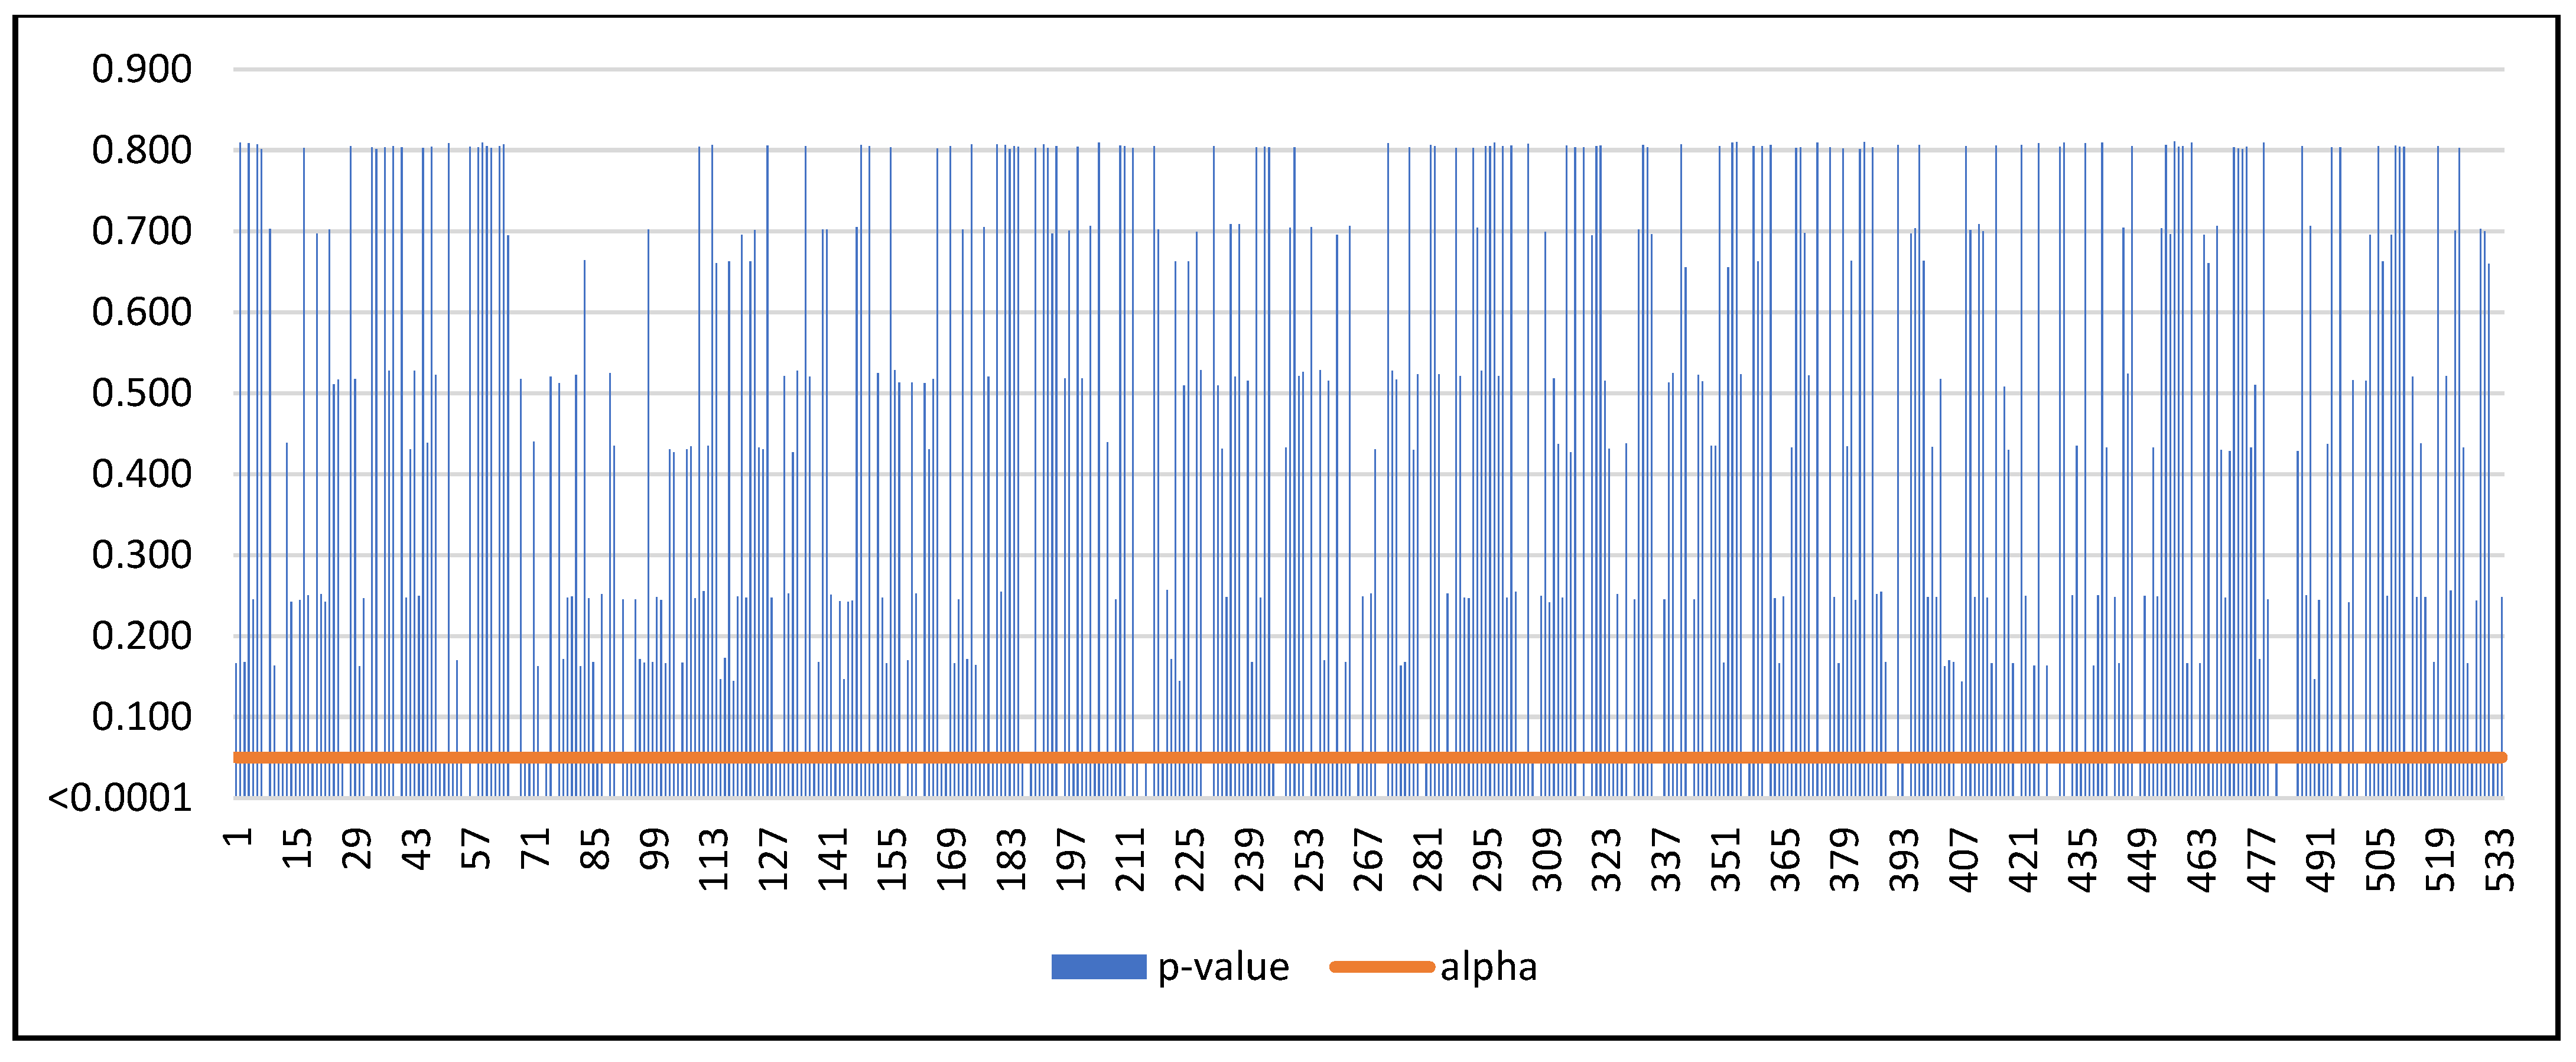
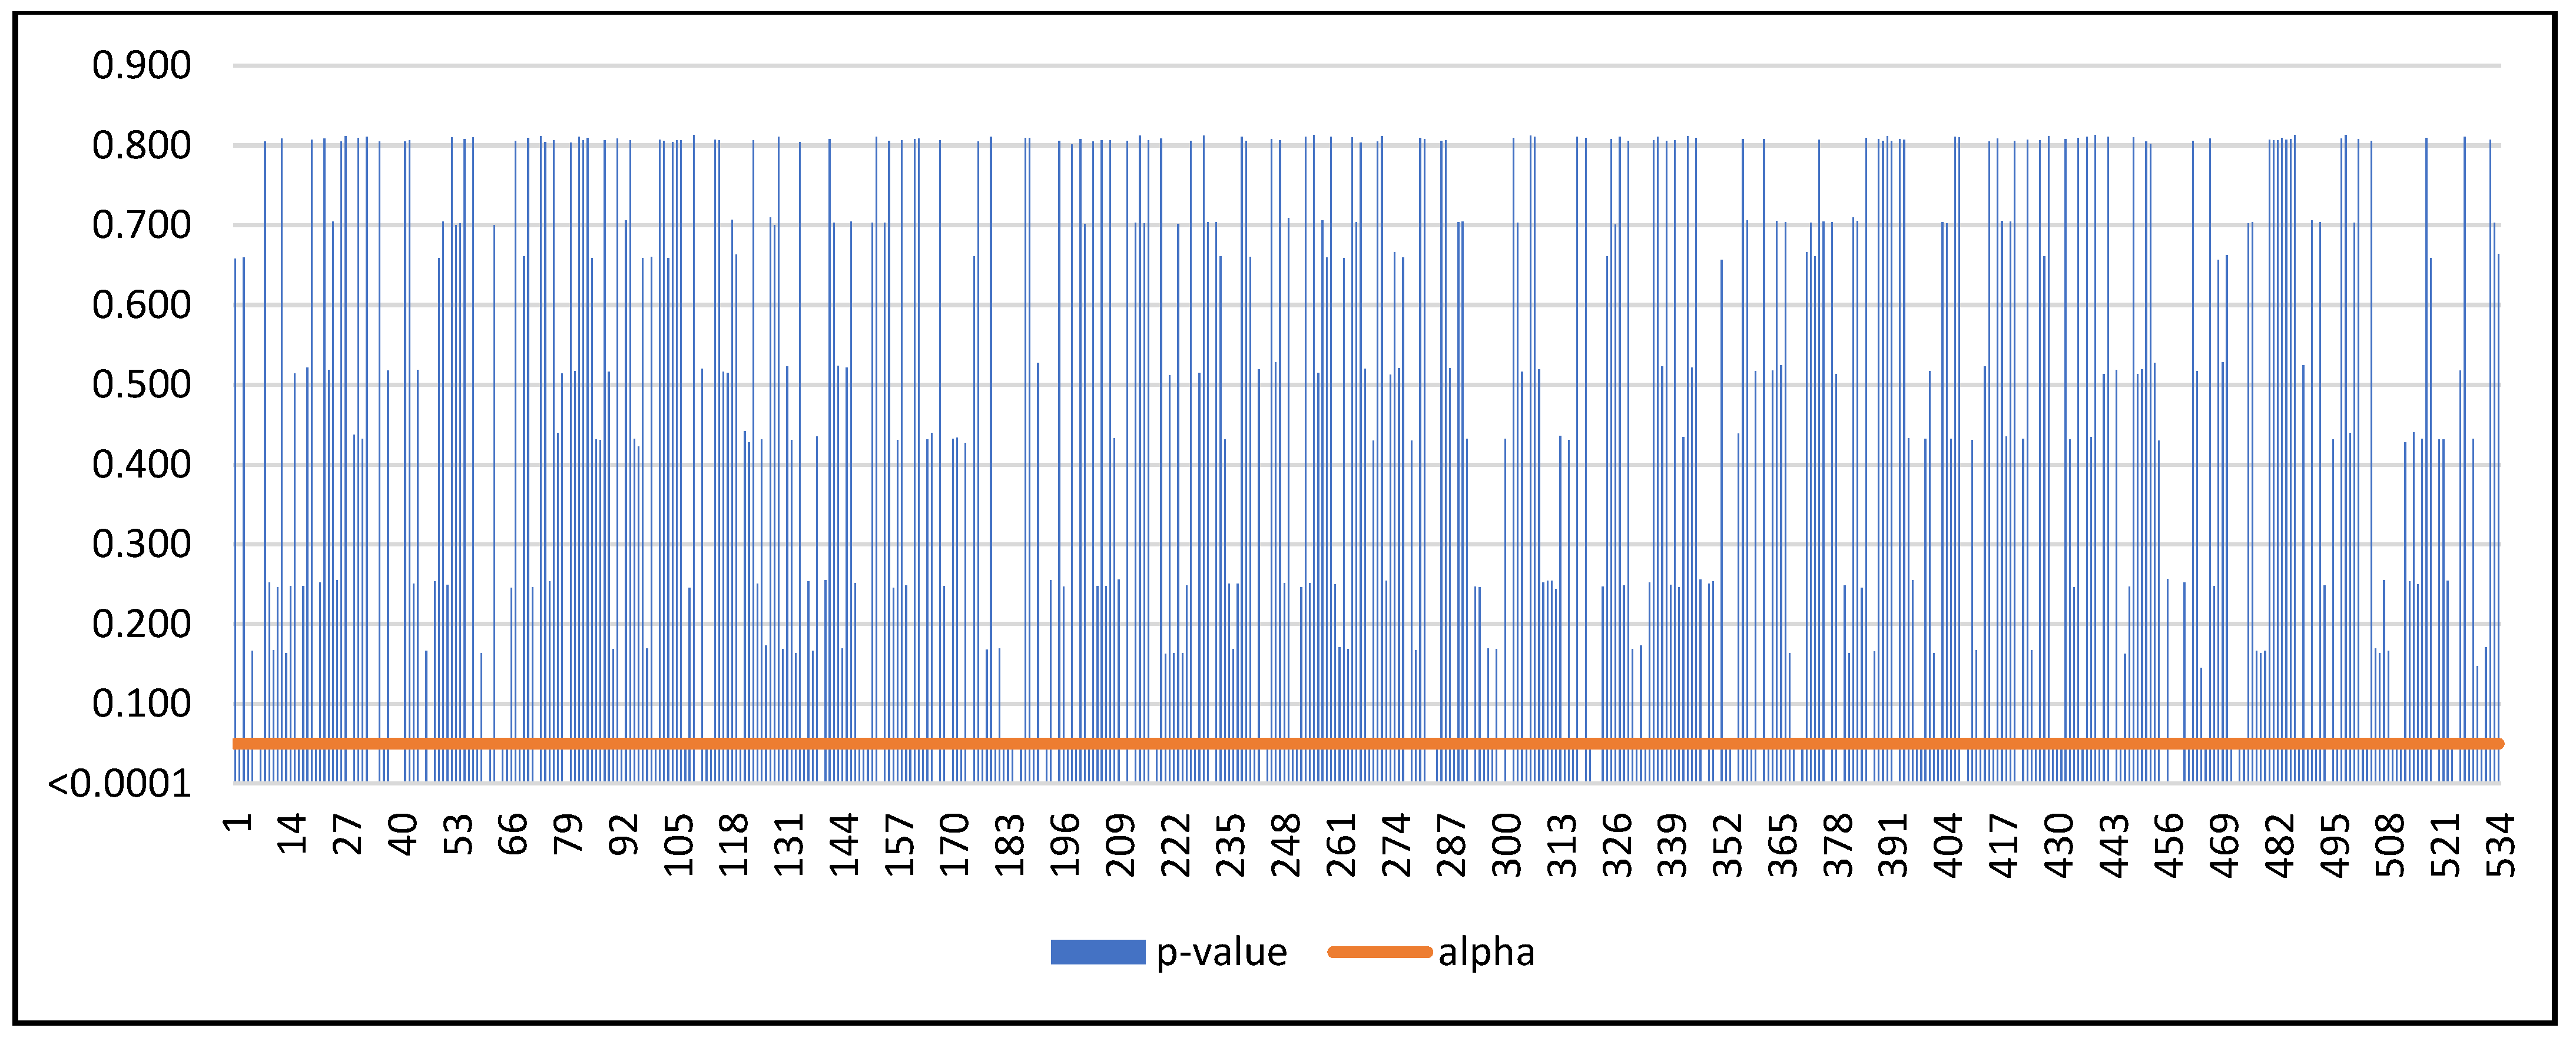
It was tested for upper and lower alternative hypotheses with 100,000 Monte Carlo simulations, and the following hypotheses were formulated for ROR for each enterprise in the V4 region:
H0. The development of ROR was homogeneous during 2016–2021.
H1d. There is a date at which there is a positive (or negative) shift in the ROR.
If the computed
-value is lower than the significance level alpha, one should reject the null hypothesis and accept the alternative hypothesis based on
Figure 10 and
Figure 11. One hundred and two (102) transport enterprises with positive shifts in ROR were detected. One hundred and sixteen (116) transport enterprises with a negative shift in ROR were identified. If the computed
-value was greater than the significance level alpha, we could not reject the null hypothesis based on
Figure 10 and
Figure 11. Three hundred and sixteen (316) transport enterprises were classified with no shift in ROR if there was no positive or negative shift disclosed.
Then a crosstabulation based on shifts in ROR and the approach of the enterprises from the transport sector to Industry 4.0 was made (
Table 9).
It was tested for upper and lower alternative hypotheses with 100,000 Monte Carlo simulations, and the following hypotheses were formulated for ROS for each enterprise in the V4 region:
H0. The development of ROS was homogeneous during 2016–2021.
H1e. There is a date at which there is a positive (or negative) shift in the ROS.
If the computed
-value is lower than the significance level alpha, one should reject the null hypothesis and accept the alternative hypothesis based on
Figure 12 and
Figure 13. One hundred fifteen (115) transport enterprises with positive shifts in ROS were detected. Sixty-eight (68) transport enterprises with a negative shift in ROS were identified. If the computed
-value was greater than the significance level alpha, we could not reject the null hypothesis based on
Figure 12 and
Figure 13. Three hundred and fifty-one (351) transport enterprises were classified with no shift in ROS if there was no positive or negative shift disclosed.
Then a crosstabulation based on shifts in ROS and the approach of the enterprises from the transport sector to Industry 4.0 was made (
Table 10).
It was tested for upper and lower alternative hypotheses with 100,000 Monte Carlo simulations, and the following hypotheses were formulated for ROW for each enterprise in the V4 region:
H0. The development of ROW was homogeneous during 2016–2021.
H1f. There is a date at which there is a positive (or negative) shift in the ROW.
If the computed
-value is lower than the significance level alpha, one should reject the null hypothesis and accept the alternative hypothesis based on
Figure 14 and
Figure 15. Sixty-six (66) transport enterprises with positive shifts in ROW were detected. One hundred and forty-two (142) transport enterprises with a negative shift in ROW were identified. If the computed
-value was greater than the significance level alpha, we could not reject the null hypothesis based on
Figure 14 and
Figure 15. Three hundred and twenty-six (326) transport enterprises were classified with no shift in ROW if there was no positive or negative shift disclosed.
Then a crosstabulation based on shifts in ROW and the approach of the enterprises from the transport sector to Industry 4.0 was made (
Table 11).
Thirdly, the dependence of two variables from previous crosstabulations was tested by the Pearson chi-square test.
H0. The variable shift in ROA (ROC, ROE, ROS, ROR, or ROW) and the variable applying Industry 4.0 are independent.
H2. There is a link between the variable shift in ROA (ROC, ROE, ROS, ROR, or ROW) and the variable applying Industry 4.0.
If the computed
-value is lower than the significance level alpha, one should reject the null hypothesis and accept the alternative hypothesis based on
Table 12. It was proven that there is a significant dependency between a shift in ROA (ROC, ROE, ROS, ROR, or ROW) and applying I4.0.
After the test of independence, the strength of dependence was computed. Between a shift in ROA (ROC, ROE, ROS, ROR, or ROW) and applying I4.0, a medium dependency was identified based on the values of both coefficients (
Table 13). The test of significance for the contingency coefficients was run.
H0. Contingency coefficient (Cramer’s V) is not statistically significant.
H3. Contingency coefficient (Cramer’s V) is statistically significant.
If the computed
-value is lower than the significance level alpha, one should reject the null hypothesis and accept the alternative hypothesis based on
Table 13. The contingency coefficient and Cramer’s V are statistically significant.
Finally, it was only focused on the percentage of enterprises with positive shifts in profitability ratios that applied Industry 4.0 through the sample used. To explore a sequel to applying I4.0 for transport enterprises, a z-test for one proportion was used.
H0. 25% of enterprises involved in Industry 4.0 had positive shifts in ROA (ROC, ROE, ROS, ROR, or ROW).
H4. More than 25% of enterprises involved in Industry 4.0 had positive shifts in ROA (ROC, ROE, ROS, ROR, or ROW).
If the computed
-value is lower than the significance level alpha, one should reject the null hypothesis and accept the alternative hypothesis based on
Table 14. More than 25% of enterprises involved in Industry 4.0 had positive shifts in profitability ratios ROA, ROC, ROS, and ROR. It implies that Industry 4.0 may serve not only to balance the mentioned profitability ratios but also to increase them.
But if the computed
-value was greater than the significance level alpha, we could not reject the null hypothesis based on
Table 15 for profitability ratios ROE and ROW.
4. Discussion
Our findings were first discussed to find parallels with the conclusions from studies in similar environments. Then, it was targeted at extending previous research by showing the dependencies between profitability and Industry 4.0 or additional factors within the transport sector.
The relevancy of common generalizations for enterprises from Czechia, Hungary, Poland, and Slovakia is aligned with the study by Didenko et al. [
85]. They highlight that these countries belong to a similar cluster of socio-economic development. Then, the main findings may be discussed, namely that the positive consequences of Industry 4.0 for the V4 region were proven.
Nagy et al. [
86] validate the critical role of Industry 4.0 in smart process planning provided by deep learning and virtual simulation algorithms, especially for industrial production. We validate the positive effect of components of I4.0 for transport enterprises. The individual analysis of the profitability of enterprises in the transport sector is undeniable. The significance of the mentioned sector was also determined by Michalkova [
87]. The study marks the transport sector as crucial in the current economic situation. Honkova adds [
88] that the transport sector plays a significant role in ensuring competitiveness and sustainable economic growth in Europe.
Habanik et al. [
89] show the impact of Industry 4.0 on the selected macroeconomic indicators. We confirm the effect of I4.0 on the selected microeconomic indicators. Specifically, our study disclosed the influence on profitability ratios. This fact fits with the conclusion of Svabova et al. [
90]. They set out that the source for these similarities among the values of profit levels of the enterprises in V4 countries arises not only from the economic situation in the countries but also from the economic situation in these enterprises.
Vrabel et al. [
91] emphasize the need to deliver innovative technologies suitable for transport. Our findings support this approach with evidence-based results of significant dependency between shifts in ROA, ROC, ROE, ROS, ROR, or ROW and applying I4.0 based on a robust sample of transport enterprises.
This research extends the conclusions of Durana and Valaskova [
54]. They analyze the same period but focus only on Slovak, Czech, Polish, and Hungarian SMEs applying smart sensors. But this study involves any tool of Industry 4.0, not only smart sensors. They prefer profit in absolute values to more unified profitability ratios from delivered research. In addition, the investigation was realized for every country in the region and proved individually that smart sensors balanced the earnings of the enterprises during the COVID-19 pandemic. Based on robust subsamples, it was identified that more than 80% of enterprises did not have a negative trend in how their earnings shifted during the six years. We extend the conclusion from individual countries to the whole region of countries in general. The development was evaluated by the Mann-Kendall trend test, and the proportion was tested by a z-test to compare one proportion. Our investigation added the direction of the shift to trend detection for all 534 businesses involved.
Kutac et al. [
92] investigate the consequences of personnel cost growth on the profitability of transport enterprises in Czechia. We differ from this study in that it was not operating profit but EBT that was preferred for calculating ratios. It was focused on large road freight transport companies. We involve all kinds of transport (land, pipe, water, and air). Data from 25 businesses that met the requirement of being accessible for all years during the assessment period from 2014 to 2019 was used for the analysis. Our analysis provided a larger sample and had more robust implications. Return on assets within operating profit, return on equity within operating profit, and return on personnel costs within operating profit were calculated. They found that choosing transport companies in the years 2015–2016 resulted in a considerable decline in labor productivity as measured by sales per employee and decreased profit. This was due to rising human expenditures. Due to higher labor productivity and higher profits, the annual increase in personnel costs slowed down in 2017 and 2018. Despite another increase in personnel expenditures in 2019, the situation shifted, and profit and labor productivity rose. According to the analysis of these data, the increase in labor productivity in terms of sales per employee and profit growth in 2018 and 2019 was due to the rising cost of transportation, which included higher human expenditures. We analyzed similar indicators but extended them to about three more indicators (ROC, ROR, and ROS).
Czodorova and Gnap [
93] investigate the effectiveness of the introduction of a quality management system according to the ISO 9001 standard in Slovak transport enterprises. It was observed from 2009 to 2020. Their case study showed that the implementation of a quality management system according to the ISO 9001 standard had a significant and positive impact not only on ROA but also on ROS performance. In addition, when compared to the period before they obtained ISO 9001 certification, there was a considerable improvement in their average values. Further research into the financial standing of transport businesses that already had an ISO 9001-compliant quality management system showed that all the values of the chosen indicators increased in 2020 during the COVID-19 pandemic. We add to this conclusion and the conclusion of Fulop et al. [
94] that applications of Industry 4.0 may also have a positive impact on ROA and ROS performance and other profitability indicators. Fulop et al. [
94] also use a case study to test the positive effect of the smart optimal method on the fuel supply of transport activity. They do not focus on specific profitability indicators but on overall efficiency. Based on the more cost-effective option, the approach created in this study helps make decisions about whether to refill at a farther but more affordable fuel station or at a closer but more expensive fuel station. The optimal fuel volume, or the precise volume required, including a safe quantity to cover stochastic situations, must then be ascertained. This feature of the optimization approach supports the best choices for the best stations and how much fuel to buy to lower fuel costs. Therefore, using this new approach as opposed to the drivers’ recent ad hoc individual decision-making leads to significant cost savings.
Korneta [
95] discloses another positive impact on profitability compared to our study of the country in the V4 region. The influence of net promoter scores on Polish transport was assessed. Based on the smaller sample of 34 enterprises, the study verified a statistically significant and positive dependence between net promoter score and the three profitability variables (ROA, ROE, and ROS). We confirm the dependencies for the whole region with a larger sample and three more ratios. The Pearson correlation coefficient was run, and three profitability ratios were calculated, not from EBT as we did. But from the net result and earnings before interest, tax, depreciation, and amortization (EBITDA). We support the Pearson correlation coefficient with Cramer’s V.


