Abstract
A rockburst is a geological disaster that occurs in resource development or engineering construction. In order to reduce the harm caused by rockburst, this paper proposes a prediction study of rockburst propensity based on the intuitionistic fuzzy set-multisource combined weights-improved attribute measurement model. From the perspective of rock mechanics, the uniaxial compressive strength , tensile stress , shear stress , compression/tension ratio , shear/compression ratio , and elastic deformation coefficient were selected as the indicators for predicting the propensity of rockburst, and the corresponding attribute classification set was established. Constructing a model framework based on an intuitionistic fuzzy set–improved attribute measurement includes transforming the vagueness of rockburst indicators with an intuitionistic fuzzy set and controlling the uncertainty in the results of the attribute measurements, as well as improving the accuracy of the model using the Euclidean distance method to improve the attribute identification method. To further transform the vagueness of rockburst indicators, the multisource system for combined weights of rockburst propensity indicators was constructed using the minimum entropy combined weighting method, the game theory combined weighting method, and the multiplicative synthetic normalization combined weighting method integrated with intuitionistic fuzzy sets, and the single-valued data of the indicators were changed into intervalized data on the basis of subjective weights based on the analytic hierarchy process and objective weights, further based on the coefficient of variation method. Choosing 30 groups of typical rockburst cases, the indicator weights and propensity prediction results were calculated and analyzed through this paper’s model. Firstly, comparing the prediction results of this paper’s model with the results of the other three single-combination weighting models for attribute measurement, the accuracy of the prediction results of this paper’s model is 86.7%, which is higher than that of the other model results that were the least in addition to the number of uncertain cases, indicating that the uncertainty of attribute measurement has been effectively dealt with; secondly, the rationality of the multiple sources system for combined weights is verified, and the vagueness of the indicators is controlled.
Keywords:
intuitionistic fuzzy set; multisource combined weights; attribute measures; prediction of rockburst propensity; indicator vagueness MSC:
28E99
1. Introduction
A rockburst is a geological hazard that occurs in resource development or engineering construction, manifesting itself as a sudden destabilization of the rock body and an explosive ejection of the rock mass [1,2,3]. With human activities continuing to move into the deep part of the earth, the high geostress, high osmotic pressure, and other factors caused by the high depth of burial will make rockburst accidents more frequent and more intense, which will further cause irreparable damage to personnel, equipment, etc. [4,5]. Many countries around the world have suffered from rockburst hazards during deep earth operations, such as China [6], Pakistan [7], Australia [8], Germany [9], South Africa [10], the United States [11], Canada [12], and so on. In fact, the places where rockbursts occur have not only been mining ore mines; civilian underground projects such as subways, tunnels, and water conservancy facilities are also deeply affected [13]. In general, rockburst has become a worldwide difficulty in rock science. If it is possible to more accurately predict the propensity of a rockburst occurring in the construction area, a greater degree of loss can be avoided, and for the construction method, explosive area exploration and protection work will also provide more effective theoretical support.
The mechanism of rockburst is still the focus of interest for experts and scholars in the field. With the passage of time, the study of the causation mechanism of rockbursts, the rules of development, the judgments, and the prediction model are also deepening, and more and more research results make the real situation of a rockburst more and more clear [14,15]. Generally speaking, the occurrence of rockbursts is mainly explained from an energy point of view, in which the energy accumulated in the rock loses its original homeostasis under the condition of external perturbation, causing destructive phenomena in the process of energy release [16]. The prediction of the rockburst propensity is essential to determine the degree to which the possibility of rockbursts occurs in that region. The research on rockburst prediction has gone through a single-factor stage, a multi-factor stage, and an artificial intelligence method stage in the development process, and the research methods used are becoming more and more comprehensive and scientific. A single-factor approach is used in the early stages of rockburst research. This stage is mainly through a relatively single indicator for rockburst criteria research, including the cookie criterion [17], Russenes criterion [18], Turchaninov criterion [19], Hoek criterion [20], Kidybinski criterion [21], etc. The focus of the consideration was only a single rock mechanics indicator (such as shear/compression ratio ) or elastic energy indicator (such as elastic deformation coefficient ). With the deepening of the study, it has been found that the occurrence of rockbursts is the result of the combined effect of many factors, and a single indicator criterion does not guarantee the accuracy of the prediction results. In this context, the multi-factor approach should replace the single-factor approach and become the mainstream of rockburst research [18,22,23]. Under the multi-factor approach, studies to predict rockburst propensity are mainly carried out using physical experimental methods or mathematical evaluation methods. In physical experimental studies, Lu et al. [24] used similar rock materials for physical experiments to simulate the transmission characteristics of stress waves in rock and the process of rockburst occurrence. Fakhimi et al. [25] simulated and studied the strain rupture of rock in the laboratory by designing a steel beam device connected to a compression loading machine. For the mathematical evaluation of rockbursts, Wang et al. [18] proposed a fuzzy mathematical comprehensive evaluation method to predict the rockburst with the shear/compression ratio , compression/tension ratio , and elastic deformation coefficient as the main controlling factors. Zhang et al. [26] selected some evaluation indicators based on the existing rockburst criterion, established a rockburst prediction model through rough set theory and extension theory, and then predicted and evaluated the rockburst in the case of the Jiangbian Power Station in Sichuan, China. Zhou et al. [27] investigated the destructiveness of a specific area before stress blasting, in which they evaluated it through a combination model based on the unconfirmed measures and entropy coefficients as well as eight selected indicators. Liu et al. [28] studied rockburst classification prediction through the method based on the cloud model and attribute weighting, and they verified the feasibility with the results from 164 sets of rockburst examples. Yin et al. [29] established a classification prediction model for rockburst based on the combined weighting and attribute interval identification, after which they verified the feasibility and applicability of the model through 12 sets of data calculations of rockburst cases and the optimization of average coefficients. Zhou et al. [30] analyzed the damage characteristics and key factors of rockburst in deep-buried tunnels under typical high geostress conditions and established a prediction model of rockburst in tunnels by combining the theory of unconfirmed measurements and the improved combined weighting method with the distance function, which verified its applicability through the engineering application of the model in tunnels. Hu et al. [31], aimed at improving the accuracy of rockburst prediction, optimized the theory of unconfirmed measurements using a normal cloud model, under which the accuracy of predicting rockburst was significantly higher than that of the traditional unconfirmed measurement model. Since computer technology has been widely used in the field of rock mechanics, intelligent algorithms and big data for predicting rockburst have become the future direction [32], and algorithms such as artificial neural networks and their derivatives [33,34,35], Bayesian networks [36,37], support vector machines [38,39], particle swarm optimization [38,40], and decision trees [41,42] have been introduced to improve the accuracy of the prediction results. In general, the current method of predicting rockburst propensity is usually based on the results of the integrated ranking of indicators, so the focus is on selecting the type of indicators, a reasonable weighting method, and modeling algorithms that fit the characteristics of rockburst data. The actual engineering situation in the field is often complex and variable, and the rockburst indicator data often have significant vagueness [4], so there are specific requirements for the predictive modeling algorithms used.
In order to adapt to the vagueness of the indicators for rockburst propensity and distinguish the attribute classification, this paper proposes a model based on intuitionistic fuzzy sets, multisource combined weights, and improved attribute measurements and studies the prediction of rockburst propensity. Building a model framework based on intuitionistic fuzzy set–attribute measure, the rockburst propensity indicator is transformed into an intervalized number field through the intuitionistic fuzzy set, and the indicator value is transformed to control the vagueness. Using the Euclidean distance method to improve the model recognition method of the attribute measure theory, which avoids artificial parameters affecting the accuracy of the prediction results. The mechanism of rockburst is analyzed and combined with actual case data, indicators of rockburst propensity are selected from the viewpoint of rock mechanics, and the relationship of the number field between the ranges of rock burst indicators are established, and the attribute classification is set. Based on the subjective weights obtained with the analytic hierarchy process and objective weights obtained with the coefficient of variation method, combined weights obtained with minimum entropy combined weighting, game theory combined weighting, and multiplicative synthesis normalization combined weighting are used to construct the multisource system for combined weights of rockburst propensity indicators, avoiding the weight bias, to the greatest extent, caused by different focuses of the weighting and converting single-valued indicators into intervalized values using intuitionistic fuzzy sets to expand the effective range of the indicators and further control the vagueness. Finally, the model prediction results for 30 sets of rockburst case data are calculated and compared with the prediction results of the other three attribute measurement models that use single combined weighting to verify the accuracy of the model proposed in this paper.
2. Theoretical Overview
2.1. Intuitionistic Fuzzy Set Theory
Intuitionistic fuzzy set theory was proposed by Atanassov in 1983 [43,44,45] by expanding the space of fuzzy sets to three dimensions through the three characteristic values of the degree of affiliation, non-affiliation, and hesitation to better control the vagueness of the problem to be solved [46,47,48].
Assuming that the set is a defined domain and non-empty, then the intuitionistic fuzzy set of is defined as:
where and are the degree of affiliation and non-affiliation of to the set , respectively, and additionally, is introduced to denote the degree of hesitation, which is satisfied as follows:
If there are two intuitionistic fuzzy sets and , when sum and product operations are required, the equation are as follows:
where denotes the degree of affiliation for to , denotes the degree of affiliation for to , denotes the degree of non-affiliation for to , and denotes the degree of non-affiliation for to .
2.2. Attribute Measurement Theory
Attribute measurement theory, also known as attribute identification, is used to describe the measurement relationship between qualitative problems and attribute classes, which consists of three main components: single-indicator attribute measurement, composite attribute measurement, and attribute identification [49,50,51].
Assuming that the object to be evaluated has a set of attribute classes , are different attribute intervals of the set , and there are indicators that characterize the attributes. When the indicator is , the probability of belonging to class is , the attribute classification of the indicator is shown as Equation (4), and denotes the boundaries of the values of the class, which are usually or .
Assuming a median value of for attribute class and a median value of for the measure, the equation is calculated as follows:
where and denote the boundary values of .
When there is a scheme in set that has a value of for an indicator and , the single-indicator attribute measurement equation is expressed as follows:
where denotes the median value of the measure for , denotes the value of the left boundary for indicator about , and denotes the value of the right boundary for indicator about .
When , the equation for the single-indicator attribute measurement function is as follows:
After obtaining the attribute measure values from Equations (6)–(11) for indicator corresponding to classification interval , they have been integrated into a matrix of single-indicator attribute measures as follows:
3. Research Methodology
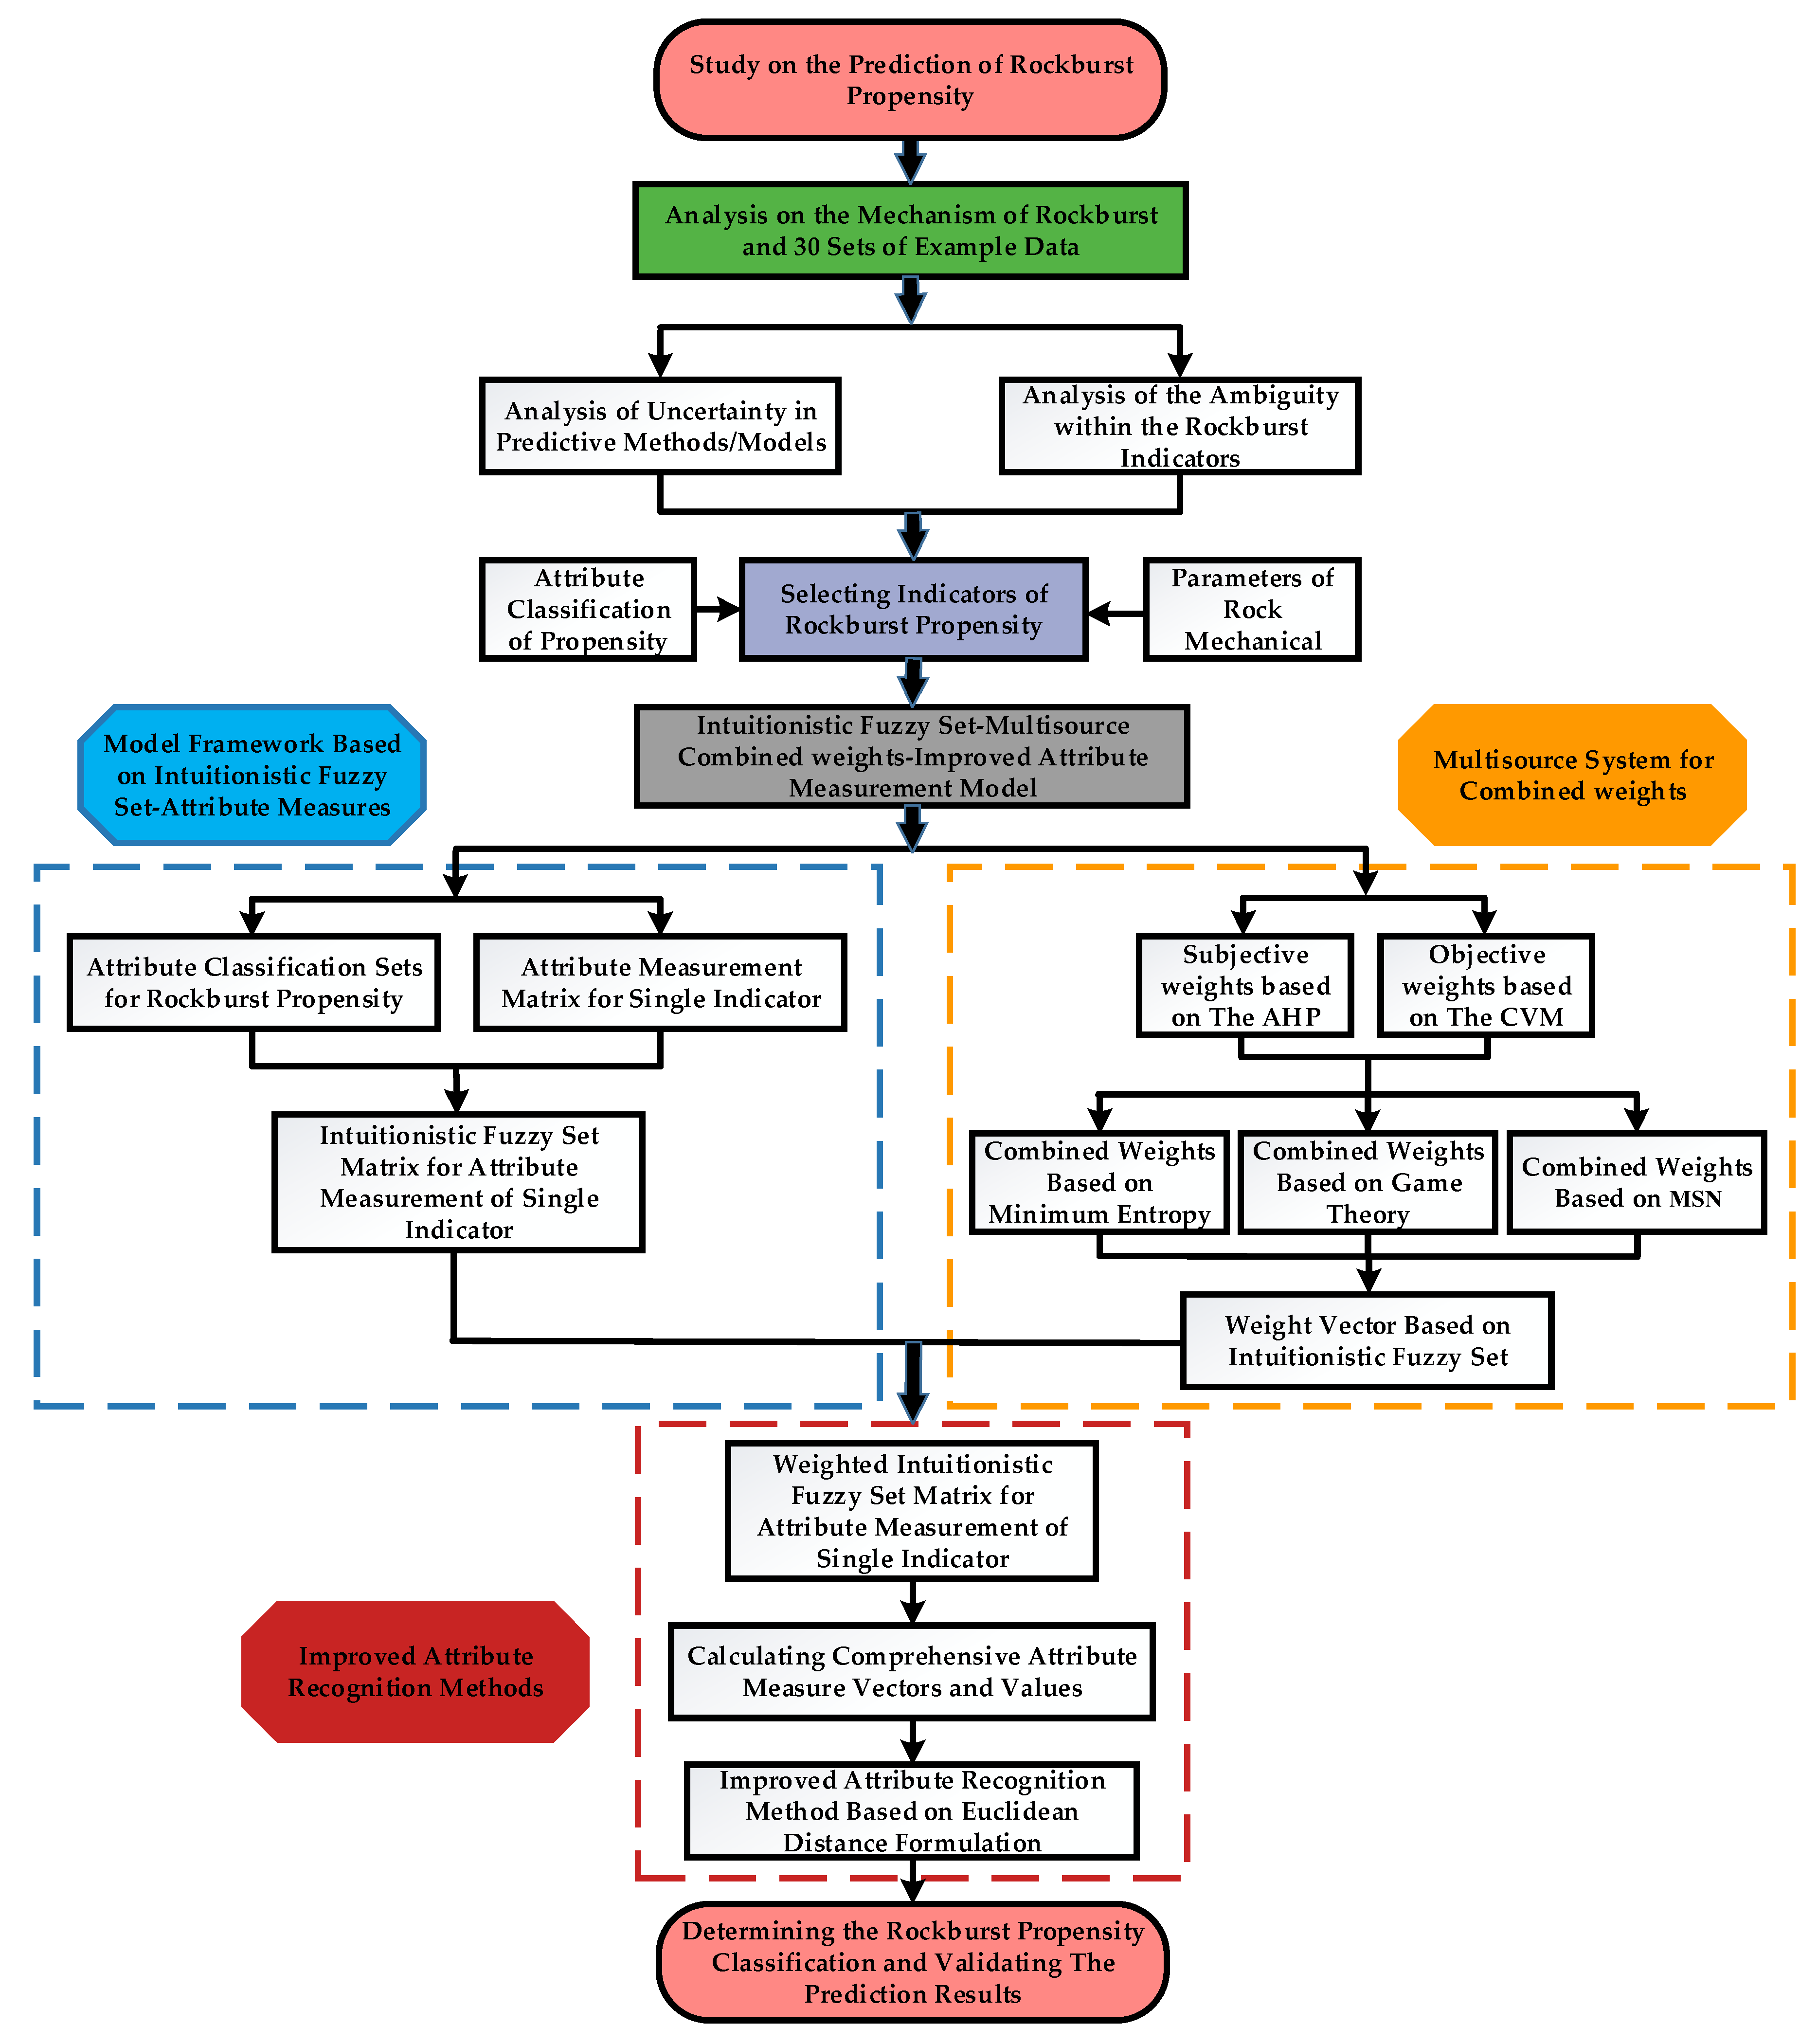
3.1. Model Framework Based on Intuitionistic Fuzzy Set–Improved Attribute Measures
3.1.1. Constructing a Matrix of Intuitionistic Fuzzy Sets for Attribute Measurement
- 1.
- Matrix of Intuitionistic Fuzzy Sets for Single-Indicator Attribute Measurement
From the concept of attribute measurement, the essence of the attribute measurement function is to characterize the degree of affiliation in a certain classification interval, so is in intuitionistic fuzzy set theory. In the concept of intuitionistic fuzzy set theory, the single-indicator attribute measurement value of the set with respect to the attribute classification set is denoted as an intuitionistic fuzzy set matrix of . When the problem to be evaluated is quantitative, the degree of hesitation as and then is considered, and the matrix is simplified to , specifically as follows:
- 2.
- Matrix of Intuitionistic Fuzzy Sets for Weighted Attribute Measurement
On the basis of the matrix of intuitionistic fuzzy sets for single-indicator attribute measures, the expression form of the intuitionistic fuzzy set matrix for weighted attribute measures is further studied. In the concept of attribute measurement theory, the value of the weighted attribute measure corresponding to each class is calculated using the sum of the product between the indicator weights and the single-indicator attribute measure . The equation is as follows:
where denotes the weight value of indicator , and denotes the measurement value of indicator about .
The matrix of intuitionistic fuzzy sets for weighted attribute measures is consistent with the computational mode of Equation (14), but the indicator weights should also be in the form of intuitionistic fuzzy sets, on the one hand, in order to fit the matrix calculation and, on the other hand, to also transform the vagueness of the indicator with intuitionistic fuzzy sets. The intuitionistic fuzzy set form of the indicator is denoted as , where and denote the degree of affiliation and non-affiliation of the indicator, respectively, and the properties are consistent with Equation (2). According to the product calculation principle of Equation (3), the matrix of the intuitionistic fuzzy set of weighted attribute measures is calculated using Equation (13) and , which leads to the equation of as shown in Equation (15) and the form of matrix as shown in Equation (16):
where and denote the degree of affiliation and non-affiliation for the indicator , respectively; and denote the degree of affiliation and non-affiliation of the attribute measure for indicator , respectively.
3.1.2. Calculating the Value of the Composite Attribute Measure and Improving Attribute Identification
- 1.
- Calculating the value of the composite attribute measure
According to Equation (15), it is known that the values of weighted attribute measures of any scheme in set with respect to class are vectors of intuitionistic fuzzy sets [52], so the calculation of the composite attribute measures for this scheme follows the principle of sum calculation in Equation (3), and the vector equation and numerical calculation equation are as follows:
where and .
- 2.
- Improving attribute recognition methods
For the identification of attribute measures, methods such as numerical comparisons or confidence criteria are usually used, and the identification accuracy is largely dependent on the data set via artificial means [22,29]. The Euclidean distance method is used in this paper for the identification of composite attribute measures, establishing the set of classes as the origin for distance measurement, and carrying out the independent identification of each class separately to improve accuracy. The identification equation based on the Euclidean distance method is as follows:
denotes the “distance” between the value of the composite measure for the case and the set of attribute classes, and the smaller the value is, the more it belongs to the class.
3.2. The Method of Indicator Weighting Based on Intuitionistic Fuzzy Set–Multisource Combined Weights
3.2.1. Single-Weighting Method
Subjective weighting method: the analytic hierarchy process (AHP). The analytic hierarchy process is a subjective weighting method proposed by Saaty that has been more widely used in the field of analyzing and evaluating indicator weights [53,54]. When there are no data on the objective factors and the importance of the indicators cannot be quantified, the indicator weights are obtained through empirical judgment by the decision maker. For the AHP method, selecting the appropriate scale is an important guarantee for the reasonableness of the judgment matrix, usually choosing a 1–9 scale, and the index of the average random consistency test is also a necessary correction parameter. The contents of the AHP method are building a hierarchical model; constructing a judgment matrix; consistency testing of the judgment matrix and hierarchical single ranking; and hierarchical total ranking. The calculation formula for the consistency index is as follows:
where is the largest characteristic value of the judgment matrix, and is the order of the judgment matrix.
The calculation formula for the random consistency ratio is as follows:
where the value of is determined on the 1–9 scale.
Objective weighting method: coefficient of variation method (CVM). The principle of the coefficient of variation method is to determine the value of weights according to the degree of variation for an indicator; if the degree of variation for an indicator is higher, it means that each object to be evaluated has a higher degree of differentiation in the field of that indicator and that the weight of that indicator should be higher, and vice versa, it is the same. This method is an objective weighting method, and important parameters include the variation coefficient, coefficient of standard deviation, etc. [55,56]. The specific steps of the calculation are as follows:
- Step 1: Calculating the average value and standard deviation of the indicatorwhere , .
- Step 2: Calculating the coefficient of variation for the indicatorwhere .
- Step 3: Normalizing the coefficient of variation and calculating indicator weightswhere .
From that, the weight vector can be obtained.
3.2.2. Multisource System for Combined Weights
The combination of subjective and objective weights to replace the single weight can eliminate the one-sidedness and bias of the single-weight method to a certain extent. There are many methods and different principles of combined weighting, and different combined weighting methods have different focuses, so it is difficult to guarantee that one combined weighting method can guarantee the reasonableness of the weights. Therefore, three widely used combined weighting methods are selected in this paper to construct a multisource system for combined weights.
- 1.
- Combined weighting method based on minimum entropy
Assuming that the weight of the AHP is and the weight of the CVM is , according to the principle of minimum entropy [57], the equation for the combined weight is as follows:
In order to obtain the distribution when the information entropy is extremely large, the Undetermined Lagrange Multipliers Algorithm [58] is used to solve Equation (25), which can be obtained as the following expression for :
- 2.
- Combined weighting method based on game theory
Using a combined weighting method based on game theory, it is possible to optimize a combination for multiple methods of determining weights [59,60].
- Step 1: Assuming that the weights of indicators are calculated using more than one method and that the weights can be formed into a set , the linear combination of the weight vectors is as follows:where is the underlying weight vector, is a coefficient of a linear combination for different weighting methods, and .
- Step 2: The coefficient of the linear combination is optimized to achieve a minimal deviation between the possible weights and the basic weights of . The equation is calculated as follows:where , .
According to the properties of matrix differentials, the optimal first-order derivative of the above equation is:
is calculated from the above equation, and is normalized:
- Step 3: The combined weights are calculated using the following equation:
- 3.
- Combined weighting method based on multiplicative synthetic normalization
Multiplicative synthetic normalization is used to normalize the product of two weight multiplications [61] with the following equation:
where denotes the AHP weights, denotes the CVM weights, and .
By constructing a multisource system for combined weights, on the one hand, three combined weights are used to replace one single weight or one single combined weight, and on the other hand, the range of indicator weights is expanded, and the vagueness of the indicators is upgraded in dimensions, so that further processing can be carried out using the method of intuitionistic fuzzy sets.
3.2.3. Transformation of Multisource Combined Weights Based on Intuitionistic Fuzzy Sets
The multisource system for combined weights constructed in Section 3.2.2 shows that the weights of indicator are transformed into combined weights , , and . The weights of the indicators are fuzzified according to the intuitionistic fuzzy set to , where and characterize the degree of importance and the degree of unimportance, respectively, which satisfies [47].
Assuming that there is a relationship, , between the three combined weights of indicator , the importance of the weights is ranged as , the unimportance as , and the vector form of the intuitionistic fuzzy set for the weights is denoted as . It can be noted that the numerical sum of the importance and unimportance of the weights does not necessarily have to be 1. This is because of the superimposed vagueness of the three data sources under the multisource system for combined weights, and the values of the indicators are intervalized into a range of number fields, which are no longer explicitly quantitative data, so that the degree of hesitation exists and is numerically equal to the length of the interval for taking values.
4. Prediction of Rockburst Propensity
4.1. Workflows
The research content of this paper is to predict the degree of the propensity for rockburst occurrence through the composite model using intuitionistic fuzzy sets, multisource combined weights, and improved attribute measures. The research content of this paper is to predict the degree of the propensity for rockburst occurrence through the composite model using an intuitionistic fuzzy set–multisource combined assignment–improved attribute measure. By sorting out the modeling process in Section 2 and Section 3 and combining the characteristics of rockburst, a schematic diagram of work is listed as shown in Figure 1, and the overall process of the prediction work includes the following five parts:
Figure 1.
A model process for predicting rockburst propensity.
(1) Studying the phenomenon and mechanism of the rock burst, reasonably selecting the indicators that characterize the rockburst propensity, and analyzing the measurement connection and correspondence of numerical domains between the rockburst indicators and the propensity classification from the viewpoint of the attribute classification set;
(2) Choosing a typical case of the rockburst as the data source of this paper, according to the relationship of the numerical domain between rockburst propensity and classification, calculating the value of the single-indicator attribute measure for rockburst propensity, and establishing the matrix of the intuitionistic fuzzy set for the single-indicator attribute measure based on the case data;
(3) According to the case data of rockbursts, the subjective weight of the hierarchical analysis method and the objective weight of the coefficient of variation method for indicators are calculated, based on which the multisource system for combined weights is constructed, and considering the deficiencies of the single weight method and one combined weight method, the combined weight based on the minimum entropy, game theory, and multiplication synthetic normalization, respectively, is used as the data source to range the indicator weights, and the analysis and transformation of the vagueness based on the intuitionistic fuzzy set are carried out;
(4) Combining the matrix of intuitionistic fuzzy sets for single-indicator attribute measures about rockburst propensity and the vector of intuitionistic fuzzy sets for multisource combined weights of rockburst indicators, the matrix of intuitionistic fuzzy sets for weighted attribute measures is calculated;
(5) Calculating the composite attribute measure of rockburst propensity, improving the attribute identification mode using the Euclidean distance method, and finally determining the propensity classification of rockburst cases.
4.2. Applied Research on the Model
4.2.1. Single-Weighting Method
- 1.
- Selecting indicators of rockburst propensity
Generally speaking, the selection of rockburst indicators requires a comprehensive consideration of stress conditions and physical parameters of the rock [22,52]. In the process of in-depth study, it can be found that due to the differences in normative standards, testing methods, such as integrity coefficients and other rock physical property parameters may not be able to truly reflect the quality of the rock body to some extent, and many scholars who only use mechanical indicators have also obtained good prediction results [39,62]. Therefore, this paper focuses on the mechanical properties of the rock to study the prediction of rockburst propensity, selecting the uniaxial compressive strength , tensile stress , shear stress , rock compression tension ratio , rock shear compression ratio , and elastic deformation coefficient as the rockburst indicators based on the three-axis force situation.
- 2.
- Determining classification of rockburst propensity
According to the selected indicators of rockburst propensity, in order to fit the calculation requirements of attribute measurement theory, through studying and sorting out the existing literature [51,52], the classes and corresponding numerical domains of the uniaxial compressive strength , compressive tensile ratio , shear compression ratio , and the elastic deformation coefficient can be obtained, and the attribute classification of tensile stress and shear stress can be deduced on the basis of the calculation, as shown in Table 1.
Table 1.
Classification of rockburst propensity and the corresponding numerical domains.
4.2.2. Calculating the Rockburst Cases
In order to verify the accuracy of predicting rockburst propensity with an intuitionistic fuzzy set–multisource combined weights–attribute measure model, 30 groups of classical rockburst cases worldwide were selected in this study [1,3,52], and the indicator data of each case is shown in detail in Table 2, with the data of rockburst case 1 as an example for the model validation.
Table 2.
30 sets of data for rockburst cases.
- 1.
- Matrix of intuitionistic fuzzy sets for rockburst single-indicator
From Equation (4) and Table 1, the matrix of attribute classification for rockburst propensity indicators can be listed as follows:
According to Equations (6)–(11) and (33), the matrix of single-indicator attribute measures for the sample are listed as follows:
From Equation (3), (13), and (34), the matrix of intuitionistic fuzzy sets for single-indicator attribute measures can be obtained as follows:
- 2.
- Calculating multisource combined weights of rockbursts
According to the description in Section 3.2.1, the subjective weights of the AHP method and the objective weights of the CVM for rockburst case 1 can be obtained as shown in Table 3.
Table 3.
Values of subjective and objective weights.
Based on the AHP weights and CVM weights, and according to the calculation method in Section 3.2.2, the minimum entropy combined weights, game theory combined weights, and multiplicative synthetic normalization weights of the indicators are obtained, as shown in Table 4, so as to construct the multisource system combined weights of rockburst propensity.
Table 4.
Values of the three combined weights.
According to the multisource combined weights of rockburst indicators, combined with the description in Section 3.2.3, the indicator system is converted into the form of intuitionistic fuzzy sets, as shown in Table 5, and the vector is obtained, as shown in Figure 2.
Table 5.
The form of intuitionistic fuzzy sets for multisource combined weights.
Figure 2.
Values and distribution of indicator weights. (a) Values and distribution of combined weights; (b) numerical domains of intuitionistic fuzzy sets for combined weights.
- 3.
- Intuitionistic fuzzy matrices and numerical computation of composite measures for rockbursts
According to the intuitionistic fuzzy vector of the rockburst indicators, Equations (15) and (35), it is possible to obtain the matrix of weighted intuitionistic fuzzy sets as follows:
From Equation (17), the intuitionistic fuzzy set vectors and values of the composite attribute measure for rock burst propensity are shown below:
- 4.
- Determining the classification of rockbursts
According to Equation (4), Table 1, and Section 3.1.2, the set of attribute classification for rockburst propensity in case 1 is defined as follows:
Then, the Euclidean distances of the composite attribute measures for each class of case 1 with respect to the corresponding classification are calculated as shown below:
Comparing the distances of case 1 to the subsets in the attribute class set, it can be concluded that , and therefore the composite attribute measure, is closest to class and is able to predict the propensity to rockburst occurrence class of for case 1.
4.3. Analysis of The Results
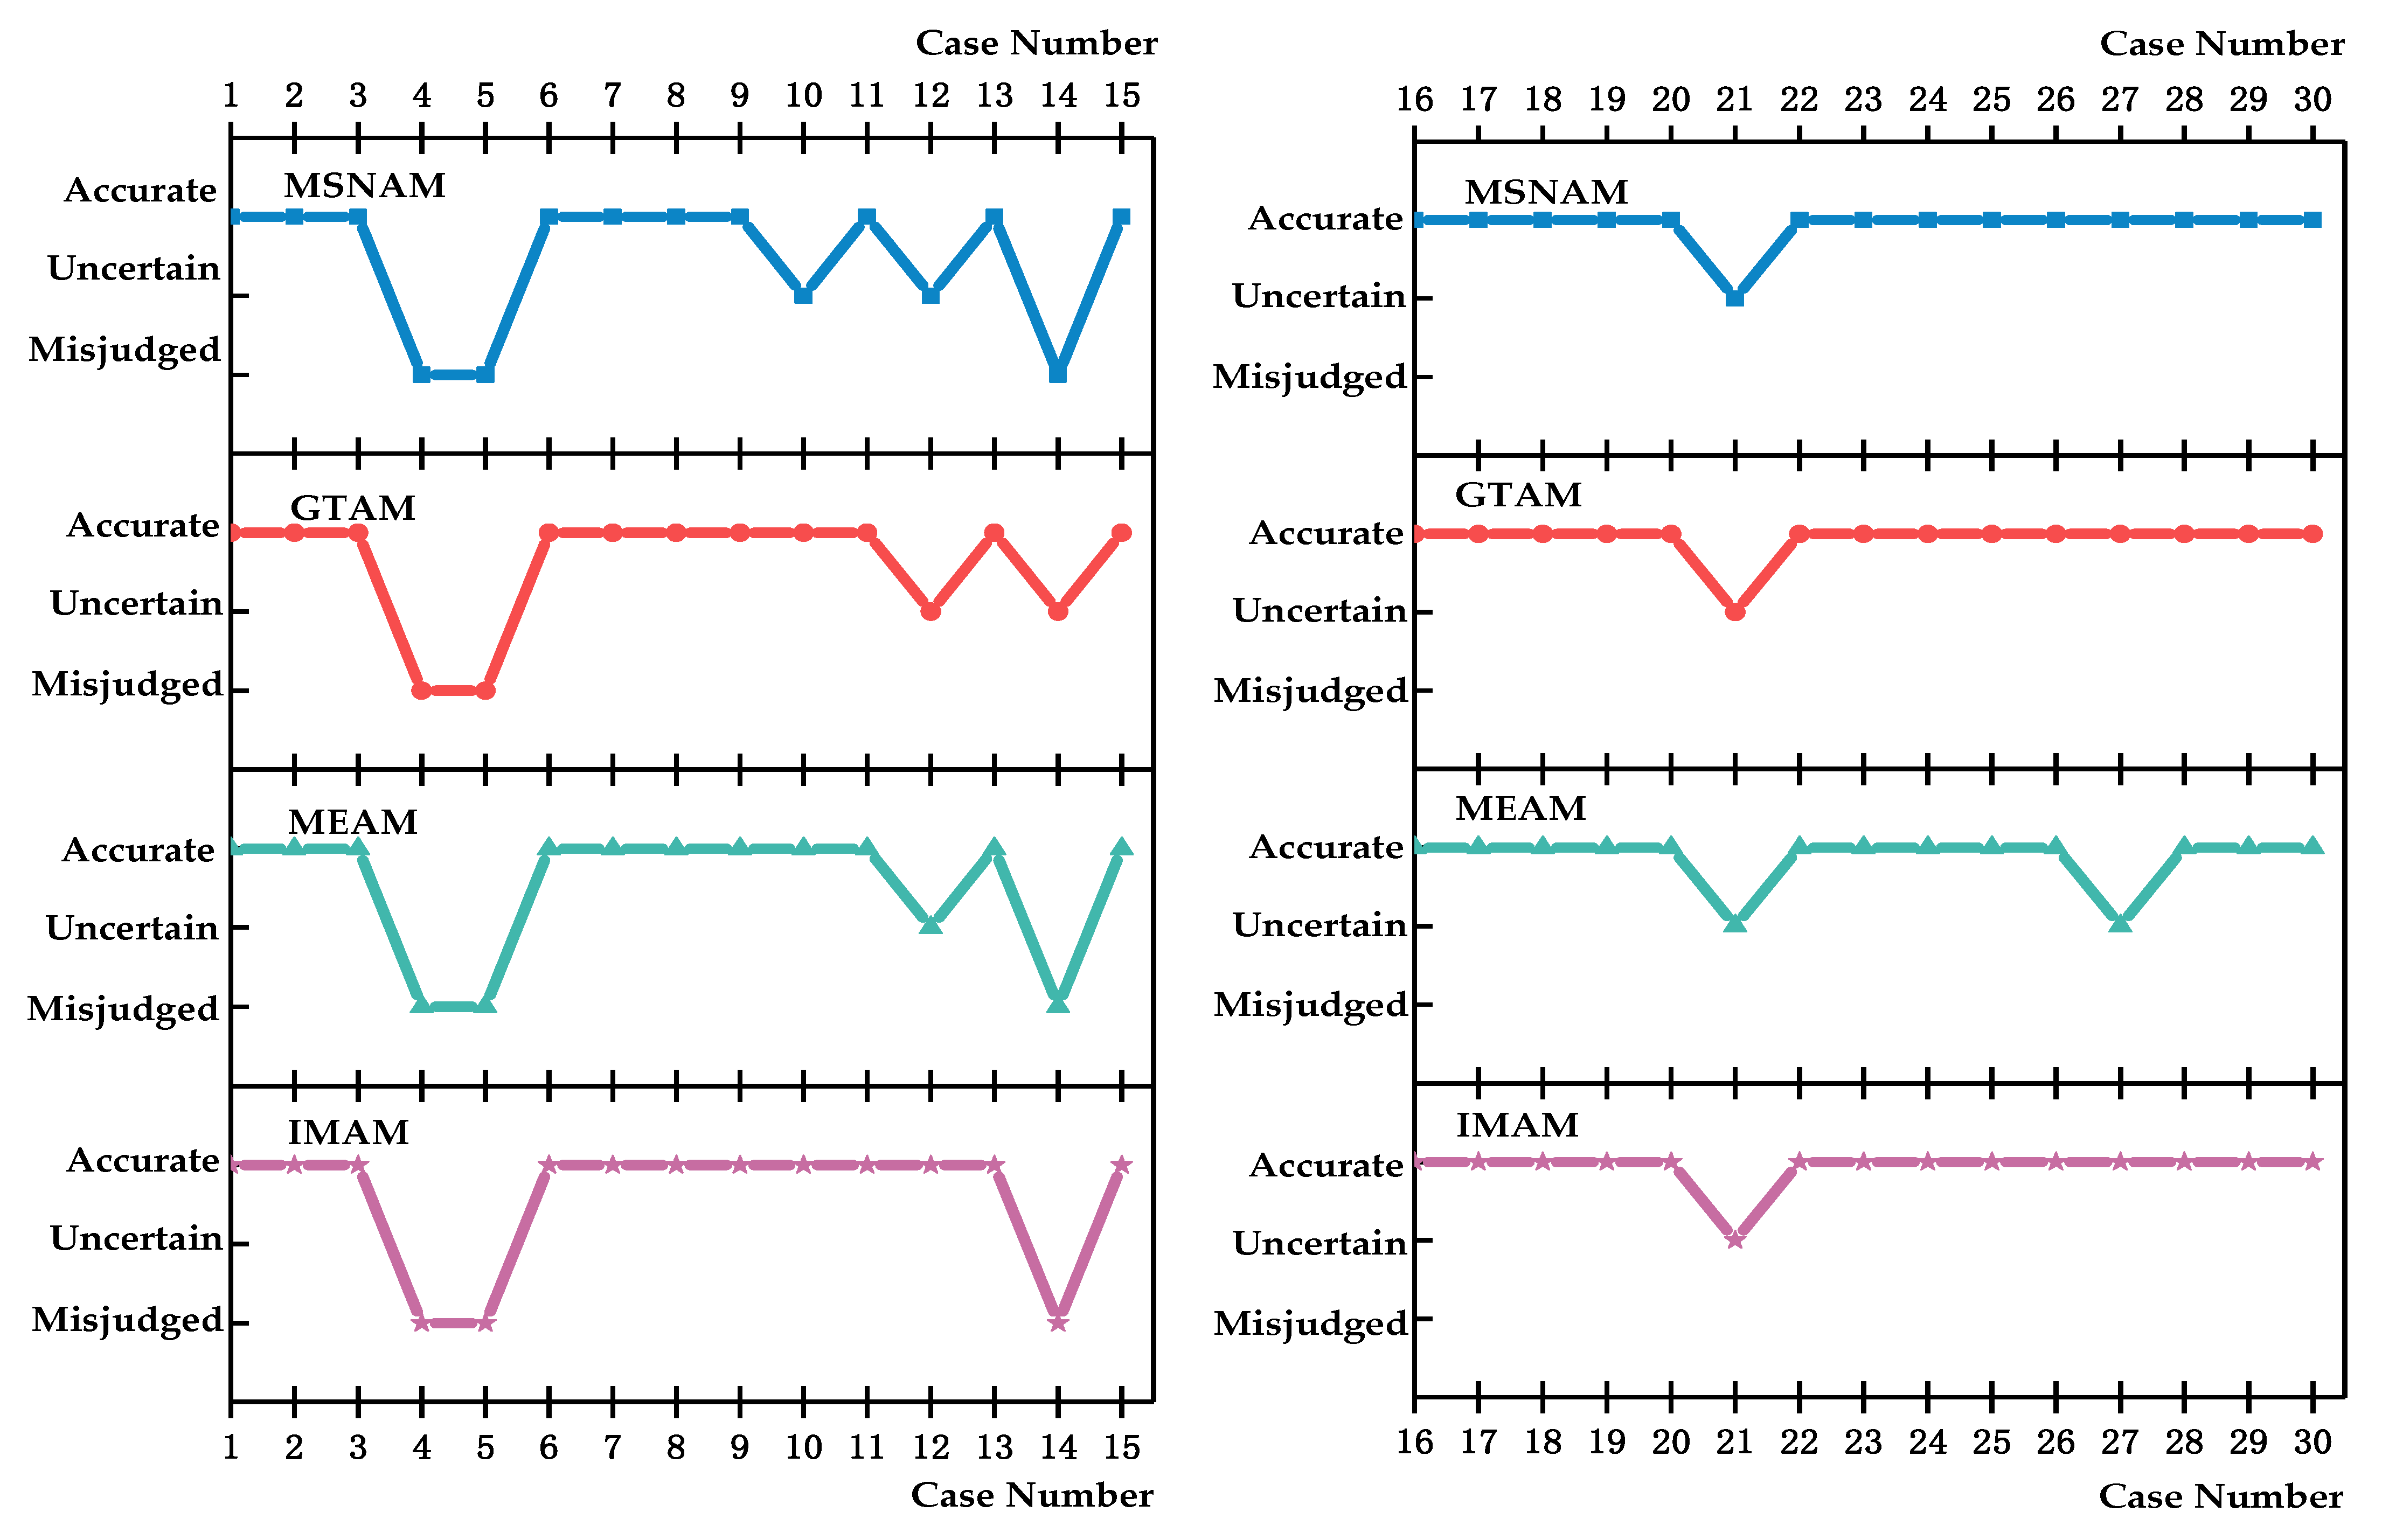
4.3.1. Analysis of the Results Calculated using the Model
According to the calculation steps of case 1, the remaining 29 sets of rockburst case data are calculated based on the model in this paper. Summarizing the results of rockburst propensity with this paper’s model, they are compared with the results of the minimum entropy–attribute measure model, the game theory–attribute measure model, and the multiplicative synthetic normalization–attribute measure model, respectively, and at the same time, they are verified with the data of the actual rockburst propensity class. The comparisons are shown in Table 6.
Table 6.
Comparison of 30 sets of prediction results for rockburst propensity.
Comparisons of the actual propensity of the selected rockburst cases and summaries of the number of cases where the results for each model in the table are accurate, uncertain, or misjudged are shown in Table 7, and the drawing of the comparison is shown in Figure 3.
Table 7.
Summary and comparison of results.
Figure 3.
Comparison between prediction results of models.
By analyzing the results, it can be found that:
(1) In terms of accuracy, the results of the intuitionistic fuzzy set–multisource combined weights–attribute measurement model proposed in this paper are better than the other three combined models, which makes this paper’s model more practical in practical applications;
(2) In the structure of models with single combined weighting, the model with the highest accuracy rate is the game theory–attribute measurement model. It can be further determined that among the three single combined weighting methods, the indicator weights of game theory are more reasonable;
(3) Comparing the results of the other three models, the number of uncertain cases in the results for the model proposed in this paper is the least, and the main reason is that the vagueness of the rockburst data is effectively controlled through the intuitionistic fuzzy set, which makes it tend to the corresponding attribute set to a certain degree.
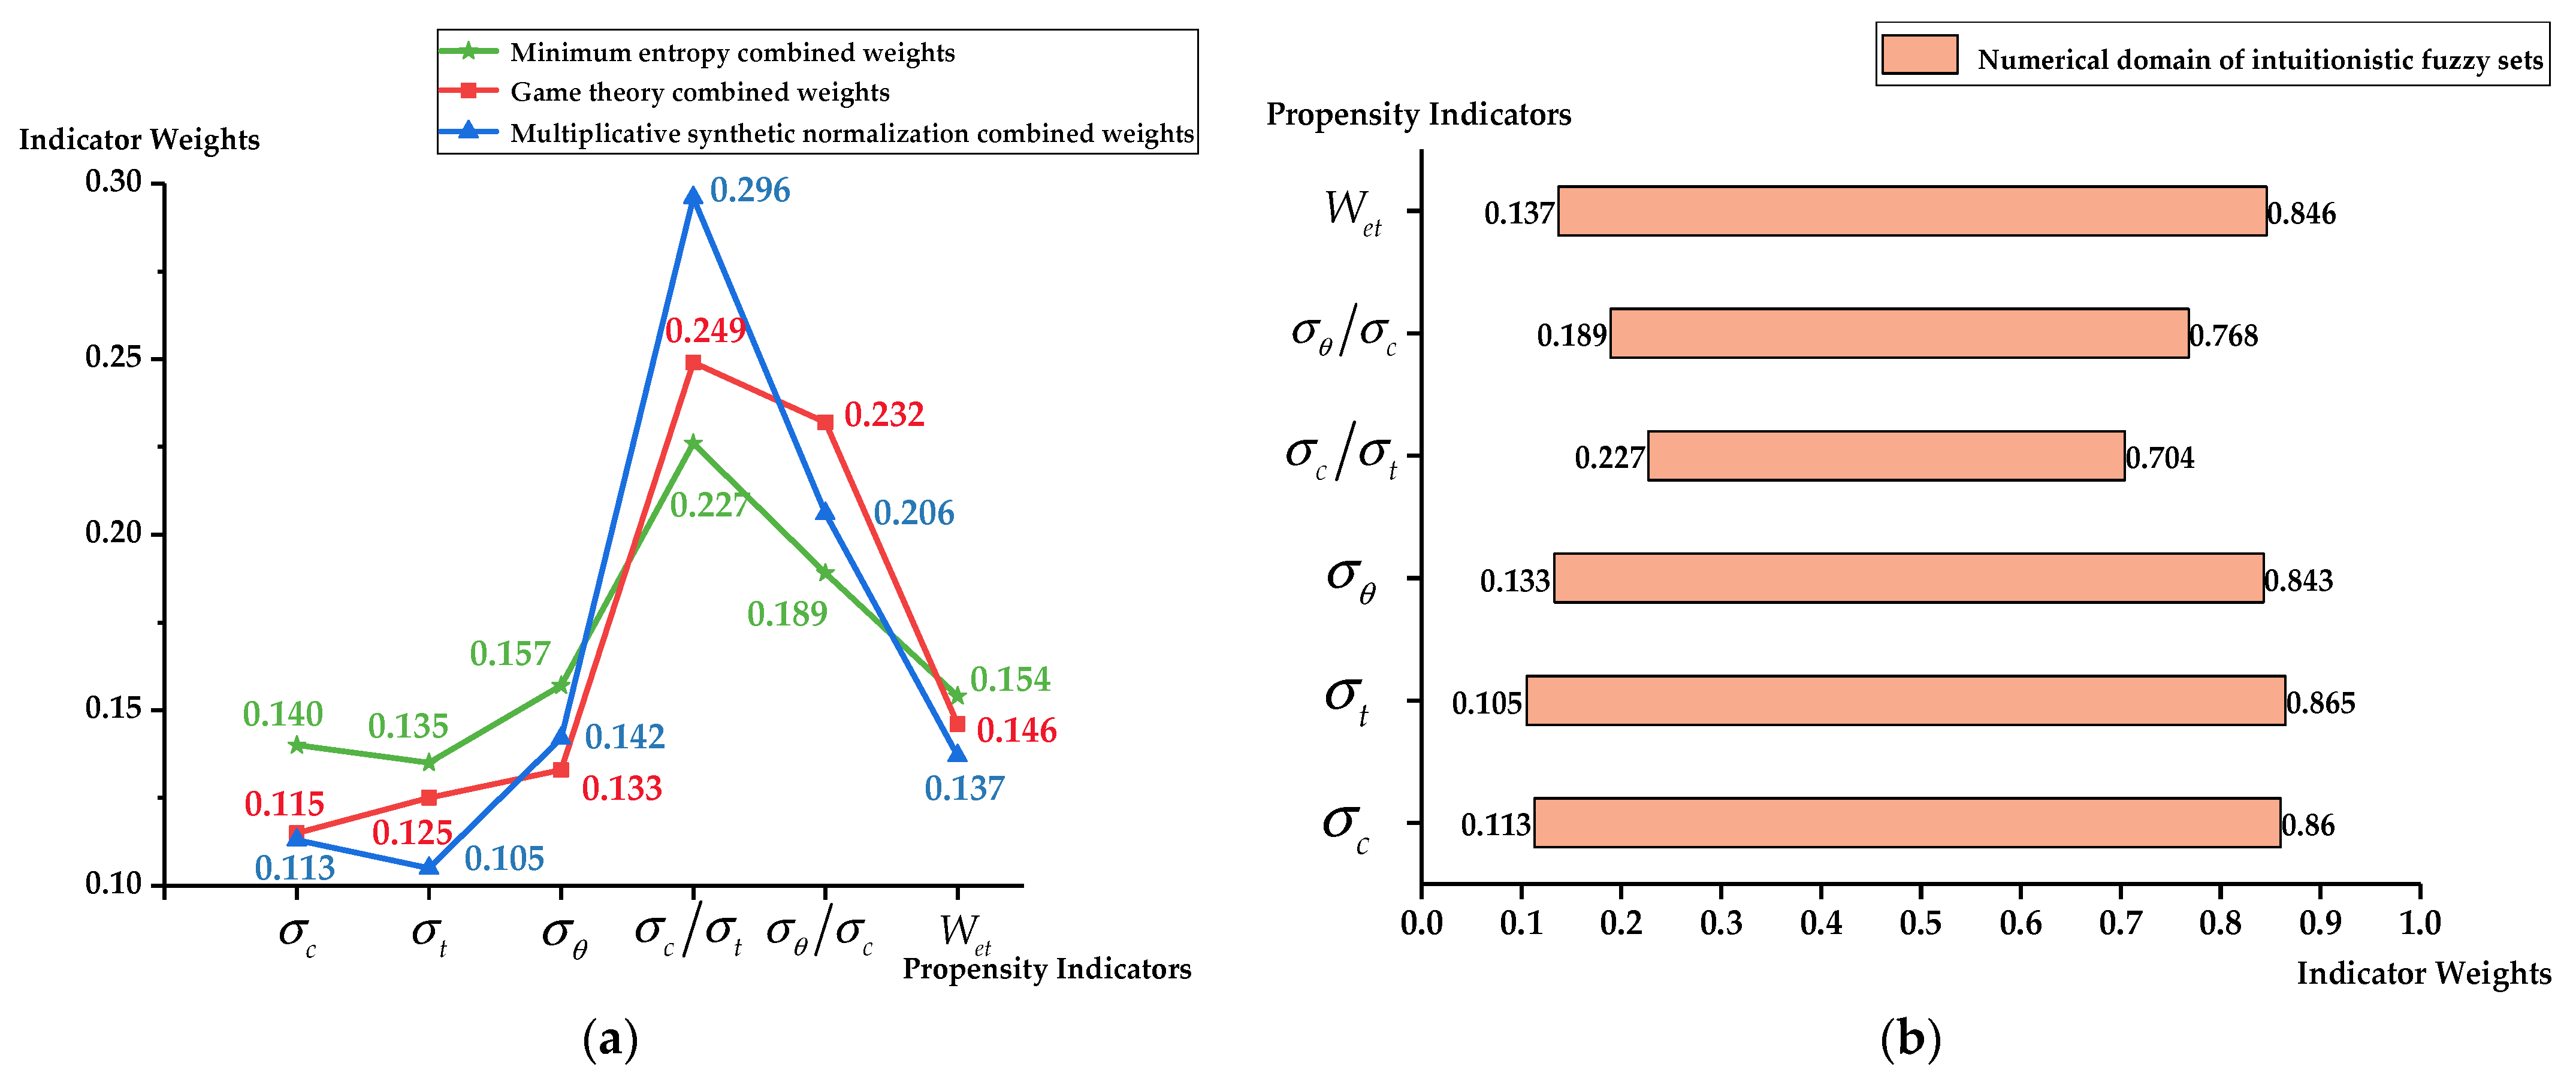
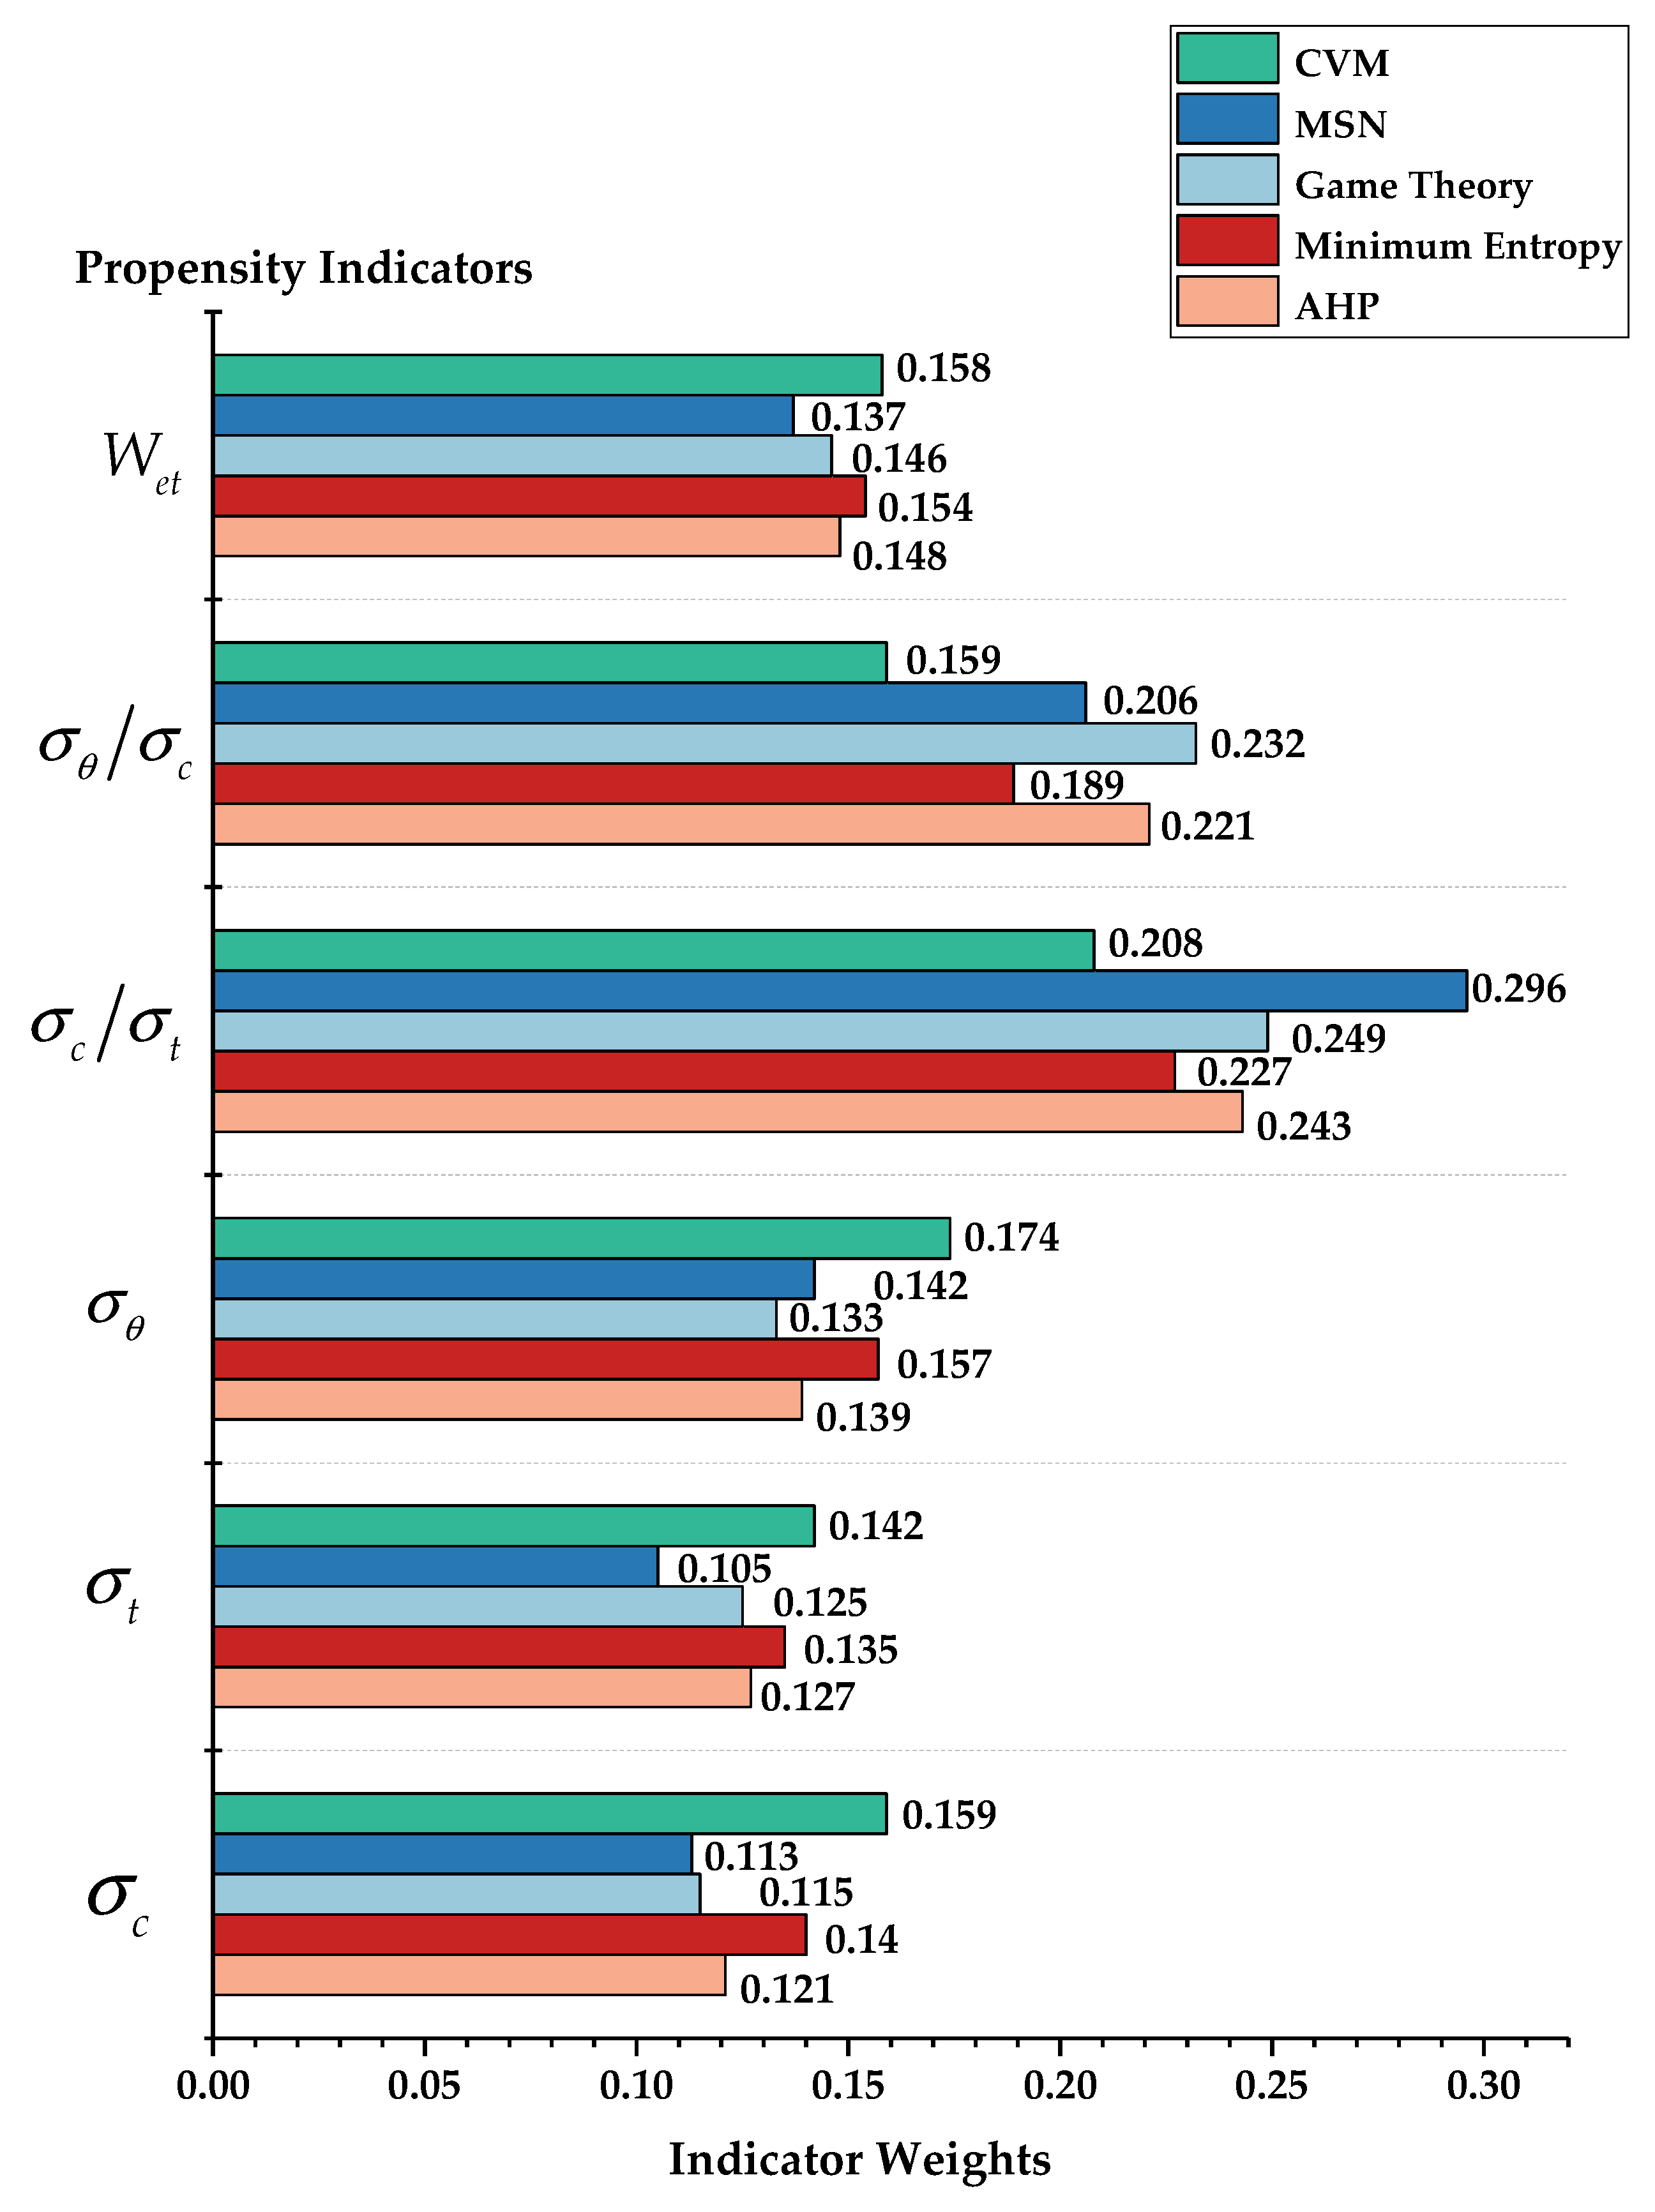
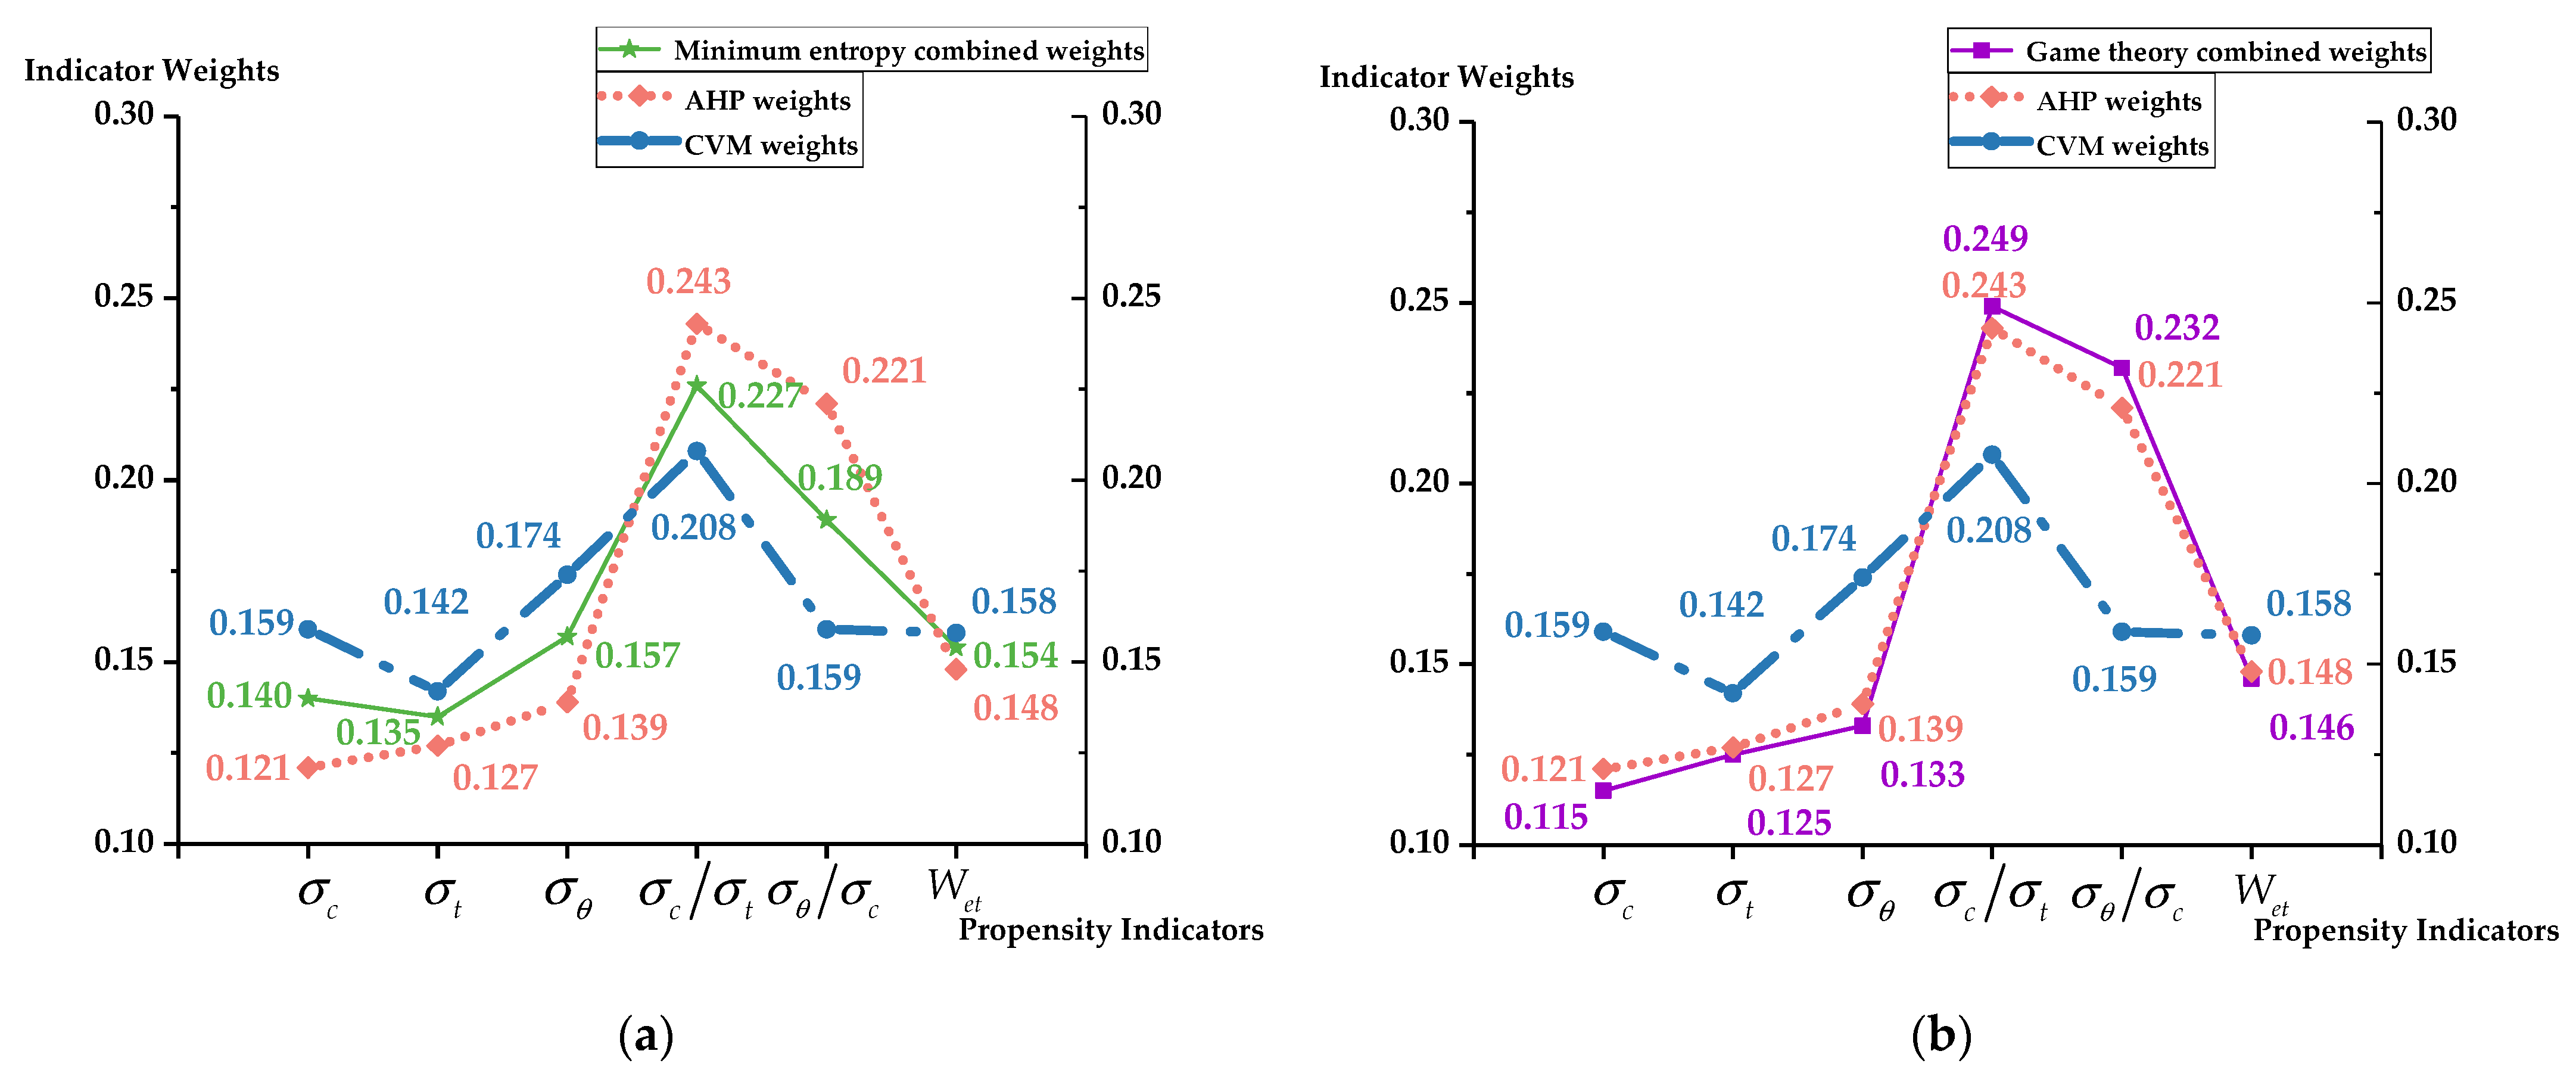
4.3.2. Analysis of the Weights of Indicators
Analyzing Table 3, Table 4 and Table 5 and Figure 2, it can be found that the values of rockburst propensity indicators obtained through different weighting methods have large differences in the distribution, so it is necessary to further deepen the study of the rationality of the indicators by drawing the value distribution of multisource combined weights and the comparison chart as shown in Figure 4 and Figure 5:
Figure 4.
Distribution of indicator weights.
Figure 5.
Trends in indicator values. (a) Trends in combined weights of minimum entropy; (b) trends in combined weights of game theory.
(1) The principles of the subjective weighting method and the objective weighting method are not the same, which leads to a significant difference in the values of the indicators. In the model calculation, if a single weighting method is used, the prediction results will have a large bias. Compared with the single-weight method, the combined weighing method is more reasonable and can balance the subjective and objective weights, thus making the indicator weights numerically more average and reasonable;
(2) Due to the differences in the weighting mechanism and the adopted algorithm, different combined weighting methods will have different focuses. As can be seen from Figure 4 and Figure 5, under the conditions of the indicators in this paper, the game theory combined weights are numerically closer to the AHP method weights, while the minimum entropy combined weights are closer to the CVM weights, which can be deduced from the fact that even though it is the combined weighting method, only one method cannot comprehensively reflect the real situation of the indicators;
(3) Using the intuitionistic fuzzy set method to defuzzify the multisource combined weights, the indicator weights are generalized from specific numbers to a range of numerical intervals, which combines the advantages of the three combined weighting methods and expands the numerical domain of the model’s prediction results. From the results, the indicator vagueness is controlled to a certain extent, and the prediction results of the model in this paper are better than those of the other combined weights models listed.
5. Conclusions
The conclusions are as follows:
(1) Using the intuitionistic fuzzy set–attribute measure model for predicting the propensity of rockburst, the vagueness of the indicator data is transformed into the intervalisation of the numerical domain, which controls the uncertainty of the prediction results to a certain extent; through calculating the “degree of measurement” between the case data and attribute classification set, it makes the evaluation of the scheme and the classification evaluation become a unified whole. The Euclidean distance method is used to improve the attribute identification of the model, and it is based on the perspective of the “distance” between the values of composite attribute measure and the attribute classification set, which avoids the influence of the objectivity that is affected by the artificial parameter setting, and the accuracy of attribute identification in the model is improved;
(2) Through the study of rockburst cases and mechanisms, from the perspective of rock mechanics, six indicators were selected to characterize the propensity of rockbursts: the uniaxial compressive strength , tensile stress , shear stress , compression/tension ratio , shear/compression ratio , and elastic deformation coefficient . Based on the selected indicators of the rock burst propensity, the attribute classification set and range of the numerical domains for the corresponding classification are determined so that the indicators are internalized as the basis of the model and the standard of the calculations;
(3) Based on the subjective weights of AHP and objective weights of CVM, the multisource system for combined weights for rockburst propensity indicators is constructed with minimum entropy combined weights, game theory combined weights, and multiplicative synthetic normalization combined weights, and with the help of intuitionistic fuzzy sets, the single-valued indicators are transformed into interval values, which further transforms the vagueness while expanding the range of reasonable numerical domains for the indicators, taking into account and balancing the experts’ experience and data information of the rock burst indicators;
(4) Selecting 30 sets of typical rockburst cases in the world, the prediction results for rockburst propensity of the intuitionistic fuzzy set–multisource combined weights-attribute measure model are compared with those of the other three single combined weighting methods with the attribute measure model, and it is verified that the model proposed in this paper is better than the other three models in improving the accuracy and controlling the vagueness of the indicators.
Author Contributions
Conceptualization, J.C.; methodology, Y.Z.; data curation, J.C. and Y.Z.; formal analysis, Y.Z. and S.Y.; validation, J.C. and Z.Z.; resources, J.C. and Z.Z.; writing—original draft preparation, Y.Z. and Z.L.; writing—review and editing, Y.Z. and Z.L.; project administration, Z.Z. and J.C. All authors have read and agreed to the published version of the manuscript.
Funding
This research was funded by the National Natural Science Foundation Project of China under Grant No. 52274163.
Institutional Review Board Statement
Not applicable.
Informed Consent Statement
Not applicable.
Data Availability Statement
Data are contained within the article.
Acknowledgments
The authors would like to express their thanks to the National Natural Science Foundation.
Conflicts of Interest
The authors declare no conflict of interest.
References
- Xue, Y.; Li, Z.; Li, S.; Qiu, D.; Tao, Y.; Wang, L.; Yang, W.; Zhang, K. Prediction of rock burst in underground caverns based on rough set and extensible comprehensive evaluation. Bull. Eng. Geol. Environ. 2019, 78, 417–429. [Google Scholar] [CrossRef]
- Zhao, W.; Qin, C.; Xiao, Z.; Chen, W. Characteristics and contributing factors of major coal bursts in longwall mines. Energy Sci. Eng. 2022, 10, 1314–1327. [Google Scholar] [CrossRef]
- Wang, Y.; Xu, Q.; Chai, H.; Liu, L.; Xia, Y.; Wang, X. Rock burst prediction in deep shaft based on RBF-AR model. J. Jilin Univ. 2013, 43, 1943–1949. (In Chinese) [Google Scholar] [CrossRef]
- Xue, Y.; Bai, C.; Qiu, D.; Kong, F.; Li, Z. Predicting rockburst with database using particle swarm optimization and extreme learning machine. Tunn. Undergr. Space Technol. 2020, 98, 103287. [Google Scholar] [CrossRef]
- Liu, Z.X.; Han, K.W.; Yang, S.; Liu, Y.X. Fractal evolution mechanism of rock fracture in undersea metal mining. J. Cent. South Univ. 2020, 27, 1320–1333. [Google Scholar] [CrossRef]
- Zhou, J.; Li, X.; Mitri, H.S. Classification of rockburst in underground projects: Comparison of ten supervised learning methods. J. Comput. Civ. Eng. 2016, 30, 04016003. [Google Scholar] [CrossRef]
- Feng, G.L.; Feng, X.T.; Xiao, Y.X.; Yao, Z.B.; Hu, L.; Niu, W.J.; Li, T. Characteristic microseismicity during the development process of intermittent rockburst in a deep railway tunnel. Int. J. Rock Mech. Min. Sci. 2019, 124, 104135. [Google Scholar] [CrossRef]
- Yang, Z.G.; Wang, P.F. Reinforced support of drift with rockburst in deep mine. Nonferrous Met. 2017, 69, 91–94. (In Chinese) [Google Scholar]
- Gong, F.Q.; Pan, J.F.; Jiang, Q. The difference analysis of rock burst and coal burst and key mechanisms of deep engineering geological hazards. J. Eng. Geol. 2021, 29, 933–961. (In Chinese) [Google Scholar]
- Lee, S.M.; Park, B.S.; Lee, S.W. Analysis of rockbursts that have occurred in a waterway tunnel in Korea. Int. J. Rock Mech. Min. Sci. 2004, 41 (Suppl. 1), 911–916. [Google Scholar] [CrossRef]
- Liu, C.L. Microearthquake acrivity associated with underground coal-mining in Buchanan County, Virginia, U.S.A. Recent Dev. World Seismol. 1995, 10, 33. [Google Scholar]
- Ma, S.; Wang, L.; Zhang, M.; Li, G. Study on Blasting Hazard in Canada. Chin. J. Geol. Hazard Control. 1998, 3, 107–112. [Google Scholar]
- Yang, B.; He, M.; Zhang, Z.; Zhu, J.; Chen, Y. A New Criterion of Strain Rockburst in Consideration of the Plastic Zone of Tunnel Surrounding Rock. Rock Mech. Rock Eng. 2022, 55, 1777–1789. [Google Scholar] [CrossRef]
- Gong, F.; Wang, Y.; Luo, S. Rockburst proneness criteria for rock materials: Review and new insights. J. Cent. South Univ. Technol. 2020, 27, 2793–2821. [Google Scholar] [CrossRef]
- Ouyang, L.; Zhang, R.-J.; Liu, Y.-R.; Huang, Q.-S.; Li, J.-H.; Pang, Z.-Y. Review on Rockburst Prevention Techniques and Typical Applications in Deep Tunnels. J. Yangtze River Sci. Res. Inst. 2022, 39, 161. (In Chinese) [Google Scholar]
- Cai, W.; Bai, X.; Si, G.; Cao, W.; Gong, S.; Dou, L. A Monitoring Investigation into Rock Burst Mechanism Based on the Coupled Theory of Static and Dynamic Stresses. Rock Mech. Rock Eng. 2020, 53, 5451–5471. [Google Scholar] [CrossRef]
- Cook, N.G.W.; Hoek, E.; Pretorius, J.P.; Ortlepp, W.D.; Salamon, M.D.G. Rock mechanics applied to study of rockbursts. J. S. Afr. Inst. Min. Metall. 1966, 66, 436. [Google Scholar]
- Wang, Y.H.; Li, W.D.; Li, Q.G.; Xu, Y.; Tan, G.H. Method of fuzzy comprehensive evaluations for rockburst prediction. J. Rock Mech. Eng. 1998, 5, 15–23. (In Chinese) [Google Scholar]
- Turchaninov, I.A.; Markov, G.A.; Gzovsky, M.V.; Kazikayev, D.M.; Frenze, U.K.; Batugin, S.A.; Chabdarova, U.I. State of stress in the upper part of the Earth’s crust based on direct measurements in mines and on tectonophysical and seismological studies. Phys. Earth Planet. Inter. 1972, 6, 229–234. [Google Scholar] [CrossRef]
- Zhu, H.H.; Zhang, Q.; Zhang, L.Y. Review of research progresses and applications of Hoek-Brown strength criterion. Chin. J. Rock Mech. Eng. 2013, 32, 1945–1963. (In Chinese) [Google Scholar]
- Kidybiński, A. Bursting liability indices of coal. Int. J. Rock Mech. Min. Sci. Geomech. Abstr. 1981, 18, 295–304. [Google Scholar] [CrossRef]
- Zhao, Y.; Chen, J.; Yang, S.; Liu, Z. Game Theory and an Improved Maximum Entropy-Attribute Measure Interval Model for Predicting Rockburst Intensity. Mathematics 2022, 10, 2551. [Google Scholar] [CrossRef]
- Chen, X.; Sun, J.; Zhang, J.; Chen, Q. Judgment indexes and classification criteria of rock-burst with the extension judgment method. China Civ. Eng. J. 2009, 42, 82–88. (In Chinese) [Google Scholar]
- Lu, A.; Mao, X.; Liu, H. Physical simulation of rock burst induced by stress waves. J. China Univ. Min. Technol. 2008, 18, 401–405. [Google Scholar] [CrossRef]
- Fakhimi, A.; Hosseini, O.; Theodore, R. Physical and numerical study of strain burst of mine pillars. Comput. Geotech. 2016, 74, 36–44. [Google Scholar] [CrossRef]
- Zhang, L.W.; Zhang, D.Y.; Qiu, D.H. Application of extension evaluation method in rockburst prediction based on rough set theory. J. China Coal Soc. 2010, 35, 1461–1465. (In Chinese) [Google Scholar] [CrossRef]
- Zhou, J.; Chen, C.; Du, K.; Jahed Armaghani, D.; Li, C. A new hybrid model of information entropy and unascertained measurement with different membership functions for evaluating destressability in burst-prone underground mines. Eng. Comput. 2022, 38 (Suppl. 1), 381–399. [Google Scholar] [CrossRef]
- Liu, Z.; Shao, J.; Xu, W.; Meng, Y. Prediction of rock burst classification using the technique of cloud models with attribution weight. Nat. Hazards 2013, 68, 549–568. [Google Scholar] [CrossRef]
- Yin, X.; Liu, Q.; Wang, X.; Huang, X. Prediction model of rockburst intensity classification based on combined weighting and attribute interval recognition theory. J. China Coal Soc. 2020, 45, 3772–3780. (In Chinese) [Google Scholar] [CrossRef]
- Zhou, H.; Liao, X.; Chen, S.; Feng, T.; Wang, Z. Rockburst Risk Assessment of Deep Lying Tunnels Based on Combination Weight and Unascertained Measure Theory: A Case Study of Sangzhuling Tunnel on Sichuan-Tibet Traffic Corridor. Earth Sci. 2022, 47, 2130–2148. [Google Scholar] [CrossRef]
- Hu, X.; Huang, L.; Chen, J.; Li, X.; Zhang, H. Rockburst prediction based on optimization of unascertained measure theory with normal cloud. Complex Intell. Syst. 2023. [Google Scholar] [CrossRef]
- Li, P.X.; Cheng, B.R.; Zhou, Y.Y. Research progress of rockburst prediction and early warning in hard rock underground engineering. J. China Coal Soc. 2019, 44, 447–465. (In Chinese) [Google Scholar]
- Kai, Z.; Ke, Z.; Kun, L.I. Prediction model of rockburst grade based on PCA-neural network. China Saf. Sci. J. 2021, 31, 96. (In Chinese) [Google Scholar]
- Chen, D.F.; Feng, X.T.; Yang, C.X.; Chen, B.R.; Qiu, S.L.; Xu, D.P. Neural network estimation of rockburst damage severity based on engineering cases. In Proceedings of the ISRM SINOROCK, ISRM, Shanghai, China, 18–20 June 2013. [Google Scholar]
- Yang, X.B.; Pei, Y.Y.; Cheng, H.M.; Hou, X.; Lu, J. Prediction method of rockburst intensity grade based on SOFM neural network model. Chin. J. Rock Mech. Eng. 2021, 40, 2708–2715. (In Chinese) [Google Scholar]
- e Sousa, L.R.; Miranda, T.; e Sousa, R.L.; Tinoco, J. The use of data mining techniques in rockburst risk assessment. Engineering 2017, 3, 552–558. [Google Scholar] [CrossRef]
- Li, T.; Ma, C.; Zhu, M.; Meng, L.; Chen, G. Geomechanical types and mechanical analyses of rockbursts. Eng. Geol. 2017, 222, 72–83. [Google Scholar] [CrossRef]
- Zhou, J.; Li, X.; Shi, X. Long-term prediction model of rockburst in underground openings using heuristic algorithms and support vector machines. Saf. Sci. 2012, 50, 629–644. [Google Scholar] [CrossRef]
- Zhou, J.; Li, X.; Mitri, H.S. Evaluation method of rockburst: State-of-the-art literature review. Tunn. Undergr. Space Technol. 2018, 81, 632–659. [Google Scholar] [CrossRef]
- Tran, Q.-H.; Bui, X.-N.; Nguyen, H. Classifying rockburst in deep underground mines using a robust hybrid computational model based on gene expression programming and particle swarm optimization. J. Civ. Environ. Eng. 2023, 45, 21–38. [Google Scholar] [CrossRef]
- Shirani Faradonbeh, R.; Taheri, A. Long-term prediction of rockburst hazard in deep underground openings using three robust data mining techniques. Eng. Comput. 2019, 35, 659–675. [Google Scholar] [CrossRef]
- Chen, S.; Wu, A.; Wang, Y.; Xu, M. Prediction of rockburst intensity based on decision tree model. J. Wuhan Univ. Sci. Technol. 2016, 39, 195–199. [Google Scholar]
- Atanassov, K.T. Intuitionistic Fuzzy Sets, VII ITKR Session, Sofia, 20-23 June 1983 (Deposed in Centr. Sci.-Techn. Library of the Bulg. Acad. of Sci., 1697/84) (in Bulgarian). Int. J. Bioautom. 2016, 20, S1–S6. [Google Scholar]
- Atanassov, K.T. Intuitionistic Fuzzy Sets. In Intuitionistic Fuzzy Sets. Studies in Fuzziness and Soft Computing; Physica: Heidelberg, Germany, 1999; Volume 35. [Google Scholar] [CrossRef]
- Hussain, A.; Mahmood, T.; Smarandache, F.; Ashraf, S. TOPSIS approach for MCGDM based on intuitionistic fuzzy rough Dombi aggregation operations. Comput. Appl. Math. 2023, 42, 176. [Google Scholar] [CrossRef]
- Li, Y.; Li, T.; Zhao, Q. Remote sensing image intuitionistic fuzzy set segmentation method. Acta Geod. Cartogr. Sin. 2023, 52, 405. (In Chinese) [Google Scholar]
- Wu, S.; Zhou, Z.; Chen, J.; Zheng, R. Evaluation of rock mass quality based on intuitionistic fuzzy set TOPSIS in open-pit mine. J. Cent. South Univ. (Sci. Technol.) 2016, 47, 2463–2468. (In Chinese) [Google Scholar]
- Li, T. Based on Intuitionistic Fuzzy Sets Research on Segmentation Algorithm of Remote Sensing Image. Master’s Thesis, Liaoning Technical University, Fuxin, China, 2022. (In Chinese). [Google Scholar] [CrossRef]
- Xu, Z.; Cai, N.; Li, X.; Xian, M.; Dong, T. Risk assessment of loess tunnel collapse during construction based on an attribute recognition model. Bull. Eng. Geol. Environ. 2021, 80, 6205–6220. [Google Scholar] [CrossRef]
- Zhou, Z.; Zhang, K.; Zhang, H.; Chen, S.; Gan, H. Risk assessment of surface subsidence in karst tunnels under attribute recognition theory. China Saf. Sci. J. 2022, 32, 105. (In Chinese) [Google Scholar]
- Wang, L.; Pei, A.; Peng, P. Attribute Synthetic Evaluation Model for Rockburst Disaster Prediction in Underground Engineering. Sci. Technol. Rev. 2014, 32, 22–26. [Google Scholar]
- Wu, S.; Yang, S.; Huo, L. Prediction of rock burst intensity based on unascertained measure-intuitionistic fuzzy set. Chin. J. Rock Mech. Eng. 2020, 39, 2930–2939. (In Chinese) [Google Scholar]
- Saaty, T.L.; Kearns, K.P. The analytic hierarchy process. In Analytical Planning: The Organization of System; Pergamon Press: Oxford, UK, 1985. [Google Scholar]
- Naddeo, V.; Belgiorno, V.; Zarra, T.; Scannapieco, D. Dynamic and embedded evaluation procedure for strategic environmental assessment. Land Use Policy 2012, 31, 605–612. [Google Scholar] [CrossRef]
- Li, Z.; Xiang, J.; Sheng, T.; Xiao, B. G1-variation-coefficient-KL based TOPSIS radar jamming effectiveness evaluation. J. Beijing Univ. Aeron Astron. 2021, 47, 2571–2578. (In Chinese) [Google Scholar]
- Li, Y.; Li, F.; Wang, S.; Shang, Q. Credit Evaluation of Electricity Sales Companies Based on Improved Coefficient of Variation Method and BP Neural Network. Power Syst. Technol. 2022, 46, 4228–4237. [Google Scholar] [CrossRef]
- Cao, M.; Fang, Q.-C. Research on green degree evaluation model of prefabricated buildings based on combination weighting and attribute recognition model. J. Saf. Environ. 2022, 22, 2166–2175. (In Chinese) [Google Scholar] [CrossRef]
- Feng, L.-H.; Li, F.-Q. Analysis of Disaster Loss Based on Maximum Entropy Principle. J. Math. Pract. Theory 2005, 8, 73–77. [Google Scholar]
- Zhao, R.; Neighbour, G.; McGuire, M.; Deutz, P. A software based simulation for cleaner production: A game between manufacturers and government. J. Loss Prev. Process Ind. 2013, 26, 59–67. [Google Scholar] [CrossRef]
- Wang, S.; Fei, L.; Lei, Y.; Tian, W. Two Kinds of Comprehensive Weight Combination Method Applied to Irrigation District’s Evaluation. J. Xi’an Univ. Technol. 2009, 25, 207–211. (In Chinese) [Google Scholar] [CrossRef]
- Li, K.G.; Li, M.L.; Qin, Q.C. Research on evaluation method of rock burst tendency based on improved comprehensive weighting. Chin. J. Rock Mech. Eng. 2020, 39, 2751–2762. (In Chinese) [Google Scholar]
- Duan, S.; Xu, X. Discussion of problems in calculation and application of rock mass integrity coefficient. J. Eng. Geol. 2013, 21, 548–553. (In Chinese) [Google Scholar]
Disclaimer/Publisher’s Note: The statements, opinions and data contained in all publications are solely those of the individual author(s) and contributor(s) and not of MDPI and/or the editor(s). MDPI and/or the editor(s) disclaim responsibility for any injury to people or property resulting from any ideas, methods, instructions or products referred to in the content. |
© 2023 by the authors. Licensee MDPI, Basel, Switzerland. This article is an open access article distributed under the terms and conditions of the Creative Commons Attribution (CC BY) license (https://creativecommons.org/licenses/by/4.0/).