
S3D: Squeeze and Excitation 3D Convolutional Neural Networks for a Fall Detection System


Abstract
:1. Introduction
- This is the first study on FDSs in which an SE block is combined with a 3D CNN. The S3D-based FDS proposed in this study showed a higher detection performance than the state-of-the-art methods on open datasets with various resolutions.
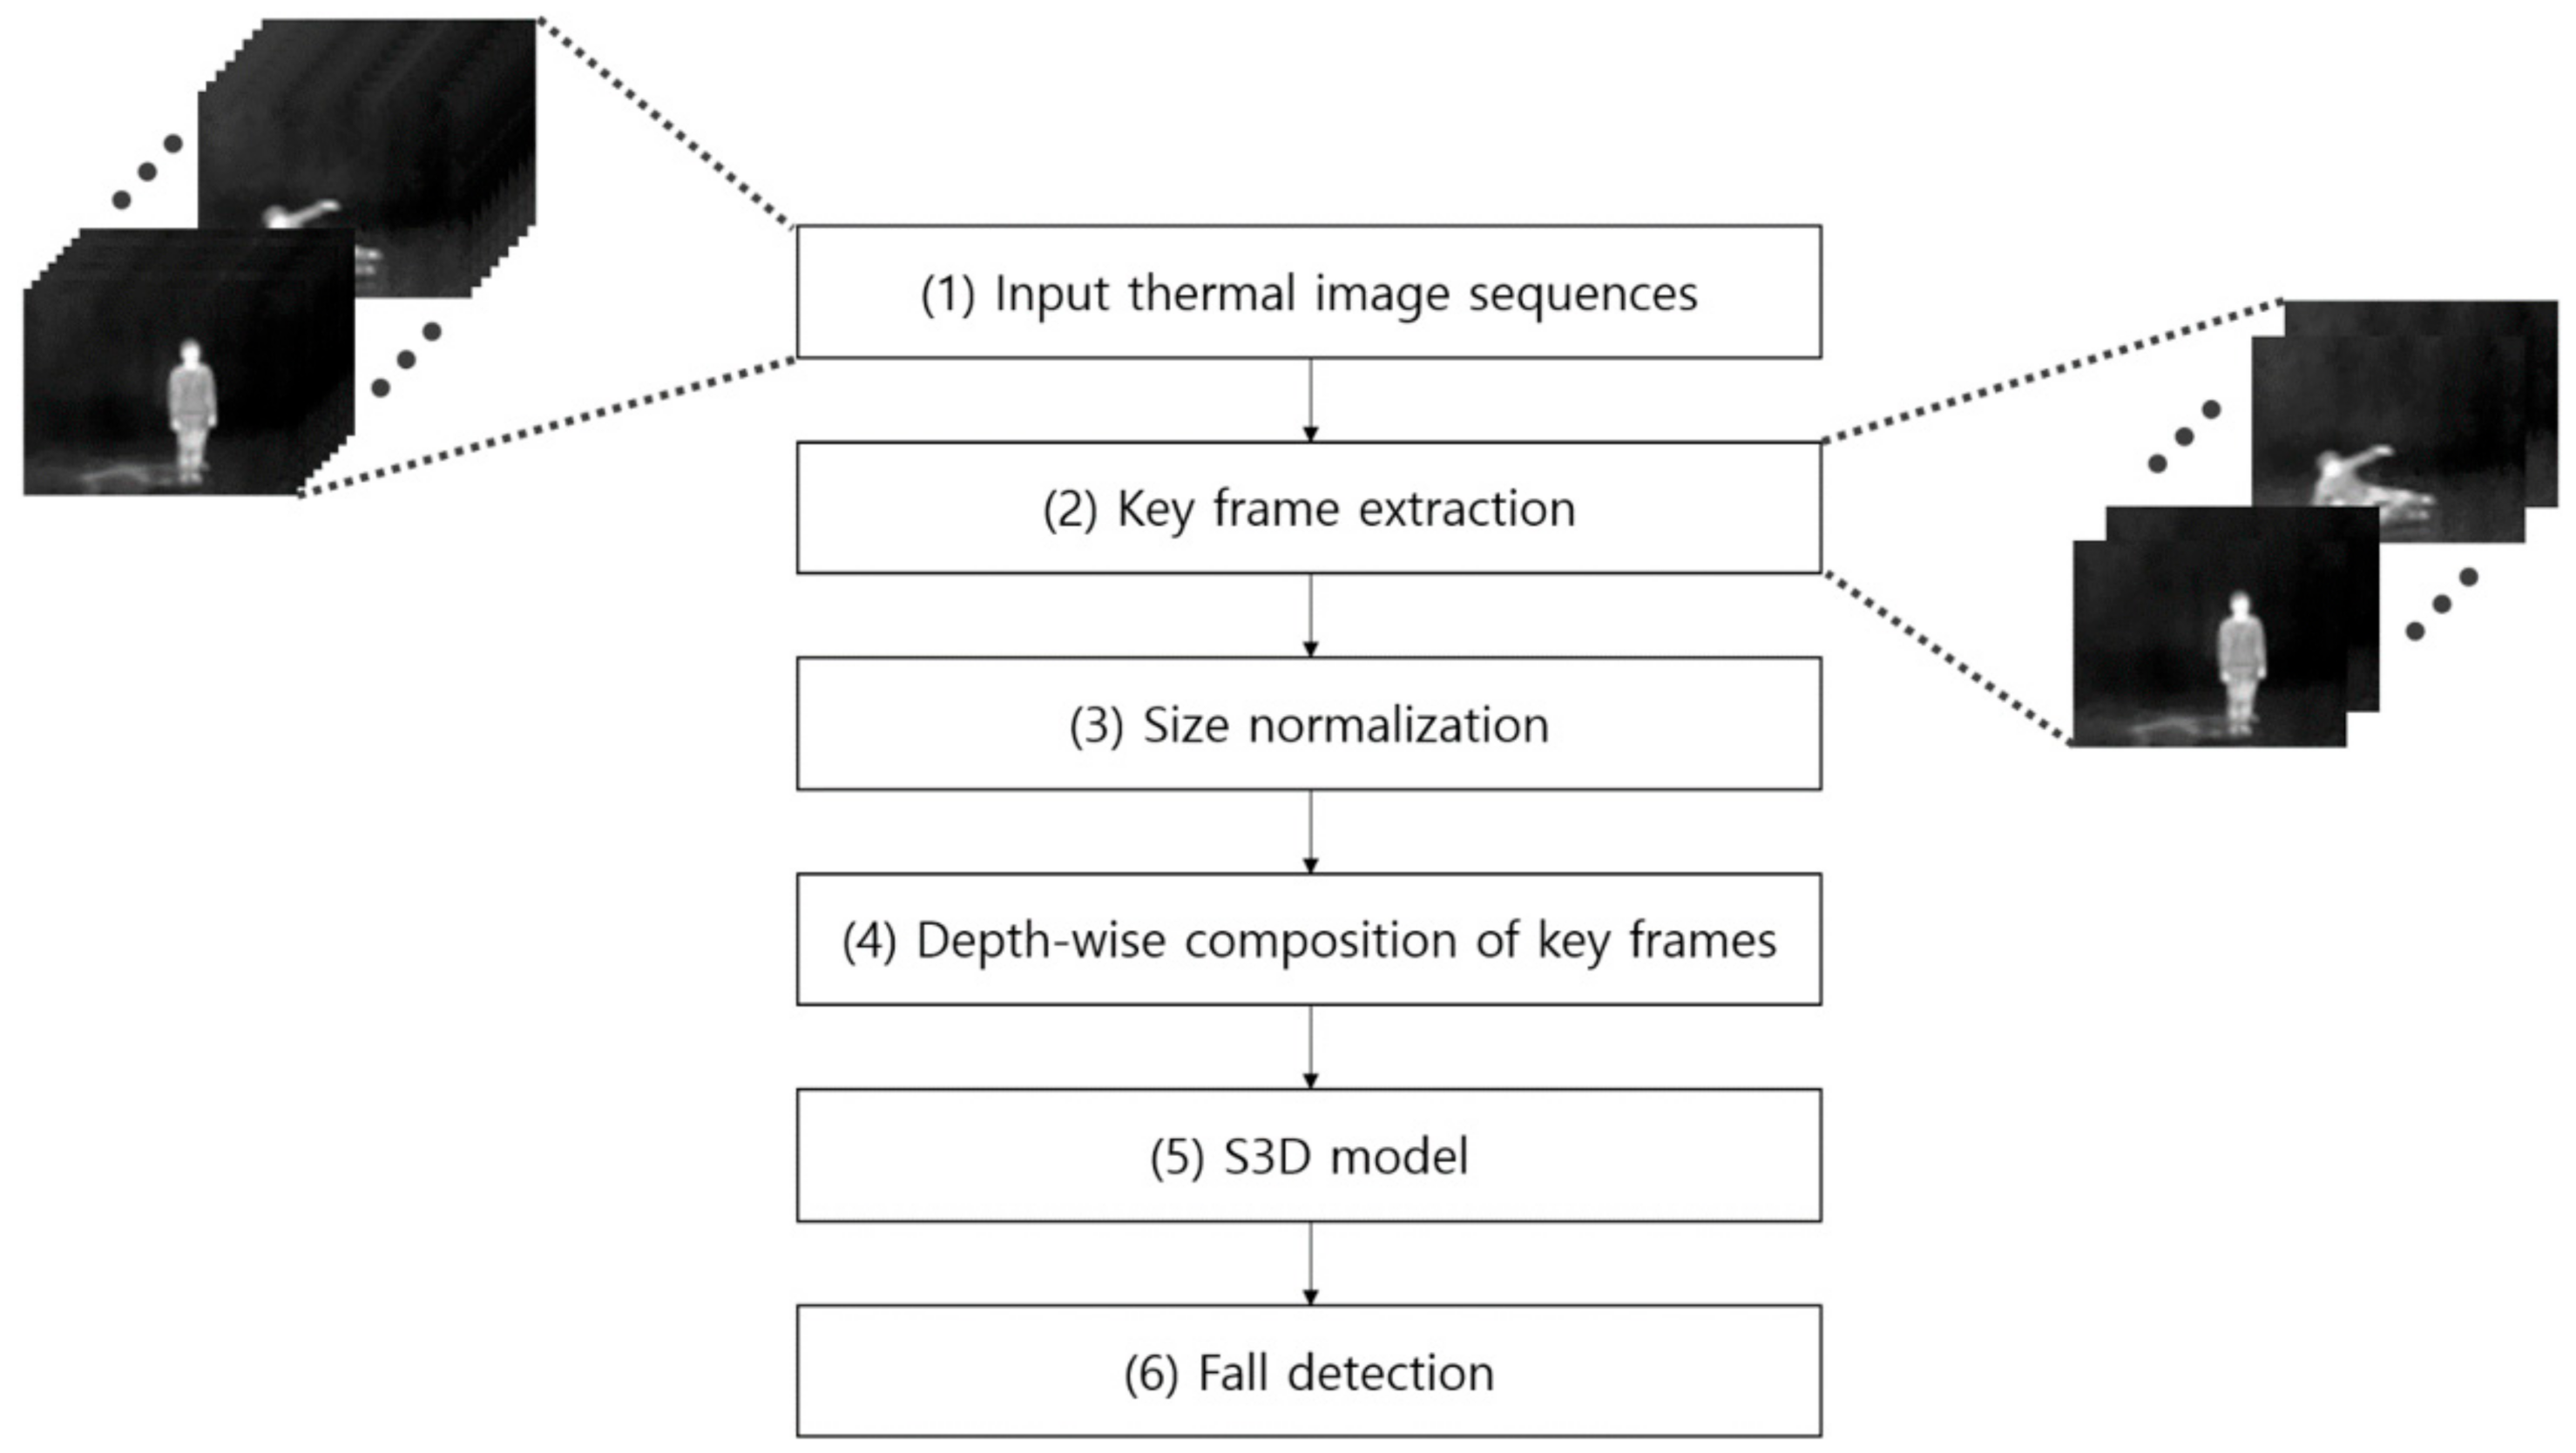
- Fall detection was carried out by extracting the keyframes from the input thermal video using the magnitudes of the optical flow vectors and using the extracted keyframes as the input of the S3D.
- The SE block previously used only in a 2-dimensional (2D) CNN was newly transformed to be suitable for a 3D CNN and applied. Furthermore, the effect of the SE block location in the 3D CNN model on the network was analyzed through gradient-weighted class activation mapping (Grad-CAM), and it demonstrated where the SE block should be located and how many SE blocks should be used to obtain the best performance.
- For other researchers to compare and evaluate its performance, the S3D model used in this study is made public through [7].
2. Related Works
2.1. Wearable Device-Based Methods
2.1.1. Accelerometer-Based
2.1.2. Fusing Accelerometer and Gyroscope-Based
2.2. Ambient Device-Based Methods
2.2.1. Radar-Based
2.2.2. Ultrasonic-Based
2.3. Vision-Based Methods
2.3.1. Visible Light Camera-Based
2.3.2. Depth Camera-Based
2.3.3. Thermal Camera-Based
3. Proposed Method
3.1. Overview of the Proposed Architecture
3.2. Keyframe Extraction and Depth-Wise Composition of Extracted Keyframes
3.3. Structure of the Proposed S3D Model
3.4. Differences between the Proposed S3D and Previous Methods
- In the study [35] that proposes the SE block, the feature recalibration was carried out considering only spatial dimensions (height × width), as it was only focused on the 2D feature map. However, in this study, the feature recalibration was conducted considering the spatiotemporal dimensions (depth × height × width), as it is focused on the 3D feature map.
- In the study [5] that proposes the C3D, frames in several sections were uniformly selected and used as the model input; thus, the model was repeatedly utilized in the inference process. However, in this study, the model was used only once in the inference process by selecting only keyframes and using them as the model input. Moreover, by adding the SE block into the structure of the C3D model, the S3D model that considers the information of the more important channel was newly proposed in this study.
- In the study [24], the 3D CNN-based fall detection was performed. However, in this study, a suitable structure of the 3D CNN model for an FDS was sought by utilizing the SE block, and the S3D model-based FDS that is robust to environmental changes was newly proposed.
4. Experiments
4.1. Datasets and Experimental Environments
4.2. Training
4.3. Experimental Results
4.3.1. TSF Dataset
Ablation Studies
Comparisons with State-of-the-Art Methods
4.3.2. TCL Dataset
Ablation Studies
Comparisons with State-of-the-Art Methods
4.3.3. eHomeSenior Dataset
Ablation Studies
Comparisons with State-of-the-Art Methods
4.3.4. Comparative Processing Complexities of the Proposed Method and the State-of-the-Art Methods
4.4. Discussion
5. Conclusions
Author Contributions
Funding
Institutional Review Board Statement
Informed Consent Statement
Data Availability Statement
Conflicts of Interest
References
- World Health Organization. WHO Global Report on Falls Prevention in Older Age. Available online: https://www.who.int/ageing/publications/Falls_prevention7March.pdf (accessed on 26 August 2021).
- Fleming, J.; Brayne, C. Inability to get up after falling, subsequent time on floor, and summoning help: Prospective cohort study in people over 90. BMJ 2008, 337, a2227. [Google Scholar] [CrossRef] [PubMed] [Green Version]
- Wang, Z.; Ramamoorthy, V.; Gal, U.; Guez, A. Possible life saver: A review on human fall detection technology. Robotics 2020, 9, 55. [Google Scholar] [CrossRef]
- Hayashida, A.; Moshnyaga, V.; Hashimoto, K. The use of thermal IR array sensor for indoor fall detection. In Proceedings of the IEEE International Conference on Systems, Man, and Cybernetics, Banff, AB, Canada, 5–8 October 2017; pp. 594–599. [Google Scholar]
- Tran, D.; Bourdev, L.; Fergus, R.; Torresani, L.; Paluri, M. Learning spatiotemporal features with 3D convolutional networks. In Proceedings of the IEEE International Conference on Computer Vision, Santiago, Chile, 7–13 December 2015; pp. 4489–4497. [Google Scholar]
- Feichtenhofer, C.; Fan, H.; Malik, J.; He, K. Slowfast networks for video recognition. In Proceedings of the IEEE International Conference on Computer Vision, Seoul, Korea, 27 October–2 November 2019; pp. 6202–6211. [Google Scholar]
- S3D. Available online: https://github.com/baek2sm/S3D (accessed on 26 August 2021).
- Kostopoulos, P.; Nunes, T.; Salvi, K.; Deriaz, M.; Torrent, J. Increased fall detection accuracy in an accelerometer-based algorithm considering residual movement. In Proceedings of the International Conference on Pattern Recognition Applications and Methods, Lisbon, Portugal, 10–13 January 2015; Volume 2, pp. 30–36. [Google Scholar]
- Aguiar, B.; Rocha, T.; Silva, J.; Sousa, I. Accelerometer-based fall detection for smartphones. In Proceedings of the IEEE International Symposium on Medical Measurements and Applications, Lisbon, Portugal, 11–12 June 2014; pp. 1–6. [Google Scholar]
- Rakhman, A.Z.; Nugroho, L.E. Fall detection system using accelerometer and gyroscope based on smartphone. In Proceedings of the 1st International Conference on Information Technology, Computer, and Electrical Engineering, Semarang, Indonesia, 7–8 November 2014; pp. 99–104. [Google Scholar]
- Torres, G.G.; Henriques, R.V.B.; Pereira, C.E.; Müller, I. An EnOcean wearable device with fall detection algorithm integrated with a smart home system. Int. Fed. Autom. Control 2018, 51, 9–14. [Google Scholar] [CrossRef]
- Pourbemany, J.; Zhu, Y.; Bettati, R. Breath to Pair (B2P): Respiration-based pairing protocol for wearable devices. arXiv 2021, arXiv:2107.11677. [Google Scholar]
- Pourbemany, J.; Zhu, Y.; Bettati, R. A survey of wearable devices pairing based on biometric signals. arXiv 2021, arXiv:2107.11685. [Google Scholar]
- Jokanović, B.; Amin, M. Fall detection using deep learning in range-doppler radars. IEEE Trans. Aerosp. Electron. Syst. 2017, 54, 180–189. [Google Scholar] [CrossRef]
- Chang, Y.-T.; Shih, T.K. Human fall detection based on event pattern matching with ultrasonic array sensors. In Proceedings of the 10th International Conference on Ubi-Media Computing and Workshops, Pattaya, Thailand, 1–4 August 2017; pp. 1–4. [Google Scholar]
- Sanaat, A.; Zaidi, H. Depth of interaction estimation in a preclinical PET scanner equipped with monolithic crystals coupled to SiPMs using a deep neural network. Appl. Sci. 2020, 10, 4753. [Google Scholar] [CrossRef]
- De Miguel, K.; Brunete, A.; Hernando, M.; Gambao, E. Home camera-based fall detection system for the elderly. Sensors 2017, 17, 2864. [Google Scholar] [CrossRef] [PubMed] [Green Version]
- Sase, P.S.; Bhandari, S.H. Human fall detection using depth videos. In Proceedings of the 5th International Conference on Signal Processing and Integrated Networks, Noida, India, 22–23 February 2018; pp. 546–549. [Google Scholar]
- Kong, X.; Meng, L.; Tomiyama, H. Fall detection for elderly persons using a depth camera. In Proceedings of the International Conference on Advanced Mechatronic Systems, Xiamen, China, 6–9 December 2017; pp. 269–273. [Google Scholar]
- Song, K.-S.; Nho, Y.-H.; Kwon, D.-S. Histogram based fall prediction of patients using a thermal imagery camera. In Proceedings of the 14th International Conference on Ubiquitous Robots and Ambient Intelligence, Jeju, Korea, 28 June–1 July 2017; pp. 161–164. [Google Scholar]
- Vadivelu, S.; Ganesan, S.; Murthy, O.R.; Dhall, A. Thermal imaging based elderly fall detection. In Proceedings of the Asian Conference on Computer Vision International Workshops, Taipei, Taiwan, 20–24 November 2016; pp. 541–553. [Google Scholar]
- Nogas, J.; Khan, S.S.; Mihailidis, A. Fall detection from thermal camera using convolutional lstm autoencoder. In Proceedings of the International Joint Conference on Artificial Intelligence Workshop, Stockholm, Sweden, 13–19 July 2018. [Google Scholar]
- Elshwemy, F.A.; Elbasiony, R.; Saidahmed, M.T. A new approach for thermal vision based fall detection using residual autoencoder. Int. J. Intell. Eng. Syst. 2020, 13, 250–258. [Google Scholar] [CrossRef]
- Kim, D.-E.; Jeon, B.; Kwon, D.-S. 3D convolutional neural networks based fall detection with thermal camera. J. Korea Robot. Soc. 2018, 13, 45–54. [Google Scholar] [CrossRef]
- Bangyal, W.H.; Ahmad, J.; Rauf, H.T. Optimization of neural network using improved bat algorithm for data classification. J. Med. Imaging Health Inform. 2019, 9, 670–681. [Google Scholar] [CrossRef]
- Rauf, H.T.; Bangyal, W.H.; Ahmad, J. Training of artificial neural network using PSO with novel initialization technique. In Proceedings of the International Conference on Innovation and Intelligence for Informatics, Computing, and Technologies, Sakhier, Bahrain, 18–20 November 2018; pp. 1–8. [Google Scholar]
- Castellano, G.; Castiello, C.; Mencar, C.; Vessio, G. Crowd detection in aerial images using spatial graphs and fully-convolutional neural networks. IEEE Access 2020, 8, 64534–64544. [Google Scholar] [CrossRef]
- Yao, L.; Xiao, X.; Cao, R.; Chen, F.; Chen, T. Three stream 3D CNN with SE block for micro-expression recognition. In Proceedings of the IEEE International Conference on Computer Engineering and Application, Guangzhou, China, 18–20 March 2020; pp. 439–443. [Google Scholar]
- Han, Y.; Wei, C.; Zhou, R.; Hong, Z.; Zhang, Y.; Yang, S. Combining 3D-CNN and squeeze-and-excitation networks for remote sensing sea ice image classification. Math. Probl. Eng. 2020, 2020, 8065396. [Google Scholar] [CrossRef]
- Lee, W.O.; Lee, E.C.; Park, K.R. Blink detection robust to various facial poses. J. Neurosci. Methods 2010, 193, 356–372. [Google Scholar] [CrossRef] [PubMed]
- Shi, J.; Tomasi, C. Good features to track. In Proceedings of the IEEE Conference on Computer Vision and Pattern Recognition, Seattle, WA, USA, 21–23 June 1994; pp. 593–600. [Google Scholar]
- Baker, S.; Matthews, I. Lucas-kanade 20 years on: A unifying framework. Int. J. Comput. Vis. 2004, 56, 221–255. [Google Scholar] [CrossRef]
- Bansal, M.; Kumar, M.; Kumar, M.; Kumar, K. An efficient technique for object recognition using Shi-Tomasi corner detection algorithm. Soft Comput. 2021, 25, 4423–4432. [Google Scholar] [CrossRef]
- Beauchemin, S.; Barron, J. The computation of optical flow. ACM Comput. Surv. 1995, 27, 433–466. [Google Scholar] [CrossRef]
- Hu, J.; Shen, L.; Sun, G. Squeeze-and-excitation networks. IEEE Trans. Pattern Anal. Mach. Intell. 2020, 42, 2011–2023. [Google Scholar] [CrossRef] [PubMed] [Green Version]
- Nair, V.; Hinton, G.E. Rectified linear units improve restricted boltzmann machines. In Proceedings of the International Conference on Machine Learning, Haifa, Israel, 21–24 June 2010; pp. 807–814. [Google Scholar]
- Riquelme, F.; Espinoza, C.; Rodenas, T.; Minonzio, J.-G.; Taramasco, C. eHomeSeniors dataset: An infrared thermal sensor dataset for automatic fall detection research. Sensors 2019, 19, 4565. [Google Scholar] [CrossRef] [PubMed] [Green Version]
- OpenCV. Available online: https://opencv.org (accessed on 10 September 2021).
- Paszke, A.; Gross, S.; Massa, F.; Lerer, A.; Bradbury, J.; Chanan, G.; Killeen, T.; Lin, Z.; Gimelshein, N.; Antiga, L. Pytorch: An imperative style, high-performance deep learning library. In Proceedings of the Advances in Neural Information Processing Systems, Vancouver, BC, Canada, 8–14 December 2019; Volume 32, pp. 8026–8037. [Google Scholar]
- NVIDIA CUDA Toolkit. Available online: https://developer.nvidia.com/cuda-toolkit (accessed on 10 September 2021).
- NVIDIA cuDNN. Available online: https://developer.nvidia.com/cudnn (accessed on 10 September 2021).
- NVIDIA Geforce TITAN X Graphics Card. Available online: https://www.nvidia.com/en-us/geforce/graphics-cards/geforce-gtx-titan-x (accessed on 10 September 2021).
- Keren, G.; Sabato, S.; Schuller, B. Fast single-class classification and the principle of logit separation. In Proceedings of the IEEE International Conference on Data Mining, Singapore, 17–20 November 2018; pp. 227–236. [Google Scholar]
- He, K.; Zhang, X.; Ren, S.; Sun, J. Delving deep into rectifiers: Surpassing human-level performance on ImageNet classification. In Proceedings of the IEEE International Conference on Computer Vision, Santiago, Chile, 7–13 December 2015; pp. 1026–1034. [Google Scholar]
- Kingma, D.P.; Ba, J. Adam: A method for stochastic optimization. arXiv 2017, arXiv:1412.6980. [Google Scholar]
- Confusion Matrix. Available online: https://en.wikipedia.org/wiki/Confusion_matrix (accessed on 14 January 2022).
- Wang, X.; Girshick, R.; Gupta, A.; He, K. Non-local neural networks. In Proceedings of the IEEE Conference on Computer Vision and Pattern Recognition, Salt Lake City, UT, USA, 18–22 June 2018; pp. 7794–7803. [Google Scholar]
- Jetson TX2 Board. Available online: https://developer.nvidia.com/embedded/jetson-tx2 (accessed on 26 August 2021).
- Selvaraju, R.R.; Cogswell, M.; Das, A.; Vedantam, R.; Parikh, D.; Batra, D. Grad-cam: Visual explanations from deep networks via gradient-based localization. In Proceedings of the IEEE International Conference on Computer Vision, Venice, Italy, 22–29 October 2017; pp. 618–626. [Google Scholar]


| Layer Name | Size of Filter (Depth × Height × Width) | Number of Filters | Stride (Depth × Height × Width) | Padding (Depth × Height × Width) | Size of the Feature Map (Depth × Height × Width) | |
|---|---|---|---|---|---|---|
| 3D convolutional layer | 3 × 3 × 3 | 64 | 1 × 1 × 1 | 1 × 1 × 1 | 16 × 112 × 112 | |
| 3D pooling layer | 1 × 2 × 2 | - | 1 × 2 × 2 | - | 16 × 56 × 56 | |
| 3D convolutional layer | 3 × 3 × 3 | 128 | 1 × 1 × 1 | 1 × 1 × 1 | 16 × 56 × 56 | |
| 3D pooling layer | 2 × 2 × 2 | - | 2 × 2 × 2 | - | 8 × 28 × 28 | |
| 3D convolutional layer | 3 × 3 × 3 | 256 | 1 × 1 × 1 | 1 × 1 × 1 | 8 × 28 × 28 | |
| 3D convolutional layer | 3 × 3 × 3 | 256 | 1 × 1 × 1 | 1 × 1 × 1 | 8 × 28 × 28 | |
| 3D pooling layer | 2 × 2 × 2 | - | 2 × 2 × 2 | - | 4 × 14 × 14 | |
| 3D convolutional layer | 3 × 3 × 3 | 512 | 1 × 1 × 1 | 1 × 1 × 1 | 4 × 14 × 14 | |
| 3D convolutional layer | 3 × 3 × 3 | 512 | 1 × 1 × 1 | 1 × 1 × 1 | 4 × 14 × 14 | |
| 3D pooling layer | 2 × 2 × 2 | - | 2 × 2 × 2 | - | 2 × 7 × 7 | |
| 3D convolutional layer | 3 × 3 × 3 | 512 | 1 × 1 × 1 | 1 × 1 × 1 | 2 × 7 × 7 | |
| 3D convolutional layer | 3 × 3 × 3 | 512 | 1 × 1 × 1 | 1 × 1 × 1 | 2 × 7 × 7 | |
| 3D pooling layer | 2 × 2 × 2 | - | 2 × 2 × 2 | 0 × 1 × 0 | 1 × 4 × 3 | |
| 3D SE block | FC | - | - | - | - | 32 |
| ReLU | - | - | - | - | 32 | |
| FC | - | - | - | - | 512 | |
| sigmoid | - | - | - | - | 512 | |
| FC | - | - | - | - | 4096 | |
| ReLU | - | - | - | - | 4096 | |
| FC | - | - | - | - | 4096 | |
| ReLU | - | - | - | - | 4096 | |
| FC | - | - | - | - | 1 | |
| sigmoid | - | - | - | - | 1 | |
| Dataset | Resolution (Width × Height) (Unit: Pixels) | Number of Fall Videos (Training/Validation/Testing) | Number of ADL Videos (Training/Validation/Testing) | Total |
|---|---|---|---|---|
| TSF | 640 × 480 | 35 (12/5/18) | 9 (3/1/5) | 44 |
| TCL | 640 × 480 | 421 (147/63/211) | 831 (290/125/416) | 1252 |
| eHomeSenior | 32 × 24 | 448 (157/67/224) | 473 (165/71/237) | 921 |
| Weight Decay | Loss | Kernel Initializer | Bias Initializer | Optimizer | LEARNING RATE | Beta_1 | Beta_2 | Epsilon | Batch Size |
|---|---|---|---|---|---|---|---|---|---|
| 0.5 | “binary cross-entropy loss” | “He uniform” | “zeros” | “adam” | 0.0001 | 0.9 | 0.999 | 1 × 10⁻⁸ | 16 |
| Method | Accuracy | Recall | Precision | F1 Score |
|---|---|---|---|---|
| C3D | 90.91 | 94.29 | 94.29 | 94.29 |
| keyframes + C3D | 93.18 | 97.14 | 94.44 | 95.77 |
| C3D + SE block | 93.18 | 94.29 | 97.06 | 95.65 |
| keyframes + C3D + SE block (Proposed method) | 95.45 | 97.14 | 97.14 | 97.14 |
| Number of SE Blocks | Location of the SE Block | Accuracy | Recall | Precision | F1 Score |
|---|---|---|---|---|---|
| 0 | Without SE block | 93.18 | 97.14 | 94.44 | 95.77 |
| 5 | Before every pooling layer | 93.18 | 94.29 | 97.06 | 95.65 |
| After every pooling layer | 93.18 | 97.14 | 94.44 | 95.77 | |
| 1 | Before the 1st pooling layer | 93.18 | 97.14 | 94.44 | 95.77 |
| After the 1st pooling layer | 93.18 | 94.29 | 97.06 | 95.65 | |
| Before the 2nd pooling layer | 93.18 | 94.29 | 97.06 | 95.65 | |
| After the 2nd pooling layer | 93.18 | 97.14 | 94.44 | 95.77 | |
| Before the 3rd pooling layer | 90.91 | 94.29 | 94.74 | 94.51 | |
| After the 3rd pooling layer | 93.18 | 94.29 | 97.06 | 95.65 | |
| Before the 4th pooling layer | 93.18 | 97.14 | 94.44 | 95.77 | |
| After the 4th pooling layer | 93.18 | 97.14 | 94.44 | 95.77 | |
| Before the 5th pooling layer | 93.18 | 94.29 | 97.06 | 95.65 | |
| After the 5th pooling layer (proposed method) | 95.45 | 97.14 | 97.14 | 97.14 |
| Number of Key Frames | Accuracy | Recall | Precision | F1 Score |
|---|---|---|---|---|
| 8 | 93.18 | 97.14 | 91.89 | 94.44 |
| 16 (proposed method) | 95.45 | 97.14 | 97.14 | 97.14 |
| 32 | 95.45 | 94.29 | 100.00 | 97.06 |
| Method | Accuracy | Recall | Precision | F1 Score | |
|---|---|---|---|---|---|
| Handcrafted-based | Optical flow + FFT + SVM [21] | 72.73 | 88.57 | 79.49 | 83.78 |
| Deep learning-based | SlowFast Networks [6] | 88.64 | 91.43 | 94.12 | 92.76 |
| C3D [5] | 90.91 | 94.29 | 94.29 | 94.29 | |
| Keyframes extraction + 3D CNN [24] | 79.55 | 91.43 | 84.21 | 87.67 | |
| Proposed method | 95.45 | 97.14 | 97.14 | 97.14 | |
| Method | Accuracy | Recall | Precision | F1 Score |
|---|---|---|---|---|
| C3D | 84.35 | 92.38 | 70.29 | 79.84 |
| keyframes + C3D | 92.16 | 91.43 | 86.10 | 88.68 |
| C3D + SE block | 85.30 | 93.33 | 71.53 | 80.99 |
| keyframes + C3D + SE block (Proposed method) | 96.89 | 94.06 | 96.59 | 95.30 |
| Number of SE Blocks | Location of the SE Block | Accuracy | Recall | Precision | F1 Score |
|---|---|---|---|---|---|
| 0 | Without SE block | 92.16 | 91.43 | 86.10 | 88.68 |
| 5 | Before every pooling layer | 95.37 | 90.51 | 95.52 | 92.95 |
| After every pooling layer | 95.61 | 91.92 | 94.88 | 93.38 | |
| 1 | Before the 1st pooling layer | 95.45 | 93.58 | 92.98 | 93.28 |
| After the 1st pooling layer | 95.69 | 91.69 | 95.32 | 93.47 | |
| Before the 2nd pooling layer | 95.29 | 90.25 | 97.40 | 93.69 | |
| After the 2nd pooling layer | 95.45 | 91.92 | 94.44 | 93.16 | |
| Before the 3rd pooling layer | 95.93 | 90.25 | 97.40 | 93.69 | |
| After the 3rd pooling layer | 95.85 | 92.16 | 95.35 | 93.73 | |
| Before the 4th pooling layer | 96.25 | 92.16 | 96.56 | 94.31 | |
| After the 4th pooling layer | 96.25 | 93.58 | 95.20 | 94.38 | |
| Before the 5th pooling layer | 96.57 | 93.82 | 95.88 | 94.84 | |
| After the 5th pooling layer (proposed method) | 96.89 | 94.06 | 96.59 | 95.30 |
| Number of Key Frames | Accuracy | Recall | Precision | F1 Score |
|---|---|---|---|---|
| 8 | 95.01 | 93.33 | 91.67 | 92.49 |
| 16 (proposed method) | 96.89 | 94.06 | 96.59 | 95.30 |
| 32 | 96.17 | 96.50 | 91.90 | 94.14 |
| Method | Accuracy | Recall | Precision | F1 Score | |
|---|---|---|---|---|---|
| Handcrafted-based | Optical flow + FFT + SVM [21] | 74.44 | 72.86 | 59.77 | 65.67 |
| Deep learning-based | SlowFast Networks [6] | 77.64 | 86.19 | 61.99 | 72.11 |
| C3D [5] | 84.35 | 92.38 | 70.29 | 79.84 | |
| Keyframes extraction + 3D CNN [24] | 90.24 | 90.00 | 82.53 | 86.10 | |
| Proposed method | 96.89 | 94.06 | 96.59 | 95.30 | |
| Method | Accuracy | Recall | Precision | F1 Score |
|---|---|---|---|---|
| C3D | 95.28 | 97.76 | 92.93 | 95.28 |
| keyframes + C3D | 96.81 | 96.36 | 97.13 | 96.74 |
| C3D + SE block | 95.79 | 97.52 | 94.53 | 96.00 |
| keyframes + C3D + SE block (Proposed method) | 98.91 | 98.46 | 99.33 | 98.89 |
| Number of SE Blocks | Location of the SE Block | Accuracy | Recall | Precision | F1 Score |
|---|---|---|---|---|---|
| 0 | Without SE block | 96.81 | 96.36 | 97.13 | 96.74 |
| 5 | Before every pooling layer | 97.31 | 98.38 | 96.18 | 97.27 |
| After every pooling layer | 97.59 | 97.56 | 97.46 | 97.51 | |
| 1 | Before the 1st pooling layer | 97.45 | 97.32 | 94.63 | 95.96 |
| After the 1st pooling layer | 97.59 | 97.45 | 97.66 | 97.55 | |
| Before the 2nd pooling layer | 97.79 | 97.30 | 98.08 | 97.69 | |
| After the 2nd pooling layer | 97.45 | 97.51 | 97.42 | 97.46 | |
| Before the 3rd pooling layer | 97.53 | 96.84 | 98.08 | 97.46 | |
| After the 3rd pooling layer | 97.45 | 98.35 | 96.49 | 97.41 | |
| Before the 4th pooling layer | 96.85 | 96.90 | 96.71 | 96.80 | |
| After the 4th pooling layer | 97.65 | 97.48 | 97.66 | 97.57 | |
| Before the 5th pooling layer | 97.49 | 97.79 | 97.16 | 97.47 | |
| After the 5th pooling layer (proposed method) | 98.91 | 98.46 | 99.33 | 98.89 |
| Number of Key Frames | Accuracy | Recall | Precision | F1 Score |
|---|---|---|---|---|
| 8 | 97.83 | 96.54 | 99.11 | 97.81 |
| 16 (proposed method) | 98.91 | 98.46 | 99.33 | 98.89 |
| 32 | 98.05 | 96.96 | 99.11 | 98.02 |
| Method | Accuracy | Recall | Precision | F1 Score | |
|---|---|---|---|---|---|
| Handcrafted-based | Optical flow + FFT + SVM [21] | 76.37 | 75.33 | 75.67 | 75.50 |
| Deep learning-based | SlowFast Networks [6] | 94.20 | 95.29 | 93.98 | 94.63 |
| C3D [5] | 95.28 | 97.76 | 92.93 | 95.28 | |
| Keyframes extraction + 3D CNN [24] | 95.92 | 96.05 | 96.02 | 96.03 | |
| Proposed method | 98.91 | 98.46 | 99.33 | 98.89 | |
| Method | Environment | Processing Time on TSF, TCL Dataset | Processing Time on eHomeSenior Dataset |
|---|---|---|---|
| Optical flow + FFT + SVM [21] | Desktop | 20.35 ms (49.14 fps) | 9.4 ms (106.38 fps) |
| Jetson TX2 | 104.21 ms (9.60 fps) | 41.63 ms (24.02 fps) | |
| SlowFast Networks [6] | Desktop | 35.82 ms (27.92 fps) | 5.6 ms (178.57 fps) |
| Jetson TX2 | 136.47 ms (7.33 fps) | 20.89 ms (47.87 fps) | |
| C3D [5] | Desktop | 45.09 ms (22.18 fps) | 6.64 ms (150.6 fps) |
| Jetson TX2 | 167.11 ms (5.98 fps) | 22.57 ms (44.31 fps) | |
| Keyframes extraction + 3D CNN [24] | Desktop | 30.02 ms (33.31 fps) | 4.39 ms (227.79 fps) |
| Jetson TX2 | 117.38 ms (8.52 fps) | 17.03 ms (58.72 fps) | |
| Proposed method | Desktop | 45.37 ms (22.04 fps) | 6.68 ms (149.7 fps) |
| Jetson TX2 | 168.62 ms (5.93 fps) | 23.18 ms (43.14 fps) |
| Method | With TSF and TCL Datasets | With eHomeSenior Dataset |
|---|---|---|
| Optical flow + FFT + SVM [21] | 34.91 | 6.61 |
| SlowFast Networks [6] | 62.17 | 3.97 |
| C3D [5] | 75.35 | 4.61 |
| Keyframes extraction + 3D CNN [24] | 51.22 | 3.15 |
| Proposed method | 75.82 | 4.62 |
| Categories | Method | Advantages | Disadvantages | |
|---|---|---|---|---|
| Wearable device-based | Accelerometer | Magnitude thresholding [8] | It has a very low calculation volume, and hence, it can use a low-specification processor. | As it only considers the magnitude, there is a high probability of faulty detection in the presence of a dynamic movement. |
| Decision tree + state machine [9] | As it learns the thresholding value from the data, the data characteristics are well-reflected. | It still depends on the learned fixed threshold value, and the sensor should be attached to the body or be worn. | ||
| Fusing accelerometer and gyroscope | Thresholding of the changes of acceleration and angle [10,11] | It is relatively more accurate than using a single sensor. | - It could not detect slow falling. - The sensor should be attached to the body or be worn. | |
| Ambient device-based | Radar | Autoencoder + Logistic Regression [14] | It detects well at both long and short distances, and it has fewer concerns about privacy invasion compared with cameras. | The sensor is relatively expensive. |
| Ultrasonic | Event pattern matching [15] | The sensor price is low, and there are fewer concerns about privacy invasion. | There is a high probability of misclassification in cases in which there exist other moving objects, such as pets or robotic vacuums. | |
| Vision-based | Visible light camera | Foreground extraction + optical flow + KNN [17] | The spatial information can be utilized for the prediction. | It is vulnerable to privacy problems. |
| Depth camera | ROI detection + thresholding of the changes of pixel positions [18] | As it is not a training-based method, it does not require much data for building a model. | Because it does not consider the moving speed or direction, errors could occur in the actual environment. | |
| Outline detection + thresholding of tangential distribution [19] | The spatial information can be well-detected, even in the dark. | If there are many other objects nearby, the accuracy could decrease. | ||
| Thermal camera | Histogram + SVM [20] | Because of the fewer features used, the calculation speed is relatively fast. | The accuracy cannot be guaranteed if the environment is different from the environment where the training data were obtained. | |
| Optical flow + FFT + SVM [21] | The accuracy change is not significant in the databases in different environments. | The accuracy of the fall detection is low. | ||
| ConvLSTM + autoencoder [22,23] | It is a network with a recurrent structure and can extract the temporal information well. | If there is a movement pattern that was not learned with the training dataset, the risk of misclassification increases. | ||
| Keyframes extraction + 3D CNN [24] | It is efficient because it uses only keyframes as the network input. | - The calculation of optical flow for extracting keyframes is slow. - The accuracy decreases under various environmental changes. | ||
| Keyframes extraction + 3D CNN with SE block (Proposed) | The fall detection is conducted at a high accuracy by considering the spatiotemporal information through the SE block. | The calculation of optical flow for extracting keyframes is slow. | ||
Publisher’s Note: MDPI stays neutral with regard to jurisdictional claims in published maps and institutional affiliations. |
© 2022 by the authors. Licensee MDPI, Basel, Switzerland. This article is an open access article distributed under the terms and conditions of the Creative Commons Attribution (CC BY) license (https://creativecommons.org/licenses/by/4.0/).
Share and Cite
Hong, S.B.; Kim, Y.H.; Nam, S.H.; Park, K.R. S3D: Squeeze and Excitation 3D Convolutional Neural Networks for a Fall Detection System. Mathematics 2022, 10, 328. https://doi.org/10.3390/math10030328
Hong SB, Kim YH, Nam SH, Park KR. S3D: Squeeze and Excitation 3D Convolutional Neural Networks for a Fall Detection System. Mathematics. 2022; 10(3):328. https://doi.org/10.3390/math10030328
Chicago/Turabian StyleHong, Seung Baek, Yu Hwan Kim, Se Hyun Nam, and Kang Ryoung Park. 2022. "S3D: Squeeze and Excitation 3D Convolutional Neural Networks for a Fall Detection System" Mathematics 10, no. 3: 328. https://doi.org/10.3390/math10030328
APA StyleHong, S. B., Kim, Y. H., Nam, S. H., & Park, K. R. (2022). S3D: Squeeze and Excitation 3D Convolutional Neural Networks for a Fall Detection System. Mathematics, 10(3), 328. https://doi.org/10.3390/math10030328