Abstract
The present article discusses the issue of population mean estimation in the ranked set sampling framework. A modified class of estimators is proffered and compared in the aspect of its efficacious performance with all salient conventional estimators existing to date. Some well-known existing estimators under are recognized as the members of the proffered estimators for appropriately chosen characterizing scalars. The ascendancy of the proposed class of estimators regarding the conventional estimators has been shown through an extensive computational study utilizing some natural and artificially generated populations.
MSC:
62D04
1. Introduction
In survey research, the collection of data through ranked set sampling (RSS) design has been proven advantageous in situations where the precise measurement of sampling units is either expensive or time-taking. However, the ranking of small sets of units can be performed precisely without actual quantification. The ranking of the units is usually performed either by a concomitant variable or by expert opinion or by a combination of them, and it need not to be exact. The RSS methodology is described in the following steps:
- (i).
- Select m samples randomly, each of size m, from the parent population.
- (ii).
- Perform judgement ordering by using any inexpensive measure on the elements of the , sample and distinguish the smallest unit.
- (iii).
- Measure m distinguished units in step .
- (iv).
- Repeat the aforementioned steps (known as a cycle), r times, to draw the required ranked set samples of size .
The author of [1] envisaged the methodology of ranked set sampling to compute the yield of agriculture, but he did not furnish any mathematical formula. He introduced this idea as an adequate choice of simple random sampling (SRS). Ref. [2] came up with the requisite mathematical formula for the speculation of . The instance of the perfect ranking of units was studied jointly by [1,2]. The size-biased probability in was employed by [3,4] to measure the experimental units. Ref. [5] suggested the traditional ratio estimator in ranked set sampling. The traditional regression estimator was examined by [6] under . However, in the last few years, statisticians such as [7,8,9,10,11,12,13,14,15,16,17] turned their focus to the realm of and suggested several modified and improved estimators to evaluate the population parameters by employing auxiliary information. This article investigates a modified class of estimators consisting of for evaluating the population mean.
The remainder of the article is set up in the following sections. Some well-known estimators under are considered with their characteristics in Section 2. The proposed estimator and its mean square error (MSE) expression are discussed in Section 3. The conditions of efficiency are determined in Section 4 and are followed by a computational analysis in Section 5. The conclusion is outlined in Section 6.
2. Existing Estimators
Consider a population based on N identifiable units from where bivariate samples of length n are extracted randomly having cumulative distribution function () , probability density function , population variances , , population means , , population coefficient of variations , and population correlation coefficient . Consider the ranking over the auxiliary variable z to compute the population parameter of the study variable y. Let , , …, , , , …, , …, , , …, be a bivariate random sample drawn from . Let , be the ranked set sample, such that is the order statistics in the sample for the variable z and is the judgement order in the sample for the variable y. To make the annotations easy, (,) have been notified by (, ). Here, the parentheses and show the imperfect and perfect ranking of the units, respectively.
To ascertain the characteristics of the introduced estimators, we consider the notations given hereunder.
The traditional mean estimator for is defined below as
where is the sample mean of the variable y under .
The traditional ratio estimator for was examined by [5], which is given by
where is the sample mean of variable z under .
The traditional regression estimator for , examined by [6], is given by
where is the coefficient of regression of y on z.
The ratio estimator proposed by [18] was examined by [19] under , which is given by
where k is duly chosen characterizing scalar.
The authors of [20] suggested a class of estimators under as
where and are duly chosen scalars, g is a constant. Furthermore, and . Here, c and d are either the function of the available parameters of the supplementary variable z, namely population standard deviation , population coefficient of variation , population coefficient of skewness , population mean , population coefficient of kurtosis or the existent quantities. It is pointed out that 184 members can be ascertained from the class of estimator .
Adapting the works of [21,22,23,24], the authors of [8] investigated the following estimators under as
where is a characterizing scalar to be determined later.
The authors of [25] investigated the following estimator using as
where is a duly chosen optimizing constant and q is a real constant to design various members of the estimator .
The authors of [26] suggested the following class of log-type estimators under as
where are duly chosen scalars. These estimators, namely for , and that contain various classes of estimators, can at best achieve the efficiency of the regression estimate.
The authors of [27] investigated the following classes of estimators under as
where and ; are duly chosen scalars.
The equations of the estimators discussed in this section are given in Appendix A.
3. Proposed Estimators
The present manuscript has two objectives:
- (i).
- To provide a general and efficient class of estimators using the available auxiliary information optimally.
- (ii).
- To show that the present work increases the efficiency as compared to the remaining estimators proposed to date.
Therefore, motivated by the work of [28], we proffer the following class of estimators by utilizing auxiliary information under as
where , , and are duly chosen scalars. It is to be noted that the simultaneous optimization of the scalars , , and is not possible; therefore, the optimum values of and are obtained from the methodology used in [26] estimator and [27] estimator , respectively. The proffered estimator covers some well-known estimators for duly chosen characterizing scalars which are discussed in Table 1 for ready reference. Moreover, many other estimators can also be designed from the proffered estimators for several choices of chosen scalars.

Table 1.
Few available estimators of the population mean .
Utilizing the annotations described in Section 2, we can rewrite the estimator in the form of as
By squaring both sides of (2) and ignoring the terms with power greater than two, we obtain
Applying the expectation on both sides of (3) and using the notations given in Section 2, we obtain the of the proposed estimators to first-order approximation as
which can further be written as
where , , , and .
It is to be noted that expression (6) is essential in the sense of obtaining the conditions of efficiency of Section 4 under which the proffered estimator dominates its existing counterparts.
4. Conditions of Efficiency
In this section, we compare the minimum of the proffered estimator obtained in (6) with the minimum of the existing estimators given in (A1), (A2), (A4), (A6), (A8)–(A11), (A13), (A20) and (A21), which will provide hereunder the conditions of efficiency.
We note that only under the above conditions, the proffered estimators perform better in comparison to the conventional estimators. In addition, we perform a computational study to verify these conditions of efficiency, utilizing some simulated and real data sets.
5. Computational Study
The computational study is carved up into three heads, viz., numerical study, simulation study and interpretation of computational findings.
5.1. Numerical Study
To accomplish a numerical study, two populations are considered that are described hereunder.
- (1).
- Source: (Ref. [29], p. 652)= Population in 1983 (in millions), = Export in 1983 (in millions of USD), = 457, = 12877, N = 124, = 36.65161, = 14276.03, = 116.8008, = 31431.81 and = 0.2225.
- (2).
- The data are chosen from [30] concerning the quantity of apple production and number of apple trees in 94 villages of the Mediterranean zone of Turkey in 1999 (Origin: Institute of Statistics, Republic of Turkey).= amount of apple yield, = quantity of apple trees, = 6325, = 55650, N = 94, = 9384.309, = 72409.95, = 29907.48, = 160757.30 and = 0.9011.
Now, draw a ranked set sample of size n = 12 with set length 3 and number of cycles 4 from each population. The and percent relative efficiency of various estimators regarding the traditional mean estimator are computed for these populations and the findings are presented in Table 2. The is computed by utilizing the formula given hereunder.
where , and .
Table 2.
and of estimators for natural populations.
5.2. Simulation Study
To appraise the conditions of efficiency and to generalize the results of the numerical study, a simulation study is executed on the lines of [31] using hypothetically drawn populations with variables Z and Y which can be drawn by utilizing the following models.
where and represent the independent variates of the corresponding distributions. Using the above models, we have drawn the following populations.
- (1).
- Draw a population of size by using a normal distribution such that , and .
- (2).
- Draw a population of size by using a uniform distribution such that , and .
- (3).
- Draw a population of size by using an exponential distribution such that , and .
It is worth pointing out that different values of the coefficient of correlation are taken to observe the behavior of the proffered estimator. Now, a ranked set sample of size units is drawn from each population with the size of the set being and the number of cycles being . Utilizing 20,000 iterations, the of the estimators is tabulated using (Section 5.1). The simulation findings are reported in Table 2, Table 3, Table 4 and Table 5, which show the ascendancy of the proffered estimators against the estimators of Section 2.
Table 3.
and of estimators using normal population.
Table 4.
and of estimators using uniform population.
Table 5.
and of estimators using exponential population.
5.3. Interpretation of Computational Findings
The findings of the computational study reported in Table 2, Table 3, Table 4 and Table 5 are deciphered in a pointwise fashion.
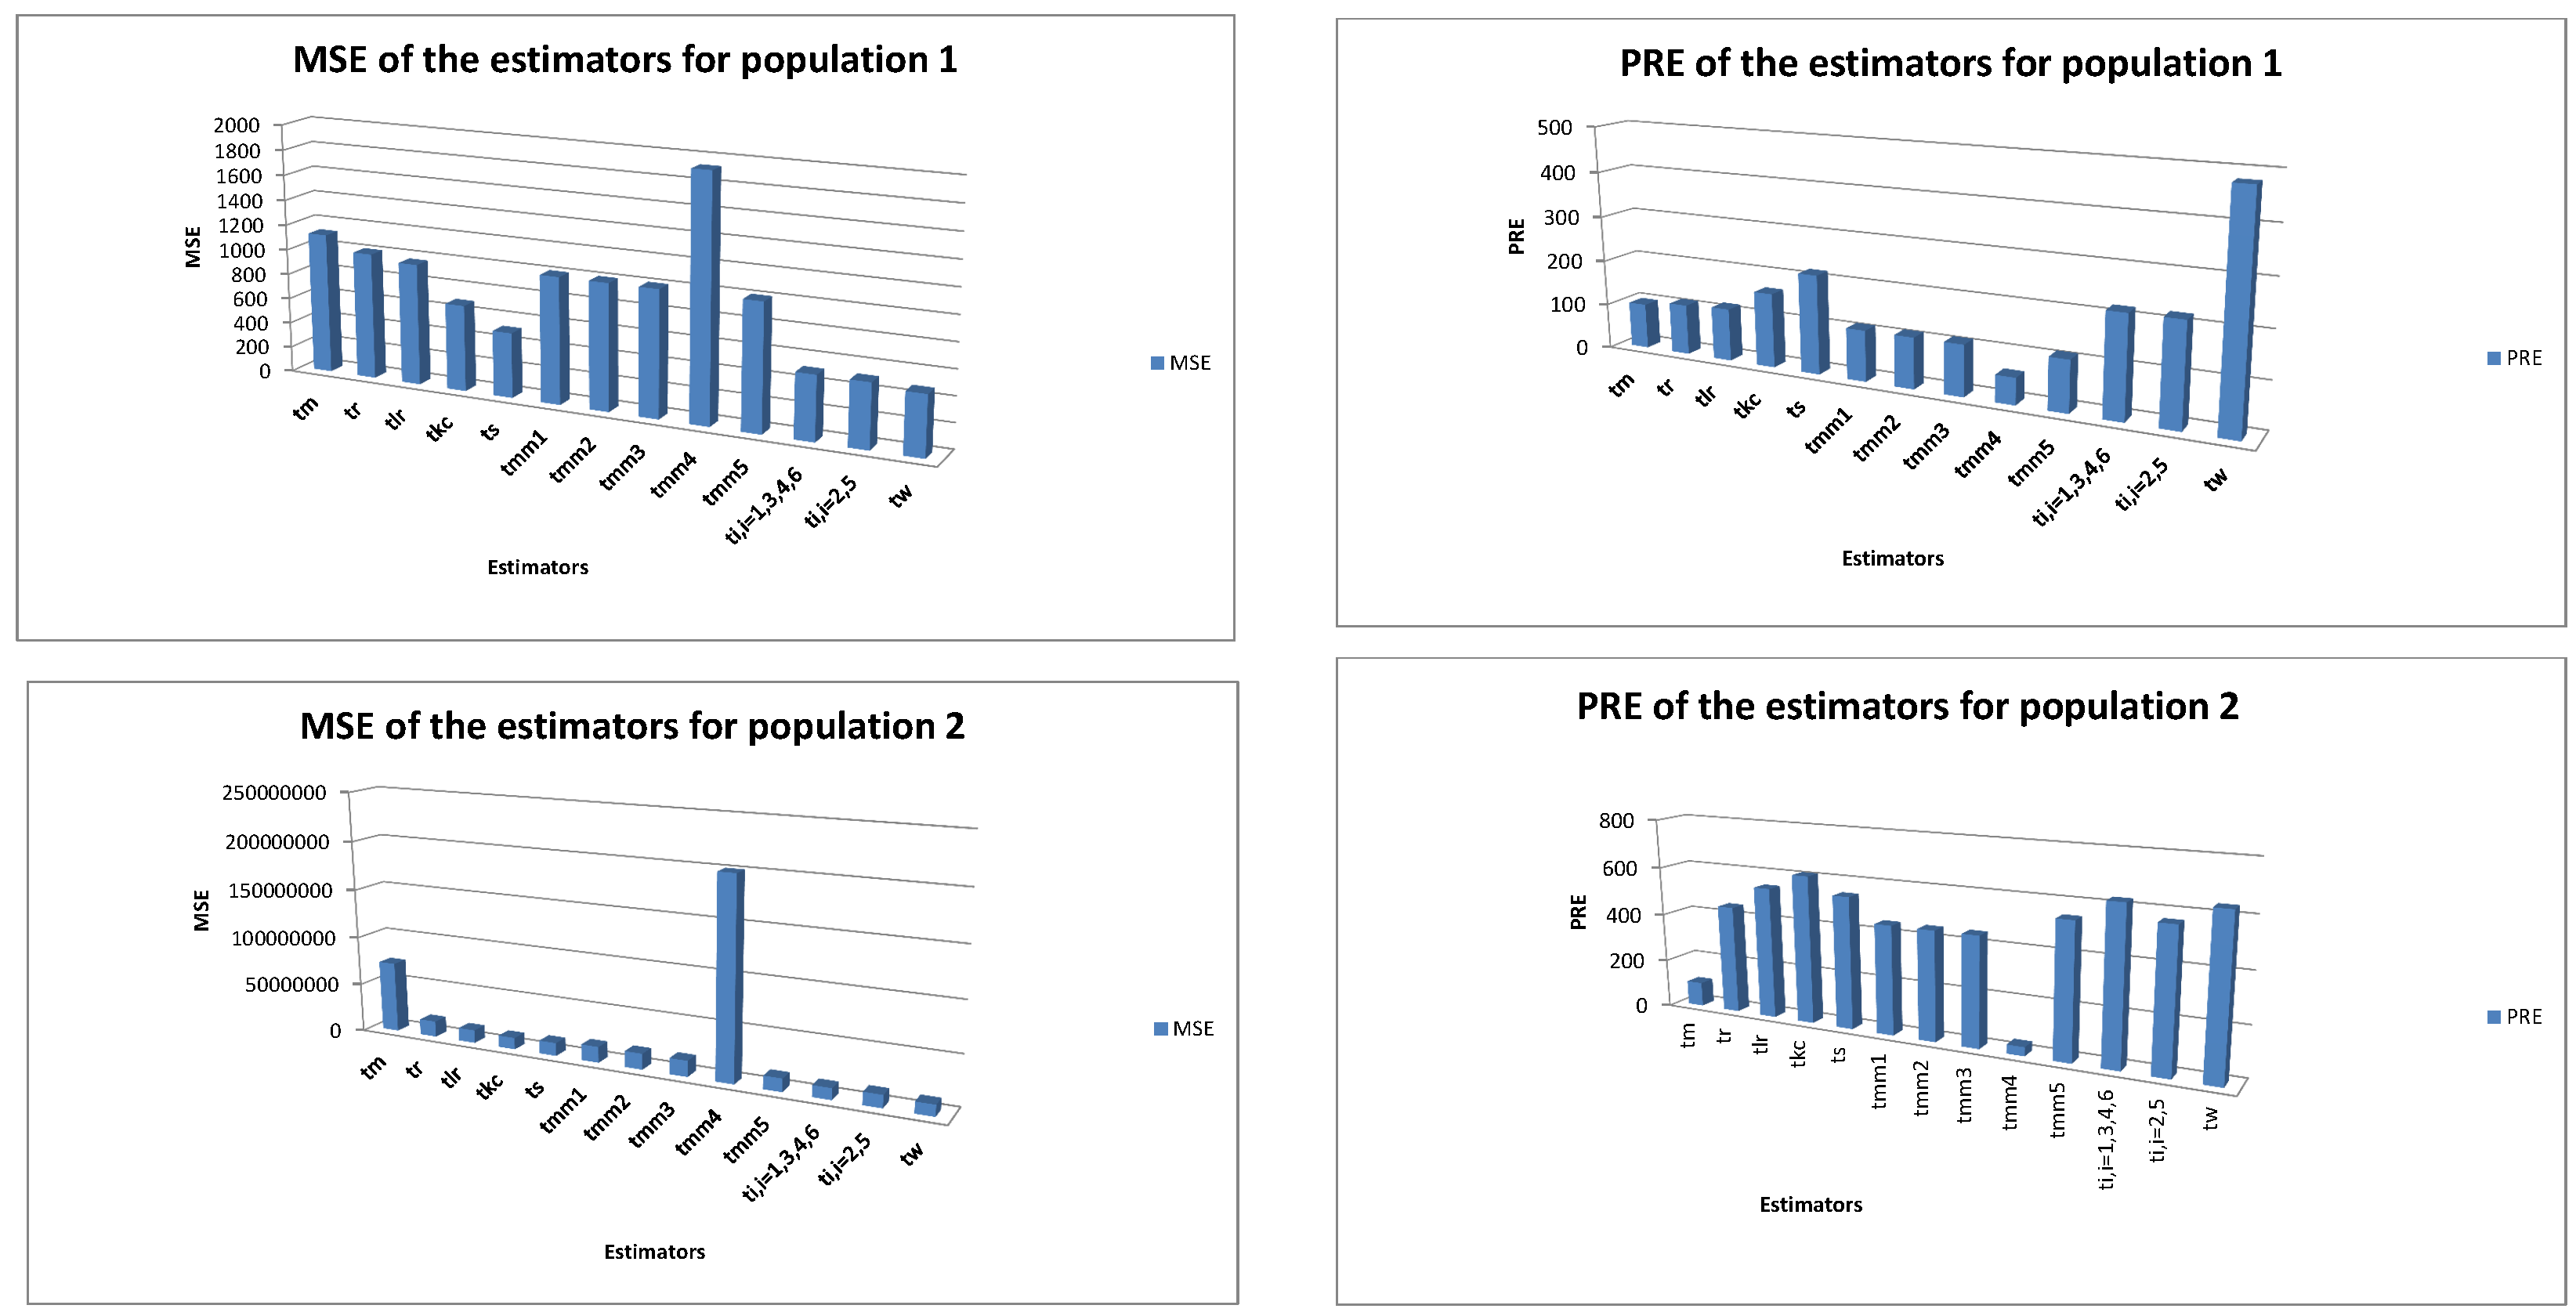
- The numerical findings summarized in Table 2 for populations 1–2 exhibit the ascendancy of the proffered estimators regarding the known estimators, namely , , , , , , , and by a greater and lesser .
- Furthermore, the results of the numerical study using natural populations, which are reported in Table 2, are also presented through the bar diagrams given in Figure 1. The performance of the proffered estimators can easily be observed from Figure 1. The PRE of the simulation results of Table 3, Table 4 and Table 5 also exhibit the similar tendency and can be easily presented through bar diagrams, if required.
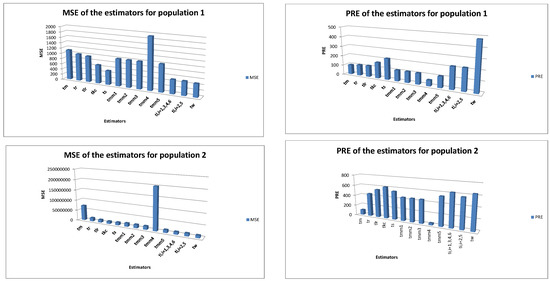 Figure 1. and of the estimators for real populations.
Further, the dominance of the proffered estimators has been studied utilizing two real populations and the results are established to be rather acceptable, rendering advancement over the existing estimators. Therefore, the results of this computational study can be generalized to nearly all real populations. Moreover, a simulation study is also presented by using symmetric, uniform and asymmetric populations to meliorate the theoretical results.
6. Conclusions
The present article has proffered a modified category of estimators consisting of for evaluating the population mean along with its characteristics. The traditional mean estimator , traditional ratio estimator envisaged by [5,7] estimators , [19] estimator , [8] estimators , [26,27] estimators , , and are recognized as the member of the proffered estimators. The characteristics of these estimators can be determined by the characteristics of the proffered estimators for duly chosen scalars. Therefore, this article conflates the properties of various estimators. The theoretical findings are derived and then justified by a computational study utilizing natural and simulated data sets. These computational findings are showing improvement over the traditional mean estimator, the traditional ratio and regression estimators, [19] estimator, [20] estimator, [8] estimators and [25,26,27] estimators. Because the proffered estimator dominates the [20] estimator, the proffered estimator will therefore also dominate those 184 estimators that can be ascertained from the [20] estimators. Hence, the findings of this study are rather illuminating, both theoretically and computationally, and may be recommended to survey statisticians for the practical application of real life problems.
Furthermore, in coming studies, we intend to examine the proposed estimators for the estimation of the population mean by using stratified ranked set sampling and median ranked set sampling.
Author Contributions
Conceptualization, S.B.; methodology, S.B. and A.K.; software, A.K.; validation, S.B.; writing—original draft preparation, A.K.; writing—review and editing, S.A.L., S.A.A. and S.S.; funding acquisition, S.S. All authors have read and agreed to the published version of the manuscript.
Funding
This research was supported by the Princess Nourah bint Abdulrahman University Researchers Supporting Project number (PNURSP2022R259), Princess Nourah bint Abdulrahman University, Riyadh, Saudi Arabia.
Data Availability Statement
The data that used in this study are available within the paper.
Acknowledgments
The authors thank and extend their appreciation to the Deanship of Scientific Research at Princess Nourah bint Abdulrahman University for funding this research.
Conflicts of Interest
The authors declare no conflict of interest.
Appendix A
The of the estimators discussed in Section 2 are reported hereunder.
The optimum value of scalars in the estimators are, respectively, given as
where ; ; ; ; ; ; ; ; ; ; ; and .
References
- McIntyre, G.A. A method of unbiased selective sampling using ranked set. Aust. J. Agric. Res. 1952, 3, 385–390. [Google Scholar] [CrossRef]
- Takahasi, K.; Wakimoto, K. On unbiased estimates of the population mean based on the sample stratified by means of ordering. Ann. Inst. Stat. Math. 1968, 20, 1–31. [Google Scholar] [CrossRef]
- Muttlak, H.A.; McDonald, L.L. Ranked set sampling with respect to a concomitant variables and with size biased probability of selection. Commun. Stat. Theory Mathods 1990, 19, 205–219. [Google Scholar] [CrossRef]
- Muttlak, H.A.; McDonald, L.L. Ranked set sampling and line intercept method: A more efficient procedure. Biom. J. 1992, 34, 329–346. [Google Scholar] [CrossRef]
- Samawi, H.M.; Muttlak, H.A. Estimation of ratio using ranked set sampling. Biom. J. 1996, 38, 753–764. [Google Scholar] [CrossRef]
- Yu, L.H.; Lam, K. Regression estimator in ranked set sampling. Biometrics 1997, 53, 1070–1080. [Google Scholar] [CrossRef]
- Al-Omari, A.I.; Jemain, A.A.; Ibrahim, K. New ratio estimators of the mean using simple random sampling and ranked set sampling methods. Rev. Investig. Oper. 2009, 30, 97–108. [Google Scholar]
- Mehta, N.; Mandowara, V.L. A modified ratio-cum-product estimator of finite population mean using ranked set sampling. Commun. Stat. Theory Methods 2016, 45, 267–276. [Google Scholar] [CrossRef]
- Mahdizadeh, M.; Zamanzade, E. Reliability estimation in multistage ranked set sampling. REVSTAT Stat. J. 2017, 15, 565–581. [Google Scholar]
- Zamanzade, E.; Mahdizadeh, M. Entropy estimation from ranked set samples with application to test of fit. Rev. Colomb. Estad. 2017, 40, 223–241. [Google Scholar] [CrossRef]
- Mahdizadeh, M.; Zamanzade, E. Estimation of a symmetric distribution function in multistage ranked set sampling. Stat. Pap. 2018, 61, 851–867. [Google Scholar] [CrossRef]
- Zamanzade, E.; Mahdizadeh, M. Proportion estimation in ranked set sampling in the presence of tie information. Comput. Stat. 2018, 33, 1349–1366. [Google Scholar] [CrossRef]
- Shahzad, U.; Ahmad, I.; Oral, E.; Hanif, M.; Almanjahie, I. Estimation of the population mean by successive use of an auxiliary variable in median ranked set sampling. Math. Popul. Stud. 2020, 28, 176–199. [Google Scholar] [CrossRef]
- Zamanzade, E.; Mahdizadeh, M. Using ranked set sampling with extreme ranks in estimating the population proportion. Stat. Methods Med. Res. 2020, 29, 165–177. [Google Scholar] [CrossRef]
- Bhushan, S.; Kumar, A.; Lone, S.A. On some novel classes of estimators under ranked set sampling. AEJ Alex. Eng. J. 2021, 61, 5465–5474. [Google Scholar] [CrossRef]
- Bhushan, S.; Kumar, A. Novel log type class of estimators under ranked set sampling. Sankhya B 2022, 84, 421–447. [Google Scholar] [CrossRef]
- Bhushan, S.; Kumar, A. Predictive estimation approach using difference and ratio type estimators in ranked set sampling. J. Comput. Appl. Math. 2022, 410, 114214. [Google Scholar] [CrossRef]
- Prasad, B. Some improved ratio type estimators of population mean and ratio in finite population sample surveys. Commun. Stat. Theory Methods 1989, 18, 379–392. [Google Scholar] [CrossRef]
- Kadilar, C.; Unyazici, Y.; Cingi, H. Ratio estimator for the population mean using ranked set sampling. Stat. Pap. 2009, 50, 301–309. [Google Scholar] [CrossRef]
- Singh, H.P.; Tailor, R.; Singh, S. General procedure for estimating the population mean using ranked set sampling. J. Stat. Comput. Simul. 2014, 84, 931–945. [Google Scholar] [CrossRef]
- Singh, H.P.; Espejo, M.R. On linear regression and ratio estimator using coefficient of variation of auxiliary variate. Statistician 2003, 52, 59–67. [Google Scholar] [CrossRef]
- Upadhyaya, L.N.; Singh, H.P. Use of transformed auxiliary variable in estimating the finite population mean. Biome. J. 1999, 41, 627–636. [Google Scholar] [CrossRef]
- Singh, H.P.; Kakran, M.S. A modified ratio estimator using known coefficient of kurtosis of auxiliary character. In Advanced Sampling Theory with Applications; Singh, S., Ed.; Kluwer Academic Publishers: Dordrecht, The Netherlands, 1993; Volume 2. [Google Scholar]
- Sisodia, B.V.S.; Dwivedi, V.K. A modified ratio estimator using coefficient of variation of auxiliary variable. J. Indian Soc. Agric. Stat. 1981, 33, 13–18. [Google Scholar]
- Mehta, V.; Singh, H.P.; Pal, S.K. A general procedure for estimating finite population mean using ranked set sampling. Rev. Investig. Oper. 2020, 41, 80–92. [Google Scholar]
- Bhushan, S.; Kumar, A. Log type estimators of population mean under ranked set sampling. Pred. Anal. Stat. Big Data Conc. Model. 2020, 28, 47–74. [Google Scholar]
- Bhushan, S.; Kumar, A. On optimal classes of estimators under ranked set sampling. Commun. Stat. Theory Methods 2022, 51, 2610–2639. [Google Scholar] [CrossRef]
- Bhushan, S.; Kumar, A.; Kumar, S.; Singh, S. Some modified classes of estimators for population variance using auxiliary attribute. Pak. J. Stat. 2022, 38, 235–252. [Google Scholar]
- Sarndal, C.E.; Swensson, B.; Wretman, J. Model Assisted Survey Sampling; Springer: New York, NY, USA, 2003. [Google Scholar]
- Kadilar, C.; Cingi, H. Ratio estimators in stratified random sampling. Biom. J. 2003, 45, 218–225. [Google Scholar] [CrossRef]
- Singh, H.P.; Horn, S. An alternative estimator for multi-character surveys. Metrika 1998, 48, 99–107. [Google Scholar] [CrossRef]
Publisher’s Note: MDPI stays neutral with regard to jurisdictional claims in published maps and institutional affiliations. |
© 2022 by the authors. Licensee MDPI, Basel, Switzerland. This article is an open access article distributed under the terms and conditions of the Creative Commons Attribution (CC BY) license (https://creativecommons.org/licenses/by/4.0/).