Abstract
[Problem] The risks of hosting large-scale sports events are very difficult to evaluate and often directly affected by natural environment risks, events management risks, and social environment risks. Before hosting the events, accurately assessing these risks can effectively minimize the occurrence of risks and reduce the subsequent losses. [Aim] In this article, we advocate the use of a back propagation neural network (BPNN) model for risk evaluation and early warning of large-scale sports events. [Methods] We first use expert surveys to assess the risks of 28 large-scale sports events using 12 indicators associated with climate conditions, events management, and natural disasters. We then apply the BPNN model to evaluate the risks of 28 large-scale sports events with sufficient samples by adding white noise with mean zero and small variance to the small actual samples. We provide a general rule to establish a BPNN model with insufficient and small samples. [Results] Our research results show that the recognition accuracy of the established BPNN model is 86.7% for the 15 simulation samples and 100% for the 28 actual samples. Based on this BPNN model, we determined and ranked the risk level of the events and the importance of each indicator. Thus, sample S8 had the highest risk and the second highest was sample S14, and indicator nine was the most important and indicator one the least important. [Conclusions] We can apply the established BPNN model to conveniently evaluate the risk of hosting a large-scale sports event. By analyzing the nonlinear relationship between each indicator and the risk of the sports event, and applying the established BPNN model, we can propose more targeted and effective measures and suggestions for eliminating and decreasing the risks of hosting a large-scale sports event, and ensure large-scale sports events can be successfully hosted.
Keywords:
neural network; large-scale sports event (LSSE); early warning; risk evaluation; samples; training MSC:
93-10; 91G70
1. Introduction and Literature Review
Hosting a large-scale sports event (LSSE) can attract thousands of tourists from all over the world, which bring economic prosperity to the host city and promote its development of manufacturing, tourism, exhibition, transportation, and cultural industries. Thus, successfully hosting a large-scale sports event such as the Olympic Games, the FIFA World Cup, etc., has become a “name card” of a city and the embodiment of national competitiveness. However, there are also many risks associated with hosting large-scale sports events. For example, the long cycle and huge investment can lead to financial risks. Factors such as weather, epidemics, accidents, and the environment will also bring other risks to large-scale sports events [1,2,3,4,5,6]. In recent years, research on the risks of hosting large-scale sports events has received increasing attention. In fact, organizing such events is very complicated, and requires the coordination of various stakeholders. Any negligence may lead to a huge disaster. For example, in May 2021, 21 people died in a 100 km cross-country race held in Gansu province, China. Therefore, before hosting a sports event, organizers must analyze, forecast, and manage various uncertainties and risks. So far, research in this area has not received much attention. The existing research on the identification, classification, and prevention of sports event risks is mainly qualitative [4,5,7,8,9]. There have been studies on establishing different risk evaluation systems for large-scale events from the perspectives of event organization, operation, and politics [10,11,12,13,14,15]. From a theoretical perspective, Liu et al. [10] argued that the neural network-fuzzy optimization model can be used to provide early warnings. The Fuzzy Analytic Hierarchy Process (F-AHP) and the Fuzzy Comprehensive Evaluation Method (FCEM) are more extensively studied in the literature [8,12]. Using questionnaire survey data, a structural equation model to assess the risk of sports events was employed by Pu et al. [12]. On the basis of the results of an expert scoring method and investigation, several studies [13,14,15,16] adopted ANN technology to model and conduct exploratory research on the risk of hosting large-scale sports events. Theoretically, the main issues of the F-AHP and FCEM are that they are subjective evaluation methods, which are directly affected by the knowledge and experience of experts participating in the evaluation. These methods are subjective and require tedious work. Thus, it is very difficult to evaluate the risk of large-scale sports by applying F-AHP and FCFM, and these subjective methods cannot be used effectively to evaluate the risk of large-scale sports.
Risk evaluation of sports events is a complicated nonlinear pattern recognition problem affected by various factors. Its working principle is unclear. It is difficult to achieve desired results using traditional comprehensive evaluation and statistical methods. The ANN model can perform well for nonlinear approximation and can be applied to the modeling of the “black box” system, and risk evaluation [13,14,15,16,17,18,19,20,21,22,23,24,25,26]. Under normal circumstances, building a reliable, robust, and effective ANN model requires a large number of samples, which should be divided into training samples, validation samples, and testing samples. Certain basic principles and steps must be followed during the modeling process. The validation samples are used to monitor the training process in real time to avoid “overtraining”. The testing samples are used to measure the performance of the established BPNN model. Otherwise, the established model has no generalization ability and cannot be used in practice [17,18,19,20,21,22,23]. Unfortunately, the main issues or shortcomings presented in the literature [14,15] are that the total number of samples used for establishing a back propagation neural network (BPNN) model is too small, the network structure topology is too large, and there is no validation sample to monitor the training process in real time. The relevant basic principles and the steps of modeling a BPNN model are not followed. As a result, the “overtraining” phenomenon is certainly prone to occur. Therefore, these established BPNN models are unreliable and have no practical value. Furthermore, in practice, it is difficult to obtain a large number of samples due to the high cost and long cycle of collecting risk evaluation cases. Therefore, this article is very meaningful and practical because it establishes a more reliable, effective, and general risk evaluation neural network model for large-scale sports events with a small number of risk evaluation samples.
In order to solve the above-mentioned problems with small samples and a large topology, and improve the reliability and robustness of the BPNN model, we generate a sufficient number of samples by adding white noise with mean zero and small variance to the small actual samples in this article. We thus establish a robust and reliable BPNN model for risk assessment of large-scale sports events that obeys the basic principles and steps. Such a study can provide insights for large-scale sports events to minimize and control risks, which will help accelerate the development of the sports industry, in addition to strength of the city and national competitiveness.
The main contributions are as follows: First, we generate a sufficient number of samples by adding white noise with mean zero and small variance to the actual samples to satisfy the establishment of a reliable neural network model. Second, we established the robust BPNN model for risk evaluation of large-scale sports by obeying the basic principles and steps, thereby avoiding the problem of overtraining.
This paper is structured as follows: In Section 2, we survey the literature regarding establishing an index system for risk evaluation of large-scale sports events and the 28 collected samples and the descriptive statistics. Subsequently, we provide the theoretical principles and steps of neural network modeling used in this study in Section 3. Thereafter, in Section 4, the BPNN model for risk evaluation and early warning of large-scale sports events is established. The empirical results of the BPNN models are shown in Section 5 and Section 6 presents the discussion. Section 7 draws the conclusions and addresses the further research on the application of the BPNN model in practice.
2. The Establishment of an Index System for Risk Evaluation of Large-Scale Sports Events
Large-scale sports events refer to those sports events with a large scale, various stakeholders, and complex operations and organization processes. Such sports events can have a significant impact on the host city. Examples include the Olympic Games, the Asian Games, the FIFA World Cup, the Formula One World Championship, and the International Car Rally. In recent years, scholars have established a few risk evaluation index systems to study large-scale sports events from different perspectives. Since the focus of this article is guidance about how to establish a more reliable, effective, and generalized ANN model based on a small number of samples, we will not detail the process and the principles of establishment of a reasonable risk evaluation index system for large-scale sports events. Here, we adopt the evaluation index system established by Huo et al. [15]. In this system, the risks of hosting large-scale sports events are composed of risks associated with the social environmental, natural environmental, and the event management. The social environmental risks include the risk of the local economy , the risk of the harmonious cultural environment , and the risk of the political stability . The natural environmental risks include the risk of the geographic environment , the risk of the climatic conditions , and the risk of the natural disasters . The event management risks include the quality risk of the event participants , the risk of the event management systems , the risk of the event information , the event risk of the management measures , the event risk of the organizational methods , and the risk of the management mechanisms . In short, the risk evaluation index system of hosting larger-scale sports events is composed of 12 indicators.
Huo et al. [15] employed questionnaire surveys and expert interviews to score the 12 risk factors (evaluation indicators) of 28 large-scale sports events (the actual samples) shown in Table 1. The descriptive statistics of these 28 samples for the evaluation indicators of each risk level are shown in Table 2.

Table 1.
The indicator values of the 28 samples and the corresponding risk level.
Table 2.
Descriptive statistics for the evaluation indicators of the 28 large-scale sports events.
Table 2 shows that for most indicators, the larger (smaller) the mean value of an indicator, the greater the risk level (e.g., , , and ). However, several indicators such as indicators , , and are the opposite. The maximum values of several indicators (e.g., and ) are the same. Some indicators have the largest (smallest) value at risk-level 2 (e.g., ). Obviously, there is a complicated nonlinear relationship between the value of each evaluation indicator and the risk level of hosting large-scale sports events. Thus, it may be inappropriate to use general evaluation and classification methods such as F-AHP or FCEM, or systematic clustering methods proposed in the literatures [8,12].
3. The Basic Principles and Steps of Neural Network Modeling
An artificial neural network (ANN) is especially suitable for modeling and analysis of nonlinear systems [17,18,19,20,21,22,23,24,25,26,27]. There are different types of ANN models used in different applications, which include supervised and unsupervised ANN models. The BP neural network (BPNN), radial basis neural network (RBFNN), probabilistic neural network (PNN), and generalized regression neural network (GRNN) are widely used supervised architectures. The SOFM is unsupervised. The algorithm of the BPNN model, statistically accounting for 80–90% of the used ANN models, is relatively simple and can be easily programmed. Therefore, in this article, we adopt the BPNN model. The basic principles, the algorithms, and the formulas of BPNN are described in the literature [17,18,19,20,21,22,23], and are not repeated in this article. In particular, BPNN performs well for nonlinear approximations. Therefore, it is suitable for nonlinear modeling. However, it is not easy to construct a model with strong generalization ability. In order to ensure that the established model avoids overtraining and has good generalization, we should use a reasonable network structure topology, i.e., a reasonable number of hidden layers and number of nodes. We should use the network connection weights from before the occurrence of overtraining. In BPNN model training, even when the training error is small, the error of the non-training samples could be large. In other words, although the BPNN model remembers the rules of the training dataset, it does not extract the contained actual rules of the data. Overtraining leads to the established BPNN models having poor generalization. In order to establish a reliable, effective, and generalized BPNN model, it is necessary to follow the basic principles and the steps during modeling the BPNN model process [17,18,19,20,21,22,23,27,28,29]:
(1) Collect as many samples as possible. When the cost of obtaining samples is high or the samples are difficult to obtain, we can add normal distributed random noise (that is white noise with mean zero and small variance) to each variable (indicator) to generate enough samples. Moreover, according to the distribution law of existing samples, samples can be generated artificially.
(2) Split the sample data, randomly or according to some algorithm, into the training dataset [17,19,20,21,22,23,27], the validation dataset (about 20%), and the testing dataset (about 20%) (namely, three datasets) with similar properties. We use the training dataset to optimize the network connection weights. The validation dataset is used to monitor the training process in real time to judge whether overtraining occurs, that is, to determine whether the established BPNN model has good generalization. We use the testing dataset to evaluate the established model’s performance. When the test error is basically in agreement with or a little greater than that of the training dataset and the validation dataset (no more than 1.5 times) and is small enough, it shows that the established BPNN model has good generalization and prediction performance. With the increase in training epoch, the training error certainly continues to decrease, and the validation error first decreases, gradually reaches the minimum, and then increases again, that is, the overtraining phenomenon occurs. When this occurs, we should either stop the training process or take the weight of the network connection before the occurrence of overtraining.
(3) Ensure the network structure topology is as compact as possible. As a rule of thumb, the number of training datasets must be greater than the number of network connection weights, i.e., generally 3–5 times or more. The reasonable number of neuron nodes in the hidden layer is situation-dependent and can only be determined by a trial-and-error method. As the number of the neuron nodes in the hidden layer increases, the training error decreases; at the same time, the validation error reduces at the beginning and gradually reaches the minimum. After that, the error may remain unchanged or start to rise again. This indicates that we have a reasonable number of neuron nodes in the hidden layer with the minimum validation error.
(4) Check the BPNN model’s performance with the testing dataset. We regard the BPNN model with good generalization ability and practical value when the testing error is in agreement with or a little greater than that of the training dataset and validation dataset. Otherwise, we still regard the BPNN model as having poor generalization ability; that is, we must retrain the BPNN model from the very beginning.
In BPNN modeling, even with the same samples and structure topology, if the initial connection weights of the network are different, the final results will be different. Therefore, for each network structure, it is necessary to train at least 10 times. The model with the smallest validation error and testing dataset (approximately the same as the training error) is the optimal model.
4. The Establishment of the BPNN Model for Risk Evaluation and Early Warning of Large-Scale Sports Events
4.1. The Generation of New Samples
When the input/output relations are complex and highly non-linear, the BPNN needs a relatively large training dataset (hundreds of data points) to capture these relations adequately. Because the cost of obtaining a large number of samples is very high, only 28 actual samples of large-scale sport event risks based on the scores from experts and actual investigation were collected and obtained by Huo et al. [15]. One of the most challenging problems when training a small dataset in establishing a BPNN model occurs as overfitting (overtraining or overlearning). Therefore, different methods have been developed and implemented in BPNN modeling to cope with the small dataset conditions [30]. One of the simplest and widely used methods is to generate sufficient simulated data to train the BPNN [18]. Generally speaking, the error of the expert’s scoring will not be greater than 0.5. We thus set the maximum error of each indicator score to be 0.4. Therefore, based on the 28 original actual sample data points, we construct a new virtual sample by adding or subtracting a random value obeying a normal distribution with a mean of 0 and a standard deviation of 0.4 based on each indicator value, and thus generate enough sample data. We also add a random value obeying a normal distribution with a mean value of 0 and a standard deviation of 0.2 to the corresponding output value of each sample with the risk levels 1, 2, and 3 for mild risk, moderate risk, and severe risk, respectively.
The number of the original data samples of mild risk, moderate risk, and severe risk provided by Huo et al. [15] are 15, 7, and 6, respectively. According to the ANN modeling theory, a balanced sample size of different risk levels contributes to the improvement in the reliability and effectiveness of the established BPNN model. Therefore, in this article, we created 300 mild-risk samples, 301 moderate-risk samples, and 300 severe-risk samples.
In summary, the advantages of this algorithm for generating sufficient simulation samples are as follows. Firstly, we can obviously reduce the cost and overcome the difficulty of collecting sample data. Secondly, this proposed algorithm makes it possible to apply the BPNN model with small sample data and avoid overtraining. Thirdly, the generated samples perfectly agree with the actual samples and there are no conflicting samples.
Because of the sufficient number of samples, we randomly split the samples into three datasets with similar properties. Among them, we obtained 541 training samples (about 60%), 180 testing samples (about 20%), and 180 validation samples (about 20%). The mean values and standard deviations of the three datasets are shown in Table 3. The maximum value of the indicators of the samples is 5.4, and the minimum value is 0.6.
Table 3.
The mean value and standard deviation of the three datasets.
4.2. The Establishment of a BPNN Model with Strong Generalization Ability
4.2.1. Determining a Reasonable Network Structure
When determining the network structure, we generally start with a single hidden layer and use the trial-and-error method of structure expansion to determine the reasonable number of hidden layer nodes. In this study, we used the STATISTICA Neural Network (SNN), a neural network software package produced by STATSOFT [17]. The transfer functions used on the hidden layer and output layer were both sigmoid functions. The Quasi-Newton training method was applied to train the model. The maximum epochs were 5000. The data on input layer and on output layer were normalized in the range of (0.2, 0.8) using the Minimax conversion function to help improve the accuracy of the models developed [17]. Here, we took all the samples as training set data. First, the number of neuron nodes in the hidden layer was one, and the root mean squared error (RMSE) of the established BPNN model was about 0.33. When the number of neuron nodes increased to two, the RMSE reduced to 0.079, and the correlation coefficient reached more than 0.995, indicating that the accuracy of the established BPNN model was high and the error was small. We found that when more than three nodes in the hidden layer are used, there is no significant improvement in the RMSE. Therefore, the reasonable number of neuron nodes in the hidden layer of the BPNN model was set to 2 or 1.
4.2.2. Establishing a BPNN Model with Good Generalization
The 541 training datasets, the 180 validation datasets, and the testing dataset were reasonably grouped with similar characteristics, and the network structure topology of the BPNN model was 12-2-1. That is, there were 12 nodes, 2 nodes, and 1 node in the input layer, the hidden layer, and the output layer, respectively. We used the SNN software to train the BPNN model. We found that overtraining may occur during the training process. Moreover, according to the ANN modeling principle, the network weights should follow a normal distribution, and the absolute value of the weights should be less than 10. To avoid overtraining in the training process, we obtained the BPNN models with the RMSEs of the training samples, validation samples, and testing samples of 0.0793, 0.0799, and 0.0811, respectively. Here, the correlation coefficients were 0.9960, 0.9958, and 0.9954. The average absolute errors (AAEs) were 0.0625, 0.0630, and 0.0642. We found that the model performance values of these testing samples were similar to those of the training samples and validation samples (slightly larger but very close), indicating that the established BPNN model has strong generalization and predictive ability, which meets the requirement of the inherent law for training sample data.
4.2.3. Analysis of the Effects of Each Evaluation Indicator on the Risks of Large-Scale Sports Events
A variation in an indicator will cause a change in the degree of risk, which can thus describe the importance of the indicator [17,18,19,27]. Using the “Sensitivity Analysis” of SNN software, we obtained the importance of each indicator (shown in Table 4). As shown in Table 4, indicator , which has the largest ratio, has the greatest impact on the sports events risk followed by the indicators , , and with respect to ratios. The ratios of the indicators , , and are all greater than 2. The ratios of the other indicators are between 1.05 and 1.888, indicating that they are also important and indispensable. Using the “Response Graph” and the “Response Surface” functions, we obtained the nonlinear relationship between the indicators and the risk levels of the large-scale sports events.
Table 4.
Ranking of the importance of each evaluation indicator.
4.3. Interval Distribution of the Output Value of the Established BPNN Model for Different Risk Levels
According to the BPNN model established above, the output value range of the 300 mild-risk samples lies in [0.9017, 1.2712] with an average value of 0.9660. The range of the 301 moderate-risk samples lies in [1.7846, 2.2264] with an average value of 1.9866. The range of the 300 severe-risk samples lies in [2.7033, 3.0719] with an average value of 3.0128. For samples that are not within the range of the above three types of risk levels, the risk level can be determined according to the principle of the most proximity.
5. Empirical Results
5.1. Risk Evaluation for the 28 Actual Large-Scale Sports Events
In this section, we input the evaluation indicator values of the 28 large-scale sports events (namely S1, S2, …, in Table 1) provided by Huo et al. [18] into the BPNN model established above, and obtain the output values of the 28 samples: 1.9980, 3.0291, 0.9409, 0.9806, 3.0133, 1.0056, 2.054, 3.0635, 1.9744, 0.9824, 0.9707, 2.0003, 0.9524, 3.0590, 0.9214, 0.9581, 0.9038, 1.9494, 0.9050, 0.9854, 2.0001, 1.9594, 2.9921, 0.9018, 0.9857, 0.9175, 3.0038, and 0.9028.
We can see that the output values of the 15 mild-risk samples are between 0.9018 and 1.0056. These output values are all within the range of the mild-risk samples for the BPNN model. In other words, for the mild-risk samples, the accuracy of the model is 100%. Similarly, the output values of the seven moderate-risk samples range from 1.9494 to 2.0054, indicating that, for the moderate-risk sample, the accuracy of the model is also 100%. The output values of the six severe-risk samples range from 2.9921 to 3.0635, indicating that the model identification accuracy of the severe-risk samples is also 100%. Our study shows that, for the risk level of the 28 samples in [15], the recognition accuracy of our established BPNN model is 100%.
The recognition accuracy of the actual samples shows that the established BPNN model is reliable and consistent with the facts.
5.2. Results and Risk Level Assessment
Since there are no specific data of the nine testing samples in [15], we could not use these samples for reverification. In order to further verify the validity and reliability of the BPNN model established in this paper, we generated the following 15 simulation samples, as shown in Table 5. The indicator values of the samples SS1, SS2, and SS3 equal to the mean values of the three types risk-level samples, which are the 15 mild-risk, the 7 moderate-risk, and the 6 severe-risk levels. The risk levels of the above three simulation samples must then be mild-risk, moderate-risk, and severe-risk, respectively. The simulation samples SS4 and SS5 samples are created by adding 1 to each indicator value of the first two samples of the mild-risk level shown in Table 1 [15]. For the mild-risk simulation samples SS6 and SS7, we add or subtract 1 for the mean value of each indicator value of the mild-risk level samples. Similarly, based on the moderate-risk level samples, we generate simulation samples numbered 8–11. Based on the severe-risk level samples, we generate severe-risk simulation samples SS12–SS15. The 15 simulation samples are shown in Table 5.
Table 5.
The indicator values of the 15 simulation samples and their output values and the risk levels.
Table 5 shows that the results of the three types of samples (samples SS1 to SS3) according to the established BPNN model are completely correct. Except for the samples SS4 and SS5, the output values of other samples are in the interval corresponding to the different risk levels. Thus, it is convenient to determine the risk levels of the samples (large-scale sports events). As is shown in Table 5, the recognition accuracy of the 15 simulation samples is above 86.7%.
Now, we take the samples SS4 and SS5 to analyze the rationality of the established BPNN model results and determine their risk levels. Taking each indicator value of the sample numbered S3 in Table 1 as the reference sample, if we only change one indicator value by increasing +1 each time, we will have 12 samples. Compared with the output value of the sample SS3, the increments and decrements in the output value of these samples are −0.0046, −0.0220, −0.0248, 0.0021, 0.4512, 0.1769, −0.0133, −0.0326, 0.4485, −0.0300, 0.0000, and 0.1223, respectively. That is, the indicators , , , and significantly affect the output values of the established BPNN model. The nonlinear relationship between the score (obtained through surveys or experts, and in the range [1, 5]) of the indicator and the output value (risk level) of the established BPNN model is shown in Figure 1. Similarly, we can obtain the nonlinear relationship between other indicators and the output values of the BPNN model. Due to the interactions among the various indicators, the change in the output value of the sample SS4 in Table 5 according to the established BPNN model is less than the simple sum of the above-mentioned increments and decrements. Since the output value of the sample SS4 in Table 5 is closer to the mild-risk interval than to the moderate-risk interval (0.2148 vs. 0.2986), we can judge the sample as the mild-risk level.
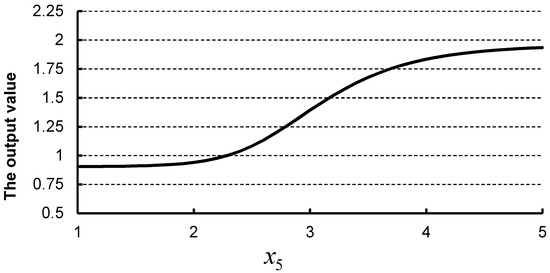
Figure 1.
The nonlinear relationship between the score (obtained through surveys or experts, and in the range [1, 5]) of the evaluation indicator and the output value (risk level) of the established BPNN model.
Similarly, after we change each indicator value of the sample SS5 in Table 5 by one unit, the increments and decrements of the established BPNN model output values are respectively 0.0053, −0.0084, −0.0001, −0.0207, 0.0713, 0.0482, 0.0115, 0.0000, 0.1616, −0.0165, 0.0000, and −0.0232. We found that the change in the output value of sample SS5 is greater than the simple summation of the above increments and decrements. As shown in Figure 2, the relationship between the indicator and , and the established BPNN model output value is nonlinear. For indicators and , the simple sum of the model increments is 0.2329, but the corresponding joint increment of the established BPNN model reaches 0.6812, indicating that there is a significantly obvious mutual influence. The output value of sample numbered 5 is 1.7443, which is very close to the lower bound of the moderate-risk interval. Therefore, we judge the sample SS5 in Table 5 as having a moderate-risk level. In fact, the samples SS4 and SS5 in Table 5 are also correctly determined according to the close proximity to the adjacent risk-level intervals.
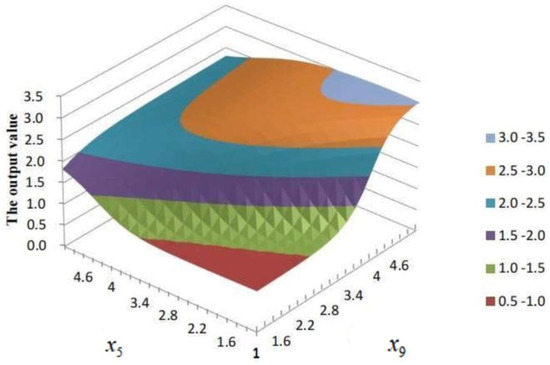
Figure 2.
The nonlinear relationship between the indicator and , and the output value of the established BPNN model.
According to the results of the sensitivity analysis and the nonlinear relationship between the risk and the indicator, we can rank the importance of the indicators, and the effect or the joint effect of each indicator or pair of indicators. From the cognition accuracy of the 15 simulation samples, we can conclude that the established BPNN model possesses enough accuracy and robustness.
6. Discussions
6.1. How to Establish a Robust BPNN Model
Insufficient samples pose difficulties for this research. It is impossible to split these 28 samples into a training dataset, validation dataset, and testing dataset. For example, the network connection weight of the BPNN model with a network structure topology of 12-2-3 is 35, which is greater than 28. Without validation data to monitor the training process in real time, overtraining can easily occur.
Taking the mean values of samples of the three types of risk levels as the validation samples, we used SNN software to train 28 original samples. Our investigation revealed the following problems. (1) If the number of neuron nodes in the hidden layer is larger than 3, the RMSE of the established BPNN model can be quickly reduced to 0, and the error of the validation samples is very unstable (i.e., the error is sometimes large and sometimes small). (2) When the network structure topology 12-1-3 is adopted, the training error is very large, and the recognition accuracy of the 28 samples is very low. When the network structure topology 12-2-3 is used (the number of network connection weights is 35 and still greater than the number of training samples), the RMSE of the established BPNN model can be less than 0.005. (3) Although the convergence RMSE of the BPNN model was set to be 0.005, the results of the established BPNN models were unstable. We took sample A~D as the typical examples. Sample A was the sample number 13 in Table 5. All indicator values of the sample B are equal to 2. All the values of samples C and D are equal to 3 and 4, respectively. We trained the BPNN model many times for the above 28 samples; when the RMSEs of the BPNN model were less than 0.005, we obtained four different BPNN models, which are Case 1 to Case 4 shown in Table 6.
Table 6.
A comparison of the output values and risk levels of the four established BPNN models with the four typical samples.
Comparing the results of the established BPNN models with the four cases in Table 6, we find that although the RMSEs of the established BPNN models are very small and approximately equal to each other, the output results of the same sample can vary greatly. For example, for sample B, the risk levels of Cases 1, 2, and 4 are all mild-risk, whereas that of Case 3 is severe-risk. For sample C, the risk levels of Cases 1 and 2 are both moderate-risk, whereas the risk levels of Cases 3 and 4 are severe-risk and mild-risk, respectively. In addition, for sample C of Case 2, the output values of the three nodes in the output layer are approximately the same and far less than 0.50. It is thus very difficult to determine the risk level of sample C. In practice, it is very difficult to determine the risk levels of the samples in the case of the Exclusive-Or problem of risk assessment [14,15]. For example, we can set the three risk levels as an Exclusive-Or problem, in which a positive classification is marked by a 1 in the output node (variable), and a negative classification by a 0. In this example, there is a three-value nominal output, and one-of-N coding. The values for the first risk level are (1, 0, 0), the second level (0, 1, 0), and the third level (0, 0, 1). The question is: how can we judge the risk level if the output values of the three nodes in the output layer are (0.333, 0.333, 0.333), or (0.500, 0.500, 0.000), or (0.500, 0.000, 0.500), etc.? For a BPNN model with multiple neuron nodes in the output layer, it is theoretically convenient to determine the risk level of the sample and actually very difficult to judge the real risk level of the sample. For sample B under Case 3, the output values of the three nodes in the output layer corresponding to the mild-risk, the moderate-risk, and the severe-risk levels are 0.3796, 0.0027, and 0.5483, respectively; the meaning of the results is thus not able to be explained or judged unambiguously. Our further experiments show that even if the RMSEs of the established BPNN models are as small as 0.0025, the evaluation results of the above four samples could still be very different (the detailed specific results are omitted and available upon request). For example, according to the established BPNN models, we judge the risk level of sample B as severe-risk in some cases and as mild-risk in the other cases.
To summarize, theoretically, if the number of network connection weights is greater than the number of training samples, and no validation samples are applied to check the training process to avoid overtraining, the established BPNN models are naturally and certainly unreliable and do not have good generalization. According to the above 28 samples only, a reasonable and reliable BPNN model cannot be established. If multiple neuron nodes in the output layer are used in the BPNN model, the output results of the BPNN model are usually ambiguous and difficult to interpret.
In theory, if we follow the basic principles and steps for BPNN modeling described in Section 3, then we can establish a robust BPNN model with good generalization performance and practical value, and we did so in this study. In practice, we firstly generate the sufficient number of samples according to the 28 actual samples with white noise. Secondly, the samples are randomly divided in the proportions 3:1:1 between the training, validation, and testing datasets (541, 180, and 180, respectively) without bias. We ensure the network structure topology is as compact as possible, and that there are at least five times (preferably, ten times) as many data points in the training dataset as the number of connection weights in the network topology. We compare the training error with various neurons in the hidden layer. The performance of the BPNN model with two hidden neurons is good enough. Thirdly, we overcome the main limitation of BPNN model, which is that overtraining or overfitting can easily occur in the training process. We apply a validation dataset to cross-verify the training process to check and stop training when the validation error starts to rise. Fourthly, the BPNN model is only likely to generalize well if the validation error is reasonably close to that of the testing dataset. If there is a significant discrepancy between the validation and test errors—that is, the validation error is always significantly higher than the test error, or vice versa—the three subsets must be reassigned. If the validation and test errors are reasonably consistent, one can be reasonably confident that the established network will generalize effectively. In this paper, we established the BPNN models with RMSEs of 0.0793, 0.0799, and 0.0811, and the average absolute errors (AAEs) were 0.0625, 0.0630, and 0.0642 for the training, validation, and testing datasets, respectively. The performance values of the testing dataset were similar to those of the training data and validation data. Thus, the established BPNN model has strong generalization and predictive ability, which reveals the inherent law of the training dataset, the validation dataset, and the testing dataset.
6.2. How to Reduce the Risk of Hosting Large-Scale Sports Events
In theory, decreasing the indicator value of the most important indicator with the maximum weight is the most effective scheme to decrease the risk level of hosting large-scale sports events. According to the results shown in Table 4, the most efficient measures to decrease the risk level of the sports events consist firstly of reducing the value of the indicator, then reducing the value of the indicator, etc. However, due to the complex non-linear relationship between the indicator value and the risk level of the sports events, for a specific case, we should analyze the most effective comprehensive measures for decreasing the risk level of the sports events based on the established BPNN model. Assuming the same cost of decreasing one unit for each indicator, we should first analyze the impact of each indicator on the risk level of the sports events, and then analyze the comprehensive impact of the two indicators, etc., to formulate effective measures and recommendations. We take a sample with all indicator values being 2 as an example; the output value of the established BPNN model is 1.8351, indicating the moderate-risk level. By sequentially applying −1 or +1 to each indicator value, we obtain 24 simulation samples. The changes in the output values of the established model are given by −0.1136, 0.1171, 0.3592, −0.3735, 0.1468, −0.2316, 0.3818, −0.3362, −0.7371, 0.3863, −0.7026, 0.6816, −0.2834, 0.2924, 0.1081, −0.4210, −0.8685, 0.9061, 0.6594, −0.6481, 0.1579, −0.1524, −0.1037, and −0.0745. From the above results, we firstly find that when the value of the indicator is decreased from 2 to 1, the output value of the established BPNN model drops from 1.8351 to 0.9665, indicating that the risk level of the sample is no longer the moderate-risk level, but becomes the mild-risk level. Secondly, when the value of the indicator decreases from 2 to 1, the BPNN model output value drops from 1.8351 to 1.0981, indicating that the risk level of the sample also becomes the mild-risk level. Thirdly, if the values of both the indicators and change from 2 to 1, the BPNN model output value drops from 1.8351 to 0.9399, and the risk level of the sample becomes the mild-risk level. Similarly, when the value of the indicator increases from 2 to 3, the BPNN model output value changes from 1.8351 to 2.7411; that is, the risk level of the sample changes from the moderate-risk level to the severe-risk level. When the value of the indicator increases from 2 to 3, the BPNN model output value increases from 1.8351 to 2.5166, indicating that the risk level of the sample also increases from the moderate-risk level to the severe-risk level. If the values of the indicators and increase from 2 to 3, the BPNN model output value increases from 1.8351 to 2.8479, indicating that the risk level of the sample changes from the moderate-risk level to the severe-risk level. Conversely, when the values of the indicators , , , and decrease from 2 to 1, the BPNN model output value does not decrease but increases, indicating that the risk levels of the sample do not decrease but increase. The results of these simulation examples show that the impact of different indicators on the risk level of the large-scale sport events is usually different. Some indicators have positive impacts on the results, and other indicators have negative impacts. If we take the inappropriate measures, the risk level of the larger-scale sport events will not decrease but increase. It is important to adjust the indicators that are the most conducive to decreasing the risks of hosting large-scale sports events.
In practice, the host of the LSSE should invite an expert panel (as a group) to assess the risk level. According to the evaluation system, the expert panel investigates the hosting conditions and obtains the scores of all indicators. Then, the expert panel obtains the risk level of the LSSE according to the BPNN model established above. Furthermore, it is efficient and effective for the host of the LSSE to adjust the indicators’ values that are the most conducive to reducing the risk level of hosting the LSSEs with relatively low cost, so as to achieve twice the result with half the effort; otherwise, half the result is achieved with twice the effort. The management department of the LSSE can supervise and check the preparatory work of the host and then also implement improvement measures according to the above-established BPNN model.
6.3. Comparison with Clustering Methods
Although the risk levels of the actual 28 samples are judged by the experts and the problem is a supervised training problem, we still tried to classify the samples using k-means cluster and hierarchical cluster analysis algorithms. We applied the DPS software to classify the 28 actual samples into three categories using the above analysis algorithms [31]. The recognition accuracy was 82.1%, that is, samples S3, S4, and S5 in the mild-risk level were mistaken as being in the severe-risk level, sample 21 in the moderate-risk level was mistaken as being in the severe-risk level, and sample 27 in the severe-risk level was mistaken as being in the moderate-risk level. The results show that the 28 actual samples cannot be correctly classified by applying cluster analysis algorithms. This again means the relationship between the scores of the indicators and the risk level is obviously nonlinear.
6.4. The Limitation of the Study
Although the generated samples are in good agreement with the actual samples, the generated samples are not the facts, so the limitation of the study is that the established BPNN model needs to be tested and checked using more actual large-scale sports. Second, we established a support vector machine (SVM) model and random forest (RF) model with the same data. In fact, the results using SVM and RF were qualitative and quantitative using the BPNN model. There was a difference between them.
7. Conclusions and Future Research
In this article, we established a BPNN model with a network structure topology of 12-2-1 for risk level assessment and early warning for hosting large-scale sports events. The network structure topology is compact enough, and the size of the training dataset was more than 3–5 times the number of network connection weights. We used validation samples to monitor the training process in real time to avoid overtraining. This established BPNN model thus has good generalization performance and practical value. Our research shows that the recognition accuracy of the three types of 28 actual samples is 100%, and is 86.7% for the 15 simulation samples. The established BPNN model reveals the non-linear relationship between each indicator value (or multiple indicator values) and the output value (risk level) of the established BPNN model. According to the results of sensitivity analysis, we determined and ranked the importance of each indicator, and the risk levels of the samples. Of the 12 indicators, indicator is the most important, indicator is ranked second, and indicator is least important. Of the 28 actual samples, S8 possess the highest risk, S14 the second highest, and S24 the least. Our research provides a theoretical basis to establish a robust BPNN model, and the established BPNN model can be used to predict and reduce the risk level of hosting large-scale sports events in practice.
According to the 28 actual samples, we generated 901 samples by adding a random value obeying a normal distribution with zero mean value and standard deviation of 0.4, and the output value with zero mean value and standard deviation of 0.2. We divided the 901 sample data points into a training dataset, validation dataset, and testing dataset, with similar characteristics of almost equal mean values and variations.
We analyzed and monitored the change in the RMSEs of the training dataset and the validation dataset in the training process of the BPNN model with 28 original samples. We found that the number of network connection weights is greater than the number of training samples and the established BPNN model has an excessively large network structure topology, which makes the BPNN model prone to overtraining easily. If no validation samples are used to monitor the training process in real time, overtraining easily occurs and is unavoidable. Our training experiments proved that the established BPNN models often have completely different results even when the RMSEs are small enough, indicating that the established BPNN model does not have a good generalization performance and practical values.
To build an effective BPNN model with good generalization performance, we need to follow the modeling principles and the basic steps. In addition, due to the various initial connection weights, the established BPNN model is non-unique. The established BPNN model we built is only one of the feasible models. If the network structure topology is compact, the possibility of overtraining in the training process is low. We can also take the connection weights before the occurrence of the overtraining as the last results of the established BPNN model. The RMSE of the testing dataset should be similar to the RMSE of the training dataset and the validation dataset. Otherwise, the results of the established BPNN model are not reliable, reasonable, or practical, and, thus, the established BPNN model will produce results with poor generalization.
In general, the greater the number of actual samples are, the more reliable the established BPNN model. Therefore, if possible, we will gather more samples. Furthermore, we should try to generate samples with greater variance added to indicators and the output variable to study whether the robustness of the established BPNN model can be improved. Thirdly, we will apply the established BPNN model to predict and reduce the risk level for hosting actual large-scale sports events.
Author Contributions
Conceptualization, C.Z., W.L. and C.W.; Methodology, C.Z., W.L. and C.W.; software, W.L.; writing—original draft preparation, C.Z., W.L. and C.W.; writing—original draft, C.Z., W.L. and C.W.; writing—review and editing, C.Z., W.L. and C.W. All authors have read and agreed to the published version of the manuscript.
Funding
This research received no external funding.
Institutional Review Board Statement
Not applicable.
Informed Consent Statement
Not applicable.
Data Availability Statement
The data that support the findings of this study are available from the author W.L. upon request.
Conflicts of Interest
The authors declare no conflict of interest.
References
- Security and Policing. In U. K. Sport, Staging Major Sports Events: The Guide. Available online: http://www.uksport.gov.uk/pages/major_sports_event_the_guide (accessed on 8 March 2022).
- Stevens, A. Sports Security and Safety: Evolving Strategies for a Changing World; Sport Business Group: London, UK, 2007. [Google Scholar]
- Cleland, J. Sports Fandom in the Risk Society: Analyzing Perceptions and Experiences of Risk, Security and Terrorism at Elite Sports Events. Sociol. Sport J. 2019, 36, 144–151. [Google Scholar] [CrossRef]
- Ludvigsen, J.A.L.; Parnell, D. Redesigning the Games? The 2020 Olympic Games, Playbooks and new sports event risk management tools. Manag. Sport Leis. 2021, 1–13. [Google Scholar] [CrossRef]
- Bittencourt, N.F.; Meeuwisse, W.H.; Mendonça, L.D.; Nettel-Aguirre, A.; Ocarino, J.M.; Fonseca, S.T. Complex systems approach for sports injuries: Moving from risk factor identification to injury pattern recognition—narrative review and new concept. Br. J. Sports Med. 2016, 50, 1309–1317. [Google Scholar] [CrossRef] [PubMed]
- Baker, T.A.; Chen, S.Y. Risks and management of mega sporting events-views from abroad. J. Shanghai Univ. Sport 2015, 39, 6–11. [Google Scholar]
- Sun, Q.Z.; Liu, H.J.; Zhou, S.W. Application of metasynthesis approach in risk management of Large-scale sports events. J. Sports Sci. 2010, 31, 93–96. [Google Scholar]
- Zhu, H.G.; Wu, C. A study on the risk assessment for major sports events—A case study from Nanjing Youth Olympic Games. J. Sports Sci. 2013, 34, 22–26. [Google Scholar]
- Shi, Y.; Niu, N.N. A comparative analysis of the risk assessment methods in China sports field. J. Sports Sci. 2014, 35, 54–58. [Google Scholar]
- Liu, Y.Y.; Fan, C.W. Index system construction for pre-warning management of emergency in mega-sporting Events. J. Xi’an Phys. Educ. Univ. 2010, 27, 525–527. [Google Scholar]
- Liu, J.; Sun, Q.Z. Construction of pre-warning system of the risk operation of major sports events. Sport Sci. Res. 2007, 28, 55–57. [Google Scholar]
- Pu, B.W.; Jia, H. Structure equation modeling and empirical study on risk assessment of large sports events. China Sport Sci. Technol. 2018, 54, 51–58. [Google Scholar]
- Huo, D.L.; Chou, H.; Chou, J. Risk early-warning and coping strategies of major sports events. J. Shenyang Sport Univ. 2014, 3, 6–11. [Google Scholar]
- Liang, H.W.; Yuan, Y.D.; Xue, H.W. Risk early warning model of sports events based on BP neural network. Stat. Decis. 2018, 16, 85–88. [Google Scholar]
- Zhang, H.J.; Li, Y.L.; Zhang, H.L. Risk early warning safety model for sports events based on back propagation neural network machine learning. Safety Sci. 2019, 118, 332–336. [Google Scholar] [CrossRef]
- Rehman, K.U.; Çolak, A.B.; Shatanawi, W. Artificial Neural Networking (ANN) Model for Convective Heat Transfer in Thermally Magnetized Multiple Flow Regimes with Temperature Stratification Effects. Mathematics 2022, 10, 2394. [Google Scholar] [CrossRef]
- STATISTICA Neural Networks; StatSoft, Inc.: Tulsa, OK, USA, 2011.
- Shi, Y.; Han, L.Q.; Lian, X.Q. Method and Example Analysis of Neural Network Design; Beijing University of Posts and Telecommunications Press: Beijing, China, 2009. [Google Scholar]
- Shaikhina, T.; Khovanova, N.A. Handling limited datasets with neural networks in medical applications: A small-data approach. Artif. Intell. Med. 2017, 75, 51–63. [Google Scholar] [CrossRef]
- Lou, W.G.; Qiao, L. Early warning model of financial risks and empirical study based on neural network. Financ. Forum 2011, 11, 52–61. [Google Scholar]
- Lou, W.G. Evaluation and prediction of soil quality based on artificial neural network in the Sanjiang Plain. Chin. J. Manag. Sci. 2002, 10, 79–83. [Google Scholar]
- Haykin, S. Neural Networks and Learning Machines; China Machine Pres: Beijing, China, 2009. [Google Scholar]
- Zhang, G.; Patuwo, E.; Hu, M. Forecasting with artificial neural networks: The state of the art. Int. J. Forecast. 1998, 35–62. [Google Scholar] [CrossRef]
- Ramos-Pérez, E.; Alonso-González, P.; Núñez-Velázquez, J. Multi-Transformer: A New Neural Network-Based Architecture for Forecasting S&P Volatility. Mathematics 2021, 9, 1794. [Google Scholar] [CrossRef]
- Min, A.; Scherer, M.; Schischke, A.; Zagst, R. Modeling Recovery Rates of Small- and Medium-Sized Entities in the US. Mathematics 2020, 8, 1856. [Google Scholar] [CrossRef]
- Abdellatif, M.; Atherton, W.; Alkhaddar, R.; Osman, Y. Flood risk assessment for urban water system in a changing climate using artificial neural network. Nat. Hazards 2015, 79, 1059–1077. [Google Scholar] [CrossRef]
- Doan, Q.H.; Le, T.; Thai, D.-K. Optimization strategies of neural networks for impact damage classification of RC panels in a small dataset. Appl. Soft Comput. 2021, 102, 107100. [Google Scholar] [CrossRef]
- Joshi, S.N.; Pande, S.S. Intelligent process modeling and optimization of die-sinking electric discharge machining. Appl. Soft Comput. 2011, 2743–2755. [Google Scholar] [CrossRef]
- Hadavandi, E.; Mostafayi, S.; Soltani, P. A Grey Wolf Optimizer-based neural network coupled with response surface method for modeling the strength of siro-spun yarn in spinning mills. Appl. Soft Comput. 2018, 72, 1–13. [Google Scholar] [CrossRef]
- Hijazi, A.; Al-Dahidi, S.; Altarazi, S. A novel Assisted Artificial Neural Network Modeling Approach for Improved Accuracy Using Small Datasets: Application in Residual Strength Evaluation of Panels with Multiple Site Damage Cracks. Appl. Sci. 2020, 10, 8255. [Google Scholar] [CrossRef]
- Tang, Q.Y.; Zhang, C.X. Data Processing System (DPS) software with experimental design, statistical analysis and data mining developed for use in entomological research. Insect Sci. 2013, 20, 254–260. [Google Scholar] [CrossRef]
Publisher’s Note: MDPI stays neutral with regard to jurisdictional claims in published maps and institutional affiliations. |
© 2022 by the authors. Licensee MDPI, Basel, Switzerland. This article is an open access article distributed under the terms and conditions of the Creative Commons Attribution (CC BY) license (https://creativecommons.org/licenses/by/4.0/).