Abstract
The mechanical status of the cervix is a key physiological element during pregnancy. By considering a successful induction when the active phase of labor is achieved, mapping the mechanical properties of the cervix could have predictive potential for the management of induction protocols. In this sense, we performed a preliminary assessment of the diagnostic value of using shear wave elastography before labor induction in 54 women, considering the pregnancy outcome and Cesarean indications. Three anatomical cervix regions and standard methods, such as cervical length and Bishop score, were compared. To study the discriminatory power of each diagnostic method, a receiver operating characteristic curve was generated. Differences were observed using the external os region and cervical length in the failure to enter the active phase group compared to the vaginal delivery group (p < 0.05). The area under the ROC curve resulted in 68.9%, 65.2% and 67.2% for external os, internal os and cervix box using elastography, respectively, compared to 69.5% for cervical length and 62.2% for Bishop score. External os elastography values have shown promise in predicting induction success. This a priori information could be used to prepare a study with a larger sample size, which would reduce the effect of any bias selection and increase the predictive power of elastography compared to other classical techniques.
MSC:
62P10
1. Introduction
The past decade has seen a renewed importance in the diagnostic power of elastography in the field of obstetrics and gynecology [1,2]. Efforts have been directed mainly towards the mechanical characterization of the cervix, identified as the key physiological element during pregnancy [3,4]. Whilst important evidence has been identified as biomechanical indicators in the remodeling process of preterm birth, such as the overall tissue softening as pregnancy progresses, no reliable diagnostic thresholds have been established [5,6]. Conversely, few studies have addressed the success of labor induction from a mechanical perspective [7,8]. Induction of labor (IOL) is one of the most frequently performed obstetric procedures in the world (rates vary from 6.8 to 33% in Europe [9]). It is generally indicated when the expected outcomes are better than waiting for the spontaneous onset of labor [10]. Several factors, such as cervical and membrane status, parity, patient and provider preference, may influence the choice of method for IOL [11], which could be either pharmacological or mechanical. However, research studies comparing the safety and effectiveness of different methods of cervical ripening are inconsistent, such that the optimal approach for labor induction is considered an open issue [12].
Clinical research is focusing on the identification of indicators able to identify women at risk of induction failure, such as biomarkers based mainly on ultrasonography, including cervical angle, head position, head-to-perineum distance, angle of progression or cervical length (CL), with conflicting results [13]. Despite its low predictability, the obstetric history along with the modified and subjective Bishop Score (BS) remains the standard for the success of the induction process [14,15]. This technique prevails mainly because the works on elastography, the most promising alternative, have not reached yet a common framework. Most of the literature on this matter is based on strain elastography (SE). Stiffer tissues deform less than softer ones. By comparing the relative deformation between the target area and its surroundings before and after manual compression, semi-quantitative information on the mechanical state can be obtained [16]. However, the cervix is not surrounded by a well-defined mechanical reference tissue, as might be the case with the breast and its surrounding fat, plus the choice of the type of strain, especially during softening, means that an accurate strain map is not a simple task to achieve [17]. Furthermore, considerable care must be taken since the applied force by the operator is unknown; the strain could be a mere reflection of this force, and the possible nonlinear effects due to the high strain during the process of measurement could bias the interpretation of results [18]. Some authors have proposed to standardize the force by reaching a maximum compression state of some part of the tissue [19], but then it is not clear if the values come from histological changes or most likely from prestressing or nonlinear factors [3,20].
One of the most prominent forms of dynamic elastography is shear wave elastography (SWE), a quantitative modality, which is operator-independent during excitation and capable of exploring deep cervix regions [21]. The physics behind this technique are based on the measurement of the propagation speed of a shear wave generated inside the tissue. Higher speeds are an indication of higher stiffness [22]. As opposed to the liver and breast, which are regarded as homogeneous soft tissues with clear established elastography protocols [23,24], the cervix is a heterogeneous tissue with marked anisotropy [4]. This implies that many elasticity assumptions are violated and values should not be trusted; therefore, only speed measurements should be studied [25]. In addition, very recent studies are further highlighting the potential objective assessment of SWE if monitored over time [26].
Due to the advantages of SWE over SE and the scarce studies performed using the former method during the induction process, the purpose of this preliminary study was to take advantage of the potential of this technique to evaluate differences in shear wave speed (SWS) measurements before labor induction. For that, we considered the pregnancy outcome and Cesarean indications. This allowed us to explore its predicting potential and reliability for the induction success, with the intention of supporting clinical judgment with protocols more suitable for each woman. Likewise, these results will guide the steps of a future study with a much larger sample size.
2. Materials and Methods
2.1. Study Design
This prospective observational study was carried out between December 2018 and November 2019 in pregnant women from 34 weeks of gestation admitted to the Obstetrics Unit for IOL by medical indication. The following inclusion criteria were established: age over 18 years old, simple pregnancy, vertex presentation of the fetus, and absence of uterine dynamics. Fetal defects detected during pregnancy control or a non-viable fetus (stillbirth) were considered exclusion criteria.
To identify factors affecting the delivery outcome, the gestational age at the time of elastography and maternal characteristics were recorded, as well as indication of labor induction and induction method.
2.2. Cervical Evaluation
Before the cervical assessment, women were asked to empty their bladder. Then, they were placed in dorsal lithotomy for a transvaginal scan of the cervix using the vaginal probe PVT- 781VT of the Canon Aplio i700 Ultrasound Machine (Canon Medica Systems Corporation, Otawara, Japan). The midsagittal view of the cervix was identified by aligning the probe with the cervical canal. The internal and external os were visualized with a magnification of the image following criteria of transvaginal sonography cervical assessment, firstly for CL, and then for SWE. Measurement of CL was performed in the B-mode at 7 MHz presentation following the protocol of the Fetal Medicine Foundation [27].
The device provided 2D tissue elastography with ShearWave technology. The SWE technique involved the generation of a focused ultrasonic beam, which created shear waves in a plane perpendicular to the beam after the tissue relaxation. These waves induced displacements in the lateral direction, which were tracked in a region of interest (ROI) by high frequency plane wave sequences of 7.5 kHz. The shear wave speed was reconstructed for each point of the map by considering the arrival time between two adjacent horizontal points and their distance [28]. Several smart maps were superimposed on the B-mode to support visualization quality. With the measurement area detection, a speed overview was obtained as the full ROI was divided into small regions, each of them with their own average and variability (Figure 1). With the propagation map, regions of parallel lines indicated higher reliability since the reconstruction algorithm performed better in these cases. An ROI of 5 mm of diameter (Q-box) was placed in the anterior region of the external os when the elastography signal was considered optimal by visual assessment of the variability in the propagation map and then in the anterior region the internal os (Figure 1). The anterior regions of the cervix were selected since they are believed to be the most relevant area during pregnancy remodeling [29]. Additionally, in this study, an average speed of the entire section of the box spanning the external os to the internal os was obtained. The system used the continuous method to take each measurement as a composition of sequential images that were averaged to cut out unwanted artifacts, such as breathing or arterial pulsations, and to reduce random noise. The ultrasound system direclty reported the SWS.
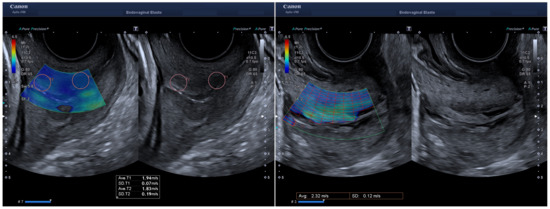
Figure 1.
Shear wave speed measurement working on continuous mode. On the left a sampling box spanning the entire sagittal view of the cervix was placed for analysis. The ROIs of 5 mm (Q-box) are identified and correspond to the anterior part of the external and internal os. The figure on the right side shows the measurement area detection with the average speed value for the selected box that corresponds to what we called cervix box region.
Both measurements, CL and SWS, were carried out twice by the same operator for each woman by repositioning the transducer between measurements, which were averaged for posterior analysis, and three different operators formed part of the study. To reduce nonlinear mechanical effects and a biased preloaded state [3], very gentle pressure was applied. An independent clinician recorded the elastography values since all participating operators were blinded to these results. And thereafter, the Bishop test was performed by digital examination [30].
2.3. Induction Procedures
The decision on the method of IOL was based on local guidelines [31]. For BS ≥ 6, amniotomy and/or oxytocin infusion was indicated. For BS < 6, in women with previous Cesarean or uterine scar, a Cook Cervical Ripening Balloon was inserted. In other cases, cervical ripening was attempted by vaginal administration of a misoprostol 25-microg tablet (Misofar, Pfizer, New York, NY, USA) in intervals of 4–6 h, up to a maximum of 6 tablets; or application of dinoprostone 10-mg vaginal insert (Propess, Ferring Pharmaceuticals, Kiel, Germany), depending on the risk of hyperstimulation. Local guidelines consider pregnant women with high risk of hyperstimulation those with previous Cesarean section or uterine surgeries because of the significantly increased risk of uterine rupture. Likewise, this is true of cases of intrauterine growth restriction, prematurity, severe preeclampsia, oligohydramnios, or uterine hyperdistention. The induction method chosen was not biased by the results of elastography.
Our protocol regarding the management of the second stage of labor is based on clinical practice [31]. The guidelines state that, depending on the parity and the use of epidural anesthesia, 1 to 4 h is considered a reasonable duration. However, the guidelines also indicate that the duration of this stage of labor by itself [32], is not an indication to terminate labor if the maternal-fetal well-being allows it, so in some cases this stage can be prolonged.
Successful induction of labor was defined as the accomplishment of cervical effacement and at least 4 cm dilation, even after oxytocin use. Thus, failure to enter the active phase was defined as failure of the cervix to efface and dilate to 4 cm in 12 h after amniotomy or initiation of oxytocin infusion (doses were adjusted to achieve from three to five contractions every 10 min). Indications for Cesarean delivery were: prolonged labor (as explained previously); failure to progress in the active phase, defined as cervical dilation slower than 1 cm/h for 4 h during the active phase of labor; and immediate need for delivery due to maternal or fetal compromise.
2.4. Statistical Tools
Given the preliminary nature of the study, the sample size was previously estimated by regression power analysis. Using a significance criterion as two-sided = 0.05, with the desired power of 80%, and with a recommended medium effect size of ES = 0.30 [33], led to a sample size of n = 29. In our case, the sample size was higher (n = 54), which theoretically should increase the power.
Parametric assumptions were disregarded due to the sample size and the not yet well-established normality of elastography parameters in the cervix. Intraclass correlation coefficient (ICC, two-way mixed effects model) and their 95% confident intervals were calculated in order to verify the intraoperator reliability, based on recommended levels [34]. Bland–Altman plots were also generated. A comparison was made to evaluate the differences in the recorded sample features and diagnostic methods, comparing vaginal delivery against two groups of Cesarean indications. The failure to enter the active phase group was considered a failed IOL. The failure to progress in labor group was not considered a failed IOL, but we also compared it against the vaginal delivery group to explore the effect of the rest of the variables. Cases in which there was fetal or maternal risk were excluded from these analysis. This was because the decision to perform Cesarean section was not related to cervical status but evaluated in a very short time, during the induction procedure. The Mann–Whitney U test was used, and in the case of categorical variables, the Chi-squared test was chosen. To study the discriminatory power to detect failure in IOL for each diagnostic method, the receiver operating characteristics curve (ROC) was calculated with its corresponding area under the curve (AUC) and confidence intervals using the pROC package [35]. AUC reflects the discriminatory capacity of the method for successful IOL across the full range of possible cut-off points. Statistical significance was set at a two-tailed p-value of 0.05 for all tests. The variable values were presented as median (interquartile range) or occurrence (%). A multiple linear regression analysis was also performed in R in order to consider the potential of combination between US markers in ROC curves via fitting generalized linear models using caret package [36]. Data were analyzed using RStudio (Version 1.4.1717) and SPSS (Version 24), checking the results in both software.
2.5. Ethics
The study was conceived in terms of the Declaration of Helsinki. The Human Research Ethics Committee of the University of Granada and Health Research and Ethics Committee of the San Cecilio PTS University Hospital of Granada (1561-N-18) approved the study, and all recruited women agreed to participate in the study by signing the informed written consent.
3. Results
During the study period, 54 women met the inclusion criteria and agreed to participate. The data collected at the time of admission and delivery are summarized in Table 1. A distinction was made between women who had never previously given birth (nulliparous) and women who had given birth, regardless of the number of births (parous).

Table 1.
Sample summary features of the 54 women that participated in the study. Values are reported as median (range) or frequency N (%). BMI: body mass index.
Reasons for induction covered prolonged pregnancy (38.8%, n = 21), premature rupture of membranes (25.9%, n = 14), oligohydramnios (14.8%, n = 8), low-molecular weight heparin administration (5.6%, n = 3), intrauterine growth restriction (5.6%, n = 3), maternal pathology (5.6%, n = 3), and diabetes mellitus (3.7%, n = 2). The method of induction was chosen according to the internal guidelines described earlier. Either misoprostol (50.0%, n = 27) or dinoprostone (37.0%, n = 20) were administered, or a Foley catheter (13.0%, n = 7) was used. After the application of the corresponding method, 48.1% (n = 26) of the women needed a Cesarean section. The causes included induction failure by not being able to progress to the active phase (38.5%, n = 10), lack of labor progress (46.2%, n = 12), and complications in fetal wellbeing (15.3%, n = 4). These last four cases were not considered in the ensuing analyses as explained in the methodology.
Table 2 compares the possible significant differences of the sample variables collected and the diagnostic results with the delivery type, considering the causes of Cesarean section, with the vaginal delivery group as the comparing reference. It was observed that the distal parts of the cervix (external and internal os) showed less SWS than the averaging of the cervix box and that the internal os reported the lowest values. The internal os had the highest dispersion. Significant differences were found in the failure to enter the active phase group, namely, a lower SWS of the external os and cervical box, together with a higher CL (p < 0.05). As for the failure to progress in the labor group, higher newborn weight reflected a strong association (p < 0.01). These results should be cautiously interpreted.
Table 2.
Comparison of the examination results and the features of the population dividing the women into vaginal delivery (as reference) and different indications for Cesarean delivery. The test used in each in variable is indicated as Mann–Whitney U test and Chi-squared test. Values are reported as median (interquartile range) or N (%).
Since the SWS of the external os reflected the better predicting ability, we explored its values by observing the cesarean cause and the induction treatment used (Figure 2). No significant differences were found between any of the groups.
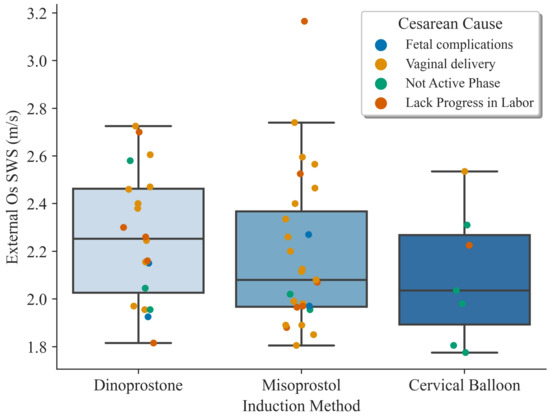
Figure 2.
Boxplots showing the shear wave speed results on the external os dividing the groups by induction treatment. The colored dots indicate the reason for the Cesarean section or if it was a vaginal delivery.
For the intraoperator reliability study, according to the ICC (Table 3), most of the measurements were indicative of good reliability. There was only a poor result for operator 2 on the internal os. Additionally, Bland–Altman plots collected the data adequately for each operator, as shown in Supplementary Figures S1–S3.
Table 3.
Intraclass correlation coefficients (ICC) for intraobserver reliability of shear elastography considering three cervical regions and three operators. Values are presented as coefficient (95% CI).
In addition, the ROC curve was analyzed in Figure 3 to explore the effectiveness of each method to predict induction success. The AUC for SWS was 68.9%, 65.2% and, 67.2% for external os, internal os and, cervix box, respectively, and 69.5% for CL and 62.2% for BS. The ability of elastography in the external os and CL to classify successful inductions obtained the highest values.
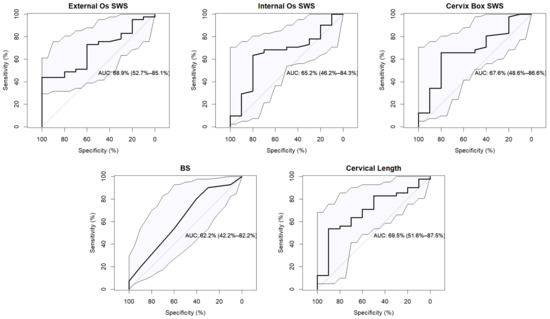
Figure 3.
Receiver operating characteristic (ROC) curve for each diagnostic method to predict successful IOL. The area under the curve (AUC) reflects the discriminatory capacity with the confidence intervals. The straight gray curve indicates the random classification model.
The odds ratios were calculated with confident interval and p-value associated. A logistic single linear regression analysis model was considered with the results showed in Table 4.
Table 4.
Odds ratios (OR) of shear elastography considering three cervical regions, Bishop score and cervical length. Values are presented as coefficient (95% CI) and with their p-values associated.
The potential of multiple linear logistic regression is also consider in this work. The resulting ROC curves show a better fit of 0.75, 0.79 and 0.74 of AUC for Internal os, External os, and cervix box respectively with cervical length as covariable. The Variance inflation factor was checked for all variables obtaining a value close to 1. See ROC curves in Figure 4.
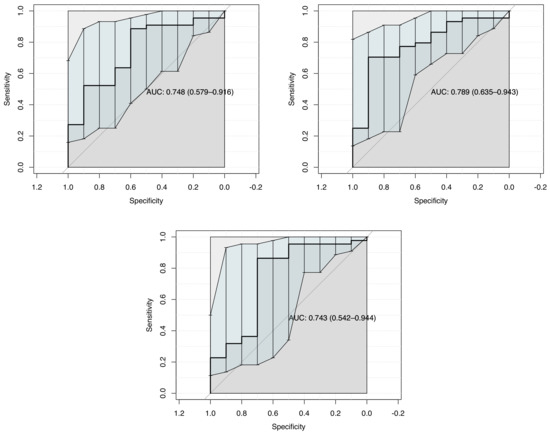
Figure 4.
ROC curve for Multiple Linear Logistic Regression modelization considering: Internal os, External os, Cervix box SWS each one with Cervical length as diagnostic method to predict successful IOL.
The same result has been also consider removing the measurements of operator 2. The main reason to avoid this three cases is the low ICC for intraobserver reliability as it is showed in Table 3. Thus, ROC curves show an AUC of 0.82, 0.86 and 0.79 Internal os, External os, Cervix box SWS each one with Cervical length as covariable. See the following Figure 5.
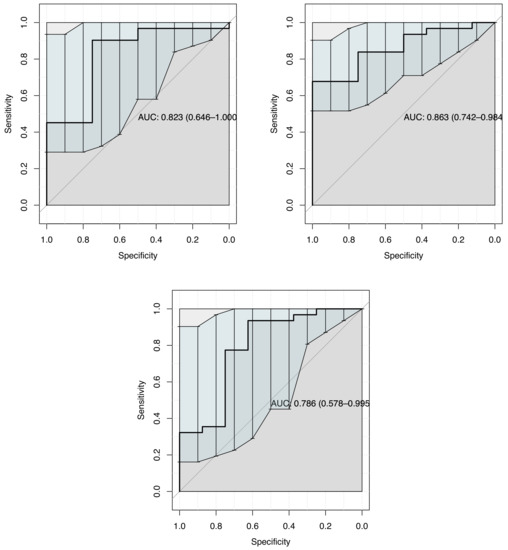
Figure 5.
ROC curves for Multiple Linear Logistic Regression, removing operator 2 measurements. It was consider Internal os, External os, Cervix box each one as cofactor independently with Cervical length as diagnostic method to predict successful IOL.
4. Discussion
As far as we know, this was one of the first studies on the use of commercial SWE during the induction process. The results on the SWS were consistent with other clinical research conducted in a similar state of pregnancy. Carlson et al. [7] found a shear wave speed ranging from 1.58 to 2.52 m/s in the pre-ripening state. Lu et al. [8] reported speed values in the inner, middle and outer part of the cervix ranging from 1.73 to 2.55 m/s (after data conversion assuming incompressibility). The study aimed to assess the preliminary potential supporting capability of SWE to provide quantitative data and objective information on the mechanical state of the cervix through the SWS previous to the IOL. The main results revealed that the SWS of the external os and CL were relevant to predict failed IOL. In this sense, a larger CL and a lower speed of the anterior lip in the external os of the cervix implied that the active phase of labor was not reached. This was in contrast to the recent study by Lu et al. [8]. They used SWE prior to IOL to conclude that the internal os cervix had the highest stiffness and was an independent predictor for the failure to enter the active phase group.
Hernandez-Andrade et al. [29] also reported that the internal part was a better predictor. This suggests that the selection of the ROI needs to be carefully considered since there have been reports about different shear values along the cervix [4]. The cervix box values were significant in the failure to enter active phase group; however, they showed higher values and higher variability, probably because of an overestimation by including adjacent tissue mechanical contributions. Besides that, we observed a weak correlation between CL and SWE in all cervix regions (R2 < 0.25). This seemed to indicate that a short cervix did not necessarily have a lower SWS, as observed in many previous studies [2,37,38,39]. Although it is known that both parameters change near labor, their relationship remains obscure [2], but their combination could increase the diagnostic power [8]. A shorter cervix could be in a different pregnancy and remodeling state of the stromal microstructure, mainly dominated by collagen [40]. Therefore, even if a spatially similar ROI was selected, the comparison of the mechanical parameters could be inconsistent.
In the failure to progress in labor group, we did not find any significant results regarding the diagnostic methods used. This could be attributed to other clinical factors, such as parity, or the significant difference found in newborn weight, which could slow down this labor stage. Some variables showed an indication of significance, with p-values close to 0.05. This was the case for SWS in external os, and when considering BMI at delivery and whether they were nulliparous. In theory, increasing the sample size would show if these variables would be really relevant.
It is difficult to make a direct comparison with SE-based studies due to the disadvantages mentioned above; even so, it has been concluded that the technology is a good predictor of IOL success [16]. In a methodological comparative study, the authors found that nulliparous women had higher Cesarean delivery rates, lower BS and longer CL [41], which was in accordance with our results. In other studies with a similar sample size, the reliability of the techniques used was in compliance with our results [42,43]. However, as of yet, SE should be cautiously considered as a predictor of Cesarean delivery [44].
By observing Figure 2, we can visualize the distribution of the induction treatments and which was the delivery outcome. Women were not randomly assigned to one or the other type of cervical ripening method since the choice relied on the local protocol and on the physician decision. Therefore, we identified an important limitation of selection bias that we could not avoid and that could affect the conclusions of the study. Even so, it is possible to observe that in the two majority groups, there was a homogeneous distribution of cases. Interestingly, 5 of the 6 cases in which cervical balloons were used failed the IOL, not reaching the active phase. Avoiding this bias and using uniform inclusion criteria and protocols is a promising line of work. A recent study reported on the effectiveness of the IOL method used, where cervix elastography after the first prostaglandin application was associated with the prediction of IOL outcome [45].
It could be said that to some extent, the results of elastography have shown promise, but there are some considerations to be discussed. In any imaging technology, there is a learning curve whose slope depends on the underlying principle. In 2D dynamic elastography, not only does the imaging plane have to be positioned, but the excitation region must also be positioned. As detailed before, each operator decided when to capture values according to the propagation map, which could be a combination of visually undetectable artifacts. The intraoperator reliability should not solely be ascribed to the measurement protocol but to the difficulty of measuring satisfactorily in a very advanced state of pregnancy. The protocol included an endocavitary probe and the placement of the speculum, which significantly reduces the operator’s vision, who must rely on his/her experience. This assumes that operators with more experience would have had more reproducible results. Still, most values fall within the good criterion, but with wide confidence intervals. The special case of the SWS reported in the internal os by operator 2 had the worst values in the reliability study, which, as described below, was considered a challenging region. To examine the effect of these unreliable measures, we redid the tests shown in Table 2 and identified that the differences were significant with the same variables. We were unable to assess interoperator variability because the operators never matched the same woman, although this should be addressed in larger studies.
In general, the results obtained for the internal os presented a high dispersion, probably due to the high attenuation of the traveling wave. This could also be attributed to a higher density of tissue and microstructural complexity near the uterus [46], combined with a direct reception of mechanical and biochemical signals and a variable pressure of the fetus at the time of measurement [47]. Some technical considerations in wave propagation could affect the extracted values. Reflection and diffraction can appear due to interactions with the cervical canal or vaginal walls. The anisotropy of the cervix could also determine the velocity according to the angle of measurement [48]. Finally, although care was taken to keep the contact pressure as low as possible, the cervix could have been pre-stressed near the external os. If the results were influenced by nonlinearity effects [49], this could explain the small increase in the values recorded with respect to internal os.
The main limitation of this study was considering different obstetric records, reasons for admission and induction methods. Almost half of the women admitted (n = 26) had a Cesarean delivery. Given the small sample size, we could not define subgroups to explain the high rate of Cesarean section after induction of labor in each of them. There were many factors that could increase this rate [50]. This could justify, in part, the low discrimination power presented by all the methods and the few significant relations between variables. The labor of parous women took less time, which could affect the predictive efficiency of the methods. Special attention should be paid to the parity of the woman when exploring IOL outcomes. Additionally, the importance of the newborn’s weight could be obscured when the outcome considered is a Cesarean section. The correct interpretation of the results of the analysis is subject to the consideration of homogeneous data [51], which was not the case in our population. It should not be forgotten that as an exploratory study, the small sample size in each group meant that the results must be carefully interpreted. A study with a larger sample size will allow to perform a multivariate analysis with more selective inclusion criteria. We hypothesize that using a model that combines elastography measurements with CL could have a potential predictive value, consolidating a new diagnostic method.
These results are the first step towards a clinical study, where the a priori information obtained will optimize the number of cases. Further evaluation of SWE should include a prospective longitudinal study of each woman, at least after each pregnancy check-up, so that the SWE results could become a personalized metric to support the decision of the IOL approach. Measuring the pre- and post-induction cervix mechanical state will serve to investigate which is the best region to show changes, as well as the effectiveness of each induction treatment. In conclusion, it can be said that there is still a long way to go for SWE to enter routine clinical practice, and especially during labor induction. First of all, selection bias must be avoided in the groups considered, and there must be homogeneity in the clinical and obstetrical histories of the patients in order to begin to establish protocols and threshold values. A comprehensive understanding of biological and physical variability as well as data quality are required. The ROI should be carefully chosen, as this will depend on the operator ability and pregnancy or labor stage. Multivariate analysis increases the predictive power of the technique, so the best variables to combine in order to obtain a satisfying AUC should be studied. Elastography data in combination with biostatistical methods and biomechanical modelization can improve induction and many other open gynecological problems by refining diagnostics.
Supplementary Materials
The following supporting information can be downloaded at: https://www.mdpi.com/article/10.3390/math10173164/s1. Figure S1: Bland-Altman plots of the values of SWE in three considered cervical regions for operator 1; Figure S2: Bland-Altman plots of the values of SWE in three considered cervical regions for operator 2; Figure S3: Bland-Altman plots of the values of SWE in three considered cervical regions for operator 3.
Author Contributions
G.R., J.M., F.S.M. and O.O.-H. contributed to the research design; O.O.-H., F.S.M., M.M., M.D.C.P. and S.C. performed the measurements; J.T. and J.M. analysed the results; J.T., G.R., J.M. and O.O.-H. contributed to manuscript preparation. All authors reviewed the manuscript. All authors have read and agreed to the published version of the manuscript.
Funding
This research was funded by the Ministerio de Educación, Cultura y Deporte grant numbers DPI2017-83859-R, DPI2014-51870-R, UNGR15-CE-3664 and EQC2018-004508-P; Ministerio de Sanidad, Servicios Sociales e Igualdad grant numbers DTS15/00093 and PI16/00339; Ministerio de Ciencia e Innovación grant numbers PID2020-115372RB-I00, PYC20 RE 072 UGR; Instituto de Salud Carlos III y Fondos Feder; Junta de Andalucía grant numbers PI-0107-2017, PIN-0030-2017, IE2017-5537, B-TEP-026-UGR18 and P18-RT-1653; MCIN/AEI /10.13039/501100011033 grant number PRE2018-086085 (Co-funded by European Social Fund “Investing in your future”); and the Consejería de economía, conocimiento, empresas y universidad and P18-RT-1653 European Regional Development Fund (ERDF), ref. SOMM17/6109/UGR.
Institutional Review Board Statement
The study was conducted in accordance with the Declaration of Helsinki, and approved by the The Human Research Ethics Committee of the University of Granada and Health Research and Ethics Committee of the San Cecilio PTS University Hospital of Granada (1561-N-18) on October 2018.
Informed Consent Statement
Informed consent was obtained from all subjects involved in the study.
Data Availability Statement
The datasets generated and analysed during the current study are not publicly available due to local restrictions agreements but are available from the corresponding author upon reasonable request.
Conflicts of Interest
The authors declare no conflict of interest.
Abbreviations
The following abbreviations are used in this manuscript:
| SWE | Shear Wave Elastography |
| SWS | Shear Wave Speed |
| IOL | Induction Of Labor |
| CL | Cervical Length |
| AUC | Area Under Curve |
| BS | Bishop Score |
| SE | Static Elastography |
| ROI | Region Of Interest |
| ICC | Intraclass Correlation Coefficient |
| ROC | Receiver Operator Characteristics |
References
- Carlson, L.C.; Hall, T.J.; Rosado-Mendez, I.M.; Palmeri, M.L.; Feltovich, H. Detection of Changes in Cervical Softness Using Shear Wave Speed in Early versus Late Pregnancy: An in Vivo Cross-Sectional Study. Ultrasound Med. Biol. 2018, 44, 515–521. [Google Scholar] [CrossRef] [PubMed]
- Muller, M.; Aït-Belkacem, D.; Hessabi, M.; Gennisson, J.L.; Grangé, G.; Goffinet, F.; Lecarpentier, E.; Cabrol, D.; Tanter, M.; Tsatsaris, V. Assessment of the cervix in pregnant women using shear wave elastography: A feasibility study. Ultrasound Med. Biol. 2015, 41, 2789–2797. [Google Scholar] [CrossRef] [PubMed]
- Myers, K.M.; Feltovich, H.; Mazza, E.; Vink, J.; Bajka, M.; Wapner, R.J.; Hall, T.J.; House, M. The mechanical role of the cervix in pregnancy. J. Biomech. 2015, 48, 1511–1523. [Google Scholar] [CrossRef]
- Timmons, B.; Akins, M.; Mahendroo, M. Cervical remodeling during pregnancy and parturition. Trends Endocrinol. Metab. 2010, 21, 353–361. [Google Scholar] [CrossRef] [PubMed]
- Vink, J.; Mourad, M. The pathophysiology of human premature cervical remodeling resulting in spontaneous preterm birth: Where are we now? Semin. Perinatol. 2017, 41, 427–437. [Google Scholar] [CrossRef] [PubMed]
- Swiatkowska-Freund, M.; Preis, K. Cervical elastography during pregnancy: Clinical perspectives. Int. J. Womens Health 2017, 9, 245–254. [Google Scholar] [CrossRef]
- Carlson, L.C.; Romero, S.T.; Palmeri, M.L.; Muñoz del Rio, A.; Esplin, S.M.; Rotemberg, V.M.; Hall, T.J.; Feltovich, H. Changes in shear wave speed pre- and post-induction of labor: A feasibility study. Ultrasound Obstet. Gynecol. 2015, 46, 93–98. [Google Scholar] [CrossRef]
- Lu, J.; Cheng, Y.K.Y.; Ho, S.Y.S.; Sahota, D.S.; Hui, L.L.; Poon, L.C.; Leung, T.Y. The predictive value of cervical shear wave elastography in the outcome of labor induction. Acta Obstet. Gynecol. Scand. 2020, 99, 59–68. [Google Scholar] [CrossRef]
- Marconi, A.M. Recent advances in the induction of labor [version 1; peer review: 2 approved]. F1000Research 2019. [Google Scholar] [CrossRef]
- Shields, L.E.; Goffman, D.; Caughey, A.B. ACOG practice bulletin: Clinical management guidelines for obstetrician-gynecologists. Obstet. Gynecol. 2017, 130, e168–e186. [Google Scholar] [CrossRef]
- Mozurkewich, E.L.; Chilimigras, J.L.; Berman, D.R.; Perni, U.C.; Romero, V.C.; King, V.J.; Keeton, K.L. Methods of induction of labour: A systematic review. BMC Pregnancy Childbirth 2011, 11, 84. [Google Scholar] [CrossRef]
- Chen, W.; Xue, J.; Peprah, M.K.; Wen, S.W.; Walker, M.; Gao, Y.; Tang, Y. A systematic review and network meta-analysis comparing the use of Foley catheters, misoprostol, and dinoprostone for cervical ripening in the induction of labour. J. Obstet. Gynaecol. 2016, 123, 346–354. [Google Scholar] [CrossRef]
- Migliorelli, F.; Rueda, C.; Angeles, M.A.; Baños, N.; Posadas, D.E.; Gratacós, E.; Palacio, M. Cervical consistency index and risk of Cesarean delivery after induction of labor at term. Ultrasound Obstet. Gynecol. 2019, 53, 798–803. [Google Scholar] [CrossRef]
- Ezebialu, I.U.; Eke, A.C.; Eleje, G.U.; Nwachukwu, C.E. Methods for assessing pre-induction cervical ripening. Cochrane Database Syst. Rev. 2015, 6, CD010762. [Google Scholar] [CrossRef]
- Kolkman, D.G.; Verhoeven, C.J.; Brinkhorst, S.J.; Van Der Post, J.A.; Pajkrt, E.; Opmeer, B.C.; Mol, B.J. The bishop score as a predictor of labor induction success: A systematic review. Am. J. Perinatol. 2013, 30, 625–630. [Google Scholar] [CrossRef]
- Londero, A.P.; Schmitz, R.; Bertozzi, S.; Driul, L.; Fruscalzo, A. Diagnostic accuracy of cervical elastography in predicting labor induction success: A systematic review and meta-analysis. J. Perinat. Med. 2016, 44, 167–178. [Google Scholar] [CrossRef]
- Fruscalzo, A.; Steinhard, J.; Londero, A.P.; Frohlich, C.; Bijnens, B.; Klockenbusch, W.; Schmitz, R. Reliability of quantitative elastography of the uterine cervix in at - Term pregnancies. J. Perinat. Med. 2013, 41, 421–427. [Google Scholar] [CrossRef]
- Molina, F.S.; Gómez, L.F.; Florido, J.; Padilla, M.C.; Nicolaides, K.H. Quantification of cervical elastography: A reproducibility study. Ultrasound Obstet. Gynecol. 2012, 39, 685–689. [Google Scholar] [CrossRef]
- Fruscalzo, A.; Londero, A.P.; Fröhlich, C.; Meyer-Wittkopf, M.; Schmitz, R. Quantitative Elastography of the Cervix for Predicting Labor Induction Success. Ultraschall Med. 2015, 36, 65–73. [Google Scholar] [CrossRef]
- Mazza, E.; Parra-Saavedra, M.; Bajka, M.; Gratacos, E.; Nicolaides, K.; Deprest, J. In vivo assessment of the biomechanical properties of the uterine cervix in pregnancy. Prenat. Diagn. 2014, 34, 33–41. [Google Scholar] [CrossRef]
- Sigrist, R.M.; Liau, J.; Kaffas, A.E.; Chammas, M.C.; Willmann, J.K. Ultrasound elastography: Review of techniques and clinical applications. Theranostics 2017, 7, 1303. [Google Scholar] [CrossRef] [PubMed]
- Sarvazyan, A.P.; Rudenko, O.V.; Swanson, S.D.; Fowlkes, J.B.; Emelianov, S.Y. Shear wave elasticity imaging: A new ultrasonic technology of medical diagnostics. Ultrasound Med. Biol. 1998, 24, 1419–1435. [Google Scholar] [CrossRef]
- Barr, R.G.; Nakashima, K.; Amy, D.; Cosgrove, D.; Farrokh, A.; Schafer, F.; Bamber, J.C.; Castera, L.; Choi, B.I.; Chou, Y.H.; et al. WFUMB guidelines and recommendations for clinical use of ultrasound elastography: Part 2: Breast. Ultrasound Med. Biol. 2015, 41, 1148–1160. [Google Scholar] [CrossRef]
- Ferraioli, G.; Filice, C.; Castera, L.; Choi, B.I.; Sporea, I.; Wilson, S.R.; Cosgrove, D.; Dietrich, C.F.; Amy, D.; Bamber, J.C.; et al. WFUMB guidelines and recommendations for clinical use of ultrasound elastography: Part 3: Liver. Ultrasound Med. Biol. 2015, 41, 1161–1179. [Google Scholar] [CrossRef] [PubMed]
- Feltovich, H. Elastography applications in pregnancy. In Tissue Elasticity Imaging; Elsevier: Amsterdam, The Netherlands, 2020; pp. 181–196. [Google Scholar]
- Carlson, L.C.; Hall, T.J.; Rosado-Mendez, I.M.; Mao, L.; Feltovich, H. Quantitative assessment of cervical softening during pregnancy with shear wave elasticity imaging: An in vivo longitudinal study. Interface Focus 2019, 9, 20190030. [Google Scholar] [CrossRef] [PubMed]
- Cervical Assessment | FMF Certification | Welcome to the Fetal Medicine Foundation. Available online: https://fetalmedicine.org/fmf-certification-2/cervical-assessment-1 (accessed on 28 July 2022).
- Sugimoto, K.; Moriyasu, F.; Oshiro, H.; Takeuchi, H.; Yoshimasu, Y.; Kasai, Y.; Itoi, T. Clinical utilization of shear wave dispersion imaging in diffuse liver disease. Ultrasonography 2020, 39, 3. [Google Scholar] [CrossRef]
- Hernandez-Andrade, E.; Aurioles-Garibay, A.; Garcia, M.; Korzeniewski, S.J.; Schwartz, A.G.; Ahn, H.; Martinez-Varea, A.; Yeo, L.; Chaiworapongsa, T.; Hassan, S.S.; et al. Effect of depth on shear-wave elastography estimated in the internal and external cervical os during pregnancy. J. Perinat. Med. 2014, 42, 549–557. [Google Scholar] [CrossRef]
- Bishop, E. Pelvic scoring for elective induction. Obstet. Gynecol. 1964, 24, 266–2668. [Google Scholar]
- Guía de Práctica Clínica Sobre la Atención al Parto Normal. Plan de Calidad para el Sistema Nacional de Salud del Ministerio de Sanidad y Política Social; Technical Report; Agencia de Evaluación de Tecnologías Sanitarias del País Vasco (OSTEBA): Vitoria-Gasteiz, Spain, 2010. [Google Scholar]
- American College of Obstetricians and Gynecologists. Operative Vaginal Delivery; Technical Report; American College of Obstetricians and Gynecologists: Washington, DC, USA, 2000. [Google Scholar]
- Cohen, J. Statistical Power Analysis. Curr. Dir. Psychol. Sci. 1992, 1, 98–101. [Google Scholar] [CrossRef]
- Koo, T.K.; Li, M.Y. A Guideline of Selecting and Reporting Intraclass Correlation Coefficients for Reliability Research. J. Chiropr. Med. 2016, 15, 155–163. [Google Scholar] [CrossRef]
- Robin, X.; Turck, N.; Hainard, A.; Tiberti, N.; Lisacek, F.; Sanchez, J.C.; Müller, M.; Siegert, S.; Doering, M.; Billings, Z.; et al. Package ‘pROC’. Technical Report. Available online: https://cran.r-project.org/web/packages/pROC/pROC.pdf (accessed on 28 July 2022).
- Kuhn, M. Building predictive models in R using the caret package. J. Stat. Softw. 2008, 28, 1–26. [Google Scholar] [CrossRef] [Green Version]
- Melamed, N.; Hiersch, L.; Domniz, N.; Maresky, A.; Bardin, R.; Yogev, Y. Predictive value of cervical length in women with threatened preterm labor. Obstet. Gynecol. 2013, 122, 1279–1287. [Google Scholar] [CrossRef]
- Peralta, L.; Molina, F.S.; Melchor, J.; Gómez, L.F.; Massó, P.; Florido, J.; Rus, G. Transient elastography to assess the cervical ripening during pregnancy: A preliminary study. Ultraschall Medizin-Eur. J. Ultrasound 2017, 38, 395–402. [Google Scholar] [CrossRef]
- Wozniak, S.; Czuczwar, P.; Szkodziak, P.; Milart, P.; Wozniakowska, E.; Paszkowski, T. Elastography in predicting preterm delivery in asymptomatic, low-risk women: A prospective observational study. BMC Pregnancy Childbirth 2014, 14, 238. [Google Scholar] [CrossRef]
- House, M.; Kaplan, D.L.; Socrate, S. Relationships between mechanical properties and extracellular matrix constituents of the cervical stroma during pregnancy. Semin. Perinatol. 2009, 33, 300–307. [Google Scholar] [CrossRef]
- Pereira, S.; Frick, A.P.; Poon, L.C.; Zamprakou, A.; Nicolaides, K.H. Successful induction of labor: Prediction by preinduction cervical length, angle of progression and cervical elastography. Ultrasound Obstet. Gynecol. 2014, 44, 468–475. [Google Scholar] [CrossRef]
- Hwang, H.S.; Sohn, I.S.; Kwon, H.S. Imaging Analysis of Cervical Elastography for Prediction of Successful Induction of Labor at Term. J. Ultrasound Med. 2013, 32, 937–946. [Google Scholar] [CrossRef]
- Hee, L.; Rasmussen, C.K.; Schlütter, J.M.; Sandager, P.; Uldbjerg, N. Quantitative sonoelastography of the uterine cervix prior to induction of labor as a predictor of cervical dilation time. Acta Obstet. Gynecol. Scand. 2014, 93, 684–690. [Google Scholar] [CrossRef]
- Zhou, Y.; Jin, N.; Chen, Q.; Lv, M.; Jiang, Y.; Chen, Y.; Xi, F.; Yang, M.; Zhao, B.; Huang, H.; et al. Predictive value of cervical length by ultrasound and cervical strain elastography in labor induction at term. J. Int. Med. Res. 2021, 49. [Google Scholar] [CrossRef]
- Strobel, M.K.; Eveslage, M.; Köster, H.A.; Möllers, M.; Braun, J.; de Santis, C.; Oelmeier, K.; Klockenbusch, W.; Schmitz, R. Cervical elastography strain ratio and strain pattern for the prediction of a successful induction of labour. J. Perinat. Med. 2021, 49, 195–202. [Google Scholar] [CrossRef]
- Vink, J.Y.; Qin, S.; Brock, C.O.; Zork, N.M.; Feltovich, H.M.; Chen, X.; Urie, P.; Myers, K.M.; Hall, T.J.; Wapner, R.; et al. A new paradigm for the role of smooth muscle cells in the human cervix. Am. J. Obstet. Obstet. Gynecol. 2016, 215, 478.e1–478.e11. [Google Scholar] [CrossRef] [PubMed] [Green Version]
- Swiatkowska-Freund, M.; Preis, K. Elastography of the uterine cervix: Implications for success of induction of labor. Ultrasound Obstet. Gynecol. 2011, 38, 52–56. [Google Scholar] [CrossRef] [PubMed]
- Myers, K.M.; Socrate, S.; Paskaleva, A.; House, M. A study of the anisotropy and tension/compression behavior of human cervical tissue. J. Biomech. Eng. 2010, 132, 21003. [Google Scholar] [CrossRef] [PubMed]
- Bernal, M.; Chamming’s, F.; Couade, M.; Bercoff, J.; Tanter, M.; Gennisson, J.L. In vivo quantification of the nonlinear shear modulus in breast lesions: Feasibility study. IEEE Trans. Ultrason. Ferroelectr. Freq. Control 2015, 63, 101–109. [Google Scholar] [CrossRef] [PubMed]
- Alavifard, S.; Meier, K.; Shulman, Y.; Tomlinson, G.; D’Souza, R. Derivation and validation of a model predicting the likelihood of vaginal birth following labour induction. BMC Pregnancy Childbirth 2019, 19, 130. [Google Scholar] [CrossRef] [PubMed]
- Hatfield, A.S.; Sanchez-Ramos, L.; Kaunitz, A.M. Sonographic cervical assessment to predict the success of labor induction: A systematic review with metaanalysis. Am. J. Obstet. Gynecol. 2007, 197, 186–192. [Google Scholar] [CrossRef] [PubMed]
Publisher’s Note: MDPI stays neutral with regard to jurisdictional claims in published maps and institutional affiliations. |
© 2022 by the authors. Licensee MDPI, Basel, Switzerland. This article is an open access article distributed under the terms and conditions of the Creative Commons Attribution (CC BY) license (https://creativecommons.org/licenses/by/4.0/).