4.3.1. Sample Data Collection (HAPT)
This paper selects different sample types according to the characteristics of different populations of the actual samples, and the sample collection age range is between 20–60 years old. Among them, a comprehensive collection was carried out through the HAPT dataset [
22]. The algorithm contains accelerometer inertial sensor axis data. The collection process is the various human behavior characteristics exhibited by the samples in different states. It includes the collection of sitting, standing, lying, walking, running, and other postures. For each sample, the acceleration information during the two movements is taken, and through the sample collection process of the HAPT algorithm, the algorithm can determine whether the target is still (sitting, standing) or moving (walking, running) [
23]. The process of definition is divided into ordinary definition and transformation definition formed in limb transformation according to the actual situation. According to the existing research, there are 12 kinds in total.
Table 1 shows the data collection situation under the acceleration algorithm of sample collection according to HAPT. The detailed information is shown in
Table 5.
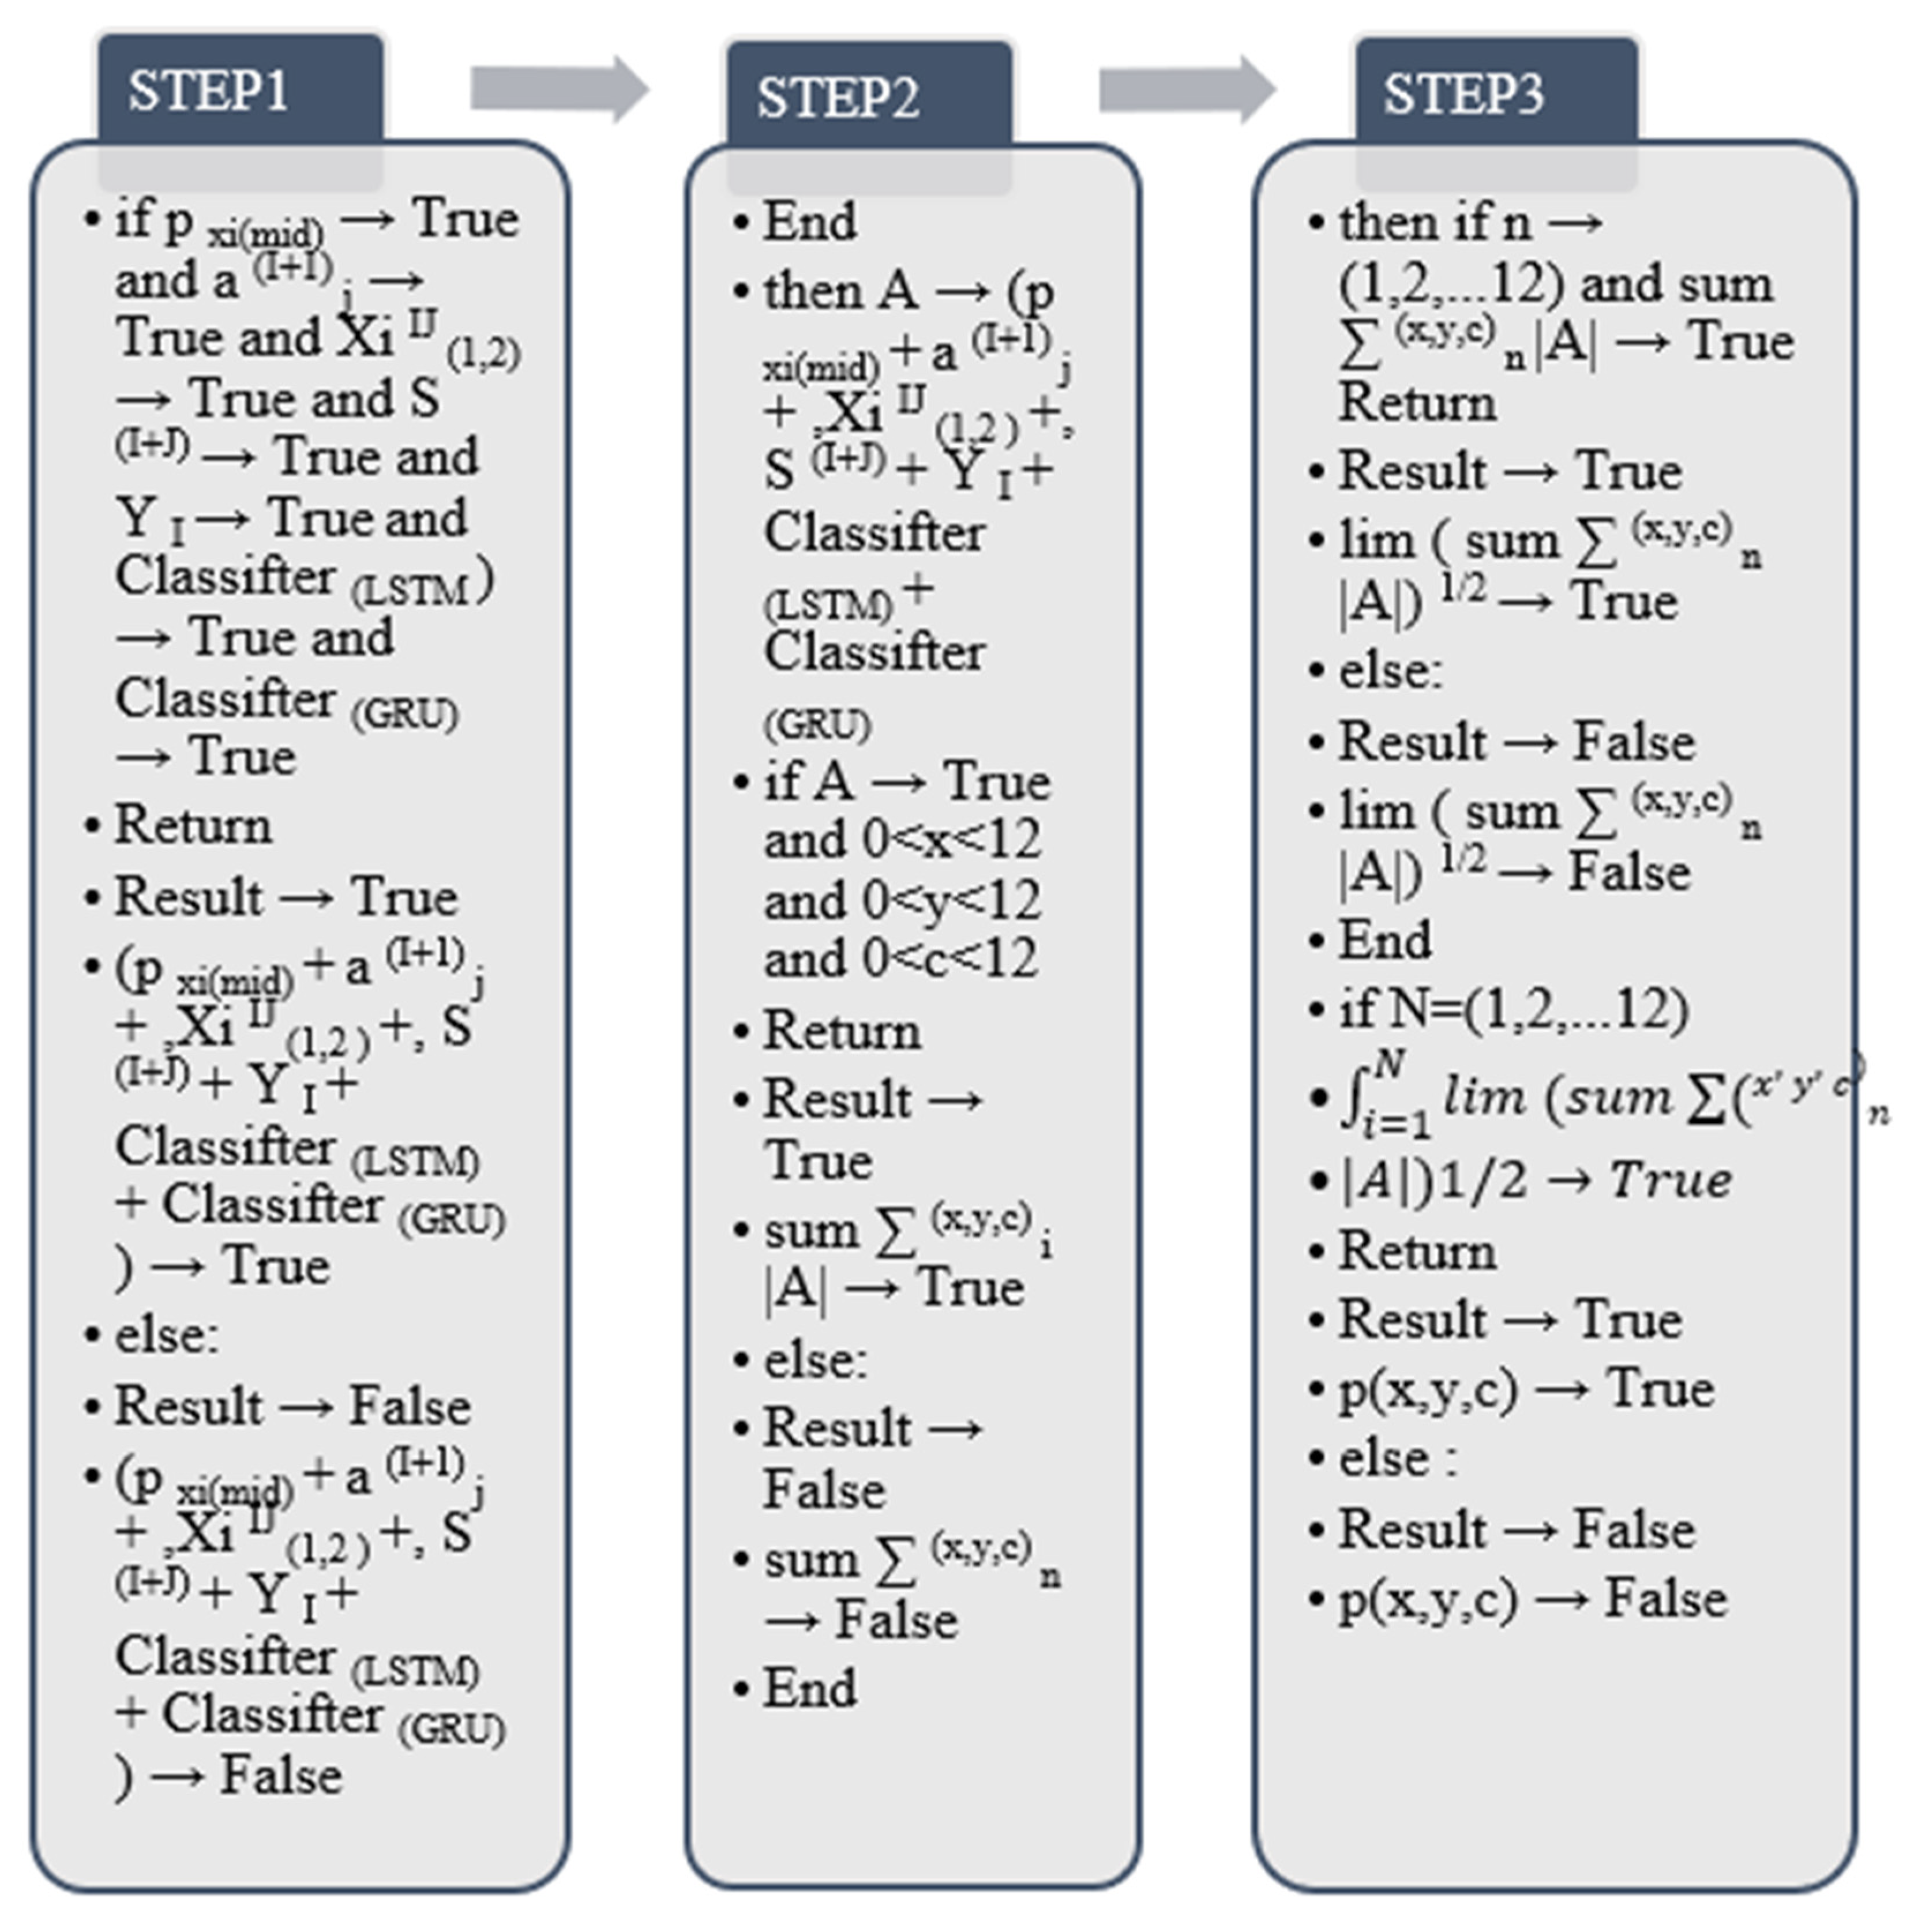
According to the type and quantity of definitions, this step adopts 6 common definitions and 6 transformation definitions for centralized processing. The research method of this step is to draw the human pose image through the line graph. It is divided into ordinary definition and transformation definition. Among them, the common type is a single behavior mode, and the transformation is defined as the change of two behavior modes, which is formed by changing the limb mode. In this paper, according to the HAPT algorithm of data collection and the different behavior changes, the effective label definition and processing time estimation are carried out for each collected sample, and finally, the label definition takes the middle-value method. First, the algorithm contains a total of N sample sets, which are separately encoded and registered by the unit. When there is a change in human behavior, it is set as a binary feature, and when there is no change in human behavior, it is a unary feature. The final binary feature or the value output of a binary feature has only one true value. The final purpose of this step is to obtain the sample output model graph. The above steps are output through [
23] the model diagram in
Figure 5 and the algorithm in
Figure 6.
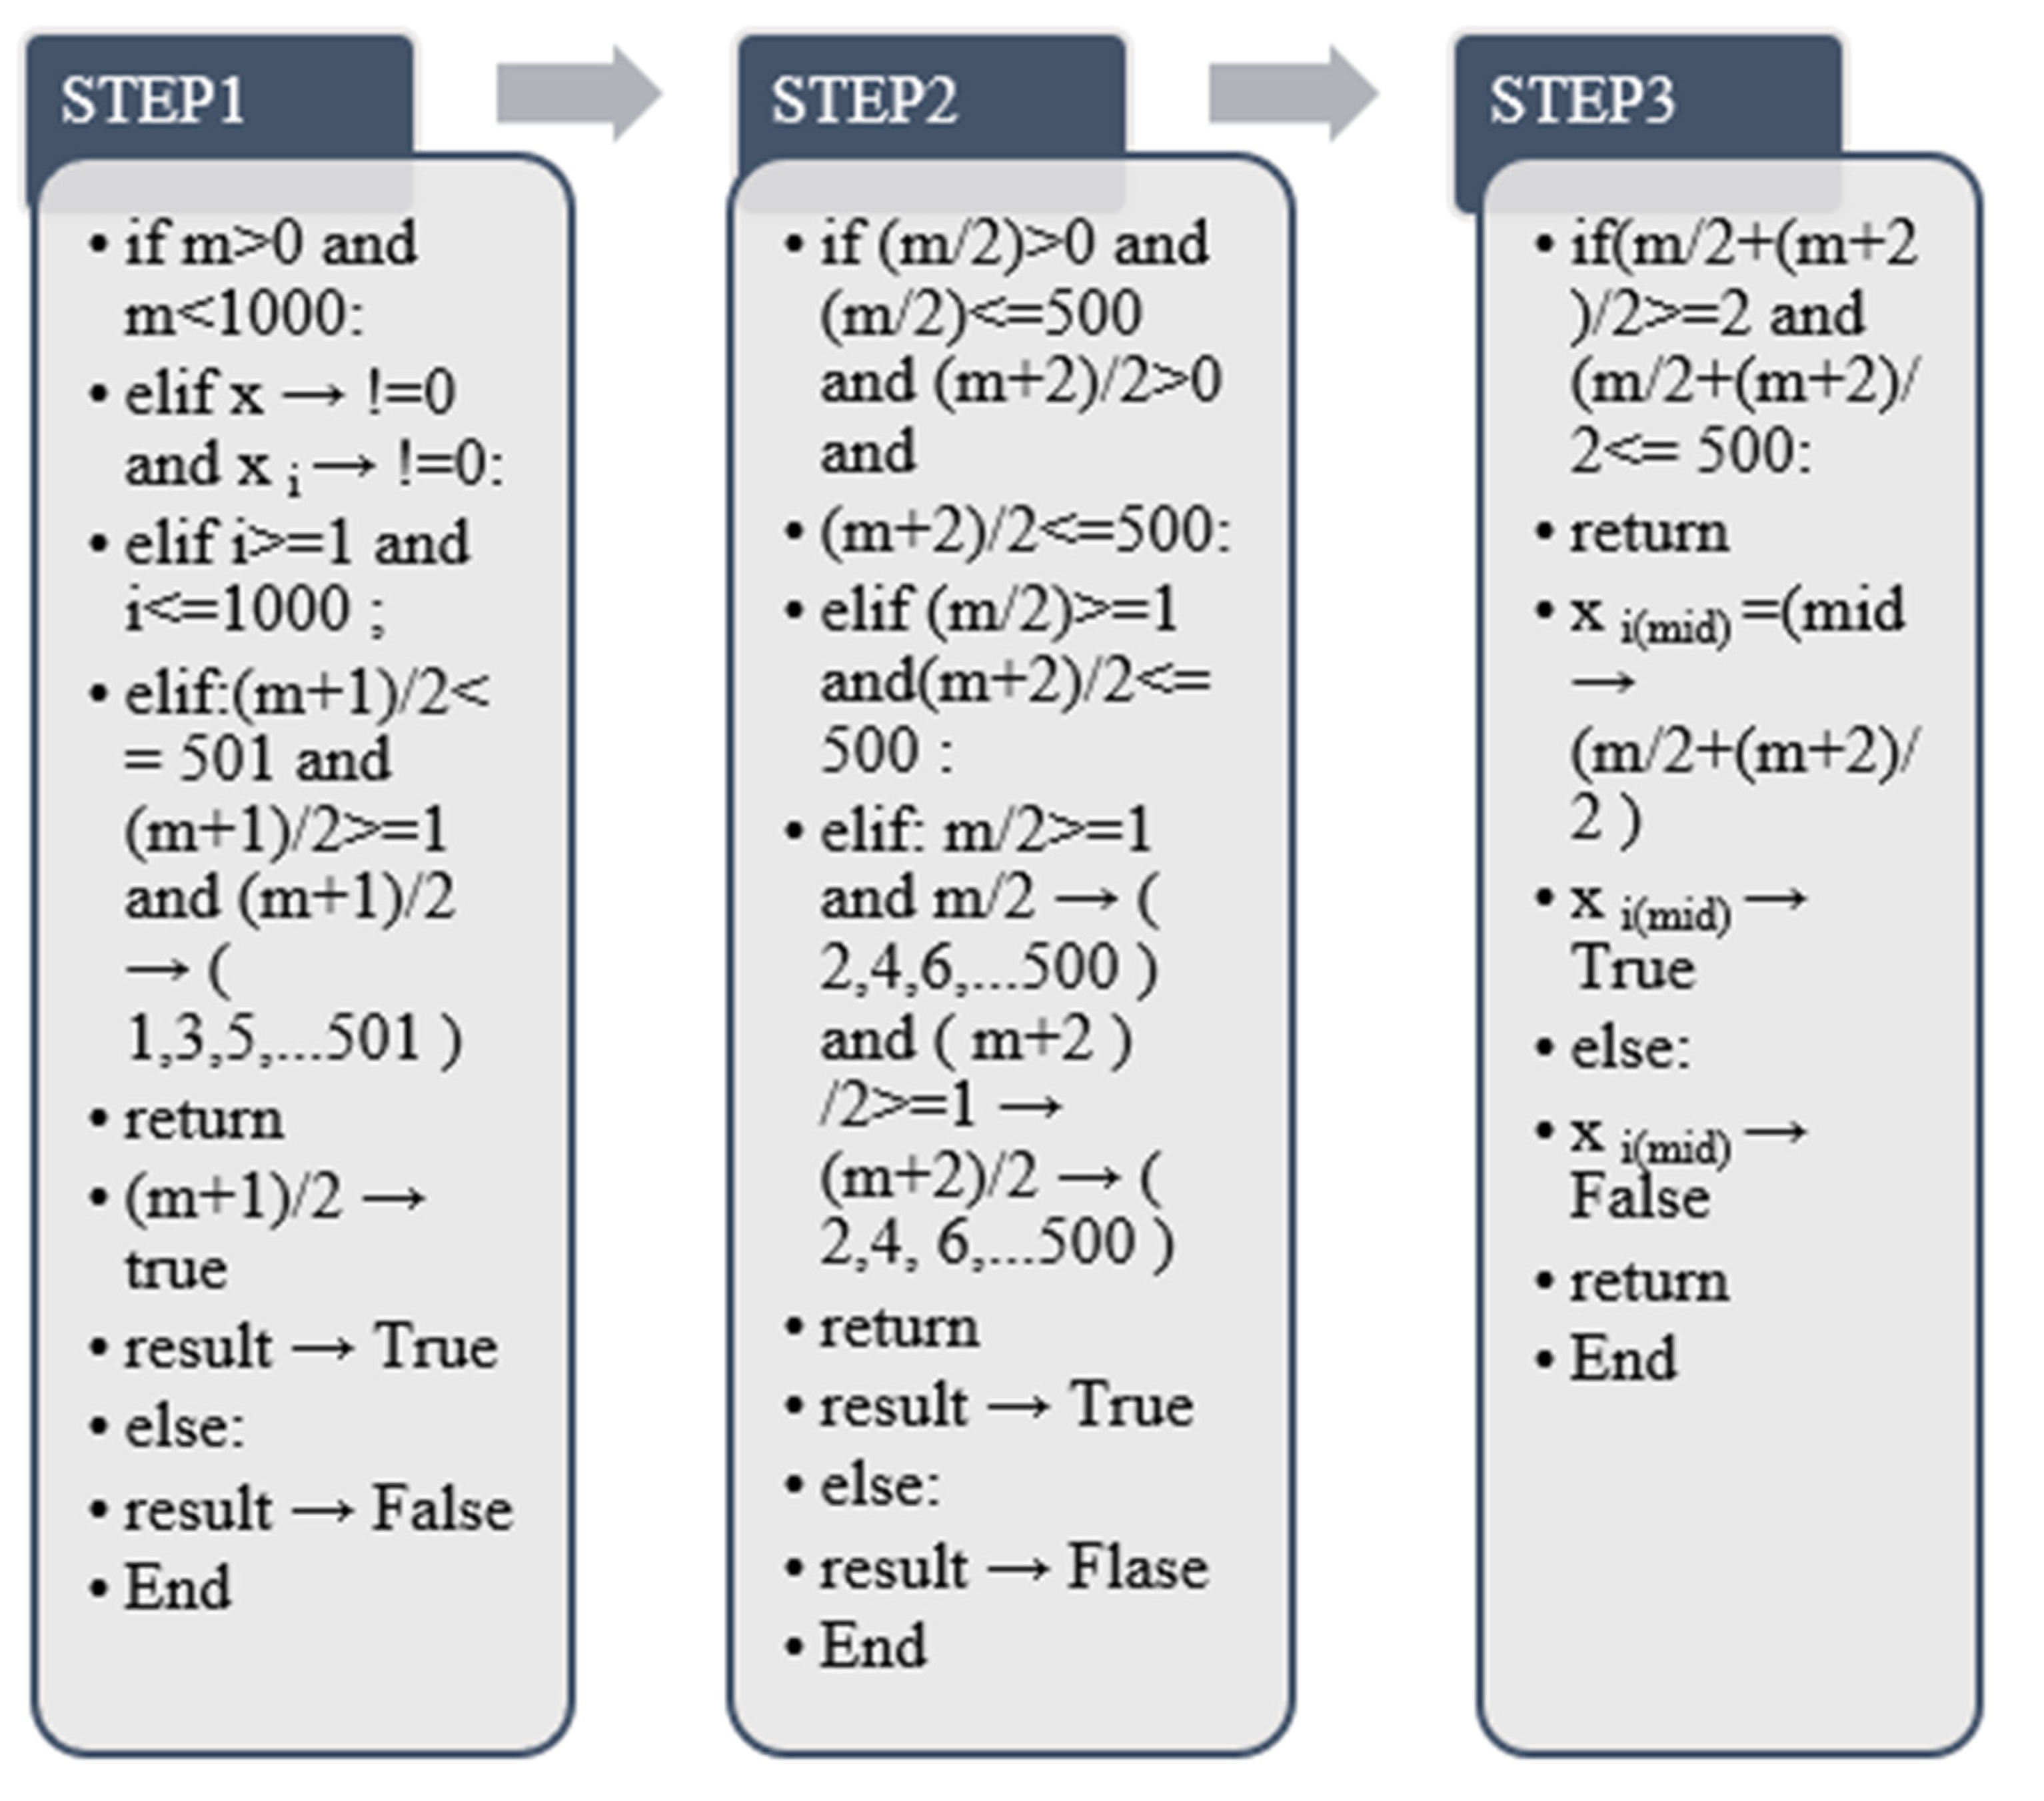
According to the algorithm output in
Figure 5, the principle of this algorithm is to match and calculate through the characteristics of odd and even numbers. The calculation range is limited to 0–1000. (
m +
1)/
2 represents odd-numbered items, which are unary features after output, and
m/
2 + (
m +
2)/
2 are even-numbered features. According to changes in human behavior, the values of
m/2 and
(m +
2)/
2 of even-numbered features will appear accordingly. The algorithm performs cumulative addition according to the given output mode and finally forms a sample dataset.
Through the output process of the above Algorithm, it is divided into odd number judgment and even numbers judgment to realize, and it is carried out through two sets of return values of true and false. When the given dataset label range is in the odd range of 1, 3, 5, …, 501, it is judged to be true, and the dataset the result of the odd item is returned. If the returned label value is not an odd column of 1,3,5, …, 501, and the output result is false, there is no return value. The judgment principle of even-numbered column data is the same as that of odd-numbered columns. When the output label range is 2, 4, 6, …, 500, the return value of the final label is output. Otherwise, the output result is false, and there is no return value.
4.3.2. Convolution Feature Recognition Algorithm (One-Dimensional Convolution and Two-Dimensional Convolution)
This process is to identify the dimension of the data itself through the convolution operation. For the selected samples, the processing method adopts a two-dimensional convolution operation [
24], and the final goal is to form a two-dimensional convolution kernel. The two-dimensional convolution operation adds a dimension to the original one-dimensional case and is a deep convolutional neural network that can also be used for facial emotional feature detection. The most basic feature of 2D convolutional networks is the type of deep convolutional neural network. In the process of human behavior recognition, it is divided into 7 components, namely the data input layer, convolution layer (same dimension), pooling layer (same facial expression), fully connected layer, classification output layer, convolution layer (different dimensions)) and pooling layers (of different dimensions) [
25]. For a one-dimensional convolution operation, a one-dimensional convolution kernel is formed. This process requires the use of two dimensions to extract and form the final fused features. The 1D convolution feature extraction algorithm and the 2D convolution feature extraction algorithm are shown in
Figure 7 [
25] and
Figure 8 [
25], and the output process model diagram of the 2D convolution layer is shown in
Figure 7 [
25] and
Figure 8 [
25] and
Figure 9 [
26] shows:
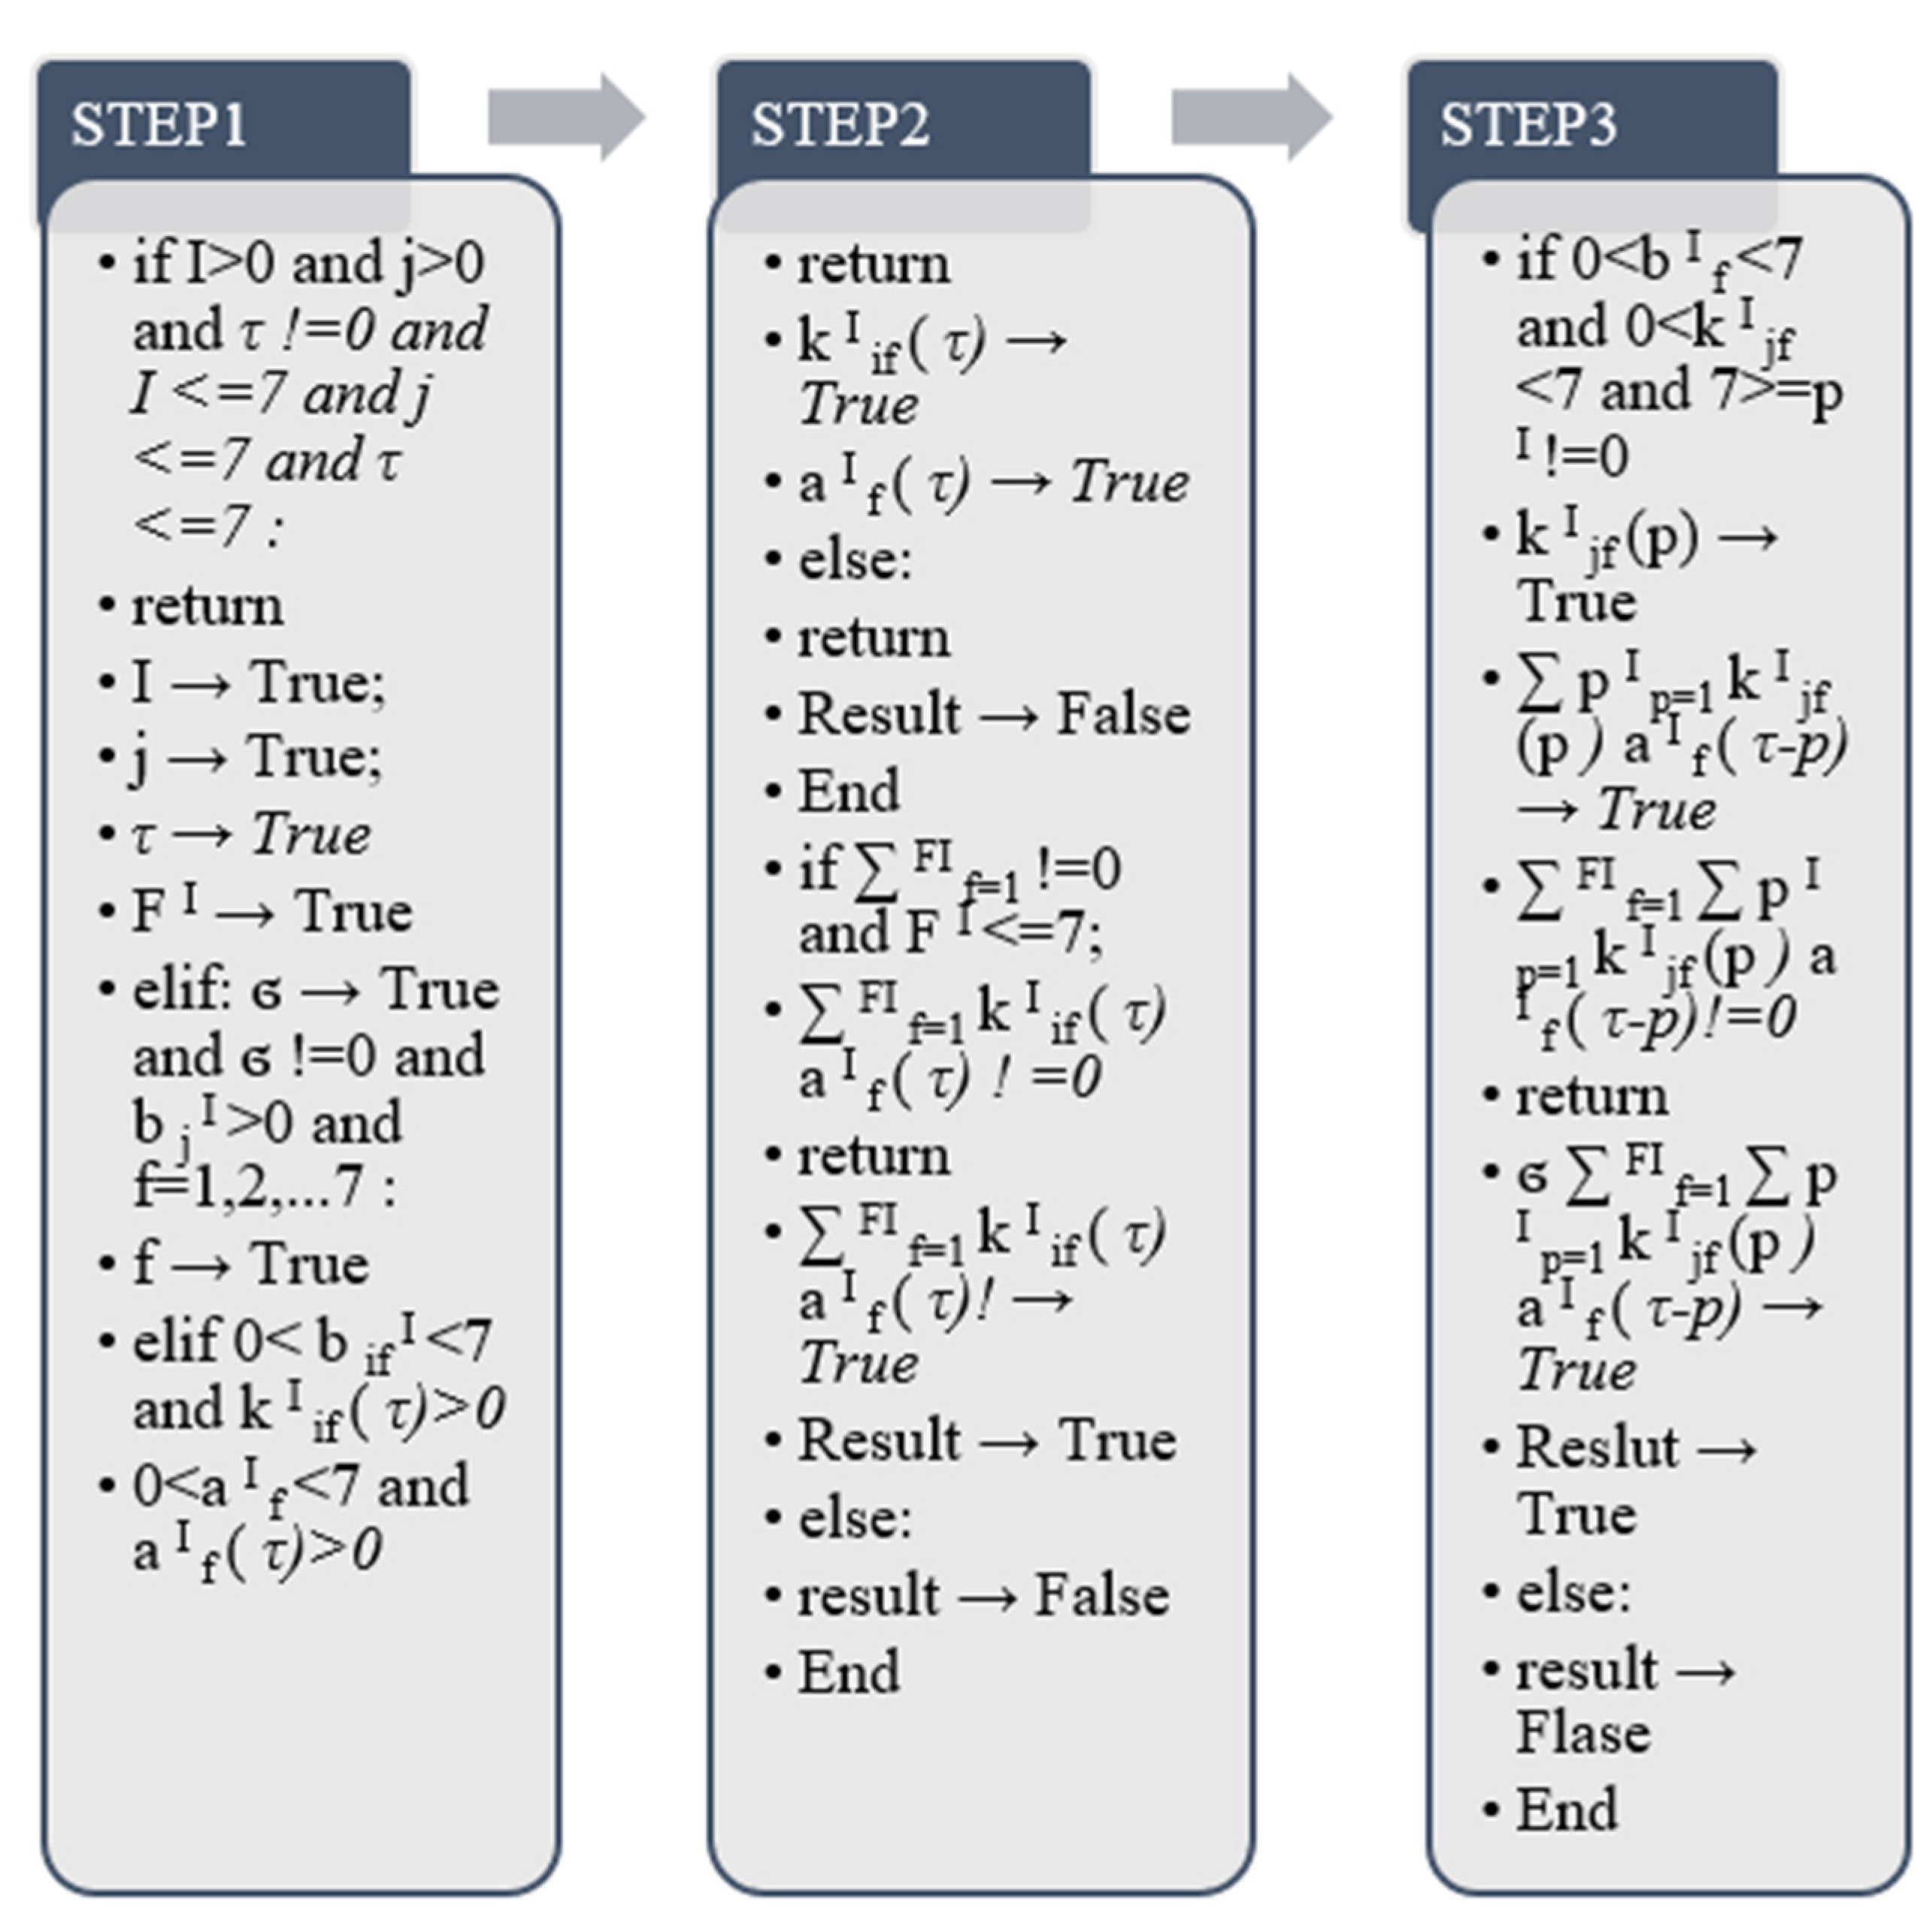
In the above equation, the feature j represented by
(
τ) is the base, and τ represents the basic parameter of convolution identification. σ represents the nonlinear relationship in the process of mathematical functions, FI represents the number of features of the first layer of
, (
f =
1) represents the features of the first layer, and the (
I +
1) layer after the kernel convolution is created. The eigenvalue is
j, and PI represents the length of the convolution kernel in layer
I. In addition,
represents the base of the convolution kernel
b,
j is the starting value, and
I is the value of the convolution kernel b within the termination range. P represents the default parameter of one-dimensional convolution, and the difference between the feature base and the default parameter is calculated by (τ-p), and the numerical change of the convolution kernel is analyzed from it. In addition, the bias vector produced by the convolution process is represented by
bI. When the process begins, we will perform numerical operations on each channel [
27].
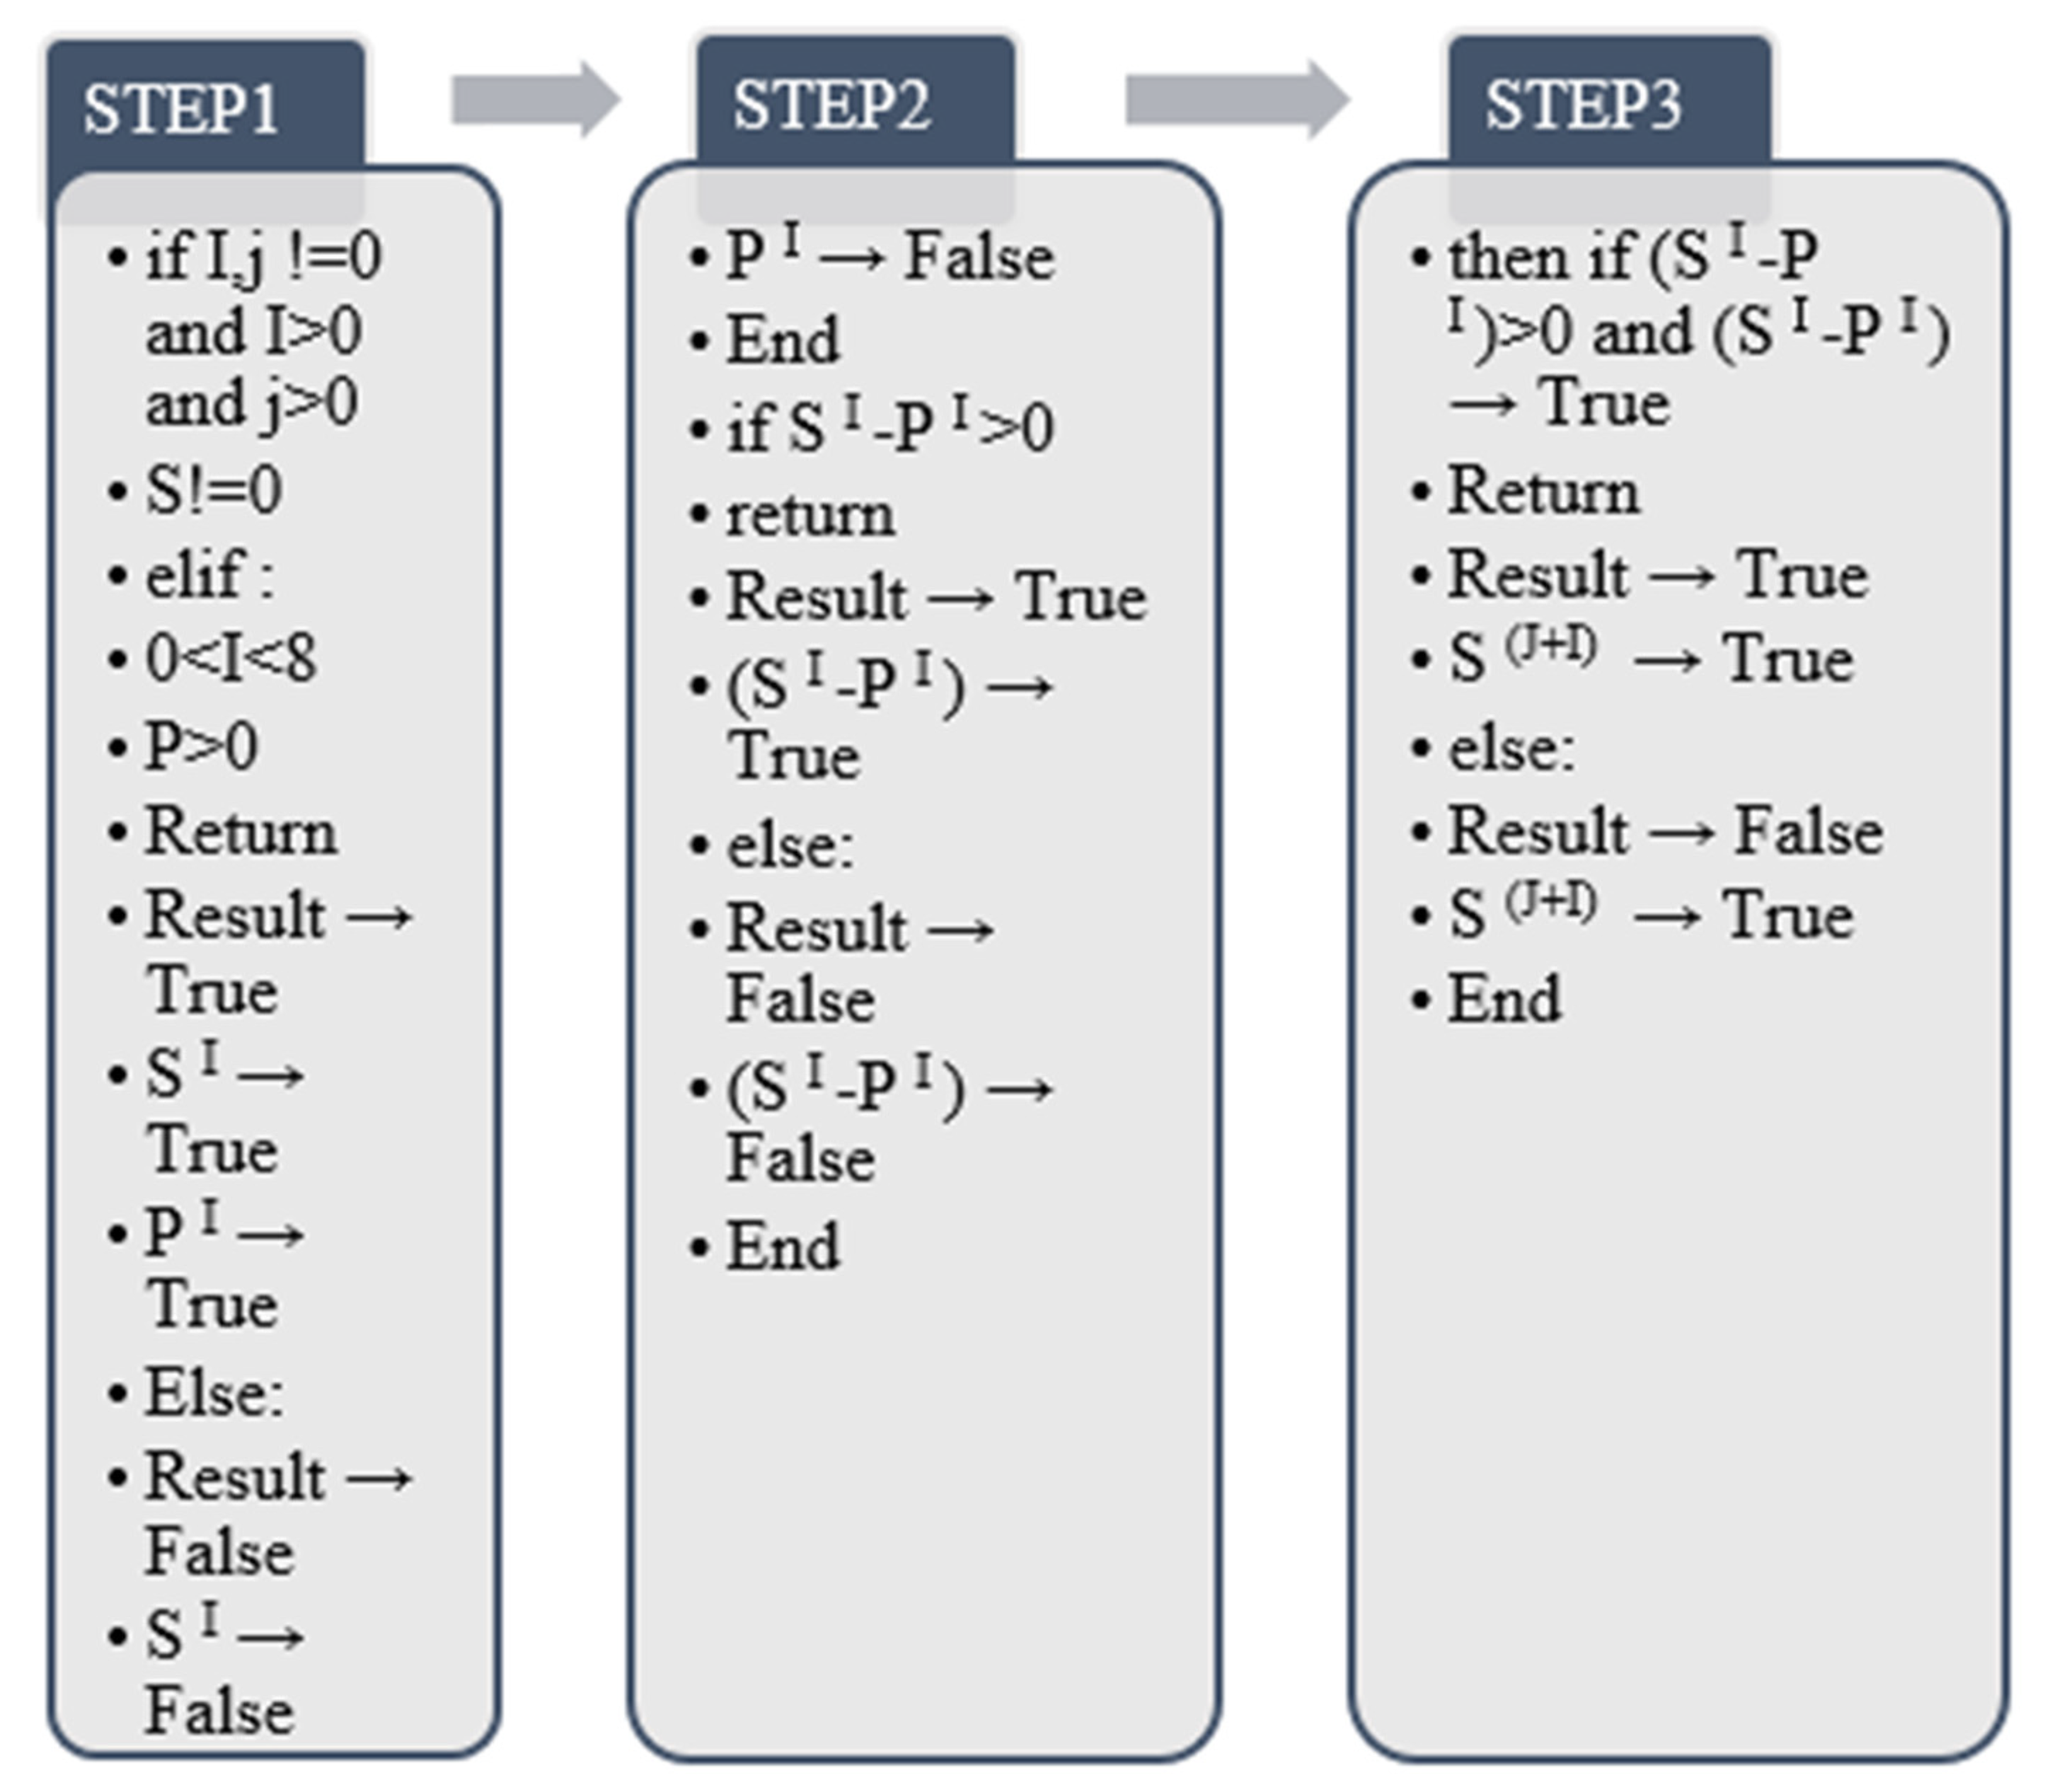
The output of the above algorithm is carried out according to the output method of the python program. It is divided into the return value when the true value is output and the formation of the false output value without the return value. In the whole process, the algorithm first judges the values of I, j, τ, and FI, and the equation needs to be in all of the above features! = 0 to calculate. When σ is not 0, we need to use the value of in this algorithm to verify that the convolution layer is within the range of 0–7, and we also need to verify whether the value returned by is consistent with and is also in convolution layer in the range 0–7. After satisfying the above value range, continue to judge the and the . This process requires judgment on the weighted summation results in the equations. According to the previous true conditions of (τ) and , it is judged that and after weighted summation Each group of convolutional layer values is also true and the final result can be output. When all the above processes need to be true, the (τ) output by the final algorithm is the calculated one-dimensional convolution output result.
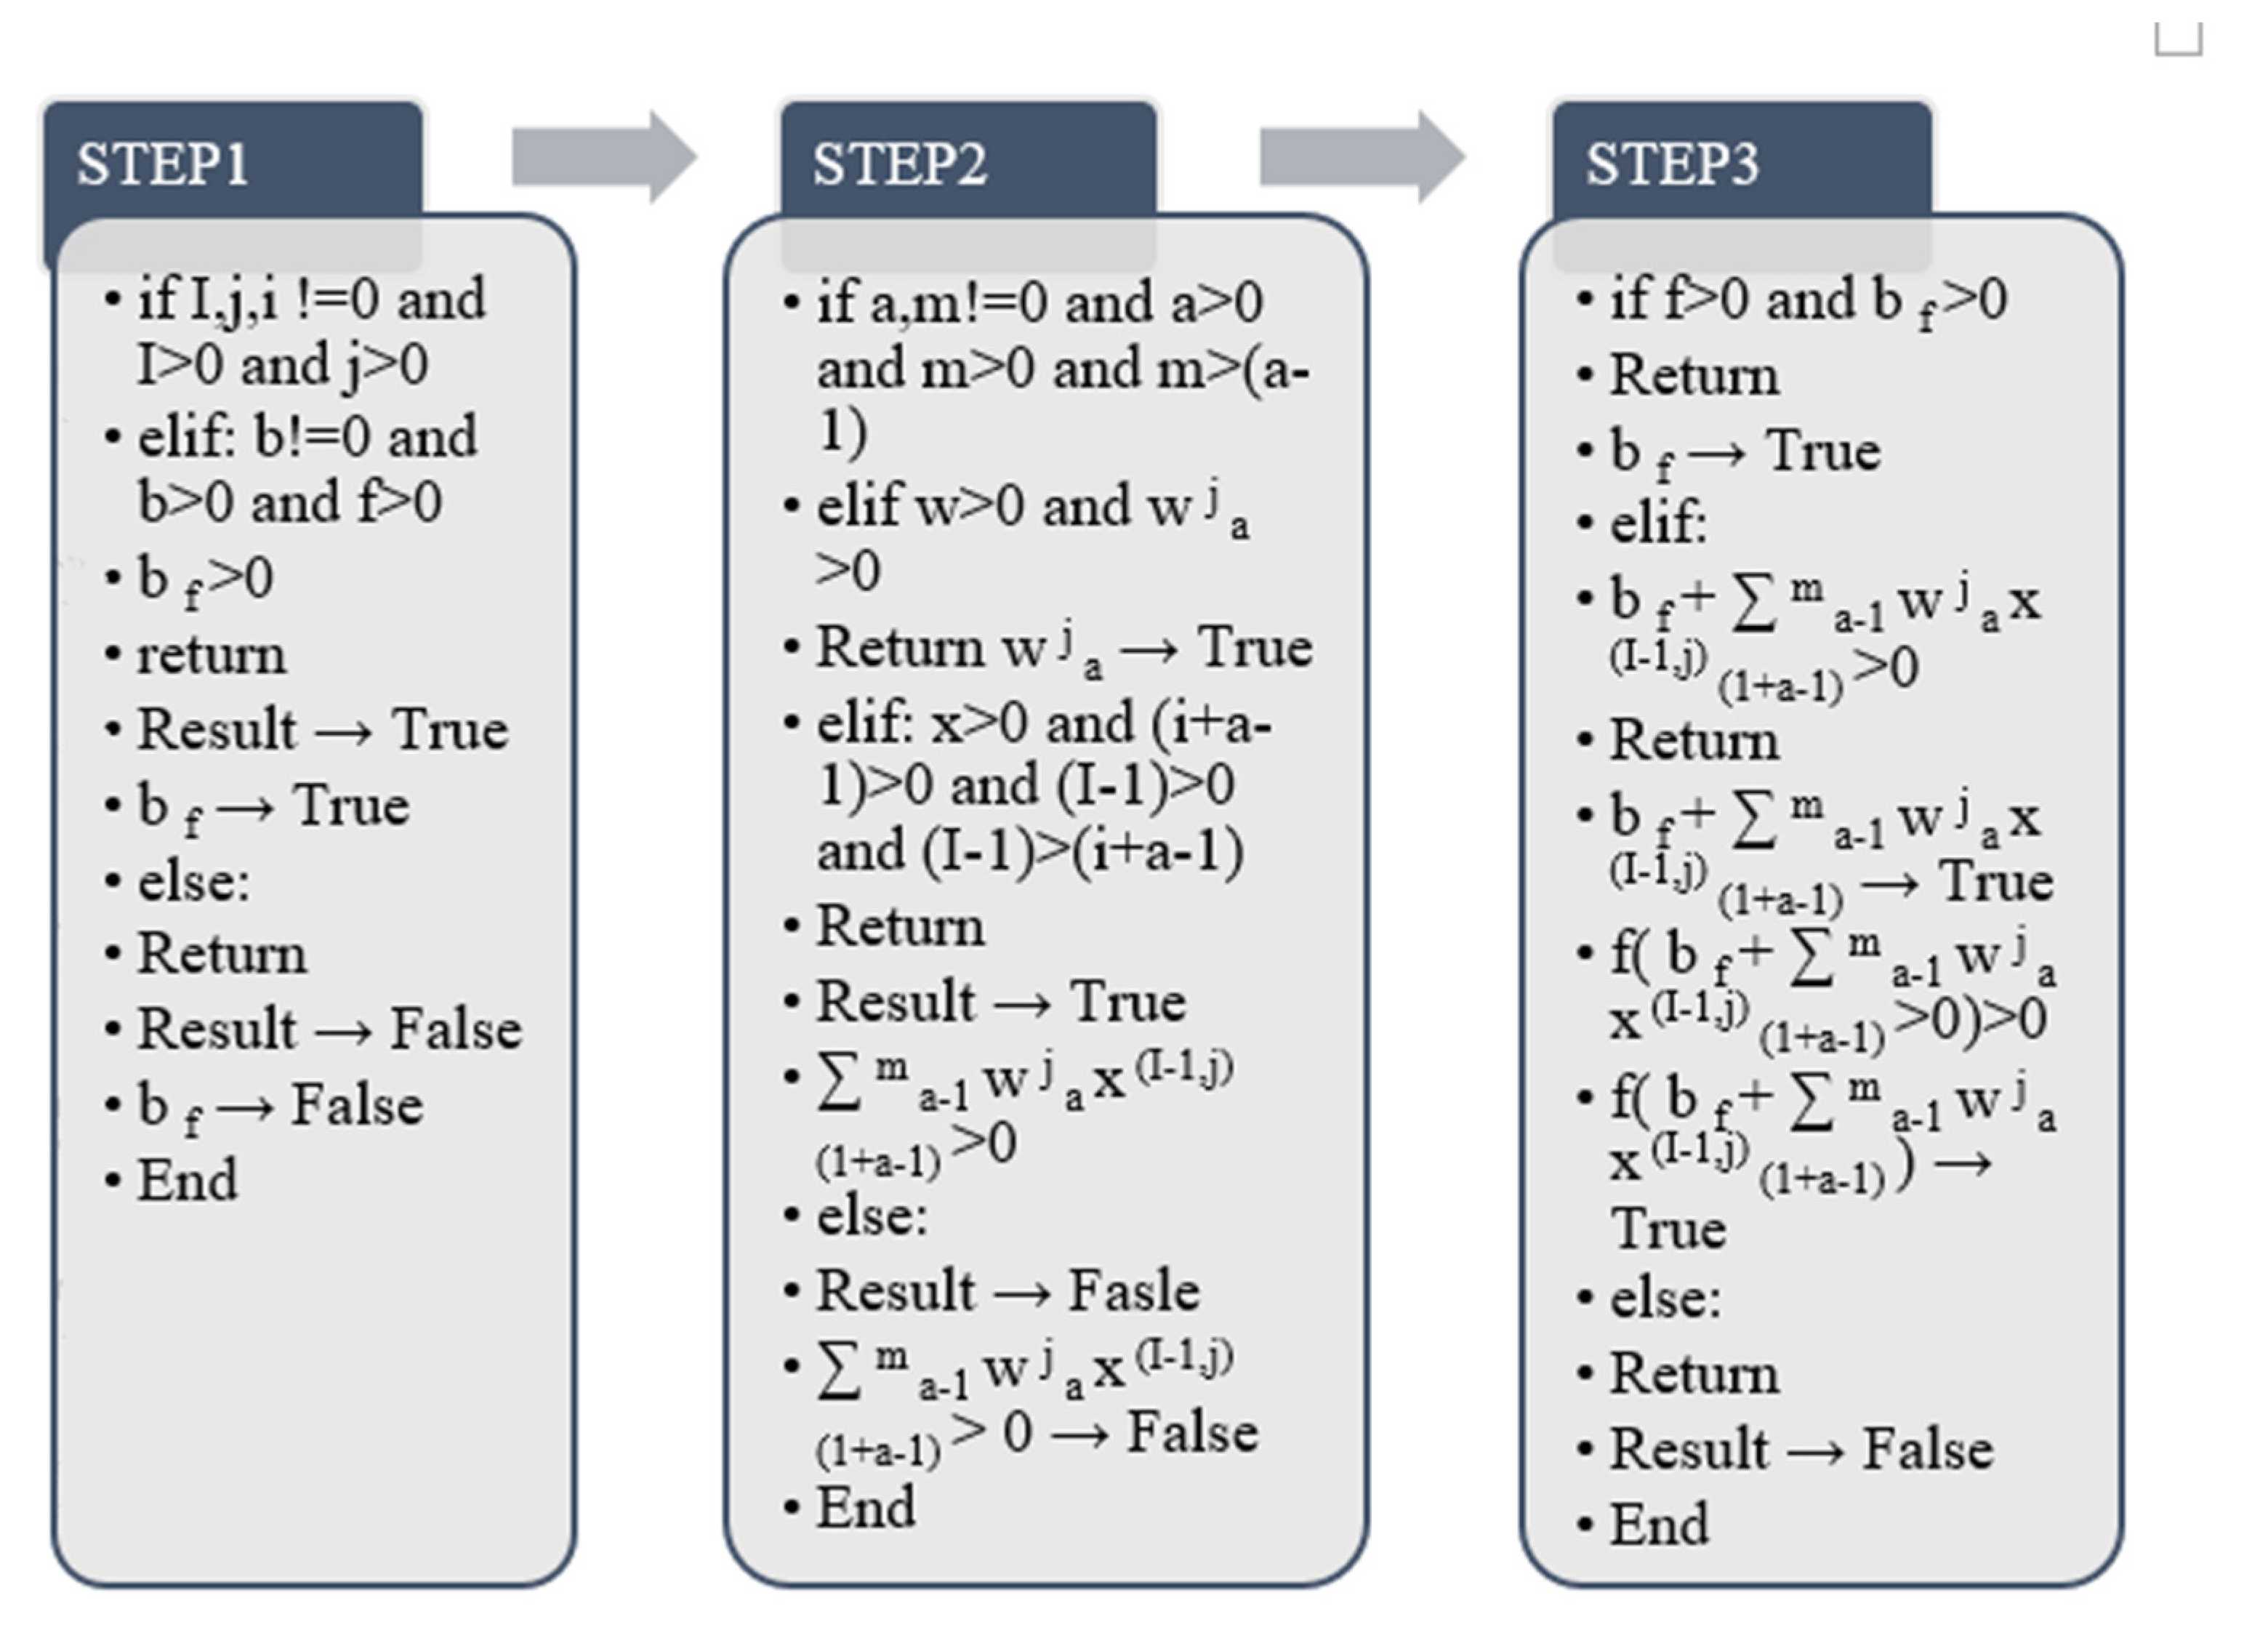
This paper selects the output value
of the algorithm in the above formula, where X is the cardinality of the two-dimensional convolution feature, i represents the parameter (starting value) of the ith convolutional layer, and I represents the output matrix of the product. (default from i = 1) [
26], j is used to select the number of outputs of the matrix, the order of this model graph is represented from left to right using 0 to N, and N represents the Nth. The number of specific matrices corresponding to the number is output to the Nth number. W represents the default parameters in the feature extraction algorithm, a represents the initial value before feature extraction, and j represents the final value of feature extraction.
represents the initial value of the two-dimensional convolutional layer, f represents a nonlinear function, and our total output formula here is sigmoid.
In the above algorithm output, the output judgment principle is the same as in the previous section. The final detection result of the two-dimensional convolutional layer in the true value range, the false value is an error, and there is no return value.
represents the value when the initial value b! = 0. In the algorithm process (
),
is the default two-dimensional feature. The value of the convolutional layer to be calculated,
indicates that the matrix feature output starts from the initial value (i + a − 1) of the convolutional layer in the base X by the end of (I − 1) to calculate the number of matrices performed by J. When both have actual eigenvalues, the product of the two is true; otherwise, it is false. When (
) is true, the algorithm calculates the value of the final two-dimensional convolution feature result
.
Figure 9 shows the specific algorithm of feature extraction of 2D convolutional network.
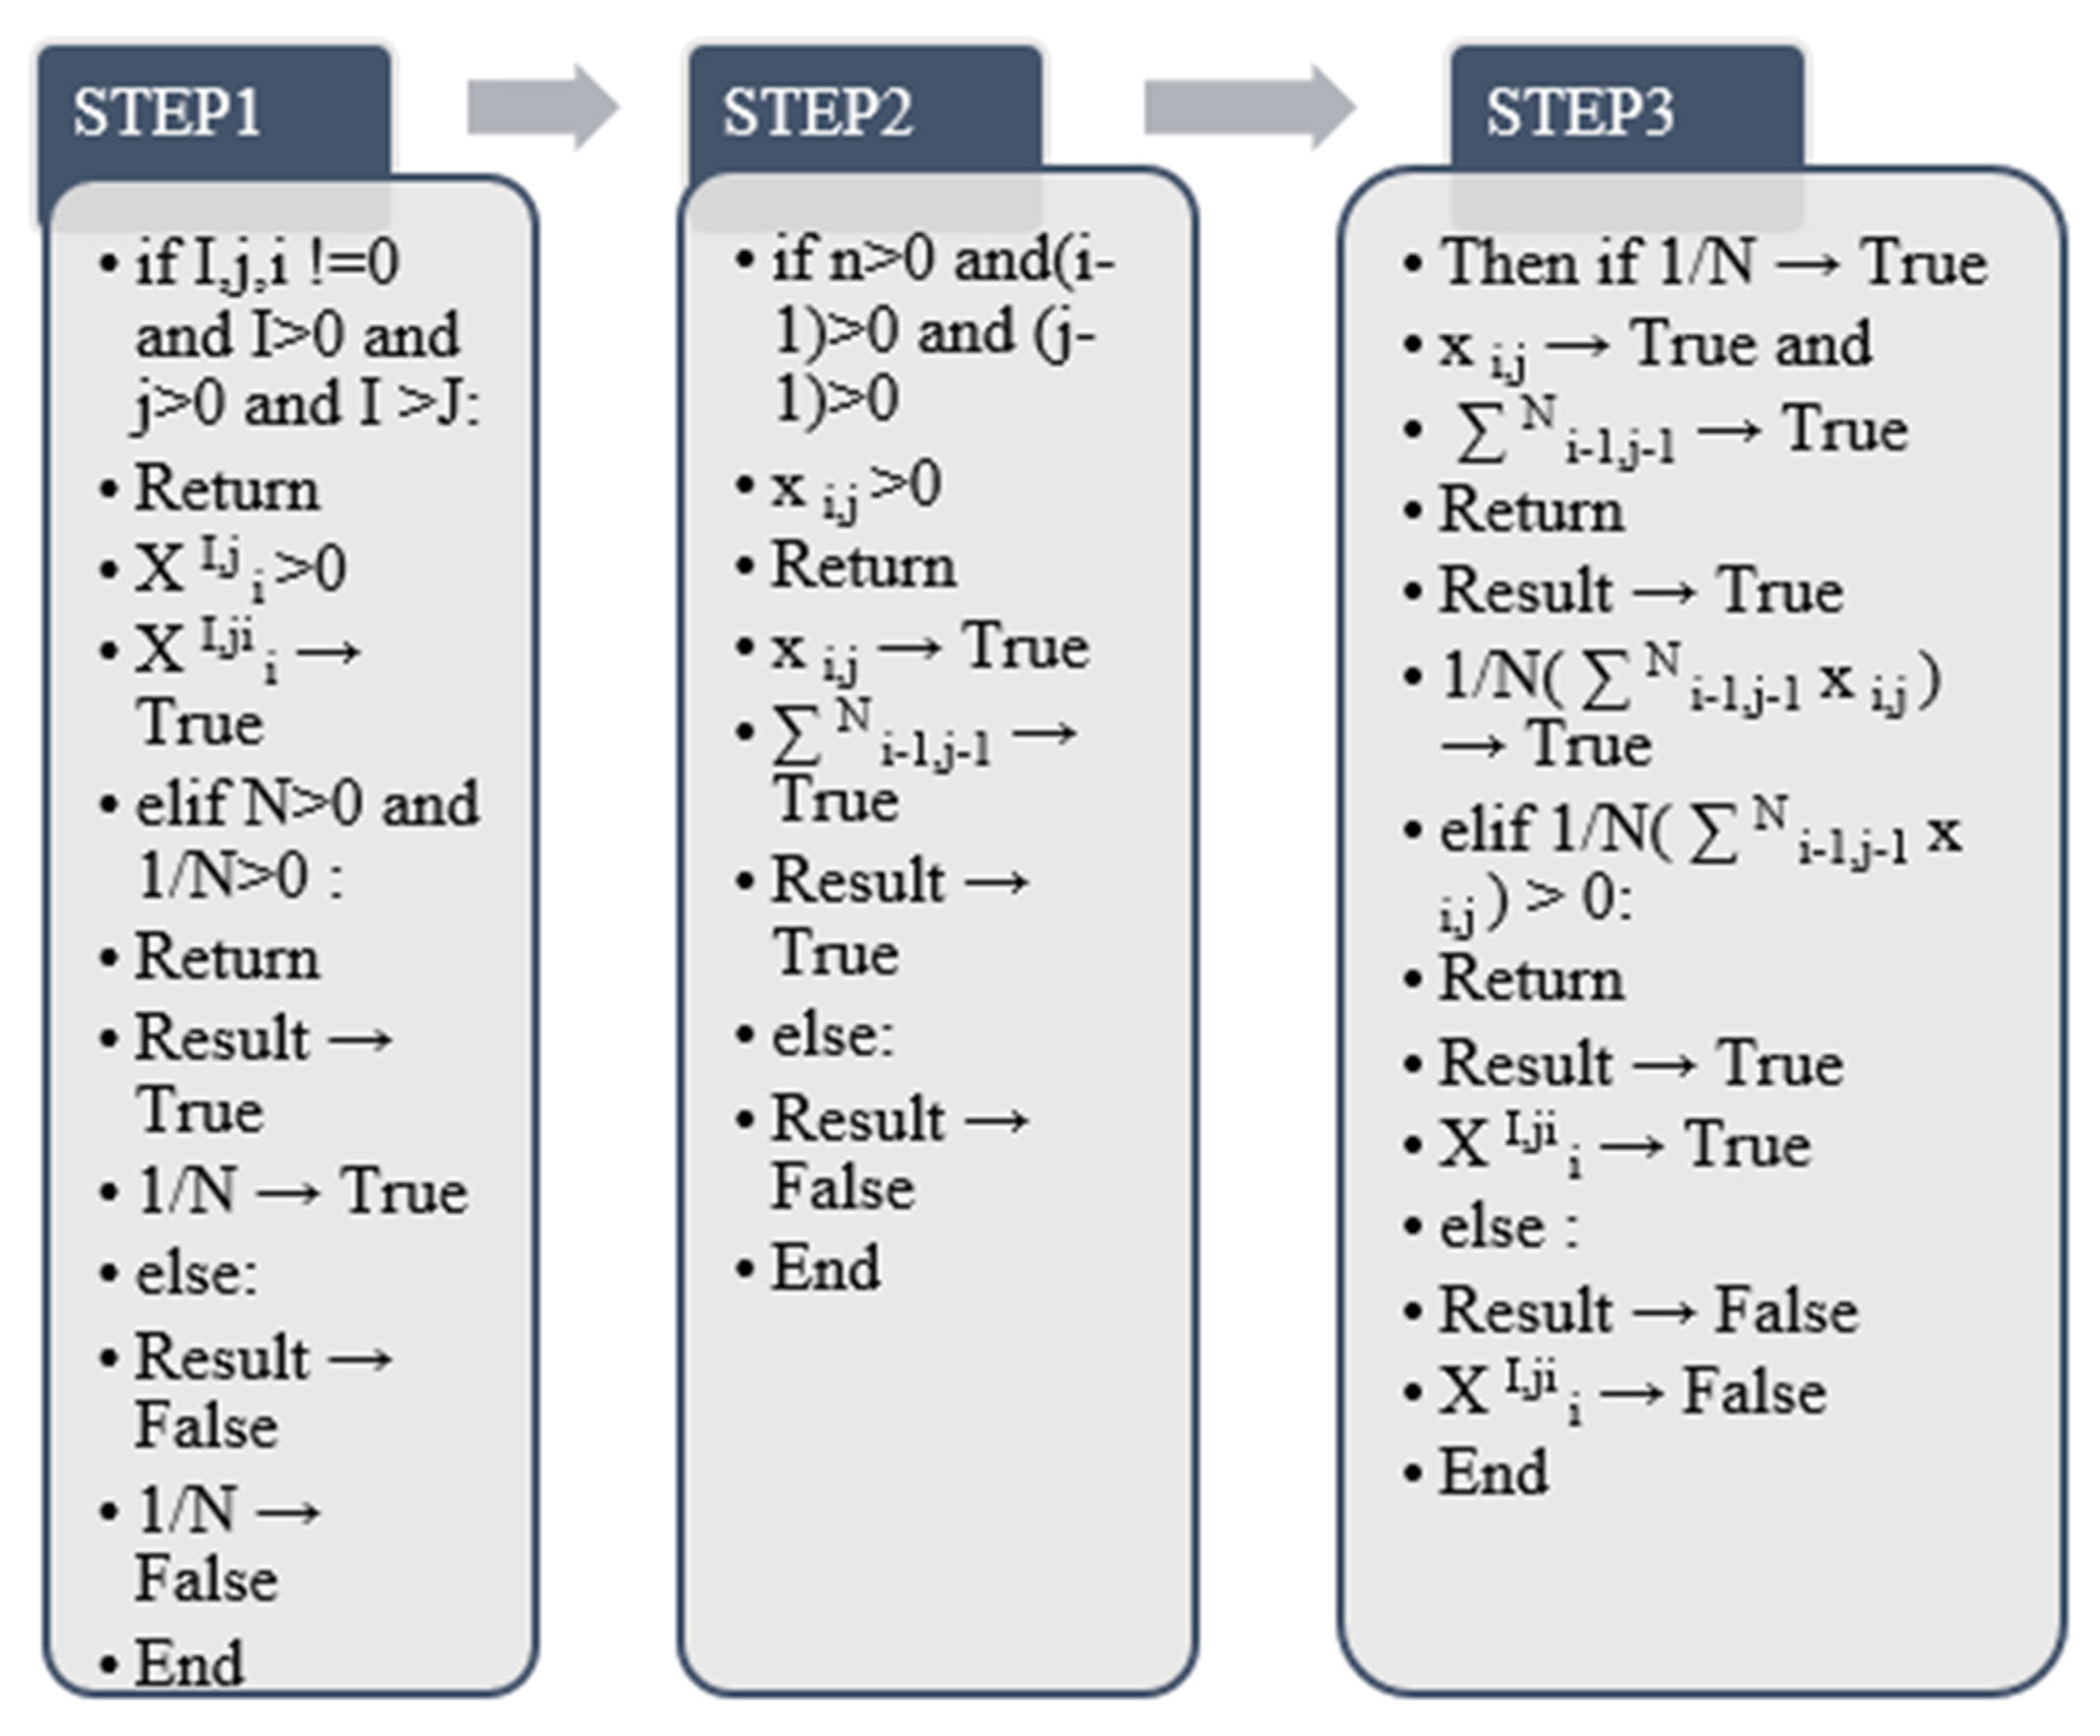
In this step,
selects the two parameters
i and
j as the pooling layer part of the two-dimensional convolution, and this part represents the output layer of the pooling part after the two-dimensional convolution starts. (
i − 1) and (
j −1) are the starting values of the summation, respectively, and n is the ending value. When 1/N represents the final maximum output result
N value, the average value of
is taken as the final output result after all weighted summations. The final
output value is the final feature of the 2D convolution calculated through this process. It is averaged by forming a matrix after the convolution of the previous layer. In this paper, through previous research, after using convolution and pooling operations, there is a global connection layer on the machine, and finally, the algorithm of summing the single classification features and then dividing by the number of corresponding classifications is calculated separately [
28].
In the algorithm output of this process, the true value and false value in the python output process are used to judge and return the result. Further, 1/N is the average number of the region where the extracted two-dimensional convolution result is located in the pooling layer, starting from the two initial values of (
i − 1) and (
j −1), and n is the corresponding pooling layer finally obtained. The upper bound of the weighted sum when the result is true. The product of 1/N and
is the final value of
.
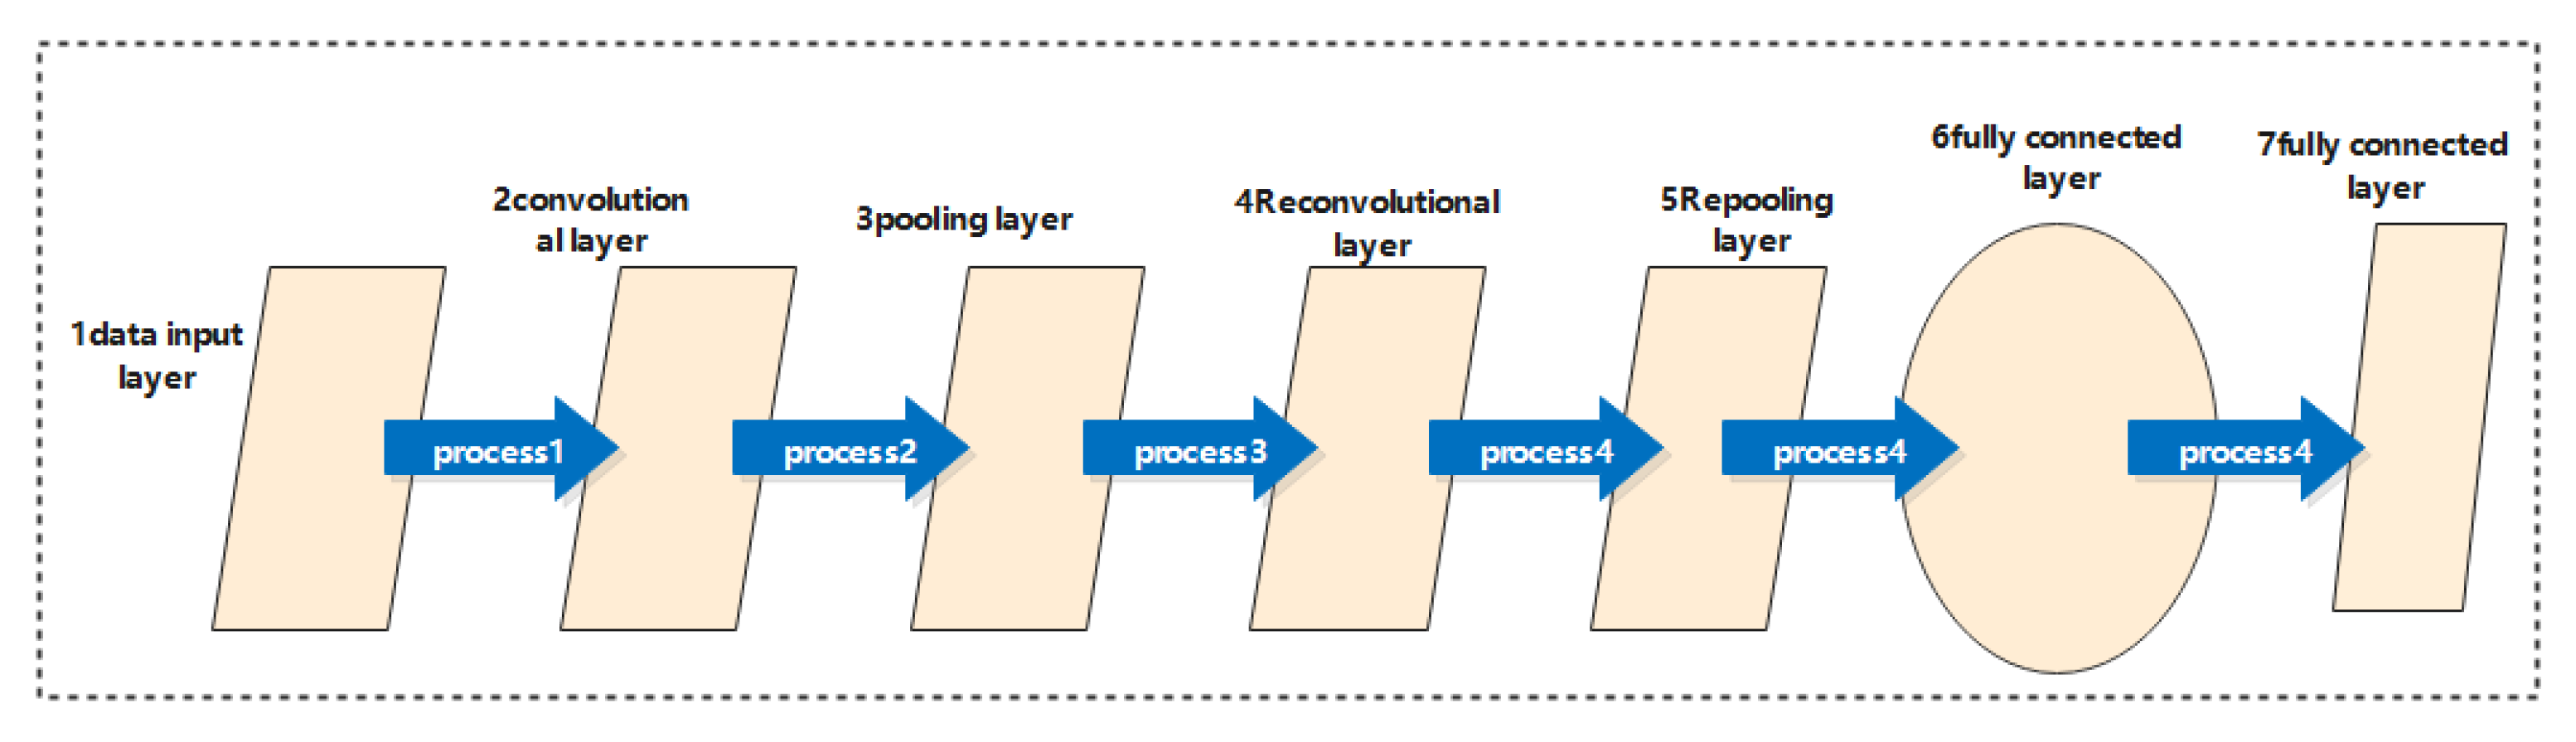
Figure 10 below [
28] shows the full process model diagram of a deep convolutional neural network.
4.3.3. One-Dimensional Convolution and Recursive Feature Extraction Algorithms
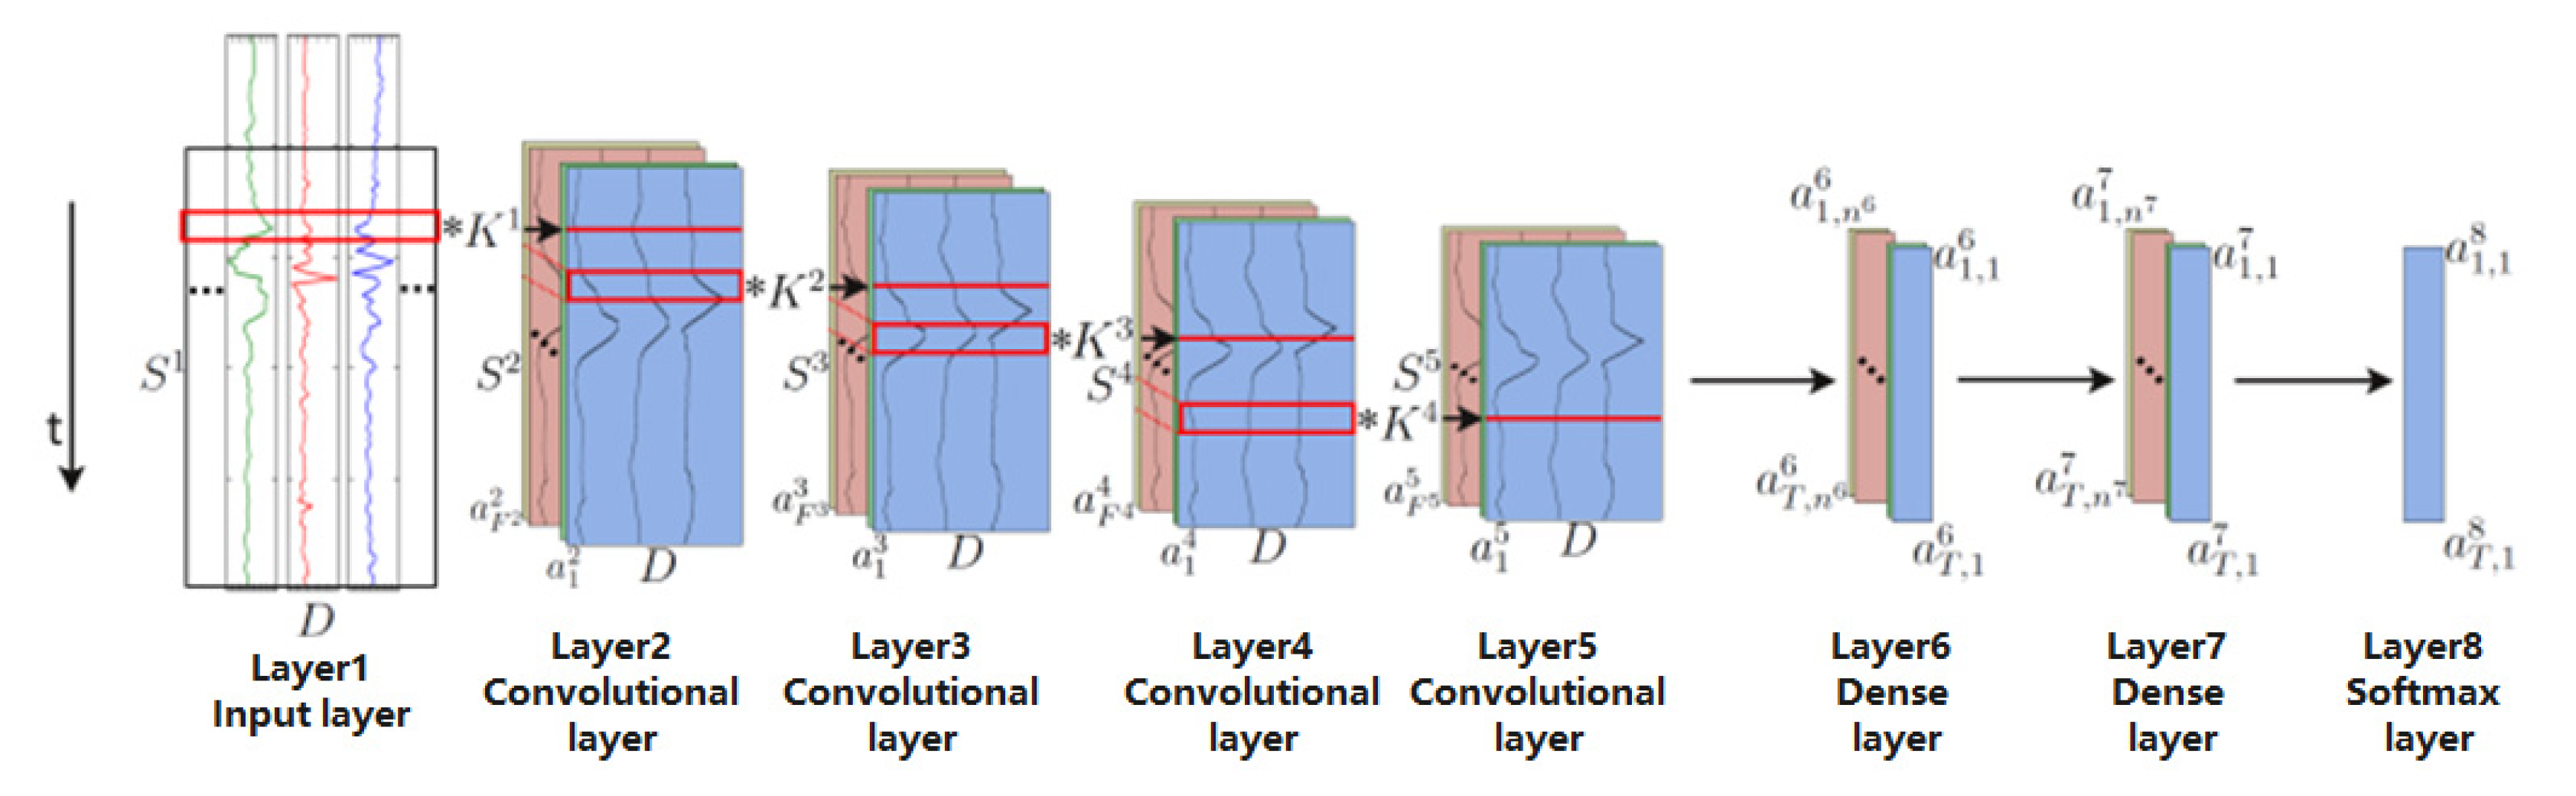
In the previous step, we used the HATP sample collection method and the output algorithm of the one-dimensional and two-dimensional convolutional neural networks to obtain the corresponding probability values, respectively. In the next steps, we will use a recurrent neural network. A recurrent neural network is divided into two output methods, one is combined with a one-dimensional neural network, and the other is data feature extraction under its algorithm. In the process of combining one-dimensional convolution, we use a new model structure algorithm called Deep-Conv LSTM [
29]. The feature of this algorithm structure is that the dimensional convolution features are converted into time series according to the recursive layer in the recursive feature by transmitting the features of the data. way to motivate. The first 4 processes in the 2D convolutional layer represented by the * in the figure are the network architecture for top-to-bottom data transmission. The overall process [
29] will be shown in
Figure 11 and
Figure 12 is the algorithm output of this process:
From the above figure, we can see that the total dimension and recursive layer are 8 sets of eigenvalues. The features in the model are transmitted in sequence according to the principle of time series [
30]. Additionally, there are multiple channels for a single feature in each model. The content in the model diagram is the input data from the sensor from left to right. The first layer in the picture is the input data value of the receiving sensor device, the 2–5 layer is the convolution layer data, and the 6–7 layer is the nonlinear layer. The relationship incentive layer, the last eighth layer, is the classification result of the acquired behavior data [
31]. The positioning in the model diagram is that the layer layer represents the data range D × S
1, where D represents the number of channels of the data, and S
I represents the data length of the first layer at this time. Layers 2–5 are convolutional layers, K I is the convolution kernel in the first layer, F
I is the number of features in the first layer [
32], and a, i, I are the feature map excitation of the first layer. The last layer 6, and layer 7 are hidden recursive layers. a, t, I, I represent the excitation data from layer i to layer I at time t in a given time series.
The above equations are designed using the fusion of two sets of data, one-dimensional convolution and recursive features. S
(J+I) represents the eigenvalue after the fusion of the two, S
I represents the number of sample records, PI represents the length of the convolution kernel of the first layer, and the number 1 is the result reference value. After adding 1 to the two sets of eigenvalues, the result will be >1, which will satisfy the output requirements of the algorithm. In the output process of the algorithm, the final S
(J+I) can be established only when the characteristic data of both are in a state of >0 [
33].
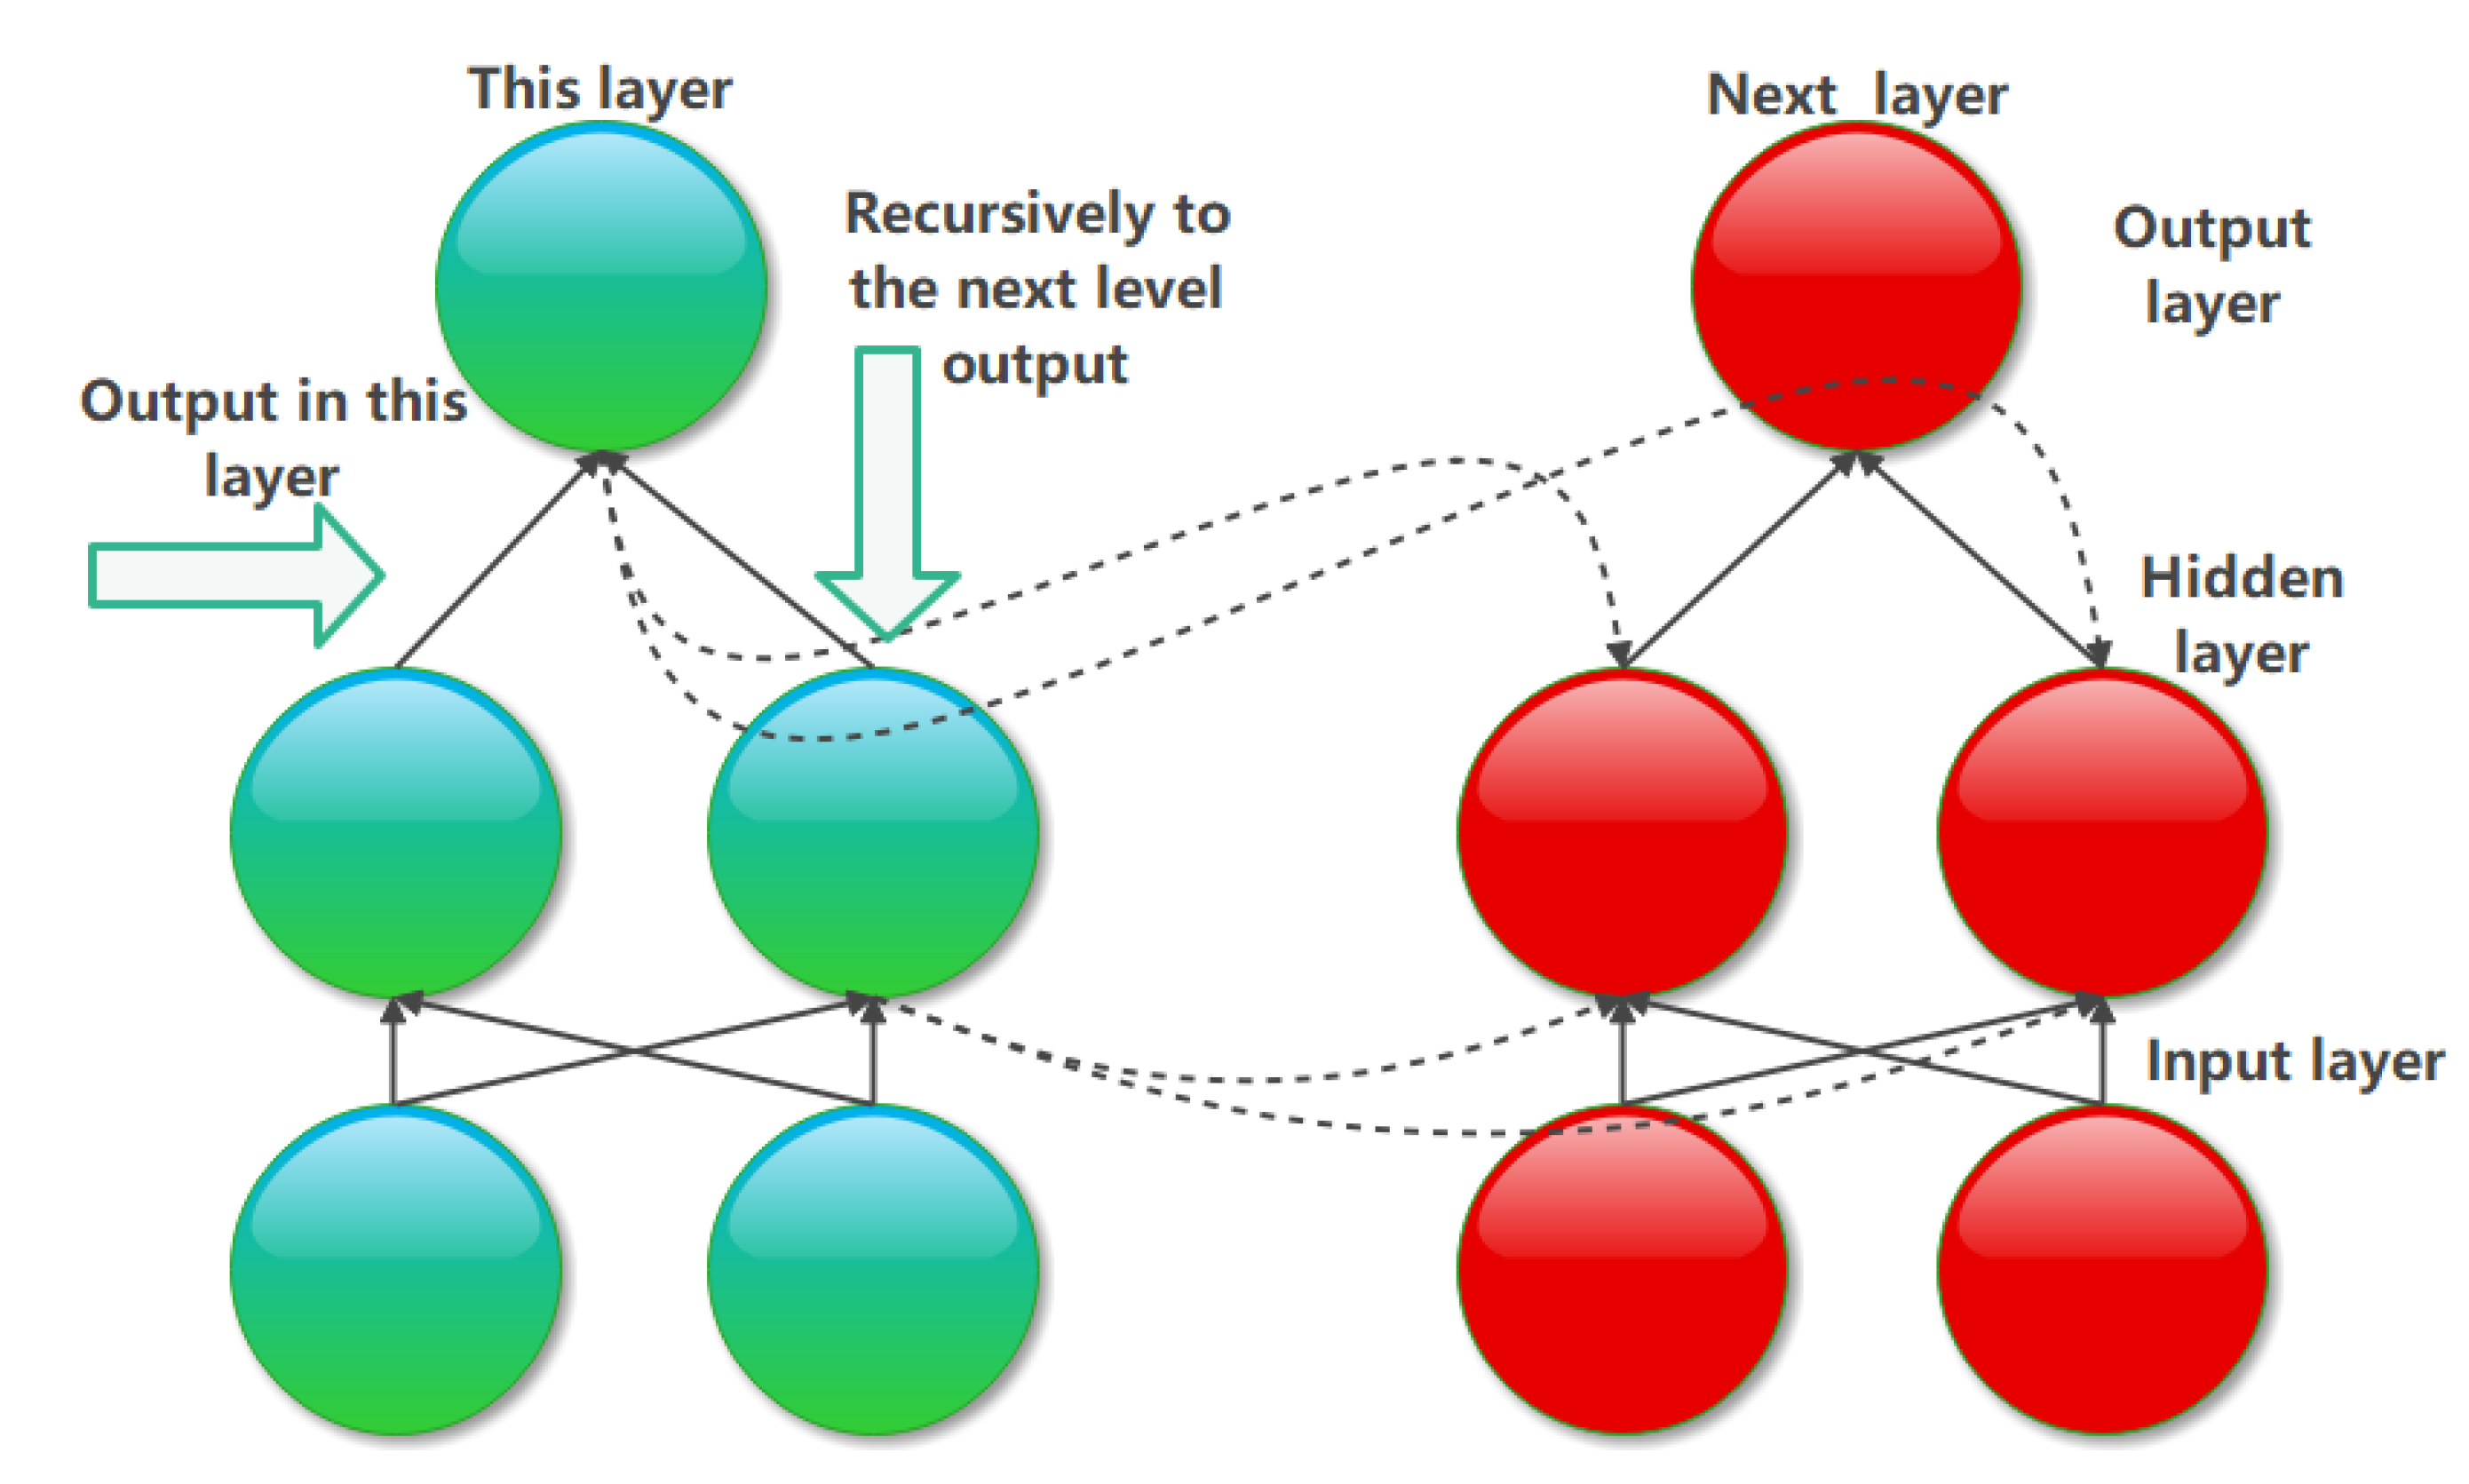
4.3.4. Recurrent Neural Network RNN Algorithm
In this step, RNN is different from the convolutional neural network CNN algorithm [
34]. Through the previous literature survey, it was found that the structure of RNN has a feedback function; that is, the output process is not limited to the next layer in this structure. After the level is over, it can recurse to the lower structure for feature transfer output mode. In addition to output in the current layer, the hidden layer in the RNN can also output at the next time point [
35].
Figure 13 is the model structure diagram [
35] given according to the characteristics of the RNN algorithm, and the algorithm of this process [
35] is shown in
Figure 14.
The output of the algorithm is shown in
Figure 14:
It is described in
Figure 12 that the output mode of the current layer and the next time point is a dotted line connection, and the connection mode in this layer is a solid line connection. This paper chooses the weighted summation method in the output of the algorithm in
Figure 13. The method is to carry out the combination according to the combination method, i is the base number for the combination, and I is the final value in the combination. After calculating all the layers in the output process, add them up, and obtain the output result of the final RNN algorithm, as shown in
Figure 14. In the algorithm process, this process is still carried out in the way of true and false value judgment. After all the characteristic C values of RNN have corresponding numerical output in each group, the program can calculate the total eigenvalue of sum after summation through the algorithm. Otherwise, no return value is output for an error.
4.3.5. Long Short-Term Time Memory Network LSTM Algorithm
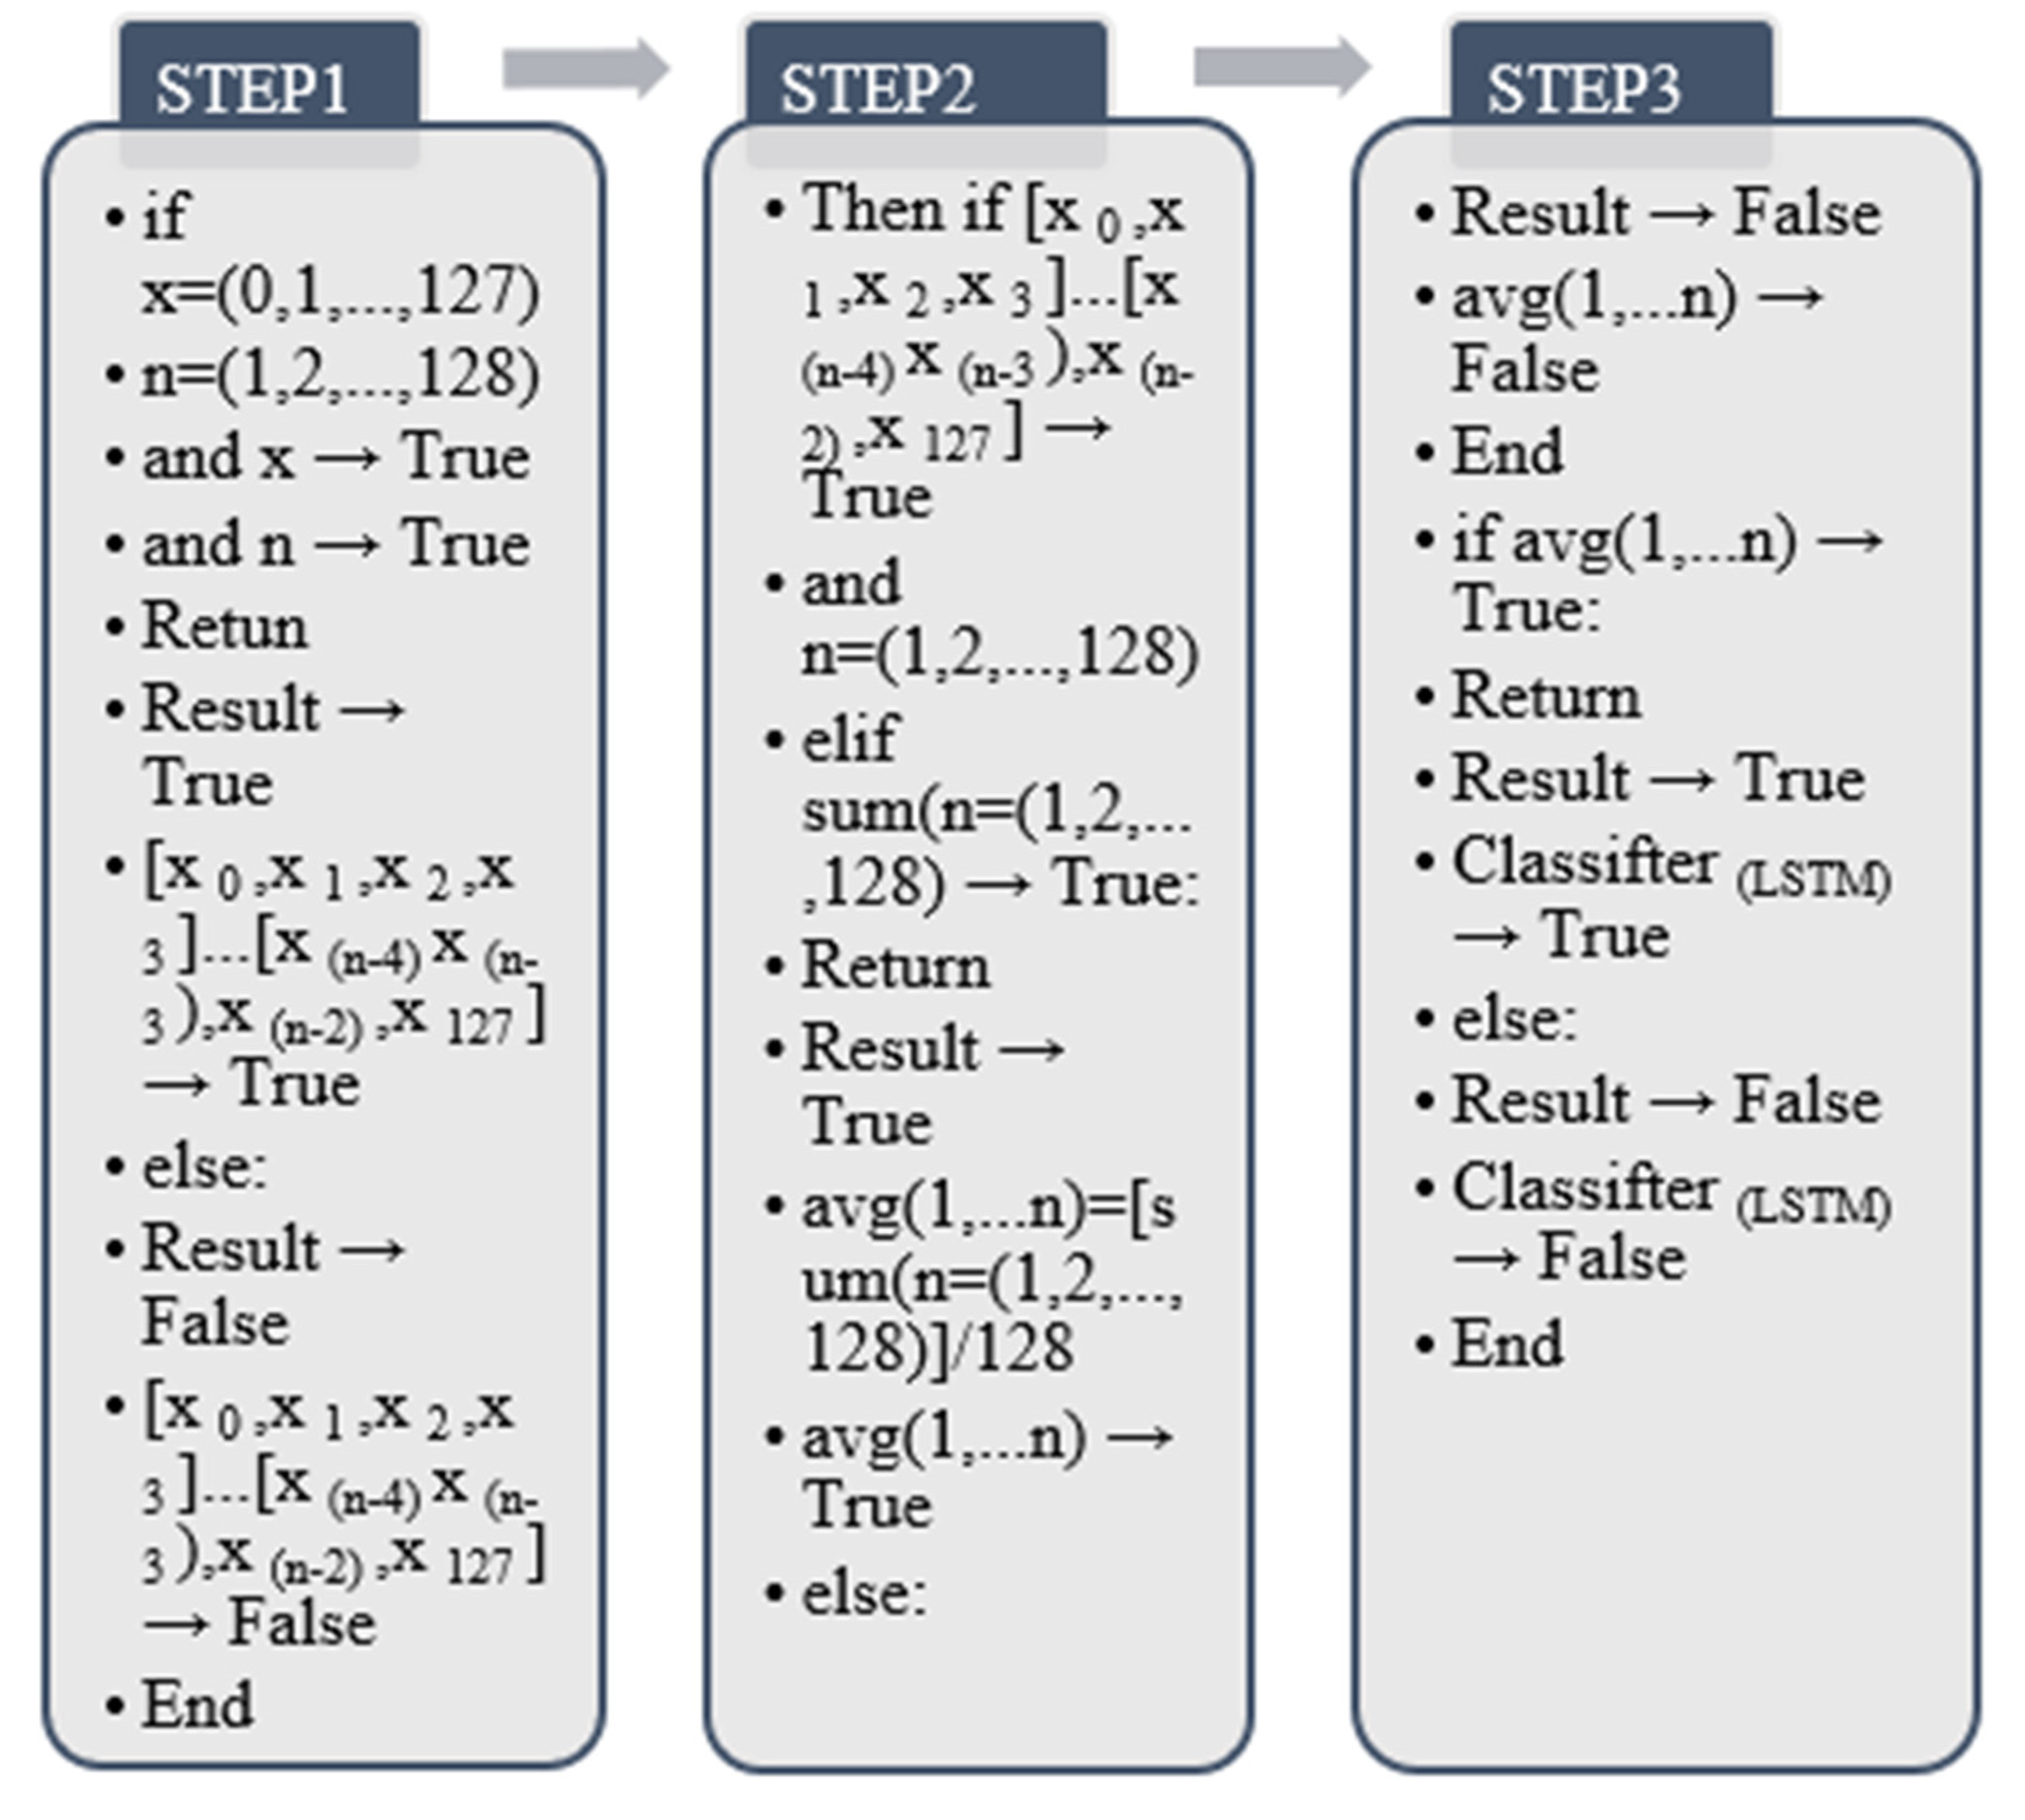
The LSTM algorithm is an important link in the memory network. This paper uses the LSTM algorithm to memorize and transmit data in the upper and lower parts of the time series. The LSTM algorithm is expected to use the matrix method, and the matrix method will use base 4 as the benchmark, and each matrix needs to be exponentiated during the bottom-to-top transmission process [
36]. The method used in this paper is divided into three LSTM layers, and the LSTM in each layer adopts a one-way transfer. The data values of the 3 LSTM layers are calculated in 3 squares of 4 from bottom to top. The total number of vector sets will be 4 4 = 128 eigenvectors. The final output will be the probability of the corresponding action class.
Figure 15 is the process model, and
Figure 16 is the corresponding matrix algorithm [
36] output:
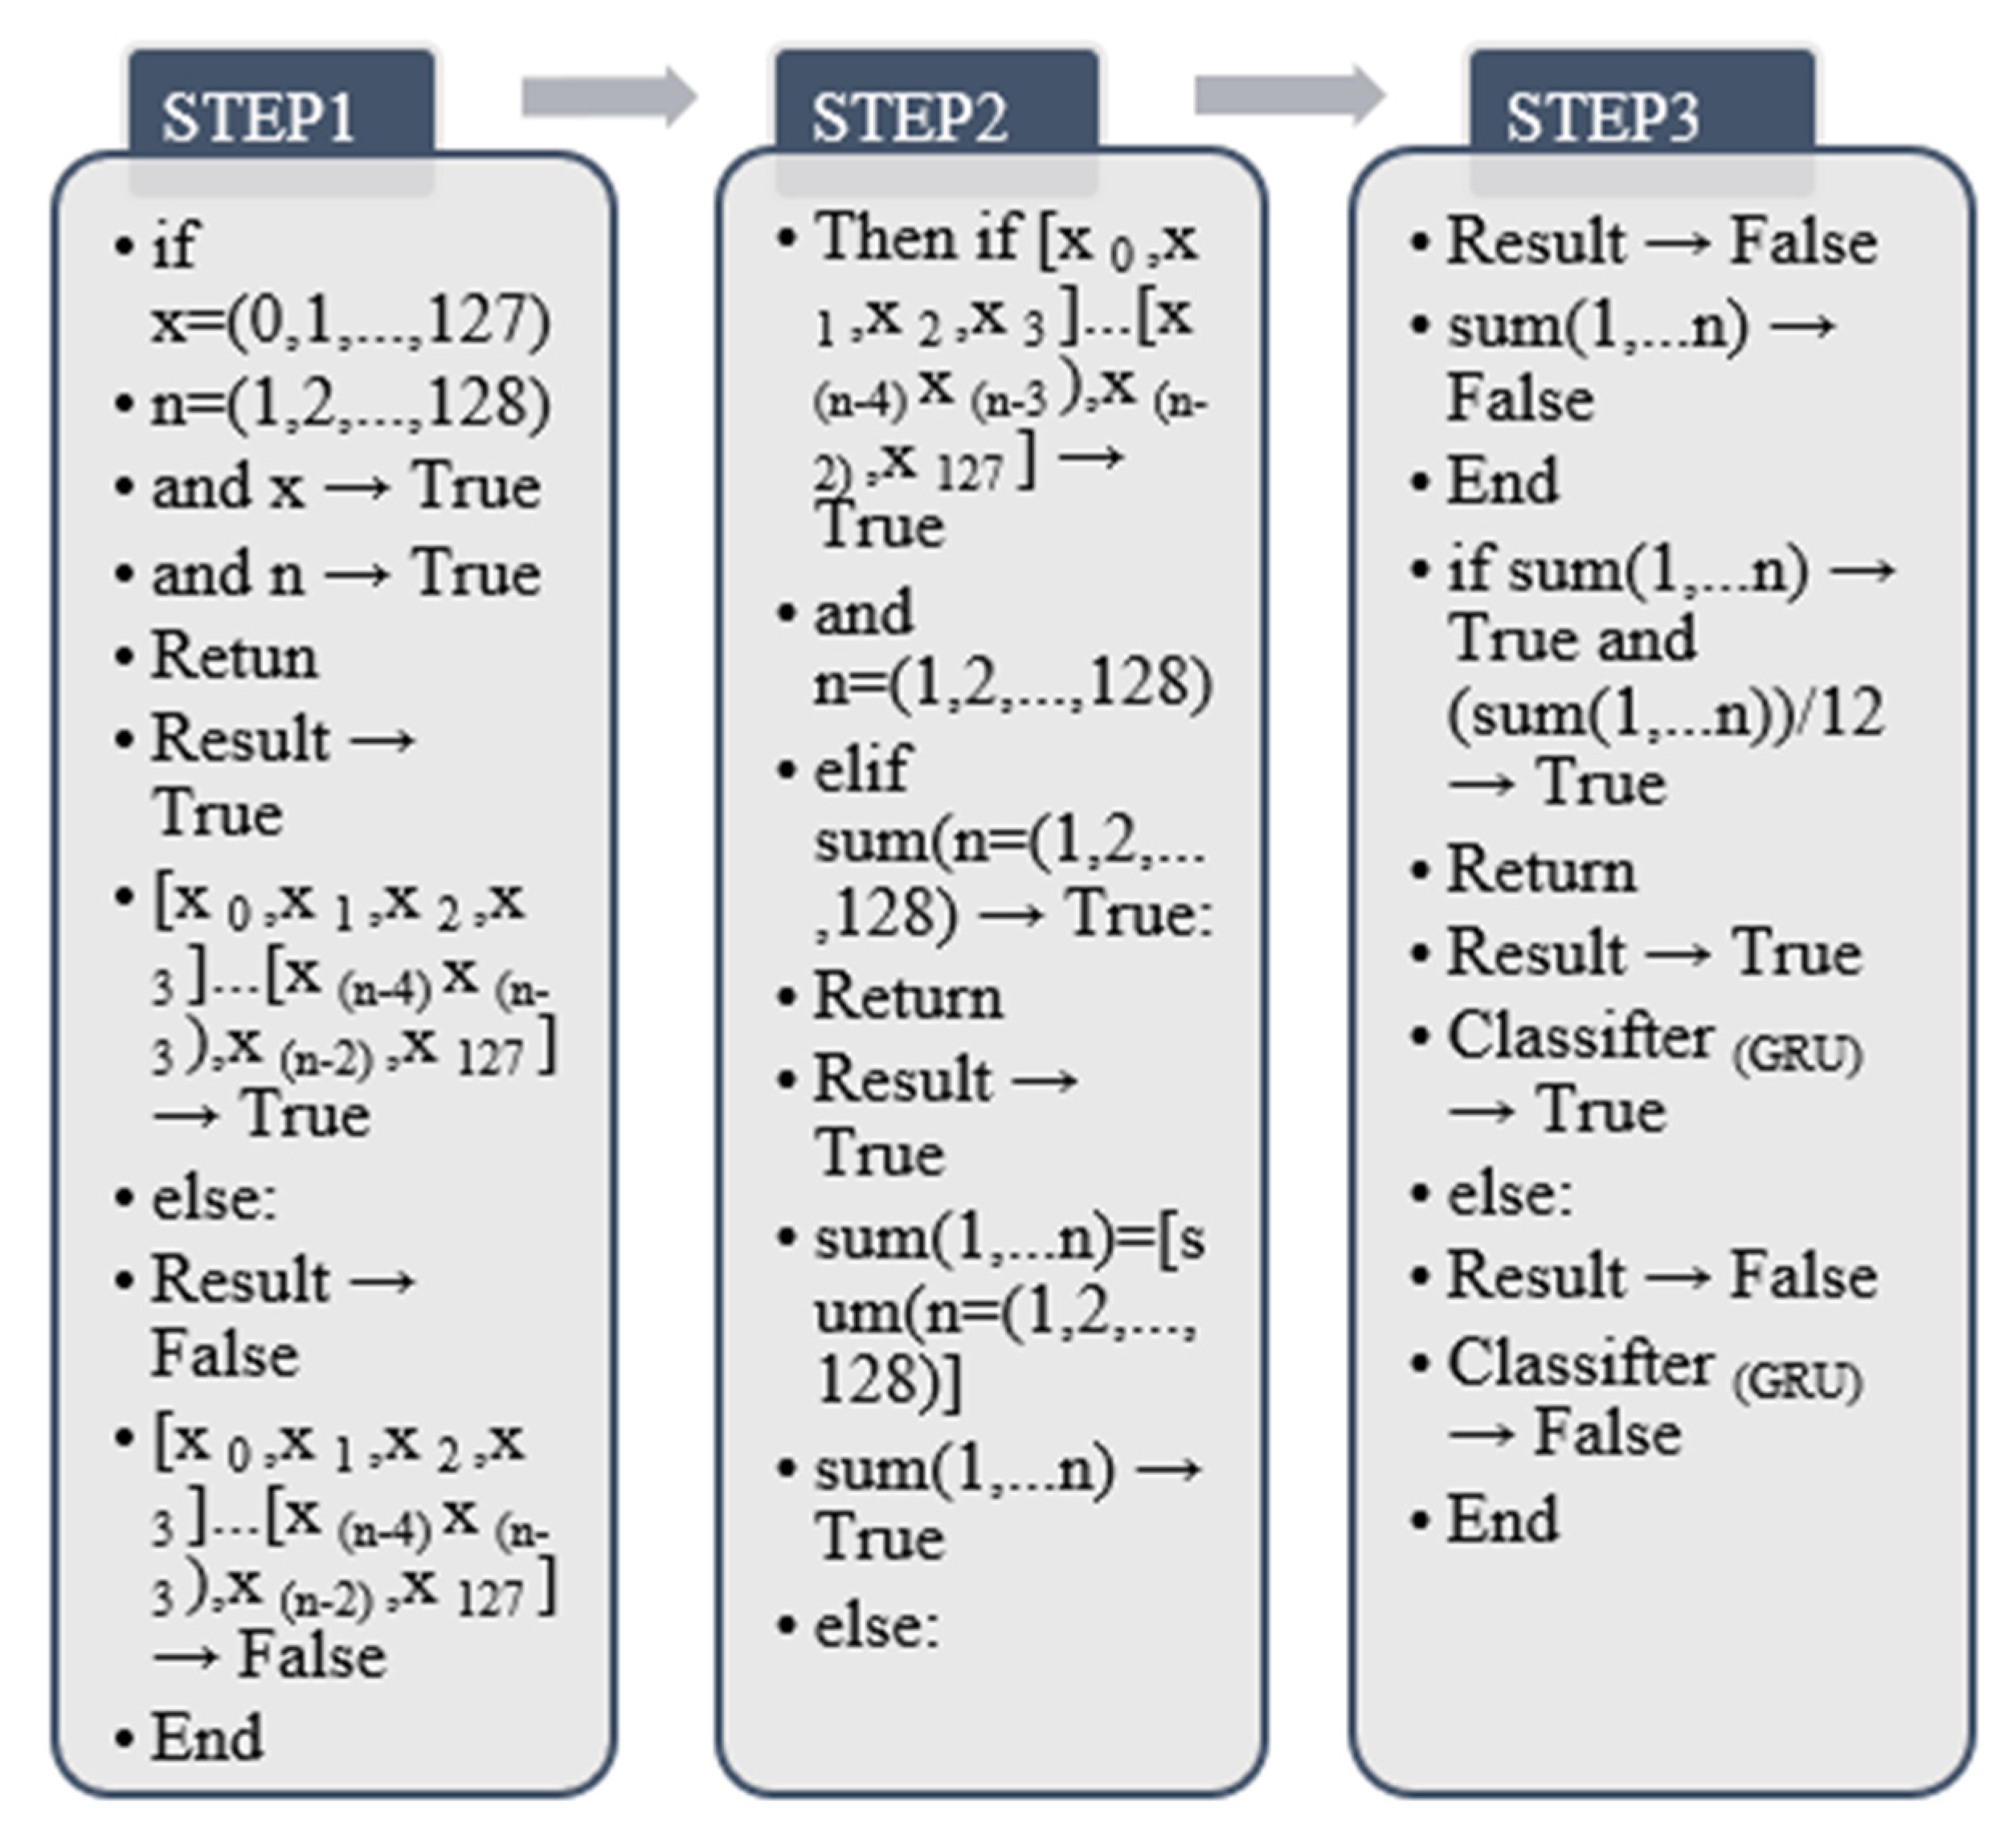
It can be seen from the above formula that the output of this unit starts from X
1 and ends at X
127, and has undergone the calculation between 128 vector sets in the middle [
37]. This algorithm adopts the method of cumulative addition at one time and finally takes the average value, from which it is calculated that after the LSTM algorithm passes the initial value of X
0 to X
127 in one iteration, the final sum is divided by the passed digits, and finally calculated Average Classifier
(LSTM) for this round of processes [
38]. In the output of the algorithm in this process, 4 groups of eigenvalues are used to output in matrix form in sequence, and the eigenvalues start from 0 and end at 127. In the algorithm, the architecture uses each set of vectors to output the eigenvalues as true. Finally, the python program will calculate the LSTM result through the algorithm and return it as true. If there is an abnormality (data error or feature) in each set of vectors in the output process, the final program will have no feature value and return false.
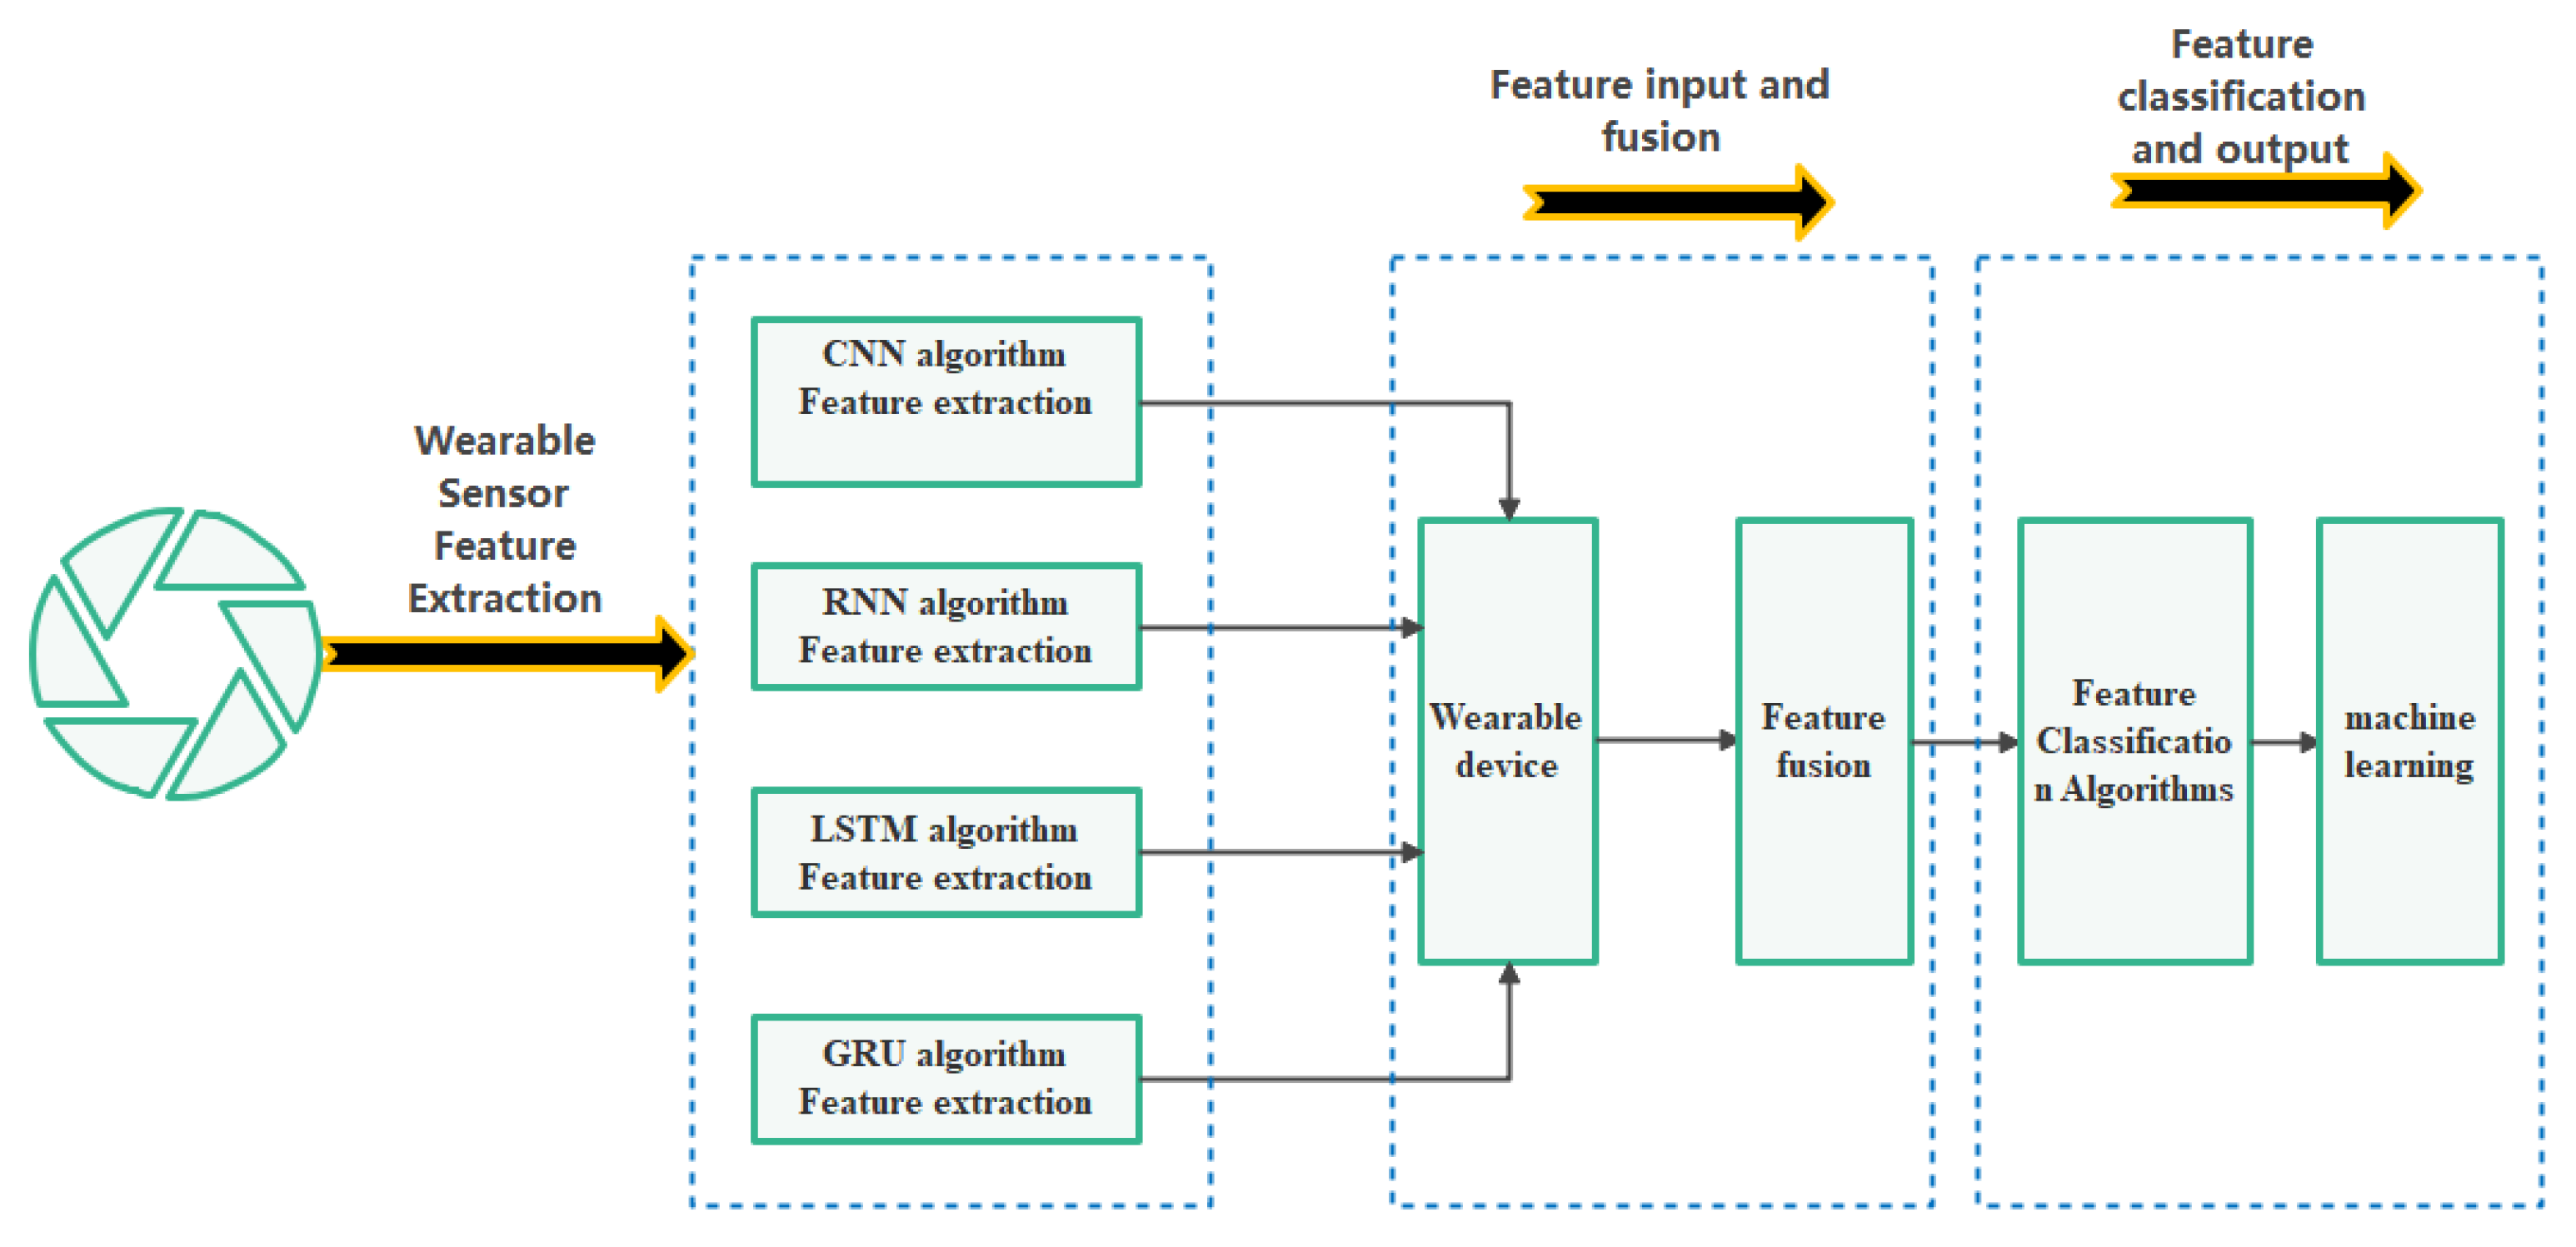
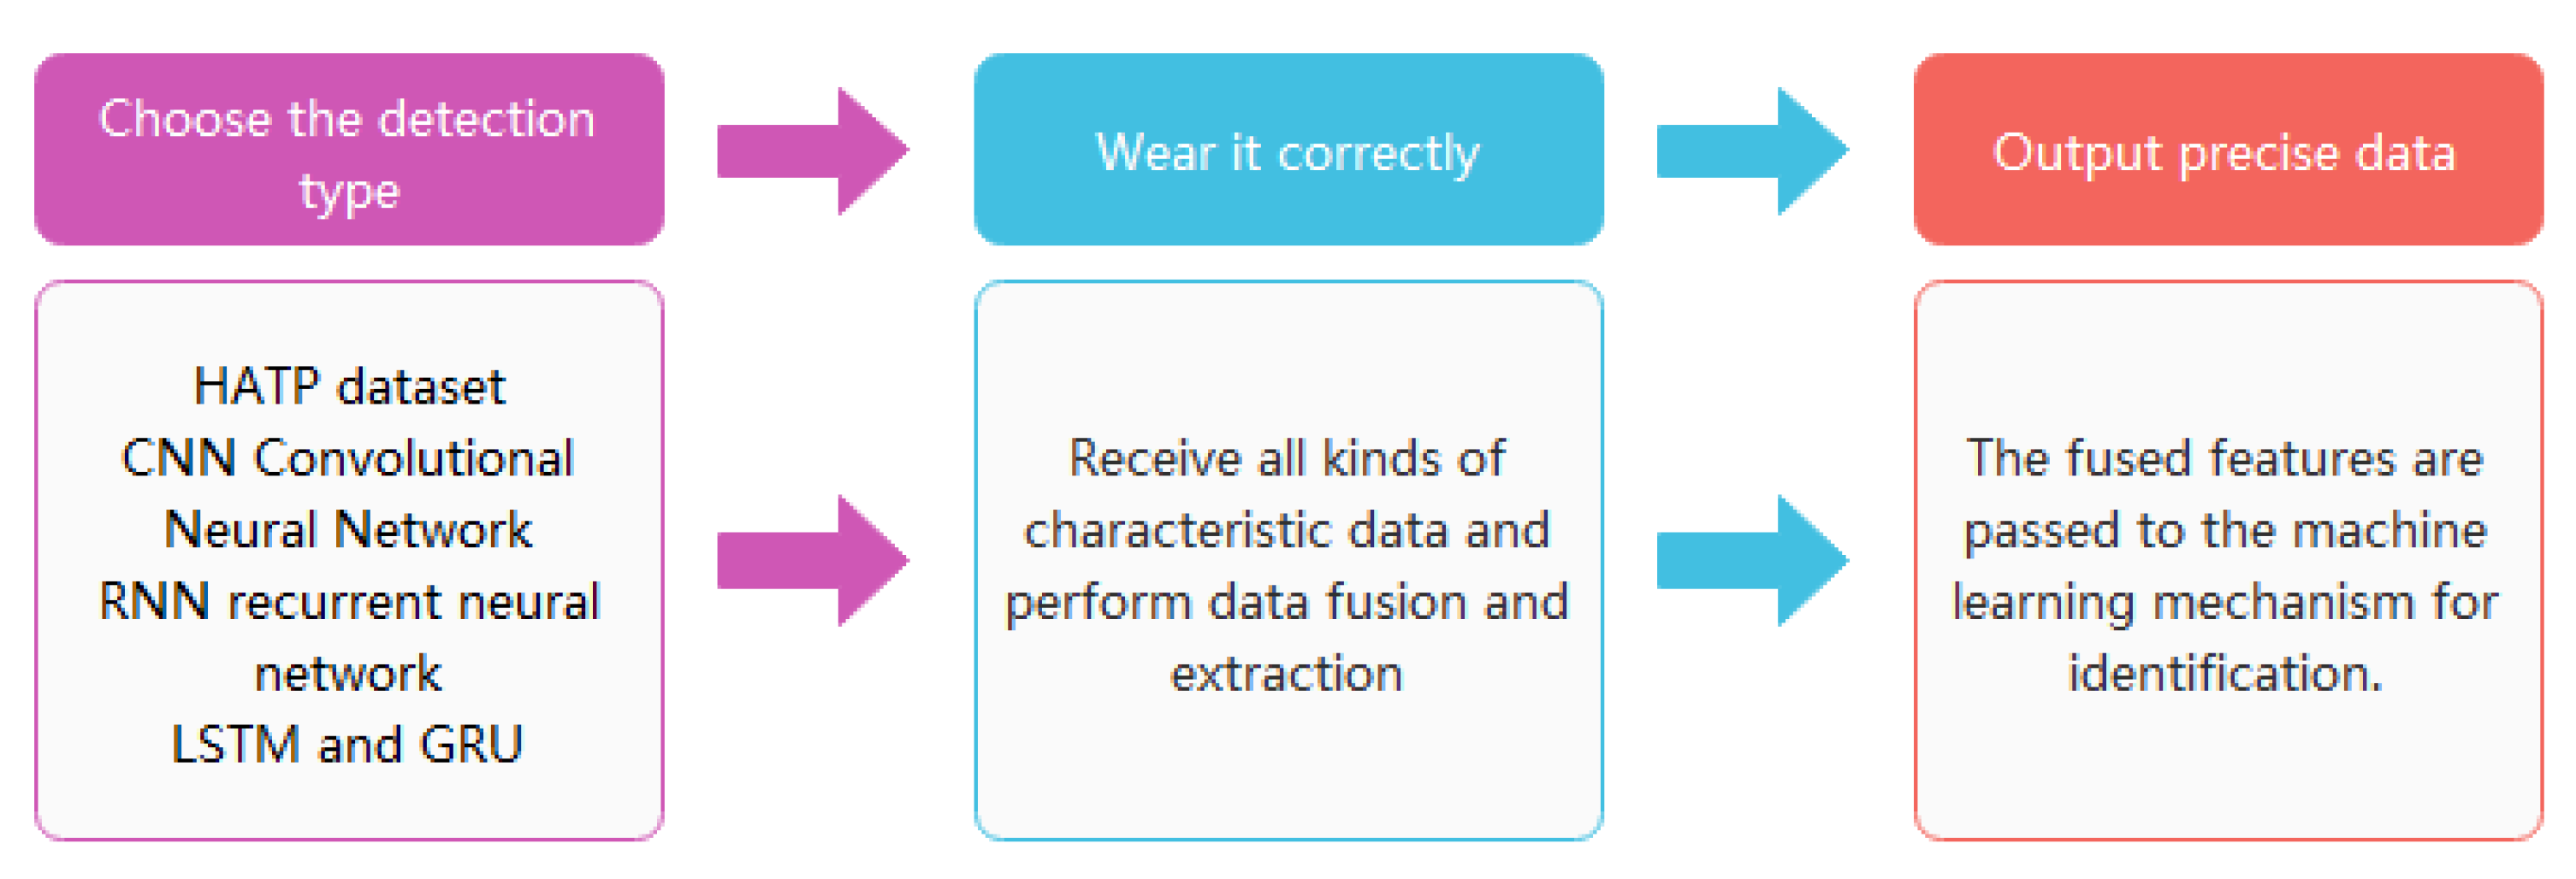
4.3.7. Fusion Algorithm Output of Wearable Devices (Core Part)
The use of the wearable medium is to uniformly extract the algorithmic feature data in all previous steps and transmit it to the detection mechanism for identification. The whole process includes two parts: feature extraction and feature fusion. The feature extraction part is to extract all the output features of algorithms such as CNN, RNN, LSTM, and GRU. The feature fusion part is to integrate and classify all the extracted features [
39]. The classified human behavior data features will be sent to the intelligent device after machine learning using transmission, and the intelligent device will recognize and analyze the fusion according to the content of machine learning. Data and test results. The actual working principle model of the wearable sensor used in this paper is gyroscopic. The overall implementation process for wearable sensors falls into 3 broad categories. The method adopted [
39] in this paper is shown in
Figure 18 as follows:
According to the particularity of the input and output process of the wearable sensor and the summary of the algorithm in the previous research, in this link, the wearable medium sensor needs to go through three processes acquiring features, fusing features, and outputting features at the same time. In order to realize this operation, this paper will combine the three parts of the algorithm to obtain the following calculation formula and algorithm output [
40], as shown in
Figure 19.
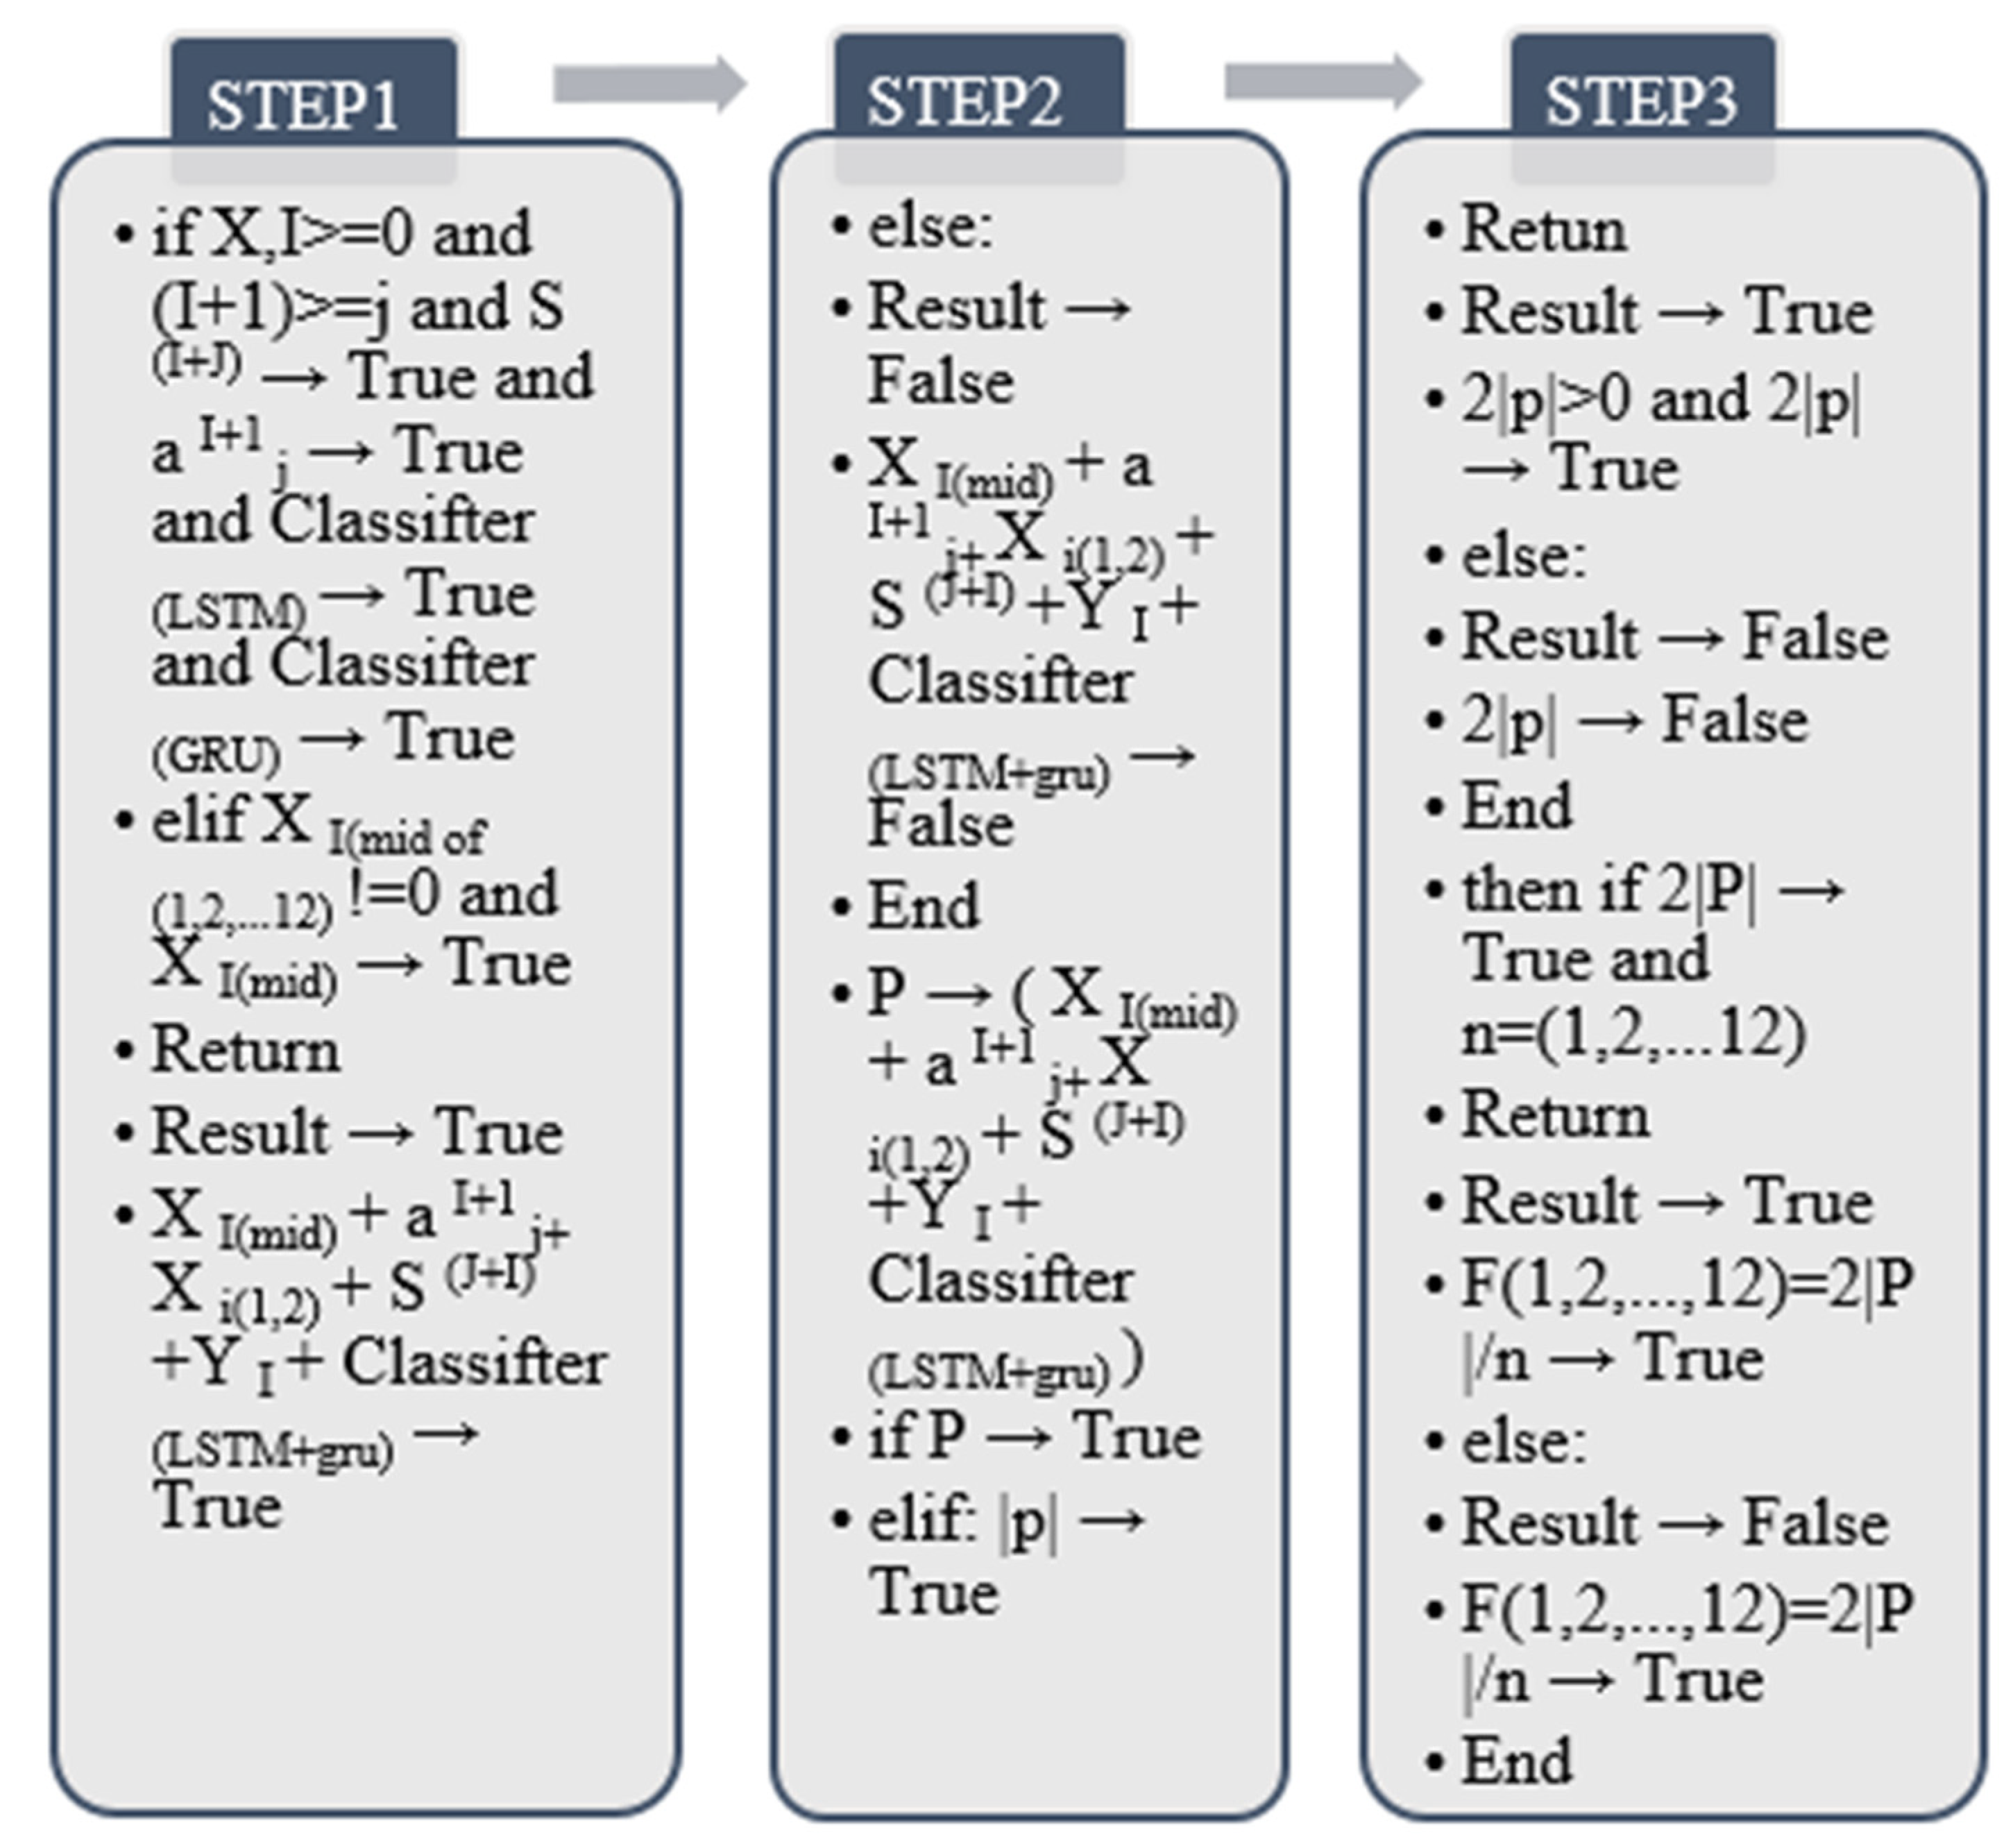
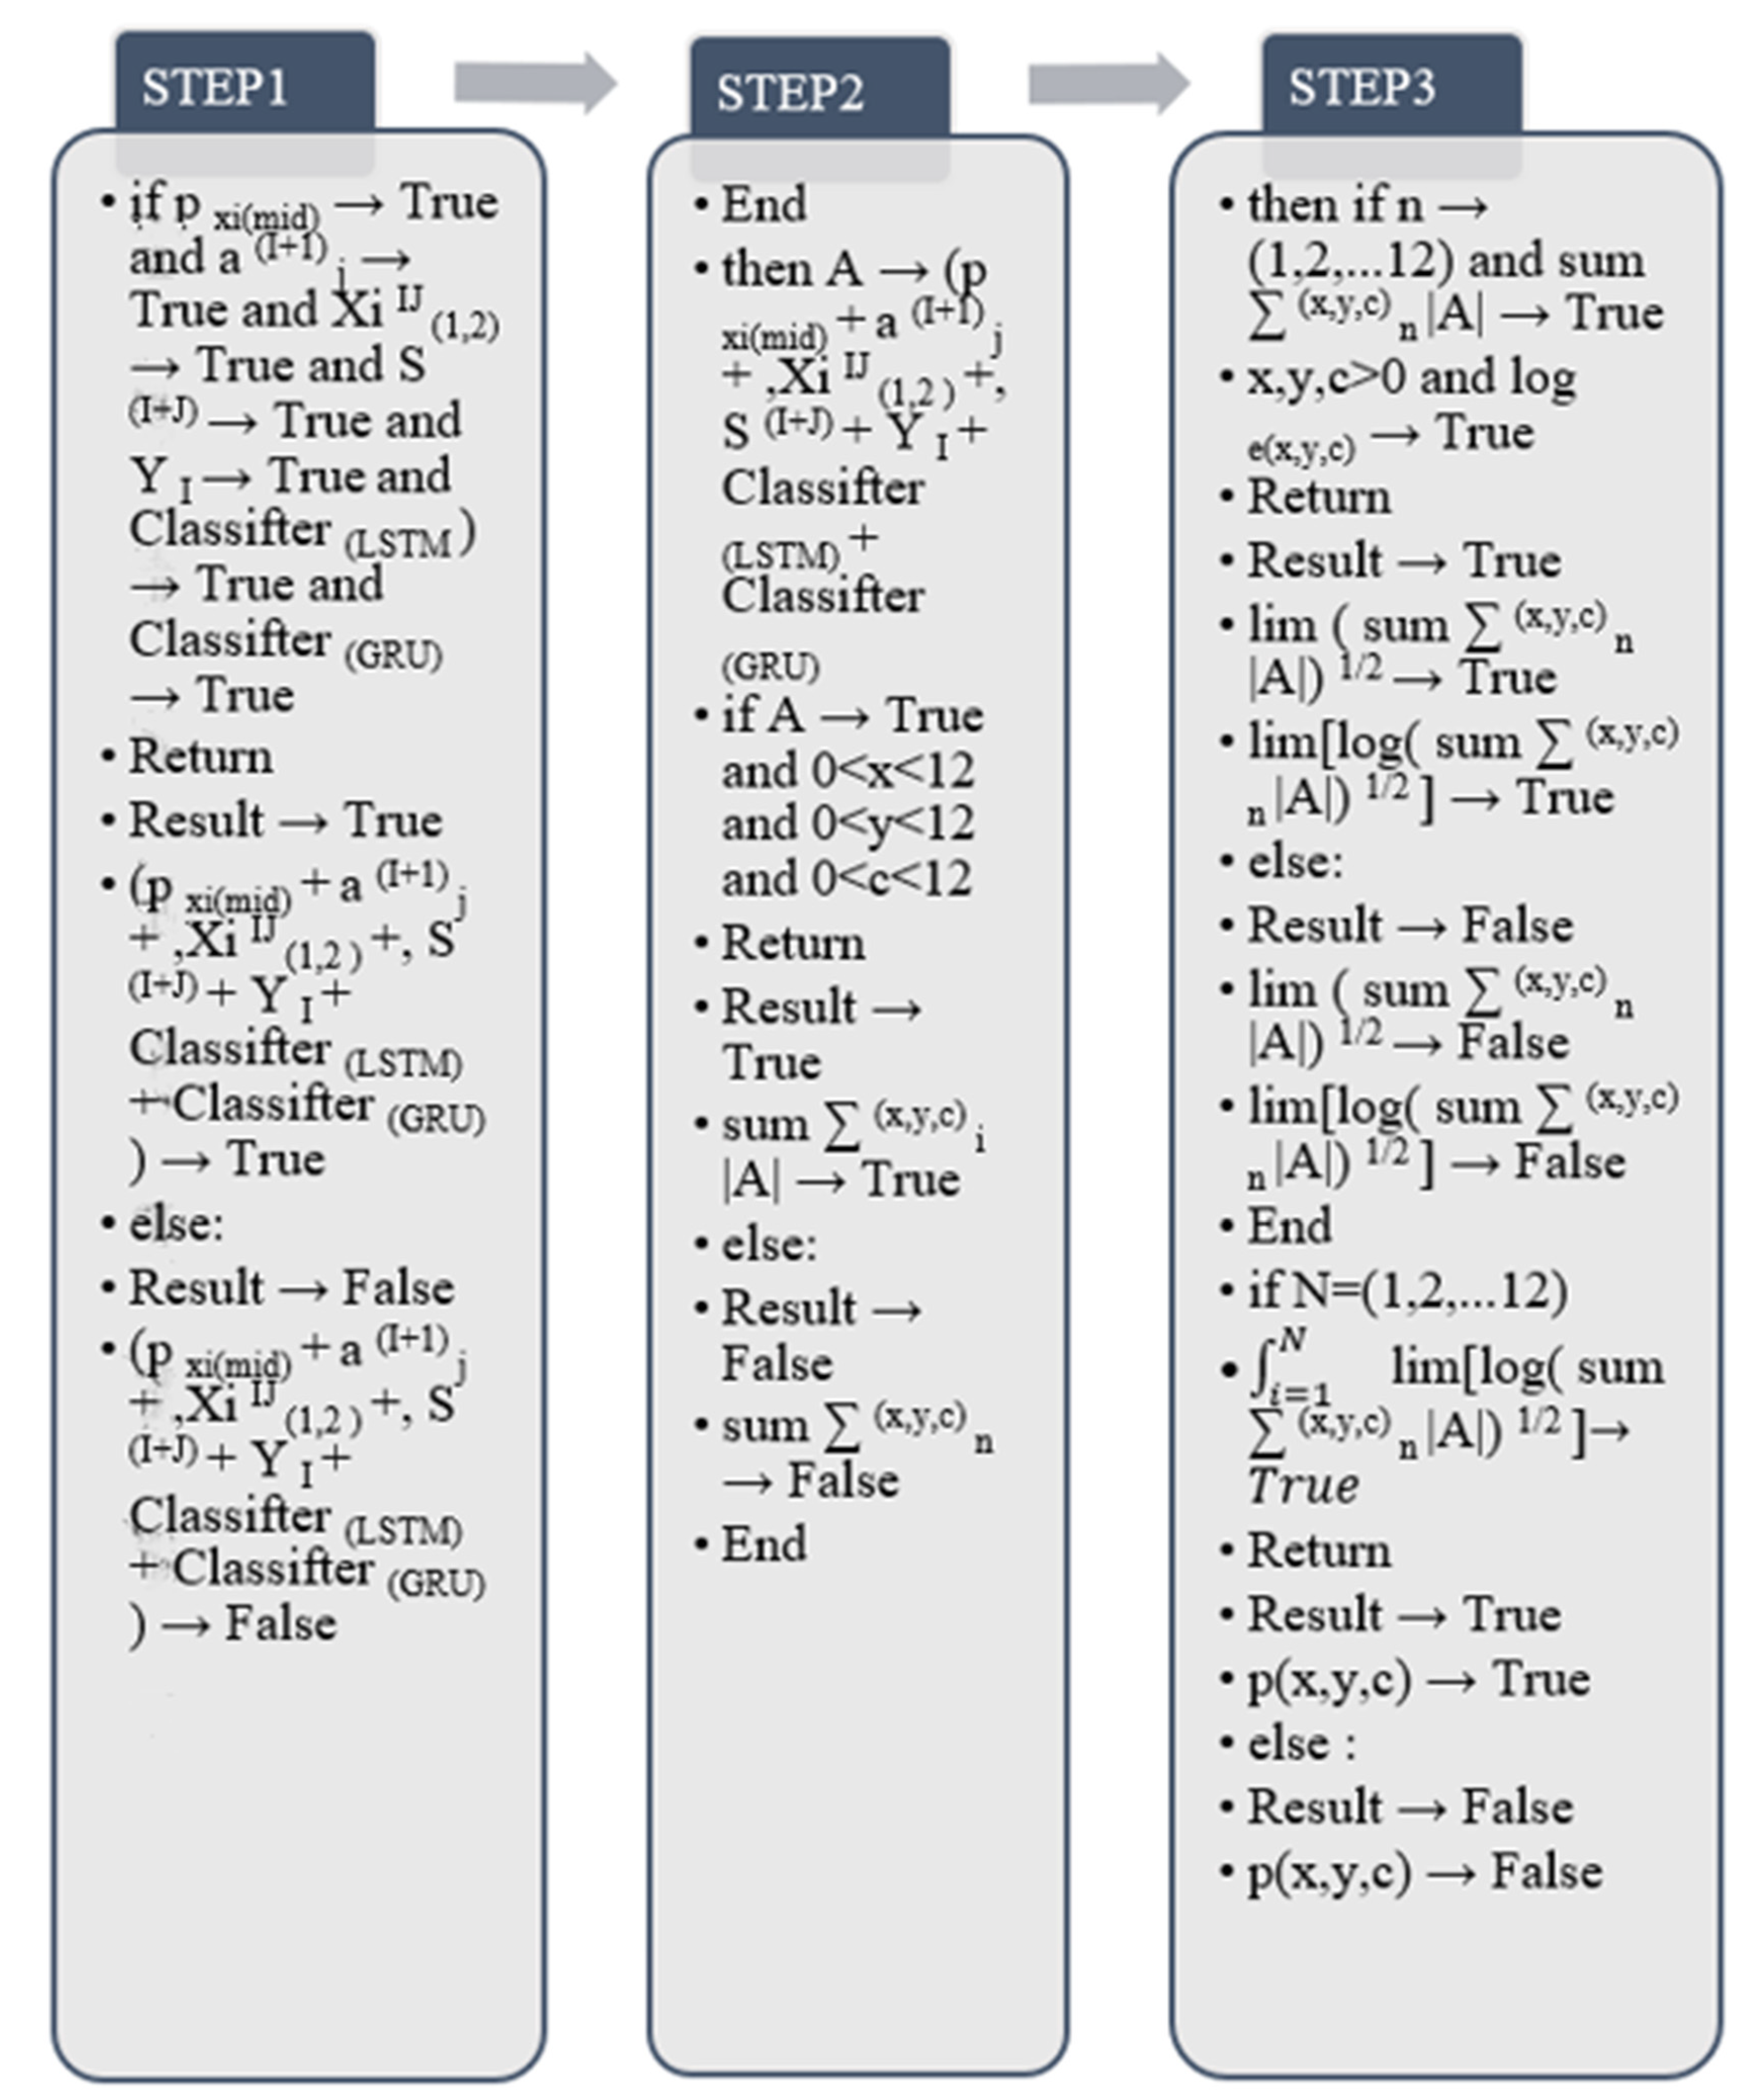
In the above formula, this article uses the contents of all the algorithm formulas used in the previous stage to add the sequence. The sequence range is 1–12 because there are positive and negative differences in the 12 human behavior identification features; first, use the formula to identify and transfer the wearable sensor and subtract the sum of all acquired features with a standard value of 1 (The summation part is the sum of all the data of each behavioral feature). Secondly, because the feature has a relationship between positive and negative values for feature extraction, this paper uses the absolute value to take a positive number. Finally, you need to multiply the total difference by 2. Furthermore, double the result [
40]. In addition, the value range of n is 1–12 (12 kinds of human behavior characteristic data). In the algorithm design, it is necessary to extract and add the features of the algorithms in each previous link one by one. After obtaining the algorithm data of one step, divide it by n, where n represents the specific classification of the currently obtained fusion data. After the human behavior of the corresponding classification feature is acquired, the following feature part will end and will not be acquired again.


 ,
, 


