Abstract
This article examines Australian high school students’ knowledge of food and fibre industries based on their exposure to agriculture. This research explores the agricultural knowledge of students from year 7 to 10 students (N = 2603) from 47 schools across Australia in 2021. Through a survey, agricultural knowledge questions were classified into livestock (LK), crops (CK) and general knowledge (GK). Exposure to agricultural environments based on location and farming exposure were compared between the groups to assess their level of knowledge achieved. Agricultural knowledge levels in the CK and GK groups were comparable, with both significantly higher than LK. Exposure to agriculture impacted the level of knowledge achieved, increasing as students gained more exposure, particularly in livestock. The results highlight the importance of experiential learning to enhance student knowledge of agriculture. Future research should explore what the expected agricultural literacy is of Australian secondary students for each grade level, requiring benchmarks to be established.
1. Introduction
Agriculture plays a critical role in the global economy in terms of revenue, international trade, The World Bank (2025), and future food security. Yet, as the world becomes increasingly urbanised, the divide between rural and metropolitan populations continues to grow. This is particularly true in developed nations such as Australia (PIEFA, 2020). At the turn of the 20th century, almost 1 in 10 people in Australia were engaged in agricultural or pastoral pursuits (Australia Bureau of Statistics, 2025). As of 2023, this number was closer to 1 in 50, highlighting the growing divide (ABARES, 2023). Additionally, the world population is expected to grow by over a third (approximately 2.3 billion people) between 2009 and 2050 (FAO, 2009). The question, therefore, of how to feed this growing population with a smaller and less engaged workforce and less arable land is one of the greatest challenges facing contemporary agriculture (FAO, 2009). Moreover, the nature of agricultural work is undergoing significant change, with production systems becoming increasingly professionalised in response to the changing complexity of farms (Bassett et al., 2022). The attraction of educated and skilled workers is, therefore, key to maintaining productivity (Penn et al., 2018), particularly in Australia where there are four available jobs for every tertiary graduate (Pratley & Botwright Acuña, 2015). To achieve this workforce supply, the attraction of candidates at a school level is necessary (Peltzer, 2020). Adequate education can facilitate this by ensuring students are aware of both the sector’s importance and the many opportunities available within.
Australian students are introduced to agriculture through their school curricula. Under the national curriculum (ACARA, 2025a), agriculture is primarily taught to secondary students in Design and Technologies, though opportunities for connections through compulsory Years 7–10 Science, and Geography and Mathematics subjects are also possible (ACARA, 2025b). In the Design and Technologies curriculum, though ‘food and fibre’ are a prescribed technology context, agriculture is, in general, not considered a primary focus of secondary school education. Furthermore, implementation of the national curriculum is the responsibility of each state and territory (NESA, 2025b), and often the decision of how agricultural content in incorporated is left up to individual schools. One exception to this is schools within the state of New South Wales (NSW), which must include an ‘agriculture and food technologies’ component as part of their ‘Technology Mandatory’ subject for Years 7–8 (NESA, 2025a). Technology Mandatory is specific to NSW and was developed by the NSW Education Standards Authority, which has legislative responsibility under the NSW Education Act 1990 for developing syllabuses to be taught in NSW schools.
Teachers have a crucial role in supporting effective student learning. J. Manning et al. (2022) highlights the importance of improving teachers’ opportunities to learn about agricultural-related technologies, including an introduction to the technologies and support for their implementation in the classroom. However, teachers’ beliefs and perceptions influence the transfer of knowledge to students. For instance, Oyugi et al. (2025) claims that greater self-efficacy among teachers would have a positive impact on teachers performance and motivation. However, high levels of burnout or job dissatisfaction affect perseverance in the teaching role. Furthermore, even educators who actively motivate their students to explore agricultural knowledge and careers may not be aware of the range of resources to integrate into classroom activities (McDonald et al., 2025).
In addition to an inconsistent implementation of agriculture teaching across the country, Australia also lacks a formal framework by which to assess student development of agricultural literacy (Cosby et al., 2022b). In the systematic review by Cosby et al. (2022b), the studies primarily used semi-structured interviews and extensive questionnaires to measure the level of agricultural knowledge. These tools focused on descriptives aspects, such as food origins and production and processing stages. Some studies compared groups, using academic assessments as a proxy for formal knowledge, while others explored prior experiences (e.g., animal husbandry, practical projects) as indicators of agricultural literacy. Whilst this represents a significant limitation, it is common across many jurisdictions, including the Africa, China, Indonesia, and the United Kingdom, where agricultural literacy is often an implicit outcome of the relevant curricula, rather than one that can be explicitly measured. This makes it difficult to accurately and reliably evaluate student agricultural knowledge both currently and over time. This contrasts, for example, with the United States, where the National Agricultural Literacy Outcomes (NALOs) provide a prescribed list of expected learning outcomes by grade level (Judd-Murray et al., 2024; Spielmaker & Leising, 2013). Categorised into five major themes: (i) agriculture and the environment; (ii) plants and animals for food, fibre, and energy; (iii) food, health, and lifestyle; (iv) science, technology, engineering, and mathematics; and (v) culture, society, economy, and geography, the NALOs outline benchmarks and outcomes for grade level bands (K-2, 3–5, 6–8, 9–12).
Previous research has demonstrated that early secondary school experience of science is associated with the decision to study the subject at higher levels (English et al., 2019; Whannell & Tobias, 2015). In a report by Ainley et al. (2008), the number of Year 12 students in Australia studying agriculture has remained fairly stable nationwide since the mid-1990s, falling slightly from 2.9% in 1995 to 1.7% in 2007. This was consistent with later findings by Kennedy et al. (2017), detailing a further drop in enrolments to 1.2% in 2014. Numerous factors were found to impact the participation in technology more broadly (under which agriculture was included), including the socioeconomic background, prior levels of achievement in school, and enrolment in a Government or Independent school (Ainley et al., 2008). Enrolment has also traditionally had a male bias; however, this has been less obvious since 2009 (Kennedy et al., 2017). The perception of agriculture as inferior and non-academic subject (Graham, 2021; Stephenson et al., 2008) may also have contributed to this decline. This, however, is an imbalanced and incorrect perception of the industry, as modern agriculture moves toward higher-skilled and educated roles (J. K. Manning et al., 2024a; Wu et al., 2019) that can also be based in urban areas (Graham, 2021; Lockie et al., 2020). Placing a greater emphasis on promoting this reality, as well as improving the agricultural knowledge of school students is expected to increase awareness of career opportunities (Wu et al., 2019) and to encourage them to choose a pathway in the industry. To better understand the current gaps in Australia’s education system however, it is important to first gain an understanding of the current agricultural knowledge of students by industry. Additionally, other factors could also influence the future workforce in the agricultural sector, such as life experiences and experiential learning (English et al., 2019; Kamuzora, 2025; O’Dea et al., 2023), which should be considered to enhance knowledge of employment opportunities.
This paper examines Australian secondary school students’ (Years 7–10) knowledge of agriculture, with a particular focus on identifying knowledge gaps across agricultural topics (livestock, crops, and general knowledge) and how exposure to agriculture affects these gaps. This case study is an in-depth analysis of surveys collected from secondary school students in Australia and was described alongside the results of primary school surveys by Cosby et al. (2022a). The new hypothesis presented in this article allows us to deepen our knowledge related to the research question initially answered in (Adams, 2022). The reason for analysing secondary education in greater depth is that the Australian curriculum, in both state and territory curricula, includes a Design and Technology subject, with a more specific agricultural section compared to the primary curriculum, which is much more general. Therefore, it is crucial to explore these outcomes to determine whether secondary school students are learning what is included in the curriculum. However, due to the breadth of the content, this is very difficult to verify. Consequently, extensive research is required to establish benchmarks, such as those used in the United States (Judd-Murray et al., 2024). In this research, it is hypothesised that students know more about livestock, because agriculture in schools is easier to obtain students’ interest, due to their interest in animals. Animal related activities can be more emotional and memorable for students, especially when they involve direct interaction as raising animals or incubating eggs. These experiences tend to foster deeper emotional connections and enhance the learning process. On the other hand, crop-related activities are usually more technical and integrated with STEM subjects (Cosby et al., 2022b).
In a global systematic review by Cosby et al. (2022b), it was stated that location influences the agricultural literacy levels of secondary school students. In general, rural students possess higher levels of agricultural knowledge. However, there is a knowledge gap in Australia, as the exploration of this effect on students’ knowledge levels is still in its early stages. The aim of this research is to better understand the knowledge and understanding of secondary students across agricultural industries. The research questions addressed are as follows: Is the level of knowledge achieved similar between crop, livestock, and general agricultural topics? How does exposure to agriculture influence secondary students’ knowledge levels in livestock, crop production, and general agricultural topics? Without an existing assessment framework, formal benchmarking against expected learning outcomes is not possible. Still, it is anticipated that this research as a case study will provide insight into the current agricultural knowledge of Australian secondary school students and identify potential areas of improvement.
2. Materials and Methods
2.1. Data Collection
Australian secondary school students in Years 7–10 were surveyed to determine their level of agricultural knowledge (Cosby et al., 2022a). All schools in Australia were invited to participate via email and social media and were able to self-elect to participate. The survey was designed for students in years 7–10 (secondary school) and was available in hard copy or online. The survey took students no more than 20 min to complete and was supervised by teachers, after previous parent and principal consent. The survey consisted of 16 closed-response questions and one open-response question. Most survey questions were multiple choice, with either one (n = 5) or multiple (n = 6) possible response(s) (i.e., ‘select all that apply’). There were also four true/false questions and one match-the-items question. Of the 16 closed-response survey questions, three were used to gather demographic data (gender, age, farm exposure) and 13 were knowledge-based. The questions were categorised into Livestock Knowledge (LK), Crop Knowledge (CK), and General agricultural Knowledge (GK) (see Supplemental Materials). A location variable based on school location and defined by the Australian Statistical Geography Standard Remoteness Structure (ABS, 2021) was used. The areas were classified as Major City (MC; n = 470), Inner Regional (IR; n = 1316), Outer Regional (OR; n = 682), Remote, and Very Remote). However, for this study ‘remote’ encompassed Remote and Very Remote (RVR; n = 101).
The survey was validated by two experts from NSW Department of Education; five teachers were also consulted, as well as verification with students from years 7 to 10 from two secondary schools. This research was approved by the CQUniversity Australia Human Research Ethics Committee (approval number 21738). Approval was also granted by each state education department (except Western Australia), respective catholic dioceses, or independent school, relevant to each school type (Government, Catholic or Independent).
2.2. Data Analysis
A total of 2763 surveys were collected from 47 secondary schools. Twenty-two surveys were immediately discarded due to the surveys being illegible (n = 22). The remaining 2741 surveys were then examined and excluded if they (i) did not include their grade (n = 8); (ii) left all questions blank (n = 73); or (iii) responded with all possible answers (including ‘I don’t know’) to three or more ‘select all that apply’ question (n = 13). This threshold was chosen based on students having responded with all possible answers to 50% of more of the six ‘select all that apply questions’. Additionally, students must have attempted four or more knowledge questions for the survey to be retained. For this final criterion, an ‘attempt’ was defined as any response other than ‘I don’t know’ and the threshold was selected based on students attempting more than 25% of the survey. Forty-four surveys were discarded at this step. For the remaining 2603 surveys, student responses were coded for analysis using Microsoft Excel (Cosby et al., 2022a). For each question, the proportion of fully and partially corrected answers is calculated (as %) to estimate which questions had the most correct answers from students.
An agricultural knowledge score was calculated per student out of a total of 13. For questions with multiple choice items, correct response options were weighted based on the total number of selections required for a fully correct answer. For example, for a question with four correct responses, students were given a score of 0 for no correct response, 0.25 for one correct response, 0.5 for two correct responses, and so forth. For each category of questions (LK, CK, and GK), a knowledge score, as a proportion of the maximum score obtained per section for each student, was estimated (being 1 if all the responses were correct and 0 if all the responses were incorrect). The proportion of scores obtained for each group relative to the maximum achievable score and across locations (MC, IR, OR, and RVR) did not have a normal distribution (p < 0.01), except for the knowledge score of the RVR location and the GK (p = 0.342).
2.2.1. Knowledge Group Scores
To compare agricultural knowledge between the LK, CK, and GK groups, a Friedman’s two-way analysis of variance by ranks test and pairwise comparisons with Bonferroni corrections (Field, 2018) with a significance level of α = 0.05 was undertaken. The following hypothesis was tested:
H0.
The medians and the distribution of knowledge score (i) are the same.
Here, i represents the LK, CK, and GK groups.
2.2.2. Knowledge Group Score by School Location
To compare the influence of the location of the school on secondary students’ knowledge levels by LK, CK and GK groups, the following hypotheses were tested by Independent-Samples Median Test and Independent-Samples Kruskal–Wallis (Corder & Foreman, 2014; Field, 2018) with a significance level of α = 0.05:
H0.
The medians of knowledge score (i) are the same across school location (j).
H0.
The distribution of knowledge score (i) is the same across school location (j).
Here, i represents the LK, CK, and GK groups, and j represents the following four categories MC, IR, OR, and RVR. To compare the effect within each knowledge group, a stepwise step-down procedure was applied following the Kruskal–Wallis test (Field, 2018).
2.2.3. Knowledge Group Score by Level of Farming Exposure
The effect of farming exposure on knowledge score levels is analysed. Students’ exposure to agricultural environments is obtained from the response of the frequency with which students self-reported they visited a farm in the survey. The following hypotheses were tested by Independent-Samples Median Test and Independent-Samples Kruskal–Wallis (Corder & Foreman, 2014; Field, 2018) with a significance level of α = 0.05:
H0.
The medians of knowledge score (i) are the same across categories (j) of “How often do you visit a farm?”.
H0.
The distribution of knowledge score (i) is the same across categories (j) of “How often do you visit a farm?”.
Here, i represents the LK, CK, and GK groups, and j represents the following five categories: I live on a farm; At least once per school term; At least once per year; I have been to a farm at least one time before; I have never been to a farm.
To analyse whether there is a trend in the level of knowledge achieved with higher farming exposure for each knowledge group (LK; CK; GK), the Jonckheere–Terpstra test (Field, 2018) was carried out.
The data from this research were coded and summarised using Microsoft® Excel® (version 2311), and statistical analyses were executed using IBM SPSS statistics (version 28.0.0.0 (190)).
3. Results
A total of 2603 surveys conducted by students in years 7 to 10 from 47 Australian secondary schools were analysed. Briefly, 45.0% were female, 53.5% were male, and 4.6% preferred not to say or did not respond. The students were in different school years, with 28.2% from Year 7, 24.2% from Year 8, 25.9% from Year 9, and 21.7% from Year 10. More demographic results can be found in Cosby et al. (2022a).
3.1. Knowledge Group Score Results
Significant differences were observed between the LK, CK, and GK scores (p < 0.001). Knowledge in CK and GK were comparable, and both were significantly higher than those in LK. The lower knowledge about livestock is also verified by the upper limit of the confidence interval (0.651), which is below the minimum of the confidence intervals of the score for CK and GK (0.656 and 0.664, respectively) (Table 1).

Table 1.
Comparison of knowledge score of livestock, crop, and general group of questions.
The values in Table 2, Table 3 and Table 4 reflect the proportion of correct responses per question as a percentage (LK, CK, and GK, respectively), considering both fully correct and partially correct answers. For the LK group, the question that obtained the lowest accuracy (40.05%, Table 2) in the responses was about the methods that farmers use to collect milk from cows on commercial dairy farms in Australia. The question that received the highest score was the one related to how beef animals spend their life (69.65%. Table 2). Under half of the secondary students (47.0%) identified both correct response options (Some cattle spend all their life eating grass and Some cattle spend most of their life eating grass and 90 days in a feedlot eating grain); another 45.3% selected one correct response, and 7.7% did not select a correct response.
Table 2.
Level of accurate responses as a proportion of fully and partially correct responses per question in Livestock Knowledge questions.
Table 3.
Level of accurate responses as a proportion of fully and partially correct responses per question in Crop Knowledge questions.
Table 4.
Level of accurate responses as a proportion of fully and partially correct responses per question in General Knowledge questions.
The crop questions that received the fewest correct answers from students were those related to the need for irrigation for all crops (50.29%, Table 3). In contrast, the one that was most accurately answered was the one related to why people in different parts of the world eat different foods and vegetables (81.6%, Table 3). In addition, when students were surveyed about where the cotton in their clothes comes from, a high proportion of secondary students recognised that cotton comes from plants (72.7%). Just under a quarter of students believed that cotton either came from animals (8.6%) or plants and animals (13.1%). Very few students stated that they thought cotton was man-made (2.2%).
In the General Knowledge questions, identifying possible jobs in agriculture was the question with the lowest proportion of correct and partially correct answers (Table 4). The results of this study indicate that only 48.44% of the students were able to correctly identify possible jobs in agriculture. The details of the proportions of the answers given by the students are in Cosby et al. (2022a) and show a greater selection of traditional jobs. Otherwise, the GK question with the most correct answers (86.34%, Table 4) was about farm products and their end use. Overall, most students correctly matched all products to their end use, particularly for wheat (94.1%), milk (93.9%), and beef (93.9%). Most students were also able to recognise the farm products used in t-shirts (75.0%) and beanies (74.9%).
3.2. Knowledge Score Across Location
In this study, following the Australian Statistical Geography Standard Remoteness Structure (ABS, 2021), we considered the following areas: Major City (MC); Inner Regional (IR); Outer Regional (OR); and Remote and Very Remote (RVR). The medians and distributions of the knowledge scores were compared to analyse the effect of school location on the knowledge of the surveyed secondary students. For all groups (LK, CK and GK), significant differences were found in the medians and distributions of knowledge scores across locations (p < 0.001). Therefore, the results suggest that there is a location effect within the groups. The IR schools presented higher knowledge scores than the schools in other locations for both the LK, CK, and GL groups (Figure 1). The results indicated that the dispersion of the knowledge scores is lower for GK in RVR and LK in OR (interquartile ranges of 0.25, respectively). Otherwise, the highest dispersion in the scores was found for LK in RVR and CK in IR (interquartile ranges of 0.50 and 0.44 respectively). However, it can be observed that the GK generally obtained a lower dispersion of scores across all locations with respect to those of LK and CK (Figure 1).
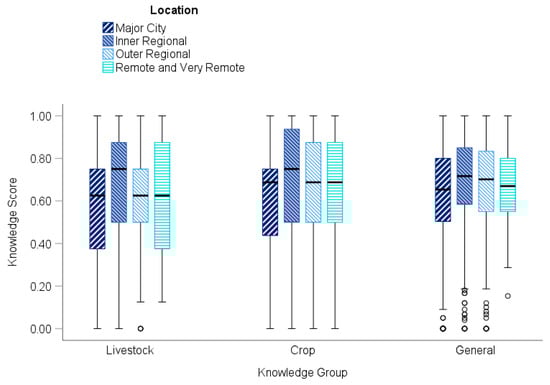
Figure 1.
Knowledge score by secondary students in livestock, crops, and general knowledge questions and school locations in Australia.
Homogeneous subset or cluster equivalent for medians of the knowledge score are shown in Table 5 within groups. Students from schools in the IR location reached a higher knowledge score in LK than students from other localities, who reached values that did not differ from each other (Table 5; p = 0.348). Similar results were found between regions for the knowledge score in CK. Nevertheless, the knowledge score in GK presented different subsets between locations. Students from schools in MC or RVR showed similar, but lower, levels of knowledge (Table 5; p = 0.455) than those from other locations. Furthermore, RVR students also had similar knowledge scores to students from OR and IR (p = 0.236).
Table 5.
Subsets of localities with homogeneous scores for livestock, crops and general knowledge groups.
3.3. Knowledge Score by Level of Farming Exposure
The knowledge score is analysed in relation to the frequency with which the student reported visiting a farm. Because 150 students did not respond regarding how often they visit a farm, 2453 surveys were analysed. The knowledge achieved presents differences in medians and distributions (p < 0.001) according to the students’ exposure to farming for LK, CK, and GK, respectively. Figure 2 shows the trend of increasing scores obtained by students as they become more exposed to farms.
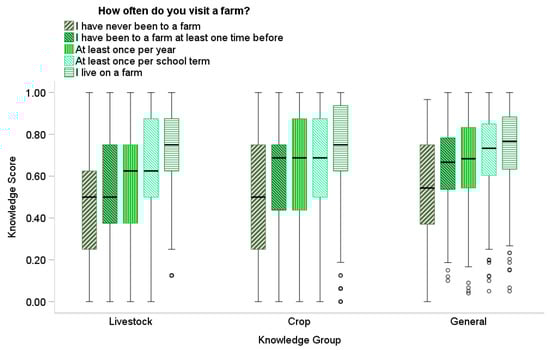
Figure 2.
Knowledge score by secondary students in livestock, crops, and general knowledge questions and how often students visit a farm.
A Jonckheere–Terpstra test revealed that as the exposure to farms increased, the level of knowledge achieved by secondary students in Australia also increased (Table 6) for all three groups (LK, CK and GK; p < 0.001). The effect sizes (Z/√n) were compared across groups of knowledge to assess the relative strength of the observed trends. LK exhibited the highest effect size (0.3120), followed by CK (0.2608) and GK (0.2483), suggesting that the trend is strongest in LK. Therefore, although students generally obtained a lower knowledge score for livestock (Table 1), as students have higher exposure to a farm, they increase their relative knowledge of livestock more, followed by crops, with respect to general knowledge (Table 6). These results demonstrate differences in the farm exposure effect on the level of knowledge achieved within groups.
Table 6.
Results of the trend analysis between levels of knowledge by industry and farm exposure.
4. Discussion
This study contributes to research about Australian secondary students’ knowledge of agriculture and associated career pathways. To improve the attraction of future agricultural workers, there is a clear need to develop students’ knowledge and positive experiences with the industry. As the industry continues to change, and agricultural work becomes more professionalised (Bassett et al., 2022; Wu et al., 2019), adequate representation of this agricultural revolution is becoming increasingly essential in learning environments to encourage students to pursue these new and emerging professional roles (J. K. Manning et al., 2024b). In social cognitive career theory, a person’s self-efficacy for job tasks and perception of the work conditions or the outcomes that can be achieved in a particular job are theorised to impact their interest and cognitive evaluations regarding whether this job presents a viable career choice (Lent et al., 1994). To begin to influence these predictors of career choice requires students to develop a thorough awareness of industries and an understanding of the work that happens within them (Cosby et al., 2024). It has been argued that this exploration of careers is strengthened when it involves (a) observation, (b) persuasion, (c) experience, and (d) affect (McIlveen & McDonald, 2019). The results from this case study demonstrate that only 2.3% of students (n = 59) selected all correct response options related to jobs in agriculture. Analysing the response options individually distinguishes that, while students are more able to identify traditional roles in the industry, they struggle to understand the link to career paths not typically associated with the sector. This aligns with Matthews and Falvey (1999), where 90% of Year 10 students could correctly identify being a farmer and scientist as applicable careers, compared to only 20% that identified consultant or business advisor. Building on the findings of Manning et al. (J. K. Manning et al., 2024b), this research highlights the persistent gap in students’ understanding of agriculture. This is particularly evident in non-traditional contexts, such as emerging technologies and modern career paths. From a study conducted by PIEFA (2020), scientists, machinery operators, and labourers were the top three identified careers associated with food and fibre production (from a list of 28) but were still only considered relevant to agriculture by 59–64% of students. Noting the need for the increased attraction of industry personnel, improved awareness of the range of possible careers within the industry is essential. This knowledge could be introduced to students through industry–school partnerships to ensure agriculture education programs both enrich learning and make schooling more relevant to industry opportunities (O’Dea et al., 2022). The importance of direct engagement with the agricultural industry has also been reported in the Building the Agricultural Workforce of the Future (DAWE, 2021), providing further evidence of the need for career education resources that interact with the industry in Australia.
This case study compares the level of knowledge of secondary school students within groups of questions (LK, CK, and GK) about agricultural literacy considering the location of the school and farm exposure. Across different school locations, students consistently show lower levels of knowledge about livestock, indicating a general trend (Table 1). Australia is geographically dispersed, with diverse production environments and population concentration. Therefore, opportunities for interaction with agriculture frequently vary and have a potential impact on knowledge. In this research, low exposure to agricultural environments results in lower levels of knowledge and reinforces what English et al. (English et al., 2019) mentioned, that experiential learning opportunities are especially crucial for students without direct agricultural experience. Furthermore, this highlights the importance of exposure and experience in agriculture in potential employment selection in agricultural production (Kamuzora, 2025). However, as Guenther and Relf (2025) clearly state in a bibliographic review about student experience in rural and regional education, rurality depends on the context and the lens from which it is analysed (e.g., students, teachers, industry, insiders, outsiders, workforce). The results of this study differ from those found by Bonnell et al. (2018), who reported that urban and rural students did not differ in their knowledge of the food system in the state of Minnesota, US. Although an effect of school location was found in this case study, with higher scores on IR, the results of this study demonstrate no evident trend in the scores of each knowledge group variation based on school location. However, as students reported greater exposure to farms, their knowledge levels increased for all groups. According to the results, this is most noticeable in their knowledge of livestock production. This is particularly crucial, since Cosby et al. (2022a) point out that students may not understand large-scale livestock production systems. This phenomenon may be attributed to the inherent complexity of livestock systems compared to crop systems, where interactions shape decision-making, for example, interactions between the animal, nutrition and health, soil and forage resources, infrastructure capital, labour, the marketing system, and climate variability, among others. This could demonstrate that the surveyed students’ individual ties to the agriculture sector have a higher influence than the location of their school. Therefore, the role of the schools would be fundamental for greater contributions to standardise learning and thus employment and post-secondary education opportunities for all students, regardless of their exposure to farms. This aligns with Romberger et al. (2025), who demonstrate that students being involved in career and education program develop abilities that make possible higher career decision self-efficacy. This case study contributes to the current conversations surrounding the National Schools Food and Fibre Education Strategy (RIRDC, 2025) in Australia, by emphasising the influence of the geographic location of the schools and the farming exposure of the students on agricultural knowledge and highlighted the knowledge gaps that exist between different regions.
5. Limitations and Further Research
The limitation of this research is that it cannot be extrapolated to all secondary school students from different regions in Australia or those exposed to the agricultural environment. This is because data were collected through surveys for exploratory analysis, and the sample size was not estimated according to the population. Another limitation is that the survey required a small number of questions to increase the probability of student completion by 100%. The total number of questions is 16, and the relative knowledge across industries is compared with only a few questions. Although the objective was not to establish the knowledge acquired by industry per se, but rather to compare relative performance, the low number of questions could increase the likelihood of bias. For instance, the low scores obtained for livestock question could be highly influenced by the questions asked to the students. Additionally, schools self-elected to participate, and this could also lead to a bias in the studied sample with those with at least an interest in agricultural education more likely to choose to have students complete the survey.
Future research should be conducted to determine whether the level of agricultural knowledge of Australian secondary students is appropriate for their year level. Preferably, this could be conducted through the development of Australia’s own learning outcome framework, upon which purpose-built instruments to assess Australian student knowledge could be built. Given the time this would take to develop, research could be conducted in the meantime using the NALOs (Judd-Murray et al., 2024) and accompanying instruments, modified to ensure suitability in the Australian context. These results reinforce the need for standardised knowledge assessments at a national level (Judd-Murray et al., 2024).This could then be used to identify areas of agriculture education improvement, including formal curriculum amendments and professional development support. Resource development is also recommended and should be as industry relevant as possible (O’Dea et al., 2022) to ensure both broad benefits to the industry and the attraction of future workers. Finally, given the finding that students struggle to understand possible career paths not typically associated with the sector, future research in the form of focus groups or interviews should be conducted with students to determine the reasons why they think this and how they could be supported to learn.
6. Conclusions
This article presents a case study of the level of knowledge of agricultural industries by secondary school students in Australia related to on-farm exposure. The results suggest that Australian secondary school students have a lower level of knowledge about livestock than crops or general agricultural topics. However, the results of this case study demonstrate the impact of the location of secondary school students. Although the overall knowledge was lower in livestock, this relative knowledge increased at a greater rate than the increase in knowledge about crops and general topics when students had higher exposure to farms. These results highlight the importance of providing secondary school students with access to experiential learning, especially in complex production systems such as livestock farming.
Supplementary Materials
The following supporting information can be downloaded at https://www.mdpi.com/article/10.3390/educsci15121698/s1 (Data Collection Survey).
Author Contributions
Conceptualisation, J.K.M., P.M., E.S.F., and A.C.; Methodology, J.K.M., P.M., E.S.F., and A.C.; Formal analysis, P.M. and E.S.F.; Investigation, J.K.M.; Writing—original draft, J.K.M., P.M., E.S.F., and A.C.; Writing—review and editing, P.M. and A.C. All authors have read and agreed to the published version of the manuscript.
Funding
This research received no external funding.
Institutional Review Board Statement
This research was approved by the Human Research Ethics Committee of CQUniversity Australia (approval number 21738), 2020-10-07, and followed the consent to participate procedures.
Informed Consent Statement
Informed consent was obtained from all subjects involved in the study.
Data Availability Statement
All data used in the current study are confidential. This research was approved by CQUniversity Australia Human Research Ethics Committee (approval number 21738).
Conflicts of Interest
The authors declare no conflicts of interest.
References
- ABARES. (2023). Snapshot of Australia’s agricultural workforce 3. ABARES. Available online: https://daff.ent.sirsidynix.net.au/client/en_AU/search/asset/1035161/0 (accessed on 10 August 2025).
- ABS. (2021). Remoteness areas. Australian Statistical Geography Standard (ASGS) edition 3. ABS Maps Australian Bureau of Statistics. Available online: https://www.abs.gov.au/statistics/standards/australian-statistical-geography-standard-asgs-edition-3/jul2021-jun2026/remoteness-structure/remoteness-areas (accessed on 22 July 2025).
- ACARA. (2025a). The Australian curriculum. Available online: https://www.australiancurriculum.edu.au/ (accessed on 21 August 2025).
- ACARA. (2025b). Learning areas. Available online: https://www.australiancurriculum.edu.au/help/learning-areas (accessed on 18 August 2025).
- Adams, N. N. (2022). Salami slicing: Clarifying common misconceptions for social science early-career researchers. SN Social Sciences, 2(7), 88. [Google Scholar] [CrossRef]
- Ainley, J., Kos, J., & Nicholas, M. (2008). Participation in science, mathematics and technology in Australian education. Available online: https://research.acer.edu.au/acer_monographs/4 (accessed on 23 July 2025).
- Australia Bureau of Statistics. (2025). 2112.0-census of the commonwealth of Australia, 1911. Available online: https://www.abs.gov.au/AUSSTATS/abs@.nsf/DetailsPage/2112.01911?OpenDocument (accessed on 18 August 2025).
- Bassett, K., Newsome, L., Sheridan, A., & Azeem, M. M. (2022). Characterizing the changing profile of employment in Australian agriculture. Journal of Rural Studies, 89, 316–327. [Google Scholar] [CrossRef]
- Bonnell, K. J., Hargiss, C. L. M., & Norland, J. E. (2018). Understanding how large metropolitan/inner city, urban cluster, and rural students perceive food systems. Urban Agriculture & Regional Food Systems, 3(1), 170001. [Google Scholar] [CrossRef]
- Corder, G. W., & Foreman, D. I. (2014). Comparing more than two unrelated samples: The Kruskal–Wallis H-test. John Wiley & Sons, Incorporated. [Google Scholar]
- Cosby, A., Manning, J., Lovrick, K., & Fogarty, E. (2022a). The future agricultural workforce-is the next generation aware of the abundance of opportunities. Farm Policy Journal, 19, 18–30. [Google Scholar]
- Cosby, A., Manning, J., Power, D., & Harreveld, B. (2022b). New decade, same concerns: A systematic review of agricultural literacy of school students. Education Sciences, 12(4), 235. [Google Scholar] [CrossRef]
- Cosby, A., McDonald, N., Kelly, N., Sullivan, M., Stoyles, L., Day, A., O’Dea, M., Strong, K., Menchon, P., & Manning, J. (2024). Cultivating futures: Engaging secondary school students in the world of agricultural careers. AgriFutures. [Google Scholar]
- DAWE. (2021, December). Building the agricultural workforce of the future. W. a. t. E. C. Department of Agriculture. CC BY 4.0. Available online: https://www.agriculture.gov.au/sites/default/files/documents/aus-govt-response-building-ag-workforce-dec-2021.pdf (accessed on 8 August 2025).
- English, C. W., Simpson, C., & Alston, A. J. (2019). The perceived impact of life experiences and selected growth areas upon the employability preparation of land-grant college graduates. Journal of Southern Agricultural Education Research, 69(1), 125–137. [Google Scholar]
- FAO. (2009). Global agriculture towards 2050. Available online: http://www.fao.org/fileadmin/templates/wsfs/docs/Issues_papers/HLEF2050_Global_Agriculture.pdf (accessed on 18 August 2025).
- Field, A. P. (2018). Discovering statistics using IBM SPSS statistics (5th ed.). SAGE. [Google Scholar]
- Graham, S. (2021). Untapped potential: The neglected urban interest in secondary agriculture. International Journal of Innovation in Science and Mathematics Education, 29(4), 11–21. [Google Scholar] [CrossRef]
- Guenther, J., & Relf, B. (2025). Improving rural and regional student experiences. Australian and International Journal of Rural Education, 35(2), i–ix. [Google Scholar] [CrossRef]
- Judd-Murray, R., Warnick, B. K., Coster, D. C., & Longhurst, M. L. (2024). Development and validation of a high school agricultural literacy assessment. Advancements in Agricultural Development, 5(3), 91–104. [Google Scholar] [CrossRef]
- Kamuzora, A. N. (2025). Exploring youth perceptions in choosing employment in the agricultural production sector in Morogoro Municipality, Tanzania. Discover Agriculture, 3(1), 47. [Google Scholar] [CrossRef]
- Kennedy, J., Quinn, F., & Lyons, T. (2017). Australian enrolment trends in technology and engineering: Putting the T and E back into school STEM. International Journal of Technology and Design Education, 28(2), 553–571. [Google Scholar] [CrossRef]
- Lent, R. W., Brown, S. D., & Hackett, G. (1994). Toward a unifying social cognitive theory of career and academic interest, choice, and performance. Journal of Vocational Behavior, 45(1), 79–122. [Google Scholar] [CrossRef]
- Lockie, S., Fairley-Grenot, K., Ankeny, R., Botterill, L., Howlett, B., Mcbratney, A., Probyn, E., Sorrell, T., Sukkarieh, S., & Woodhead, I. (2020). The future of agricultural technologies. Australian Council of Learned Academies (ACOLA). [Google Scholar]
- Manning, J., Cosby, A., Power, D., Fogarty, E., & Harreveld, B. (2022). A systematic review of the emergence and utilisation of agricultural technologies into the classroom. Agriculture, 12(6), 818. [Google Scholar] [CrossRef]
- Manning, J. K., Cosby, A., McDonald, N., & Fogarty, E. (2024a). Primary and secondary school students’ knowledge and perceptions of agriculture. Journal of Agricultural Education, 65, 226–240. [Google Scholar] [CrossRef]
- Manning, J. K., Sullivan, M., Harreveld, B., & Cosby, A. (2024b). A dynamic capabilities framework for agriculture education partnerships. The Journal of Agricultural Education and Extension, 31, 627–647. [Google Scholar] [CrossRef]
- Matthews, B., & Falvey, L. (1999). Year 10 students’ perceptions of agricultural careers: Victoria (Australia). Journal of International Agricultural and Extension Information, 6, 55–67. [Google Scholar] [CrossRef]
- McDonald, N., Cosby, A., Luke, J., & Manning, J. K. (2025). Enhancing agricultural career advice in schools: New South Wales secondary educators’ perceptions. Australian Journal of Career Development, 34(2), 174–183. [Google Scholar] [CrossRef]
- McIlveen, P., & McDonald, N. (2019). The vocational psychology of agriculture: Fiat panis. In J. A. Athanasou, & H. N. Perera (Eds.), International handbook of career guidance (pp. 459–474). Springer International Publishing. [Google Scholar] [CrossRef]
- NESA. (2025a). 7–8 technology 7–8 syllabus (2023). Available online: https://curriculum.nsw.edu.au/learning-areas/tas/technology-7-8-2023/overview/course (accessed on 21 August 2025).
- NESA. (2025b). NSW and the Australian curriculum. Available online: https://educationstandards.nsw.edu.au/wps/portal/nesa/k-10/understanding-the-curriculum/curriculum-syllabuses-NSW/nsw-and-the-australian-curriculum (accessed on 21 August 2025).
- O’Dea, M., Cosby, A., Manning, J., McDonald, N., & Harreveld, B. (2022). Industry perspectives of industry school partnerships: What can agriculture learn? Australian and International Journal of Rural Education, 32(3), 1–21. [Google Scholar] [CrossRef]
- O’Dea, M., Cosby, A., Manning, J., McDonald, N., & Harreveld, B. (2023). Who, how and why? The nature of industry participants in agricultural industry school partnerships in Gippsland, Australia. The Journal of Agricultural Education and Extension, 30(4), 571–590. [Google Scholar] [CrossRef]
- Oyugi, M. A., Lamm, A. J., Boren-Alpizar, A., Lawver, D., Ritz, R., & Siwatu, K. O. (2025). Personal and contextual attributes predicting agriscience teachers’ self-efficacy in texas high schools. Journal of Agricultural Education, 66(3), 21. [Google Scholar] [CrossRef]
- Peltzer, C. (2020). Attracting Youth into agriculture. Developing a strategic framework to encourage young people to pursue a career in agriculture. A model for Tasmania. Available online: https://www.mla.com.au/contentassets/a73e801dea5748bfbdf2d22c53b7fd3d/2019_au_clare-peltzer_attracting-youth-into-agriculture-developing-a-strategic-framework-to-encourage-young-people-into-agriculture.pdf (accessed on 12 August 2025).
- Penn, A., Poole, R., & Simson, F. (2018). Talking 2030: Growing agriculture into a $100 billion industry. Available online: https://nff.org.au/wp-content/uploads/2020/02/Talking-2030.pdf (accessed on 8 August 2025).
- PIEFA. (2020). Food, fibre and our future 2020: PIEFA student survey summary report on student knowledge, understanding and sentiment about primary industries. PIEFA. [Google Scholar]
- Pratley, J., & Botwright Acuña, T. (2015, September 21–24). From adversity comes strength–repositioning education in agriculture. 17th Australian Agronomy Conference, Warragul, VIC, Australia. Available online: https://researchoutput.csu.edu.au/ws/portalfiles/portal/28542985/9749223_Conference_paper.pdf (accessed on 30 July 2025).
- RIRDC. (2025). National schools food and fibre education strategy. Available online: https://agrifutures.com.au/wp-content/uploads/2025/11/AGF962-Food-Fibre-Report-A4-S3V3-DIGITAL.pdf (accessed on 8 August 2025).
- Romberger, D., Foster, D., Ewing, J., & Rice, L. (2025). Influence of secondary agricultural education student supervised agricultural experience participation on career decision self-efficacy. Journal of Agricultural Education, 66(3), 22. [Google Scholar] [CrossRef]
- Spielmaker, D. M., & Leising, J. G. (2013). National agricultural literacy outcomes. Utah State University, School of Applied Sciences & Technology. Available online: https://agliteracy.org/resources/outcomes/ (accessed on 21 August 2025).
- Stephenson, L. G., Warnick, B. K., & Tarpley, R. S. (2008). Collaboration between science and agriculture teachers. Journal of Agricultural Education, 49, 106–119. [Google Scholar] [CrossRef]
- The World Bank. (2025). Agriculture and food-overview. Available online: https://www.worldbank.org/en/topic/agriculture/overview#1 (accessed on 21 August 2025).
- Whannell, R., & Tobias, S. (2015). Educating Australian high school students in relation to the digital future of agriculture. Journal of Economic and Social Policy, 17, 4. [Google Scholar]
- Wu, W., Dawson, D., Fleming-Muñoz, D., Schleiger, E., & Horton, J. (2019). The future of Australia’s agricultural workforce r. CSIRO Data61. [Google Scholar] [CrossRef]
Disclaimer/Publisher’s Note: The statements, opinions and data contained in all publications are solely those of the individual author(s) and contributor(s) and not of MDPI and/or the editor(s). MDPI and/or the editor(s) disclaim responsibility for any injury to people or property resulting from any ideas, methods, instructions or products referred to in the content. |
© 2025 by the authors. Licensee MDPI, Basel, Switzerland. This article is an open access article distributed under the terms and conditions of the Creative Commons Attribution (CC BY) license (https://creativecommons.org/licenses/by/4.0/).