Abstract
Students with mathematics learning disabilities often have difficulties in adding whole numbers. Such difficulties are evident in both response time and accuracy, but the relationship between accuracy and response time requires further consideration, especially in the context of technology-based interventions and assessments. In this article, we apply a novel approach using the drift-diffusion model to examine potential trade-offs and find balanced performance points that account for both accuracy and response time, using data from an efficacy trial of a mathematics technology gaming intervention for first-grade students with or at risk for learning disabilities. Results indicate that accuracy tends to increase as response time decreases, but only to a certain point. Practical implications include that educators should consider both accuracy and response time to intensify and individualize their instruction and take student background (i.e., gender, special education status, and English language status) into account. We suggest that developing technology-based mathematics interventions and assessments requires careful design and configuration to balance accuracy and response time, thereby enabling adaptive performance thresholds for better understanding and supporting student learning in early mathematical fluency.
1. Introduction
Success in mathematics is influenced by a reciprocal relationship between conceptual understanding and procedural fluency. As students deepen their conceptual understanding, they become more fluent in applying procedures (National Mathematics Advisory Panel [NMAP], 2008; Rittle-Johnson et al., 2015; Schneider et al., 2011). Developing both conceptual and procedural fluency is critical in early mathematics, such as whole-number concepts and skills. It allows students to focus on more complex or advanced-level tasks and requires less cognitive load for solving mathematics problems in later grades (Allen et al., 2021; Medrano & Miller-Cotto, 2025; Raghubar et al., 2010).
Academically low-achieving students, especially those with or at risk for mathematics learning disabilities (MLD), have experienced learning difficulties in developing conceptual and procedural fluency across the school years (e.g., Woodward, 2006; U.S. Department of Education, 2024). For example, 16% of fourth-grade students with disabilities scored at or above proficient, while 44% of their peers without disabilities scored at or above proficient in the recent National Assessment for Educational Progress (U.S. Department of Education, 2025). Without effective instructions or interventions, students with MLD will most likely fail to develop early mathematical fluency with whole-number concepts and skills and may rely on inefficient problem-solving strategies (e.g., counting fingers) rather than direct retrieval, resulting in longer response times even if the responses are accurate (Fuchs et al., 2008; Geary, 1993; Geary et al., 2007; Jordan & Hanich, 2000).
One way to capture such patterns of using inefficient strategies is to examine speed–accuracy trade-offs, leading researchers and educators to gain insight into the latent cognitive processes underlying student performance (Vandierendonck, 2021). The notion of the accuracy–speed trade-off is that when performing a task requiring accuracy and speed, there is an inverse relationship between the two. That is, as speed increases, accuracy tends to decrease, and vice versa. Similarly, Fitts’ (1954) law states that movement time (i.e., speed) to a target is dependent on distance and size (i.e., task difficulty). It provides a mathematical model to predict speed based on task difficulty, highlighting how these factors influence the “trade-off”, and how its principle has been used in user interface and user experience design (e.g., MacKenzie & Mackenzie, 1992). However, some research suggests that decreased speed (i.e., increased time spent solving a problem) is not necessarily related to an increase in accuracy, and in some cases, spending too much time on a problem may be associated with decreased accuracy (Domingue et al., 2022). To date, limited research has been conducted to explore speed–accuracy trade-offs of early math assessments in the context of technology-based interventions for different groups (e.g., gender, disability). It is not clear whether Fitts’ law is applicable to tasks that vary the difficulty of academic demands or if hypothesized speed–accuracy trade-offs are relevant to technology-based interventions specifically for students with or at risk for MLD.
1.1. Study Purpose and Research Questions
The purpose of the current study is to investigate how speed and accuracy are related to each other and relevant to building whole-number concepts and skills for early elementary school students with or at risk for MLD in the context of an evidence-based computer gaming intervention, which previous studies have not widely addressed. The specific research aim is to evaluate the optimal threshold of embedded assessment, considering both speed and accuracy to differentiate learning pathways within the game sessions for first-grade students with or at risk for MLD. Our primary research questions are the following:
- What is the relationship between accuracy, speed, and speed–accuracy trade-offs in whole-number concepts and skills of first-grade students with or at risk for MLD? What is the optimal assessment threshold (i.e., sweet spot) of the mathematics technology gaming intervention designed for first-grade students with or at risk for MLD?
- What are the overall patterns of student performance in early mathematical fluency? To what extent do student background characteristics predict different patterns of student performance?
We hypothesized that more accurate responses would require slower speed in general, based on Fitts’ law, but also that there would be a practical limit to how much slowing down would improve accuracy, and the returns on time investment would begin to diminish beyond a certain point. Thus, in this paper, we aim to examine how students with or at risk for MLD performed in an evidence-based mathematics game in terms of speed and accuracy to find a balanced performance point that will guide us in optimizing assessment thresholds of the game as a core component for individualizing and intensifying student mathematics learning.
1.2. Mathematical Fluency
National initiatives (e.g., National Mathematics Advisory Panel [NMAP], 2008) consider early mathematical fluency to be a key indicator of mathematical competency, proficiency, and academic success in school mathematics. Although discussed frequently in education research, experts vary in how they define mathematical fluency, and little is known about how or what elements interact with one another to shape early fluency development—especially for students with or at risk for MLD. In general, mathematical fluency has been defined or described as computational proficiency or the ability to quickly and accurately recall basic arithmetic facts and procedures. However, experts question whether such definitions consider the relation between conceptual understanding, procedural skills, and basic fact recall (Clarke et al., 2016) or consider the nature of five intertwined strands of proficiency in mathematics (National Research Council [NRC], 2001). For example, Baroody (2011) argued that the definition of mathematical fluency should include the ability to use facts and procedures efficiently in addition to their quick, accurate recall. The National Council of Teachers of Mathematics (National Council of Teachers of Mathematics, 2014) has also argued that building mathematical fluency should involve more than speed and accuracy by focusing on efficiency (e.g., flexible use of strategies). Other researchers (e.g., McNeil et al., 2025) suggest that early mathematical fluency is an indicator of strong whole-number concepts and skills as a broad construct. However, defining or reconceptualizing the definition of mathematical fluency is beyond the scope of this article; we wish to highlight these differences in definition merely to situate the current study. In this paper, we use the term mathematical fluency to describe “how quickly and accurately a student applies specific [mathematical] skills” (Clarke et al., 2016, p. 83).
1.3. Accuracy and Timing Elements
Accuracy, in general, refers to how close a measured value is to the true or accepted value (International Organization for Standardization, 2023). In most classrooms, if not all, teachers consider accuracy the primary measure to assess students’ learning of mathematical concepts and procedural skills. Results of assessing accuracy (e.g., right or wrong answers) provide teachers with critical information to make instructional decisions. For example, when students solve problems incorrectly or when teachers notice that students score below a certain level of accuracy on a specific math concept, they can provide immediate feedback or scaffolded instruction to improve their accuracy using effective instructional approaches (e.g., explicit instruction) to build students’ conceptual understanding and procedural fluency.
In addition, accuracy often serves as a precursor to speed in solving mathematics problems. That is, students need to learn how to solve mathematics problems accurately before working to develop fluency, efficiency, or even timed automaticity (McNeil et al., 2025). Although assessing accuracy is a central part of school mathematics, assessing student learning in mathematics requires attention to more than accuracy and should attend to other features of fluency, such as timing elements (National Council of Teachers of Mathematics, 2014; National Research Council [NRC], 2001, 2005; Star, 2005). A better understanding of timing elements might help inform teacher practices and provide instructional insights into assessing early mathematical fluency. The educational rationale for investigating the relationship between accuracy and timing elements is based on the following two sets of contextual factors.
First, timing elements (e.g., latency, response time, speed) have long been a common universal feature of fluency assessment in school (e.g., through curriculum-based measures [CBM]: Foegen et al., 2007; Petscher et al., 2015). Originally, mathematics curriculum-based measures (M-CBM) focused on a student’s conceptual understanding and computation skills for the elementary school grades (Deno, 1985; Foegen et al., 2007; Lembke & Stecker, 2007). Over time, new iterations of M-CBM measures have been designed to align with specific state standards and have been intended to provide an indicator of both conceptual understanding and procedural fluency (e.g., Alonzo et al., 2006; Fuchs, 2017). However, consensus has not been reached on the duration of a timing element for fluency reporting. The timing of different M-CBM tools varies by grade level, with shorter durations (1 or 2 min) typical in the earlier grades and longer durations (up to 5 min) typical in the later grades (Clarke et al., 2016). Other researchers, such as Stocker et al. (2019), reviewing more than 20 years of literature, found that studies used a wide range of criteria to report fluency scores (e.g., from 20–40 correct responses per minute to 60–100 digits correct per minute [DCPM]). Additionally, no study in Stocker et al.’s (2019) review considered underrepresented demographic groups, such as students with disabilities. Therefore, it is important to determine the extent to which timing elements provide additional empirical information about early mathematical fluency, specifically for students with or at risk for MLD.
Second, timing elements are routinely studied and found to provide insight into students’ cognitive ability, use of automated processes, and other psychoeducational aspects of learning (e.g., Kyllonen & Zu, 2016; Sideridis & Alahmadi, 2022). We narrow our focus to response time (RT) in this paper to describe the timing element between the time point when a question or problem is introduced and the later time point when students answer the question or solve the problem. RT analysis has been a common practice in various fields, especially those related to medical monitoring or financial trading (e.g., Evans et al., 2019; Miwa, 2023; Paganelli et al., 2022; Tan et al., 2024). Although experts in the field of educational measurement have investigated RT analysis (e.g., Partchev et al., 2013; Van der Linden, 2009), there is limited empirical evidence to guide teachers’ instructional decision-making process in support of early mathematical fluency for students with or at risk for MLD.
1.4. Drift-Diffusion Model
One common RT analysis involves examining the trade-off between accuracy and speed (Heitz, 2014). Along with available approaches to estimate speed–accuracy trade-offs (e.g., the Bayesian adaptive method; Baek & Park, 2024), Ratcliff (1978) first introduced the drift-diffusion model (DDM) to explain observed patterns of choices and RTs. The DDM has been further described and often used in cognitive psychology and neuroscience (Ratcliff & McKoon, 2008; Ratcliff et al., 2016); yet it has not been widely used in the field of special education, particularly among technology-based interventions and assessments. Below, we briefly describe core parameters in DDM and associated cognitive processes to help readers understand our study and interpret the results based on the existing available guidelines (Myers et al., 2022; Voss et al., 2004, 2013, 2015).
The standard DDM, which we used in this study (see Figure 1), includes core parameters such as the response caution (i.e., boundary/threshold separation), the estimates of relative conservatism (i.e., starting point), the speed of evidence accumulation (i.e., drift rate), and the measures of time/duration of all extra-/non-decisional processes (i.e., non-decision time). First, the boundary/threshold separation parameter (a) is the distance between the upper boundary or threshold (e.g., correct answer) and the lower boundary or threshold (e.g., incorrect answer), reflecting the response caution. The terms boundary and threshold are being used interchangeably in the literature. For operational conceptualization, we use the term “boundary” to represent the upper or lower limit where the decisions are made and the term “threshold(s)” to indicate the (a) value(s). Higher (a) values (larger gap between boundaries requiring more accumulated information to make decisions) indicate more cautious and conservative responses in which accuracy is emphasized over RT, while lower (a) values (smaller gap between boundaries requiring less accumulated information) indicate more impulsive responses in which RT is emphasized over accuracy. The typical range of (a) values is between 0.5 and 2.5 (in arbitrary units).
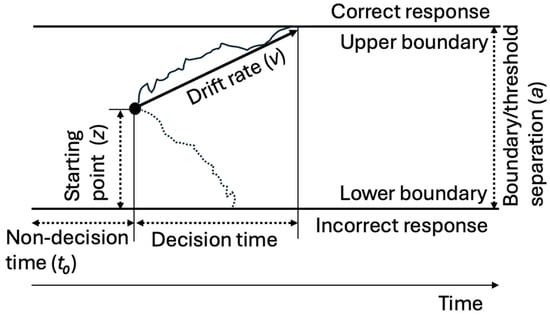
Figure 1.
Parameters of the drift-diffusion model (DDM).
Second, the starting point parameter (z) shows a response bias reflecting differences in the amount of information that is required before the alternative responses are initiated (Voss et al., 2004). Between 0 and 1, higher (z) values indicate the starting point is closer to the upper boundary (e.g., correct answer), while lower (z) values indicate the starting point is closer to the lower boundary (e.g., incorrect answer). Accordingly, a (z) value of 0.5 represents an unbiased starting point. When (a) values fall outside the typical range, (z) should be interpreted relative to (a), and the relative starting point (zr = z/a) is recommended (Voss et al., 2013).
Third, the drift rate parameter (v) is the average slope and direction of the diffusion process and can be interpreted as the speed (RT in our study) of the accumulated information. It is affected by task difficulty for within-person analyses or perceptual sensitivity for between-person analyses. The typical range is between −5 and +5, and positive values represent information accumulation favoring the upper boundary (e.g., correct answer) response over the lower boundary (e.g., incorrect answer) response and vice versa.
Finally, the non-decision time (t0) includes the stimulus encoding time (i.e., the time required for the nervous system to encode the stimulus before the decision time, which happens between the stimulus and the decision time) and the motor response time (i.e., the time to execute the selected motor response, which happens between the decision time and the response). In the standard DDM, which we used, the encoding and motor response times are typically combined into a single parameter (Myers et al., 2022). The typical range is between 0 and 1 s, and lower (t0) values indicate faster responses, while higher values indicate slower responses due to delays outside the decision time of the response process.
Although these parameters are considered “free,” allowing them to vary for each response and take on different values “freely,” adjusting each parameter affects DDM scenarios, resulting in changes in other parameters. This mechanism of adjusting parameters to simulate different decision-making scenarios, then, allows us to identify the optimal threshold of RT and/or accuracy by adjusting relevant core parameters. In the practical implications section, we discuss what it would look like to adjust each parameter in practice (see Section 4.3).
2. Materials and Methods
2.1. NumberShire Gaming Intervention
Based on research syntheses focused on early mathematics interventions and other calls for the use of well-designed educational technology to meet the learning needs of students with or at risk for MLD (e.g., Gersten et al., 2009; Mayer, 2009; Young et al., 2012), our research team has developed an educational computer video game called NumberShire. The first-grade version, NumberShire Level 1 (NS1), has 48 game sessions with a specific focus on building robust conceptual understanding and procedural skills with whole numbers for first-grade students with or at risk for MLD. Through a series of federally funded research projects, NS1 has been carefully designed and iteratively revised to integrate three strategic design components: critical early math content focused on whole-number concepts, an engaging gaming platform with narrative plots, and evidence-based, explicit instructional and technological design and delivery features (Fien et al., 2016). In NS1 game session #6, for example, the village elder explicitly teaches using the number line to add 1 to a number. As shown in Figure A1 in Appendix A, for example, the elder teaches how to add 1 by saying, “I’m going to use the number line to add 1 to a number. When adding 1 to a number, we say the next number on the number line.” Please see a sample lesson routine for session #6 in Figure A1 in Appendix A, which illustrates how the design components are tied together to teach how to add 1 to one-digit whole numbers.
2.1.1. Differentiated Learning Pathway
NS1 provides a Differentiated Learning Pathway (DLP) through which gaming activities and math tasks are individualized and intensified for each player based on their performance. The game server precisely analyzes a player’s performance, generates a performance matrix (e.g., accuracy, response time), and calibrates next game tasks matched to each player’s current skills. The NS1 data server makes within- and between-task adjustments based on each player’s performance data, which routes each player to optimal gaming activities and math tasks for building conceptual understanding and procedural skills of whole-number concepts (see Section 2.1.2, below, where we further describe how the DLP functions within NS1 sessions).
The design and DLP components were iteratively tested and integrated into the entire NS1 game structure as a technology-based tool to allow teachers to intervene early and strategically to accelerate early math learning and prevent more costly remediation of math difficulties in the later grades for students with or at risk for MLD. Our feasibility and usability data from a series of pilot studies and strong efficacy and implementation fidelity data from our randomized controlled trials suggest significant impacts of the NS1 intervention on math outcomes compared to business-as-usual math interventions (Fien et al., 2016).
2.1.2. Embedded Assessment
Based on the theory of formative assessment (e.g., Black & Wiliam, 1998), the embedded assessment framework has been studied as an alternative assessment approach (Clark & Karvonen, 2021; McCarthy et al., 2011; Wilson & Sloane, 2000). In the context of video games, embedded assessment has been used as an evidence-based approach to unobtrusively assess students’ learning progression while they are engaged with highly interactive and immersive environments (e.g., Shute et al., 2021). Integrating the embedded assessment approach in a technology-based gaming platform with evidence-based, explicit, systematic math instruction (Gersten et al., 2009; National Mathematics Advisory Panel [NMAP], 2008), NS1 offers different types of assessments embedded within each game session. As students play one game session per day, each game session consists of four mini-games, including a Warm-up (i.e., independent practice with a mastered objective), a Teaching Event (i.e., introduction of a new instructional objective, containing explicit modeling [I DO], guided practice [WE DO], and independent practice [YOU DO]), an Assessment Event (i.e., review and independent practice with a recently taught objective), and a Wrap-up (i.e., independent practice with another mastered objective).
At the end of each mini-game, student performance during independent practice activities (i.e., a set of question items) is used to determine the DLP the student will follow in that day’s game session. If student performance meets pre-established learning criteria, the student will move to the next activity in the scope and sequence, while performance that falls short of the criteria will direct a student to an activity that focuses on a prerequisite learning objective. Supported by our definition of mathematics fluency (Clarke et al., 2016) and a comprehensive research synthesis on mathematics fluency spanning 20 years (Stocker et al., 2019), we operationally defined and established NumberShire fluency criteria for each mini-game embedded assessment.
As shown in the sample DLP criteria (Figure 2), if a player reaches a performance criterion of 90% or greater during independent practice with 10 single-digit addition problems at the end of the “YOU DO” phase (i.e., independent practice), the player will receive a reward and continue on the default gameplay pathway. If the player scores below 90% accuracy, the player will replay the specific game segment with summative feedback (e.g., “you got 8 out of 10 correct”). In the next trial, if the student scores below 60% accuracy, the student will be routed to additional guided practice of reviewing adding 1 to a number with number lines as an instructional scaffold. Supported by our definition of mathematics fluency (Clarke et al., 2016) and a comprehensive research synthesis on mathematics fluency spanning 20 years (Stocker et al., 2019), we operationally defined and established NS1 fluency criteria, but response time criteria have not yet been set for determining student gameplay pathways in the current version of NS1.
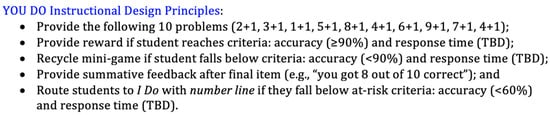
Figure 2.
Sample DLP criteria of the NS1 game session 6.
2.2. Settings and Participants
The host study (Institute of Education Sciences, 2016) from which these performance data of RT and accuracy in the NS1 embedded assessments were drawn, took place in 152 classrooms from 13 elementary schools in the Western U.S. across 3 academic years in 2016–2019 (i.e., cohorts 1–3), in the late winter to early spring of each school year. The purpose of the host study was to examine the impact of the NS1 intervention for students with or at risk for MLD in a large, diverse, urban school district with a moderately large population of English learners (ELs). A total of 1708 first-grade students (189 in cohort 1, 297 in cohort 2, and 315 in cohort 3) participated in the host study. All students received core mathematics instruction using district-adopted materials, and study-eligible students (i.e., those scoring below the 40th percentile on a Common Core State Standards for Mathematics (Common Core State Standard-Mathematics, 2010; National Governors Association Center for Best Practices & Council of Chief State School Officers, 2010) aligned mathematics screening assessment), blocking by classroom, were randomly assigned to either the NS1 treatment condition or the control group. For the duration of the study, students assigned to the control group (n = 855) received business-as-usual supplemental mathematics intervention routinely provided by each school. Students randomly assigned to the treatment group (n = 853) played NS1 as a supplemental intervention for approximately 15 min per day, four days per week, across the 12-week intervention period. Of 853 students in the treatment group, 801 students completed the focal assessments and thus were included in the current study.
As previously described in Section 2.1.2, in the version of the NS1 game used in the host study, each game session consisted of four different types of “mini-games,” concluding with an independent practice activity. Student performance—namely, accuracy—in the independent practice activity was used to differentiate gameplay pathways (i.e., funnel students to particular activities to individualize and intensify instructional support). Although the NS1 game server has the capacity to collect and report RT in milliseconds, given the lack of consensus about mathematics fluency criteria, we have not yet set the timing element (i.e., RT threshold) for (re)calibrating DLPs in the current version of the NS1 game. Current literature provides limited guidance on what timing elements should be used for establishing fluency criteria within the context of technology-based embedded assessment, especially for students with or at risk for MLD. We propose that the results of the current study will provide guidance to address these issues—to enhance NS1 and contribute to relevant generalizable knowledge.
2.3. Dataset
Integrating the embedded assessment approach (Clark & Karvonen, 2021; McCarthy et al., 2011; Wilson & Sloane, 2000) in a technology-based gaming platform with evidence-based, explicit, systematic math instruction (Gersten et al., 2009; National Mathematics Advisory Panel [NMAP], 2008), NS1 offers different types of assessments embedded within each game session. As described in Section 2.1.2, students play one game session per day, and each game session consists of four mini-games (a Warm-up, a Teaching Event, an Assessment Event, and a Wrap-up).
Out of 192 mini-games across a total of 48 NS1 game sessions (4 mini-games per game session), we initially retrieved a total of 1,344,367 assessment items (292,944 items in cohort 1 [21.8%], 474,519 items in cohort 2 [35.3%], and 576,904 items in cohort 3 [42.9%]) that were completed across students participating in the host study. We then identified 27 mini-games from 33 game sessions that address the focal fluency standard of adding whole numbers within 20 (CCSS-M.1.OA.6). All assessment items assessed the response accuracy (1 = correct, 0 = incorrect) and RT in milliseconds through its secured data server. Through our data cleaning process, we identified 2,806 items (0.2%) with RT over 120,000 milliseconds (2 min per item) as outliers for the purpose of our study, thus excluding these items in our analysis. Finally, a total of 631,521 (137,859 in cohort 1 [21.8%], 221,858 in cohort 2 [35.1%], and 271,804 in cohort 3 [43.0%]) item counts addressing CCSS-M.1.OA.6a were extracted and included in the current study. Accuracy coding in the final dataset indicates that 404,421 items were correct (64%), and the mean RT per item was 3.69 s (SD = 6.13 s). To explore speed–accuracy trade-offs for different groups of students (e.g., by gender, disability category, or English language status), descriptive statistics for demographic and performance data (accuracy and RT) for each subgroup of participants are reported in Table 1.

Table 1.
Description of the demographic, response time and accuracy data.
2.4. Data Analysis
To examine the relationships and the trade-offs between RT and accuracy across student subgroups, we conducted a series of complementary analyses. We first plotted accuracy (0 = incorrect, 1 = correct) against RT (in seconds) using jittered scatterplots faceted by subgroups (overall, female, male, without IEP, with IEP, non-EL, EL, and NA [no demographic information available]). These plots were created from item-level responses to present how individual correct and incorrect responses were distributed across RTs within each subgroup. In addition, we calculated point-biserial correlations between RT and accuracy for each subgroup within the corresponding plots. We also visualized the data using scatterplots by calculating the mean log RT and accuracy and deciles for each subgroup. RTs were log-transformed and divided into deciles prior to analysis. For each decile, we averaged accuracy and RT across all items, producing curves that present how accuracy changes as a function of RT within each subgroup. This approach reflects a test-level analysis, as the unit of analysis was the average performance within decile bins rather than individual item responses, thereby providing an overview of test-level response patterns. Finally, we applied the DDM (Ratcliff, 1978) using the rtdists package (version 0.11-5; Voss et al., 2025) implemented in R Studio (version 4.5.2) and conducted a series of subgroup analyses.
2.4.1. Simulating DDM
For simulating the DDM, we fit the diffusion model parameters—boundary separation (a), drift rate (v), non-decision time (t0), and starting point bias (z)—using maximum likelihood estimation with multi-start optimization. From these fitted values, we generated 10,000 Monte Carlo trials at each grid point with the rdiffusion function in the rtdists package (version 0.11-5; Voss et al., 2025) in R Studio (version 4.5.2). To find the optimal threshold(s), we decreased the boundary separation while holding other parameters constant. We adopted an empirically tested and validated method to determine the point(s) where a 1-unit change in boundary separation (a) produced a less than 2% change in model-predicted accuracy, reflecting the point of diminishing returns as accuracy approached asymptote (Evans et al., 2019; Evans & Quique, 2021). More specifically, the adjusted threshold(s) = minimum a such that (Accuracy[a + 1.0] − Accuracy[a])/Accuracy(a) < 0.02, when Accuracy = model-predicted accuracy from the DDM at a given boundary separation a. We evaluated the criterion over a grid of boundary separation (a) spaced by 0.1.
2.4.2. Calculating Trade-Offs
The estimated speed–accuracy trade-offs were calculated by comparing the performance at the baseline threshold with performance at the adjusted threshold. Specifically, we calculated the trade-offs by subtracting the baseline accuracy or response time from the accuracy or response time at the adjusted threshold and dividing the result by the baseline value. This approach represents the relative change as a percentage, with negative trade-off values indicating a reduction in accuracy or RT relative to baseline (Evans et al., 2019; Evans & Quique, 2021).
2.4.3. Subgroup Comparison
To examine the subgroup differences (i.e., males vs. females, ELs vs. non-ELs, students with IEPs vs. students without IEPs), we conducted an analysis of variance (ANOVA) using F tests with partial η2 as an effect size (Fritz et al., 2012) for RT performance. For accuracy, we used a binomial logistic regression model and reported regression coefficients (B), standard errors, and odds ratios (ORs) with 95% confidence intervals. Significant higher-order interactions were decomposed using simple effects analyses with estimated marginal means. These analytic approaches were used to examine the main effects of each subgroup variable. All the analyses were conducted in R Studio (version 4.5.2).
3. Results
3.1. Descriptive Statistics
We first used scatterplots to visualize the accuracy-RT relationships and then calculated the trade-offs to find the optimal balance point, which, we believe, can serve as the “sweet spot” for early fluency within the NS1 gaming intervention context. Figure 3 shows the item-level correlations between accuracy and RT by subgroups. We found a weak, positive correlation in overall performance (r = 0.099), indicating students took longer RT to solve focal fluency problems correctly and shorter RT for incorrect answers. Subgroup analyses based on demographic characteristics (gender, IEP/EL status) show the same or similar pattern of weak, positive correlation (r’s ranging from 0.084 to 0.120) in the speed–accuracy trade-off.
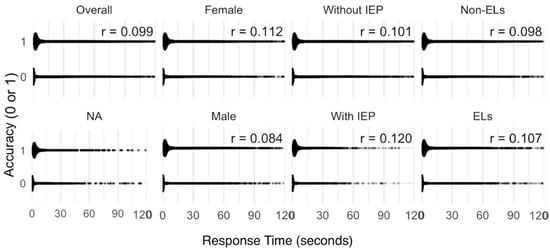
Figure 3.
Correlations between response time and accuracy: IEP = Individualized Education Program, EL = English language; NA indicates the group of 27 students who did not report demographic information related to gender, IEP, and EL status. All correlations were statistically significant (p < 0.001).
Figure 4 shows the test-level relationships between log-transformed accuracy and RT by subgroups. We found that accuracy reaches the minimum or “at-risk” threshold of 60% accuracy at 3.70 seconds (s). Once the accuracy rate reaches its highest point of 89.7% at 6.43 s, the accuracy rate decreases as the RT increases. We found similar patterns in all subgroups except the NA group. Female students (3.97 s for 60% accuracy; 21.75 s for the maximum accuracy of 89.7%) require more RT than male students (3.52 s for 60% accuracy; 21.54 s for 89.7% accuracy, although it reaches beyond 90%). Students without IEPs (3.70 s for 60% accuracy; 17.98 s for 89.7% accuracy) require more RT than students with IEPs (3.39 s for 60% accuracy; 11.82 s for 89.7% accuracy, although it reaches beyond 90%). ELs (4.18 s for 60% accuracy; 24.03 s for 89.7% accuracy) require more RT than non-ELs (3.56 s for 60% accuracy; 14.72 s for 89.7% accuracy, although it reaches beyond 90%). The RTs and accuracy rates by subgroups and deciles are reported in Table 2.
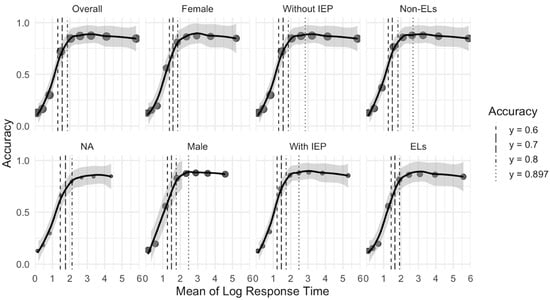
Figure 4.
Mean of log response time and accuracy curve: IEP = Individualized Education Program, EL = English language, NA = 27 students who did not report child-level factors; 89.7% was the highest accuracy rate for overall, females, students without IEP, ELs, and NA; Highest accuracy rate was 90.2% for male students, 90.4% for students with IEP, and 90.1% for Non-Els; Each point along the x-axis is the average log (response time) for one decile bin, within a facet. For example, the first bin (leftmost in the plot) indicates the fastest 10% of responses for that facet, and the last bin (rightmost) indicates the slowest 10% of responses for that facet. By using deciles per facet, response time within each group is normalized. The Y-axis (accuracy) trends indicate how accuracy changes from the fastest to slowest responders within each group.
Table 2.
Observed accuracy and response time by deciles (upper column = RA, lower column = RT).
3.2. Model Fit
Prior to the DDM simulation, it was necessary to establish if the model adequately fit our dataset. Per the recommendations of Voss et al. (2015), model fit was assessed through a graphical inspection. We compared model-predicted RT and accuracy deciles with observed accuracy and RT deciles. As shown in Figure 5, the overall model fit predicted the RT distribution well except for the slowest RT deciles (bin 10). Other than the observed accuracy below 50% (bins 1–3), the model also fit fairly well when observed accuracy is more than 50%, which is shown in some empirical studies (e.g., Myers et al., 2022). We considered these data to be a reasonable basis for DDM simulation.
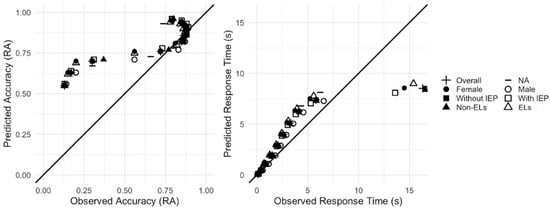
Figure 5.
Visual inspection of observed and predicted RA and RT distribution: IEP = Individualized Education Program, EL = English language, RA = response accuracy.
Because the thresholds and trade-offs are novel measures based on simulation, it is important to establish internal consistency, which we examined using a split-half reliability procedure adapted from Evans et al. (2019). The correlation between halves was Pearson’s r = 0.77, which reflects good linear agreement in the absolute magnitudes of values, and Spearman’s ρ = 0.96, which reflects the excellent rank-order stability, with participants maintaining nearly identical relative ordering across halves. Taken together, these results suggest that the model accounted well for predicted and observed models with good internal consistency.
3.3. Parameter Estimations
Table 3 shows the mean parameter values. The (a) value for the overall performance was 3.50. Although these are in arbitrary units, the (a) values in this analysis are beyond the typical range of 0.5–2.5 (e.g., Myers et al., 2022; Voss et al., 2015), suggesting that participating students tend to respond with high cautiousness or conservation. Due to the high values of boundary separations, we used (zr), representing a bias measure of relative starting point, as suggested by Voss et al. (2013). The (zr) value for the overall performance was 0.20, indicating the biased starting point toward the lower boundary. This suggests that participating students require more information to reach the upper boundary (e.g., correct answer) than to reach the lower boundary (e.g., incorrect answer). The drift rate (v) was 0.41 for overall performance, indicating that the direction of participating students’ performance is toward the upper boundary of correct answers (the slope is positive), although slow (the slope is less than 1). The (t0) value was less than 0.00, indicating that the combined non-decisional time of the encoding and motor response (e.g., clicking) time was less than 0.00 s.
Table 3.
Maximum likelihood estimates of drift-diffusion model parameters.
Subgroup results across gender, IEP, and EL status show meaningful differences in response pattern dynamics. Females exhibited cautious responses (a = 3.34) with a positive drift rate (v = 0.40) and a low starting point (zr = 0.25), suggesting slower but accurate response processes, although biased toward incorrect answers. Males were more cautious (a = 3.74) than females, had a steeper drift rate (v = 0.42) and a lower starting point (zr = 0.22), indicating faster information accumulation but more biased toward incorrect answers. Students with IEPs showed more impulsive response behavior (a = 3.35) and a steeper drift rate (v = 0.44) compared to those without IEPs (a = 3.52, v = 0.41). Similarly, ELs were less cautious (a = 3.41) and had a shallower drift rate, accumulating information less efficiently (v = 0.38) than non-ELs (a = 3.54, v = 0.42). Starting points were the same (zr = 0.21) between students with and without IEP, as well as ELs and non-ELs.
3.4. Simulation Results
Figure 6 shows simulated accuracy (blue dashed) and RT (red dotted) curves for the overall group (see Appendix B for simulated curves of subgroups). The overall, as well as subgroup, response patterns are consistent with Fitts’ law, which generally supports that accuracy increases as RT increases. The vertical solid black lines indicate the “baseline” thresholds with corresponding accuracy rates and RTs. As reported in Table 4, the overall accuracy rate is 95% at 7.50 s of mean RT at the baseline threshold with a value of 3.50. Subgroup results show similar performance at the baseline thresholds based on the (a) values reported in Table 3. The accuracy rates are 94% or 95%, and the RTs range from 7.04 to 8.17 s.
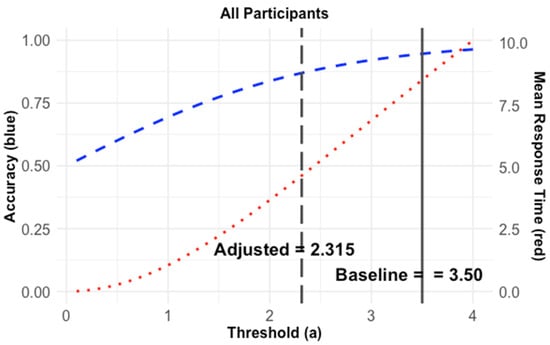
Figure 6.
Simulated accuracy and response time curves: blue dashed curve = simulated accuracy, red dotted curve = simulated response time, black dashed line = adjusted threshold, black solid line = baseline threshold.
Table 4.
Estimated speed (response time)–accuracy trade-offs.
As reported in Table 4, the overall accuracy rate is 87% at 4.13 s of mean RT at the adjusted threshold with a value of 2.31. Subgroup results show similar performance, ranging from 86 to 88% of the accuracy rate and 3.91–4.52 s of RT. These adjusted thresholds are where the trade-offs are best managed, given parameters.
3.5. Trade-Offs and Subgroup Comparison
Finally, we examined the estimated speed–accuracy trade-offs between accuracy and RT. As expected, decreasing the boundary separation value decreased the RTs as well as the accuracy rates. For the overall performance, the RT decreased by 44.95%, and the accuracy rate decreased by 8.42%. The subgroup results show similar trade-offs, ranging from 6.38 to 8.51% decreased accuracy rates and 40.48–50.80% decreased RTs, as reported in Table 4.
Table 5 shows the subgroup comparison results. A three-way ANOVA revealed statistically significant main effects of gender, EL status, and IEP status on RT (ps < 0.001), although effect sizes were very small (e.g., gender: partial η2 = 0.005). Logistic regression analyses indicated that gender, EL status, and IEP status were significant predictors of accuracy. Males were more likely to respond correctly than females (OR = 1.36, 95% CI [1.34, 1.38]). ELs were less likely to respond correctly than non-ELs (OR = 0.80, 95% CI [0.79, 0.81]). Students with IEPs were less likely to respond correctly than those without IEPs (OR = 1.33, 95% CI [1.29, 1.36]). Interactions between student background characteristics were also statistically significant, though effect sizes were small.
Table 5.
Response time: ANOVA results with partial η2.
As shown in Table 6, decomposition of interactions further indicates that student background characteristics (gender, EL status, and IEP status) vary across subgroups. For example, among ELs with IEPs, males were more likely to respond correctly than females, OR = 1.36, 95% CI [1.20, 1.26], whereas among non-ELs without IEPs, males were less likely to respond correctly, OR = 0.74, 95% CI [0.71, 0.77].
Table 6.
Simple effects analyses for gender, EL, and IEP status.
4. Discussion
4.1. Summary of Research Findings
The purpose of this study was to investigate how speed (RT in our study) and accuracy are related to each other and relevant to building whole-number concepts and skills for first-grade students with or at risk for MLD. We specifically examined students’ speed and accuracy when adding within 20 to determine the optimal performance threshold for NS1’s embedded assessments. Our aim was to locate a potential “sweet spot” for balancing RT and accuracy based on speed–accuracy trade-off analyses, thereby informing the optimal DLP configuration (i.e., individualized and intensified based on individual students’ performance) as a core component to individualize and intensify student learning within the NS1 game.
4.1.1. Overall Performance
To examine the overall relationship between RT and accuracy, we looked at overall patterns of student performance. Consistent with Fitts’ (1954) law, accuracy improved with slower responses until roughly 6.4 seconds (s), after which accuracy plateaued near 90% and began to decline—indicating diminishing returns for slower performance. Additionally, the decile data (see Table 2) indicates that the accuracy rate of the slowest group (79% in Bin 10) was below the other five groups (85–88% in Bins 5–9). Results support the notion of Fitts’ law in general, but suggest a need to cap a maximum RT (e.g., forcing the student into a specific learning pathway after 6.4 s) to categorize performance in the NS1 game consistent with recent studies in other fields (e.g., Domingue et al., 2022).
To find the “sweet spot”, considering both RT and accuracy, we assessed the speed–accuracy trade-offs by using DDM simulations to estimate the optimal point where RT and accuracy are balanced while students solve fluency-focused mathematics problems in the NS1 game. The concept of optimal response thresholds has been applied to address adaptation deficits of individuals with language impairments in clinical settings (e.g., Evans et al., 2019) but is relatively novel in special education research, particularly in technology-delivered interventions. To address this gap, we adapted a clinical approach from validated studies that established the “points of adaptive returns” as new optimal boundary separations using DDM simulations (e.g., Evans et al., 2019; Evans & Quique, 2021). Overall, results indicate that the predicted performance at the baseline threshold (a = 3.50) was conservative or cautious beyond the typical range, with a 95% accuracy rate and 7.5 s of RT. We sought to quantify the “sweet spot” of adjusted thresholds where students begin to perform with near-asymptotic accuracy while taking as little time as possible. Results indicate that the predicted performance at the adjusted threshold (a = 2.31) was less conservative or cautious, with a lower accuracy rate (87%) but faster RT (4.1 s). Therefore, the modeled trade-off suggests that students could respond nearly twice as fast (−45% change in RT) while sacrificing only modest accuracy (−8.4% change in accuracy), implying that moderate pacing may yield the most efficient learning outcomes. This suggests that RT should be considered a critical component of early mathematical fluency, and the fluency criteria need to be carefully set, especially in adding whole numbers within 20, to guide teachers’ instructional decision-making process in support of students with or at risk for MLD.
4.1.2. Subgroup Performance
Subgroup analyses provide further insights into how student background characteristics shaped response performance patterns within the NS1 embedded assessments. As shown in Table 5, subgroup differences by gender, EL status, and IEP status significantly predict the raw values of accuracy and RT, and all two- and three-way interactions. Conversely, as shown in Table 3, the estimated DDM parameter values were highly similar across subgroups (e.g., gender, IEP status, EL status), suggesting that the model captured broadly consistent relationships between RT and accuracy across groups. Specifically, boundary separation, drift rate, and starting point estimates varied only slightly, with no notable subgroup differences large enough to indicate meaningful disparities. Table 4 and Figure A2 in Appendix B further addressed this point, showing minimal variability across groups. At baseline thresholds, all subgroups achieved accuracy rates around 94–95% with mean RTs between 7 and 8 s. When thresholds were reduced to the point of the adjusted thresholds, all subgroups showed comparable trade-offs. For example, accuracy decreased by roughly 6–9%, while RT decreased by 40–50%. Although minor variations were observed (e.g., slightly faster RT reductions among males and students with IEPs), these differences were marginal and did not substantively alter the overall trade-off patterns across subgroups.
Taken together, the subgroup analyses revealed mixed findings. Analyses of the observed, empirical data (e.g., logistic regression, three-way ANOVA) indicated that all the subgroup differences significantly predicted both RT and accuracy. In contrast, DDM simulation results revealed no major difference in trade-off patterns in our sample. Students had similar speed–accuracy trade-off patterns regardless of gender, IEP status, and/or EL status, highlighting the robustness and generalizability of DDM-estimated patterns across diverse learners.
4.2. Conceptualizing the Thresholds in Technology-Based Mathematics Assessments
To improve conceptual understanding and procedural fluency of adding whole numbers in early mathematics for students with or at risk for MLD, teachers need to consider many factors, including accuracy, timing elements (e.g., RT), and efficiency of using flexible strategies. Although there is some disagreement in the field about the precise definition of mathematical fluency, in the current study we defined it as “how quickly and accurately a student applies specific [mathematical] skills” (Clarke et al., 2016, p. 83), and accordingly focused our efforts on addressing how to consider both accuracy and RT to optimize instructional differentiation in technology-based math interventions. More specifically, we examined game-based embedded assessment data focused on computational proficiency, or students’ ability to quickly and accurately recall basic math facts and procedures associated with whole-number concepts, using a focal early mathematics fluency standard (i.e., CCSS.1.OA.6., adding whole numbers within 20) in an evidence-based mathematics gaming intervention designed to improve whole-number conceptual understanding and procedural fluency for students with or at risk for MLD.
In the host study, RT criteria were not configured in the DLP within the NS1 game. Rather, based on a lack of theoretical or empirical evidence suggesting optimal RT, only accuracy criteria were configured to determine the DLP or individualized learning experiences students encountered during NS1 gameplay. At the time of our study, RT was collected in milliseconds for precise reporting, future analysis, and continuous revision of NS1 game sessions. Overall, the current study shows how students with or at risk for MLD performed in the embedded mathematics assessment of the NS1 gaming intervention and demonstrates the feasibility of estimating the trade-offs between RT and accuracy using DDM in technology-based special education interventions. Integrating both speed and accuracy metrics offers a data-driven approach to optimizing the NS1 learning pathways, enabling more personalized and efficient instructional adjustments. In other words, the findings of the current study provide us with empirical evidence to guide our future work on how to revise the DLP within the NS1 game by adjusting DDM parameters (please see the next section for future directions).
In essence, the speed–accuracy trade-off highlights a fundamental compromise in human performance (e.g., Fitts, 1954). Traditional permanent (e.g., analog) formative assessment products do not require collecting RT at the item level; thus, it is often not considered in assessing mathematical fluency of students with or at risk for MLD beyond timed tests (e.g., number of items answered correctly in one minute) that are limited in several ways, including their ability to act only as a loose approximation of mathematical fluency. Technology-based embedded assessments create new opportunities to measure fluency using detailed RT and accuracy data, extending beyond what conventional educational assessments can capture. We suggest technology-based intervention developers consider using speed–accuracy trade-offs to substantiate risk thresholds and configure an optimal DLP by considering both accuracy and RT when they set up early mathematical fluency criteria. Furthermore, we suggest developers add a profile customization feature where teachers can create a user profile with individual students’ background characteristics (e.g., IEP status, EL status), which will ultimately help teachers intensify instruction and individualize student learning experiences with student population characteristics taken into account.
Finally, we suggest that technology-based assessments could leverage the unique combination of RT and accuracy data afforded through technology-driven administration to improve understanding of student performance and make more precise recommendations for instruction. Based on our predicted “sweet spot” (87% accuracy rate with 4.1 s of RT), more specifically, we propose that 15 digits correct per minute (DCPM; 14.63 was calculated by dividing 60 by 4.1) might be used as a risk threshold for the early math fluency standard (i.e., CCSS.1.OA.6., adding within 20). We believe this is consistent with current literature, because Stocker et al. (2019) found that VanDerHeyden and Burns (2009) used 20 DCPM for second- and third-grade fluency criteria. Thus, we suggest developers use 15 DCPM as a fluency threshold for first-grade students with or at risk for MLD to add whole numbers within 20 in the context of technology-based mathematics interventions. It would also be indicative of a need for supplemental support and monitoring in multi-tiered systems of support (MTSS). For example, we suggest teachers review the digits correct per minute to provide additional support or intensify instructions within a tier (e.g., reteach how to add one if below fifteen digits correct per minute, provide students with additional practice) as well as to move students between tiers. However, because this study included only lower-performing students (i.e., those scoring below the 40th percentile on a mathematics screening assessment), this suggestion should be interpreted cautiously.
4.3. Study Limitations, Practical Implications, and Future Work
Overall, our study shows how finding and adjusting the timing element of a technology-based embedded mathematics assessment can provide useful information about how students with or at risk for MLD perform with whole-number concepts and procedural skills (i.e., by examining how quickly and accurately they were able to add whole numbers within 20 in the NS1 embedded assessment). Our findings suggest that accounting for both accuracy and RT might be one way to address the current research gap for determining timing elements that may be used to assess mathematical fluency within the context of a technology-based, game-embedded assessment; yet our suggested “response threshold optimality [still] prioritizes accuracy first but then also takes RTs into account” (Evans et al., 2019, p. 262).
We used DDM as the optimal decision strategy to find the speed–accuracy trade-offs, and the specific speed–accuracy trade-off is determined by the choice of threshold (Bogacz et al., 2006). We explored how to adjust the core parameters of DDM to find the threshold, or balanced point, that can optimize student performance in a technology-based mathematics assessment and intervention, taking into account both RT and accuracy. Our findings suggest that we can decrease the (a) value of boundary separation (i.e., response caution) by giving instructions to respond quickly. This would result in a shorter distance (e.g., faster RT) between the upper (e.g., correct answer) and lower boundary (e.g., incorrect answer), but it also increases the error rate (e.g., decreased accuracy). Using this method of adjusting parameters, we can identify optimal thresholds that balance RT and accuracy for the best overall performance. Using these data, in our future work, we seek to develop an adaptive DLP that would intensify instruction (e.g., by providing reteaching and supplemental practice) and individualize the instructional sequence a student experiences while playing NS1 based on individual student real-time data. Further, we hypothesize that increasing the (relative) starting point (zr) would move the performance starting point closer to the upper boundary of correct answers by providing more frequent practice and/or embedded game rewards. Increasing the drift rate (v) would result in faster information accumulation by providing easier question items in game activities. Adjusting the non-decision-making time (t0) would guide adjustments to the encoding process (e.g., adding voice or caption) or motor response for those with motor dysfunction (e.g., using assistive input devices). We note that this suggestion should be used carefully, as it cannot be generalized except for the NS1-specific work.
Our study has several limitations, however, that should be discussed in light of our findings and their implications. In our study, we evaluated the observed (actual) and the optimal (predicted) thresholds where returns on time investment are maximized, considering both accuracy and RT given the DDM parameters. Because our sample included only students with or at risk for MLD from one region and lacked a full performance comparison group, the observed 13.9 DCPM should be interpreted cautiously and validated with broader samples. As well, student characteristics (e.g., gender, IEP status, EL status) might impact thresholds for embedded performance in NS1, but it is beyond the scope of the current study to evaluate these.
In addition, the finding that the overall RT associated with maximum accuracy was lower than that of certain subgroups (e.g., females and males) likely reflects aggregation effects. The overall relationship was estimated from pooled data, which smooths variability across subgroups and may underestimate the longer RT tails observed within individual groups. Consequently, the aggregated RT–accuracy relationship might obscure subgroup-specific patterns in how students balance speed and accuracy. Future research should further investigate these dynamics using item-level or multilevel modeling approaches that more precisely capture within- and between-group variability.
Another limitation of the current modeling approach concerns the use of maximum likelihood estimation (MLE). Although MLE is a standard and widely applied estimation for diffusion models, it can be highly sensitive to outlier response time, especially extremely fast RT, which might bias parameter estimates (Myers et al., 2022). As such, careful attention to data cleansing procedures, considering the contexts of specific assessments and student characteristics, is essential when applying MLE. Future studies may consider additional estimation approaches, such as hierarchical Bayesian methods, which can provide more robust estimates in the presence of atypical observations. In addition, our model fit comparing the simulated and estimated models showed some extent of variation, especially when the accuracy estimated is below 50%. However, these results are consistent with other empirical studies reporting model fit with an accuracy estimate beyond 50% (e.g., Myers et al., 2022). Future studies could explore alternative estimation modeling that may improve fit in low-accuracy conditions.
Finally, an important avenue for future studies will be to extend the methods and analyses described in this article for application to other technology-based mathematics interventions focused on improving early elementary school students’ conceptual understanding and procedural fluency with whole numbers. Traditional, permanent formative assessment products (e.g., M-CBM) do not permit the collection of RT per item; thus, timing elements at the item level have not been considered. Meanwhile, technology-based intervention and assessment tools can collect RT per item and provide a unique opportunity to consider alternative and supplemental approaches to examining student performance data for estimating mathematical fluency, which have not previously been evaluated. Based on available theoretical and empirical evidence, we suggest that researchers and game developers prioritize accuracy but do not neglect RT (Evans et al., 2019) to optimize reporting of student performance in game-based fluency assessments.
5. Conclusions
Overall, our sample students showed difficulties in adding whole numbers within 20 (overall accuracy rate 64% with 6.13 seconds of RT). However, our findings suggest that applying DDM to find and adjust optimal performance thresholds has the potential to support decisions about necessary intervention design adjustments and instructional recommendations that can help students improve their performance in both accuracy and RT. These findings also support the viability of the DDM approach for investigating the trade-offs in technology-based mathematics interventions and assessments.
The current study’s focus on unpacking the mathematical fluency of early elementary school students with or at risk for MLD relative to accuracy, which is typically given primacy, is a promising conceptual and empirical contribution to mathematical fluency assessment, residing somewhere between traditional formative assessment and instructionally distal technology-based assessment approaches. Mathematics fluency, in early elementary school in particular, is important not only to predict performance on mathematics tests (Stickney et al., 2012) but has also been shown to be fundamental for later mathematics success (Woodward, 2006). Without the ability to demonstrate procedural fluency with numeracy skills and strong whole number conceptual understanding, students are likely to experience high cognitive load as they encounter more advanced content (National Research Council [NRC], 2001) and produce work that is not only inaccurate—it has the potential to reinforce misconceptions about how mathematics works and increase the mathematics difficulties students with or at risk for MLD often experience. Assuming the speed–accuracy trade-off captures a fundamental compromise in early mathematics performance, achieving higher accuracy typically demands slower responses. However, our findings suggest diminishing returns beyond a certain RT threshold, particularly in fluency-focused problem solving where efficiency and precision must be balanced. Finally, a systematic use of advanced technology tools may enable deeper insights into the patterns underlying early mathematical fluency, both within technology-based interventions and broader digital assessments.
Author Contributions
Conceptualization, S.C. and N.N.; Methodology, S.C., J.A. and D.K.; Formal analysis, S.C. and J.A.; Investigation, N.N.; Writing—original draft, S.C. and J.A.; Writing—review and editing, S.C., J.A., N.N. and D.K.; Project administration, S.C. and N.N. All authors have read and agreed to the published version of the manuscript.
Funding
The National Center for Special Education Research, Institute of Education Sciences, U.S. Department of Education, R324A160125.
Institutional Review Board Statement
The Institutional Review Board (IRB) of the University of Oregon, IRB #06022016.005, 1 November 2016.
Informed Consent Statement
Informed consent was obtained from all subjects involved in the study.
Data Availability Statement
The original data presented in this study are available on request from the corresponding author due to the extreme file size. Other data files and R script files, used to generate the data-related figures and tables in this article, can be downloaded at https://osf.io/pa4r6 (accessed on 21 November 2025).
Conflicts of Interest
The authors declare no conflicts of interest. The funders had no role in the design of the study; in the collection, analyses, or interpretation of data; in the writing of the manuscript; or in the decision to publish the results.
Abbreviations
The following abbreviations are used in this manuscript:
| ANOVA | Analysis of Variance |
| CBM | Curriculum-Based Measures |
| CCSS-M | Common Core State Standards for Mathematics |
| DCPM | Digits Correct Per Minute |
| DDM | Drift-diffusion model |
| DLP | Differentiated Learning Pathway |
| EL | English language |
| IEP | Individualized Education Program |
| MLD | Mathematics Learning Disabilities |
| OR | Odd Ratio |
| RT | Response time |
Appendix A


Figure A1.
Sample lesson routine.
Appendix B

Figure A2.
Simulated accuracy and RT curves: blue dashed curve = simulated accuracy, red dotted curve = simulated response time, black dashed line = adjusted threshold, black solid line = baseline threshold.
References
- Allen, K., Giofrè, D., Higgins, S., & Adams, J. (2021). Using working memory performance to predict mathematics performance 2 years on. Psychological Research, 85(5), 1986–1996. [Google Scholar] [CrossRef]
- Alonzo, J., Tindal, G., Ulmer, K., & Glasgow, A. (2006). easyCBM online progress monitoring assessment system. Center for Educational Assessment Accountability. Available online: http://easycbm.com (accessed on 21 November 2025).
- Baek, J., & Park, H. J. (2024). Bayesian adaptive method for estimating speed–accuracy tradeoff functions of multiple task conditions. Behavior Research, 56, 4403–4420. [Google Scholar] [CrossRef]
- Baroody, A. J. (2011). Learning: A framework. In F. Fennell (Ed.), Achieving fluency: Special education and mathematics (pp. 15–58). National Council of Teachers of Mathematics. [Google Scholar]
- Black, P., & Wiliam, D. (1998). Assessment and classroom learning. Assessment in Education: Principles, Policy & Practice, 5(1), 7–74. [Google Scholar] [CrossRef]
- Bogacz, R., Brown, E., Moehlis, J., Holmes, P., & Cohen, J. D. (2006). The physics of optimal decision making: A formal analysis of models of performance in two-alternative forced-choice tasks. Psychological Review, 113(4), 700–765. [Google Scholar] [CrossRef]
- Clark, A. K., & Karvonen, M. (2021). Instructionally embedded assessment: Theory of action for an innovative system. Frontiers in Education, 6, 724938. [Google Scholar] [CrossRef]
- Clarke, B., Nelson, N., & Shanley, L. (2016). Mathematics fluency—More than the weekly timed test. In K. D. Cummings, & Y. Petscher (Eds.), The fluency construct: Curriculum-based measurement concepts and applications (pp. 67–89). Springer Science + Business Media. [Google Scholar] [CrossRef]
- Common Core State Standard-Mathematics. (2010). Common core state standards for mathematics. Available online: http://www.corestandards.org/Math/ (accessed on 21 November 2025).
- Deno, S. L. (1985). Curriculum-based measurement: The emerging alternative. Exceptional Children, 52(3), 219–232. [Google Scholar] [CrossRef]
- Domingue, B. W., Kanopka, K., Stenhaug, B., Sulik, M. J., Beverly, T., Brinkhuis, M., Circi, R., Faul, J., Liao, D., McCandliss, B., & Yeatman, J. (2022). Speed–accuracy trade-off? Not so fast: Marginal changes in speed have inconsistent relationships with accuracy in real-world settings. Journal of Educational and Behavioral Statistics, 47(5), 576–602. [Google Scholar] [CrossRef]
- Evans, W. S., Hula, W. D., & Starns, J. J. (2019). Speed–accuracy trade-offs and adaptation deficits in aphasia: Finding the “Sweet Spot” between overly cautious and incautious responding. American Journal of Speech-Language Pathology, 28(1S), 259–277. [Google Scholar] [CrossRef] [PubMed]
- Evans, W. S., & Quique, Y. M. (2021). Understanding speed–accuracy processing dynamics in aphasia using response time modeling. Seminars in Speech and Language, 42(3), 240–255. [Google Scholar] [CrossRef] [PubMed]
- Fien, H., Doabler, C. T., Nelson, N. J., Kosty, D. B., Clarke, B., & Baker, S. K. (2016). An examination of the promise of the NumberShire level 1 gaming intervention for improving student mathematics outcomes. Journal of Research on Educational Effectiveness, 9(4), 635–661. [Google Scholar] [CrossRef]
- Fitts, P. M. (1954). The information capacity of the human motor system in controlling the amplitude of movement. Journal of Experimental Psychology, 47(6), 381–391. [Google Scholar] [CrossRef]
- Foegen, A., Jiban, C., & Deno, S. (2007). Progress monitoring measures in mathematics: A review of the literature. The Journal of Special Education, 41(2), 121–139. [Google Scholar] [CrossRef]
- Fritz, C. O., Morris, P. E., & Richler, J. J. (2012). Effect size estimates: Current use, calculations, and interpretation. Journal of Experimental Psychology: General, 141(1), 2–18. [Google Scholar] [CrossRef]
- Fuchs, L. S. (2017). Curriculum–based measurement as the emerging alternative: Three decades later. Learning Disabilities Research & Practice, 32(1), 5–7. [Google Scholar] [CrossRef]
- Fuchs, L. S., Fuchs, D., Stuebing, K., Fletcher, J. M., Hamlett, C. L., & Lambert, W. (2008). Problem solving and computational skill: Are they shared or distinct aspects of mathematical cognition? Journal of Educational Psychology, 100(1), 30–47. [Google Scholar] [CrossRef]
- Geary, D. C. (1993). Mathematical disabilities: Cognitive, neuropsychological, and genetic components. Psychological Bulletin, 114(2), 345–362. [Google Scholar] [CrossRef] [PubMed]
- Geary, D. C., Hoard, M. K., Byrd-Craven, J., Nugent, L., & Numtee, C. (2007). Cognitive mechanisms underlying achievement deficits in children with mathematical learning disability. Child Development, 78(4), 1343–1359. [Google Scholar] [CrossRef] [PubMed]
- Gersten, R., Beckmann, S., Clarke, B., Foegen, A., Marsh, L., Star, J. R., & Witzel, B. (2009). Assisting students struggling with mathematics: Response to Intervention (RtI) for elementary and middle schools (NCEE 2009-4060). National Center for Education Evaluation and Regional Assistance, Institute of Education Sciences, U.S. Department of Education. Available online: http://ies.ed.gov/ncee/WWC/PracticeGuide/2 (accessed on 21 November 2025).
- Heitz, R. P. (2014). The speed–accuracy tradeoff: History, physiology, methodology, and behavior. Frontiers in Neuroscience, 8, 150. [Google Scholar] [CrossRef]
- Institute of Education Sciences. (2016). A multi-site randomized controlled trial to assess the efficacy of the NumberShire level 1 gaming intervention for improving math outcomes for students with or at risk for math learning disabilities (Award No. R324A160125). The National Center for Special Education Research (NCSER), Institute of Education Sciences, U.S. Department of Education. Available online: https://ies.ed.gov/use-work/awards/multi-site-randomized-controlled-trial-assess-efficacy-numbershire-level-1-gaming-intervention (accessed on 21 November 2025).
- International Organization for Standardization. (2023). Accuracy (trueness and precision) of measurement methods and results—Part 1: General principles and definitions (ISO 5725-1:2023). International Organization for Standardization (ISO).
- Jordan, N. C., & Hanich, L. B. (2000). Mathematical thinking in second-grade children with different forms of LD. Journal of Learning Disabilities, 33(6), 567–578. [Google Scholar] [CrossRef] [PubMed]
- Kyllonen, P. C., & Zu, J. (2016). Use of response time for measuring cognitive ability. Journal of Intelligence, 4(4), 14. [Google Scholar] [CrossRef]
- Lembke, E., & Stecker, P. (2007). Curriculum-based measurement in mathematics: An evidence-based formative assessment procedure. RMC Research Corporation, Center on Instruction. Available online: https://files.eric.ed.gov/fulltext/ED521574.pdf (accessed on 21 November 2025).
- MacKenzie, I. S., & Mackenzie, S. (1992). Fitts’ law as a research and design tool in human-computer interaction. Human Computer. Interaction, 7(1), 91–139. [Google Scholar] [CrossRef]
- Mayer, R. E. (2009). Multimedia learning (2nd ed.). Cambridge University Press. [Google Scholar] [CrossRef]
- McCarthy, M. A., Niederjohn, D. M., & Bosack, T. N. (2011). Embedded assessment: A measure of student learning and teaching effectiveness. Teaching of Psychology, 38(2), 78–82. [Google Scholar] [CrossRef]
- McNeil, N. M., Jordan, N. C., Viegut, A. A., & Ansari, D. (2025). What the science of learning teaches us about arithmetic fluency. Psychological Science in the Public Interest, 26(1), 10–57. [Google Scholar] [CrossRef]
- Medrano, J., & Miller-Cotto, D. (2025). Understanding working memory as a facilitator of math problem-solving: Offloading as a potential strategy. British Journal of Educational Psychology, 95(3). [Google Scholar] [CrossRef]
- Miwa, K. (2023). How quickly do investors react to analyst reports? Evidence from reports released outside trading hours. Global Finance Journal, 57, 100856. [Google Scholar] [CrossRef]
- Myers, J. A., Witzel, B. S., Powell, S. R., Li, H., Pigott, T. D., Xin, Y. P., & Hughes, E. M. (2022). A meta-analysis of mathematics word-problem solving interventions for elementary students who evidence mathematics difficulties. Review of Educational Research, 92(5), 695–742. [Google Scholar] [CrossRef]
- National Council of Teachers of Mathematics. (2014). Principles to actions: Ensuring mathematical success for all. NCTM. [Google Scholar]
- National Governors Association Center for Best Practices & Council of Chief State School Officers. (2010). Common core state standards. Council of Chief State School Officers, National Governors Association Center for Best Practices. [Google Scholar]
- National Mathematics Advisory Panel (NMAP). (2008). Foundations for success: The final report of the national mathematics advisory panel. U.S. Department of Education.
- National Research Council (NRC). (2001). Adding it up: Helping children learn mathematics. National Academies Press. [Google Scholar]
- National Research Council (NRC). (2005). How students learn: History, mathematics, and science in the classroom. The National Academies Press. [Google Scholar] [CrossRef]
- Paganelli, A. I., Mondejar, A. G., da Silva, A. C., Silva-Calpa, G., Teixeira, M. F., Carvalho, F., Raposo, A., & Endler, M. (2022). Real-time data analysis in health monitoring systems: A comprehensive systematic literature review. Journal of Biomedical Informatics, 127, 104009. [Google Scholar] [CrossRef]
- Partchev, I., De Boeck, P., & Steyer, R. (2013). How much power and speed is measured in this test? Assessment, 20(2), 242–252. [Google Scholar] [CrossRef]
- Petscher, Y., Mitchell, A. M., & Foorman, B. R. (2015). Improving the reliability of student scores from speeded assessments: An illustration of conditional item response theory using a computer-administered measure of vocabulary. Reading and Writing, 28(1), 31–56. [Google Scholar] [CrossRef]
- Raghubar, K. P., Barnes, M. A., & Hecht, S. A. (2010). Working memory and mathematics: A review of developmental, individual difference, and cognitive approaches. Learning and Individual Differences, 20(2), 110–122. [Google Scholar] [CrossRef]
- Ratcliff, R. (1978). A theory of memory retrieval. Psychological Review, 85(2), 59–108. [Google Scholar] [CrossRef]
- Ratcliff, R., & McKoon, G. (2008). The diffusion decision model: Theory and data for two-choice decision tasks. Neural Computation, 20(4), 873–922. [Google Scholar] [CrossRef]
- Ratcliff, R., Smith, P. L., Brown, S. D., & McKoon, G. (2016). Diffusion decision model: Current issues and history. Trends in Cognitive Sciences, 20(4), 260–281. [Google Scholar] [CrossRef]
- Rittle-Johnson, B., Schneider, M., & Star, J. R. (2015). Not a one-way street: Bidirectional relations between procedural and conceptual knowledge of mathematics. Educational Psychology Review, 27(4), 587–597. [Google Scholar] [CrossRef]
- Schneider, M., Rittle-Johnson, B., & Star, J. R. (2011). Relations among conceptual knowledge, procedural knowledge, and procedural flexibility in two samples differing in prior knowledge. Developmental Psychology, 47(6), 1525–1538. [Google Scholar] [CrossRef] [PubMed]
- Shute, V. J., Lu, X., & Rahimi, S. (2021). Stealth assessment. In J. M. Spector (Ed.), The routledge encyclopedia of education (pp. 1–9). Taylor & Francis group. [Google Scholar]
- Sideridis, G., & Alahmadi, M. T. S. (2022). The role of response times on the measurement of mental ability. Frontiers in Psychology, 13, 892317. [Google Scholar] [CrossRef] [PubMed]
- Star, J. R. (2005). Reconceptualizing procedural knowledge. Journal for Research in Mathematics Education, 36(5), 404–411. [Google Scholar]
- Stickney, E. M., Sharp, L. B., & Kenyon, A. S. (2012). Technology-enhanced assessment of math fact automaticity: Patterns of performance for low- and typically achieving students: Patterns of performance for low- and typically achieving students. Assessment for Effective Intervention, 37(2), 84–94. [Google Scholar] [CrossRef]
- Stocker, J. D., Schwartz, R., Kubina, R. M., Kostewicz, D., & Kozloff, M. (2019). Behavioral fluency and mathematics intervention research: A review of the last 20 years. Behavioral Interventions, 34, 102–117. [Google Scholar] [CrossRef]
- Tan, S. Y., Sumner, J., Wang, Y., & Wenjun Yip, A. (2024). A systematic review of the impacts of remote patient monitoring (RPM) interventions on safety, adherence, quality-of-life and costrelated outcomes. npj Digital Medicine, 7(1), 192. [Google Scholar] [CrossRef]
- U.S. Department of Education. (2024). Report on the condition of education 2024 (NCES 2024-144). National Center for Education Statistics. [Google Scholar]
- U.S. Department of Education. (2025). The nation’s report card: Results from the 2024 national assessment of educational progress (NAEP). Institute of Education Sciences, National Center for Education Statistics. Available online: https://nces.ed.gov/nationsreportcard/ (accessed on 21 November 2025).
- VanDerHeyden, A. M., & Burns, M. K. (2009). Performance indicators in math: Implications for brief experimental analysis of academic performance. Journal of Behavioral Education, 18(1), 71–91. [Google Scholar] [CrossRef]
- Van der Linden, W. J. (2009). Conceptual issues in response-time modeling. Journal of Educational Measurement, 46(3), 247–272. [Google Scholar] [CrossRef]
- Vandierendonck, A. (2021). On the utility of integrated speed–accuracy measures when speed–accuracy trade-off is present. Journal of Cognition, 4(1), 22. [Google Scholar] [CrossRef] [PubMed]
- Voss, A., Rothermund, K., Gast, A., & Wentura, D. (2013). Cognitive processes in associative and categorical priming: A diffusion model analysis. Journal of Experimental Psychology: General, 142(2), 536. [Google Scholar] [CrossRef] [PubMed]
- Voss, A., Rothermund, K., & Voss, J. (2004). Interpreting the parameters of the diffusion model: An empirical validation. Memory & Cognition, 32(7), 1206–1220. [Google Scholar] [CrossRef]
- Voss, A., Voss, J., & Lerche, V. (2015). Assessing cognitive processes with diffusion model analyses: A tutorial based on fast-dm-30. Frontiers in Psychology, 6, 336. [Google Scholar] [CrossRef]
- Voss, A., Voss, J., & Lerche, V. (2025). rtdists: Response time distributions (Version 0.11-5) [R package]. Available online: https://github.com/rtdists/rtdists (accessed on 21 November 2025).
- Wilson, M., & Sloane, K. (2000). From principles to practice: An embedded assessment system. Applied Measurement in Education, 13(2), 181–208. [Google Scholar] [CrossRef]
- Woodward, J. (2006). Developing automaticity in multiplication facts: Integrating strategy instruction with timed practice drills. Learning Disability Quarterly, 29(4), 269–289. [Google Scholar] [CrossRef]
- Young, M. F., Slota, S., Cutter, A. B., Jalette, G., Mullin, G., Lai, B., Simeoni, Z., Tran, M., & Yukhymenko, M. (2012). Our princess is in another castle: A review of trends in serious gaming for education. Review of Educational Research, 82(1), 61–89. [Google Scholar] [CrossRef]
Disclaimer/Publisher’s Note: The statements, opinions and data contained in all publications are solely those of the individual author(s) and contributor(s) and not of MDPI and/or the editor(s). MDPI and/or the editor(s) disclaim responsibility for any injury to people or property resulting from any ideas, methods, instructions or products referred to in the content. |
© 2025 by the authors. Licensee MDPI, Basel, Switzerland. This article is an open access article distributed under the terms and conditions of the Creative Commons Attribution (CC BY) license (https://creativecommons.org/licenses/by/4.0/).