Abstract
The doctoral defense is considered to have three dimensions: the scholarly dimension, the emotional (affective) dimension, and the cultural dimension. In this work, I explore the link between sociodemographic factors and students’ perception of the doctoral defense to better understand the affective dimension. In particular, I focus on gender, ethnicity, and age at the time of defense, as well as current position and field of study. To address the influence of these aspects on the affective dimension of the doctoral defense, I first reviewed the literature on these sociodemographic aspects as well as the affective dimension of the defense. I then carried out an international survey on doctoral defenses, defense formats, and students’ perceptions and analyzed the 204 completed surveys for this study using quantitative and qualitative methods. The analysis included cross-correlations between students’ perceptions and the studied sociodemographic aspects. The main results of these analyses are that gender affects various aspects of the students’ perception of the doctoral defense and long-term perception, and that female candidates experience more issues with their committee. Ethnicity is important as well, although the participation of non-white respondents in this survey was limited. The influence of age at the defense is limited, and only for the youngest and oldest age groups did I observe some differences in perception. There is no relation between current position and perception of the candidates during the defense. Finally, field of study is correlated for various aspects of student perception, committee issues, and long-term perception. The conclusion of this work is that sociodemographic aspects, and in particular gender, ethnicity, and field of study, influence how doctoral candidates experience their defense.
1. Introduction
The doctoral defense is an important step towards obtaining the doctoral degree in defense formats that use an oral defense, yet it is a step of doctoral education that has not been studied much in an international context. As the doctoral defense is the pinnacle of the PhD trajectory, better understanding the defense and how students experience the defense is an important element of studying the quality of doctoral education.
The existing work on doctoral assessment is mostly limited to studying the viva voce in the United Kingdom [1,2,3,4,5,6,7,8], the assessment of the thesis in Australia [9], and the experience in New Zealand for non-native English speaking candidates [10]. Some work has also looked at the different formats used for the doctoral defense in European countries, in light of potential pan-European standardization of the defense procedures [11,12,13,14,15,16,17,18,19,20]. Finally, some research has addressed the doctoral defense in the United States [12,20].
The terms used for the doctoral defense vary internationally: in the UK and countries using the education system from the UK, the terms viva or viva voce are used; in Sweden, the term disputation is used; and in Norway, disputas. For consistency, I only use the term defense is this article. Similarly, different terms may be used for the committee members: in the UK, they may be referred to as examiners (i.e., the two committee members who ask the questions during the defense), whereas in Norway and Sweden the main committee member, who gives a summary of the work at the beginning of the defense and who asks most of the questions, is called the opponent. In this paper, I generally call all those who form part of the committee during the defense, committee members.
Previous work indicated that the defense has three dimensions: the scholarly dimension, the emotional (affective) dimension, and the cultural dimension [5,10]. Most research on the doctoral defense in the past has focused on the scholarly dimension and how the quality of doctoral research is assessed during the defense, as well as the relation between the evaluation of the written thesis and the evaluation of the oral defense [2,3,8,12,21,22,23]. So far, work on the affective dimension is limited to evaluating students’ perception of the defense [2,5,20,24,25,26], with each of these studies focusing only on one defense format.
My previous work [27] looked at the relation between students’ perception and the defense format, to find which aspects of the defense format impact the experience of doctoral candidates. To my surprise, the major differences between defense formats did not change the experience of the candidates very much, except for the differences between the defense format in which the thesis is published before the defense as compared to the format in which the thesis is published after the defense. Smaller elements, such as receiving committee feedback before the defense, knowing the recommendation of one or more members of the committee before the defense, having a supervisor present during the defense (as a committee member or in the audience), using formal dress and/or academic togas during the defense, and including a laudatio (congratulatory speech) at the end of the defense, were found to be statistically relevant for a positive experience of the doctoral candidate in one or more dimensions of student perception that I investigated.
I concluded from my previous research that the small details of the defense impact how students feel during the defense and that the defense is both a very personal experience as well as influenced by the behavior of the committee members during the defense. In this work, I further explore the aspects that may correlate to the very personal experience of doctoral students during the defense and its long-term impact on the students’ perception. In particular, and inspired by Crossouard [5] who explored the gendered and affective dimensions of the defense, I wanted to see if minorities (in terms of gender, ethnicity, and age at the defense) experience the defense in a different way than those who are traditionally well-represented in academia. I also wanted to explore if there is a link to the career path the candidates take after their defense and to explore differences between fields of study. For this purpose, I approached the doctoral defense as an event made up of different building blocks of the defense format and used a survey to correlate sociodemographic aspects of the survey participants and their perception of the defense and long-term impact of the defense. The value of this work lies in its exploration of how individuals experience the defense as a function of their sociodemographic characteristics. As such, this work may be of interest to current doctoral candidates, committee members, supervisors, and university administrators. This study aims at critically evaluating which sociodemographic aspects influence how a candidate perceives the defense. These insights can then be used to help committee members and universities understand the (implicit) biases that play a role during the defense, as well as explore the effect of the defense on future career paths, and find differences in perceptions of students about their defense between different fields of study.
2. Literature Review
2.1. Affective Aspects of the Doctoral Defense
Research on the doctoral defense [22,28] identified the different aspects that play a role during the defense. Clarke [29] showed that several skills are necessary during the defense: the candidate should have written a strong thesis, should know the field well, and should be able to defend his/her/their work properly. In addition, the personal skills and abilities of the candidate play a role during the defense. All these aspects and skills come together during a defense, making each defense unique. Adding in the differences between the personal experiences of the committee members, differences in how a committee weighs the different skills of the candidate that are on display during the defense, and the differences between fields of study, we can understand that there is a certain level of inconsistency among defenses and that making the evaluation of the doctoral defense more uniform may be challenging and perhaps not the desired outcome.
Other research on the doctoral defense in the UK [2] found that the emotional aspect of the defense is important. Candidates who consider themselves as calm in nature also reported that they became nervous before the defense or even during the defense as a result of the behavior of the committee members. The room in which the defense takes place also influences the affective dimension: candidates feel safer when they are in a room with windows, when they are closer towards the exit, and when water is provided for the candidates.
Trafford and Leshem [28] analyzed one defense in the United Kingdom in depth to explore the hidden elements of the defense. They were particularly interested in the emotional aspects of the defense. In their observations, they noted that nonverbal communication plays an important role during the defense, an aspect which is also found in [30]. Based on their analysis of the defense, Trafford and Leshem [28] identified three sets of variables: explicit doctorateness in the thesis design, scholarly and emotional resilience, and the social dynamics that are at play during the defense. The first dimension here is doctorateness, which is identified as being a sound scientist and researcher and showcasing good scholarship. The second dimension refers to the ability of the researcher to remain emotionally strong under the stress of the defense. Finally, the social dynamics during the defense require the candidate to be able to understand and interpret the social situation during the defense. This social dimension is important, because the defense is different from day-to-day interactions, both for the candidate and the committee members. At the intersection between social dynamics and doctorateness, there is enthusiasm and excitement about the research. At the intersection between the social dynamics and resilience, there are the willingness and ability to defend. Where doctorateness and resilience intersect, we find confidence in the scholarly aspects of the work and, in particular, in the design of the study and the conceptual conclusions of the research. Finally, where all three aspects coincide, synergy occurs. The more synergy a candidate manages to tap into during the defense, the more likely it is that the candidate successfully defends the thesis.
As Crossouard [5] pointed out, assessment in higher education is “often discussed as a predominantly ‘technical’ process, involving rational and objective measurement of individual attainment or attributes”, and the affective dimension of the doctoral defense as the final oral assessment of the doctoral candidate is not well recognized. In fact, passionate emotions in the heat of the argument can occur during the defense. Sikes [21] also emphasized the sometimes passionate attachments that play a role during the defense, as well as the observation that candidates and committee members may behave differently during the defense as a result of their personal emotional state.
Crossouard [5] also found that there is also an affective level to the anticipation of the defense, as candidates remember past experiences. If they have bad past experiences relating to oral exams, they may experience additional stress in preparation for the defense. With regard to this anticipation of the defense, Wellington [6] studied both the affective and cognitive aspects of the doctoral defense in focus groups. His work focused on the positive and negative anticipations of doctoral candidates before the defense. The eight categories of positive anticipation that students felt are the following:
- “feelings of the end, the climax, the start of a new life,
- unique opportunity for feedback, improvement and dialogue with experts,
- an event of legitimation and acceptance,
- an opportunity for clarification, explanation and defense,
- chance to show emotion and enthusiasm,
- anticipations of utility, formative feedback and future development,
- feelings of confidence,
- chance to reflect, tell the story, and consolidate.”
The four categories of negative anticipation students felt before the defense are:
- “fears about the outcomes,
- worries about themselves before or during the viva,
- apprehensions relating to the examiners, their questions and their comments,
- anxieties about post viva feelings.”
In earlier work [31], I pointed out that the defense has significant emotional value, as it is the pinnacle of the doctoral journal. Even when the thesis is published and the candidate knows they will pass the defense, the emotional stakes are high, as the candidate wants to perform well at this crucial step in obtaining the doctoral title. This observation holds particularly true when the defense is public and in front of friends, family, and colleagues. Therefore, I also stressed the importance of anticipating the emotional aspects of the defense for doctoral candidates and their supervisors and learning how to navigate such emotions.
2.2. Sociodemographic Aspects and the Doctoral Defense
Crossouard [5] carried out semistructured interviews with 20 respondents from eight universities in England to explore the affective and gendered dimensions of the defense. One of the findings is that when a candidate speaks in a soft or searching way, the committee may interpret this way of speaking as doubt about the research. She also reports on the masculine aspects in academic culture, portrayed by men and women, where grilling candidates and power hierarchies are accepted practices. The affective dimension was also found to be “embodied (and therefore classed, gendered, racialized)”. Her research unveiled that the power struggles during the defense can be considered as symbolic violence to the candidate, who needs to remain professional while going through difficult emotions, especially when the committee members require the candidate to bend their defense and their research towards the views and priorities of the committee members. Candidates with a lower-class social background may also feel out of place during the defense, as they become acutely aware of their social class positioning.
Morley et al. [8] pointed out that committee members can be stereotyping students during the defense and that discrimination on the basis of gender and race occurs. An example reported by Watts [32] is when committee members ridicule feminist scholarship, of which I also found evidence previously [27]. A particular difficulty for minorities and those who were treated unfairly by their committee is that there is no moderation of the outcome of the defense. While most universities have practices in place for when a student appeals the outcome of an exam, these regulations typically do not apply to the doctoral defense.
Gallego-Moron [33] identified the moment of the doctoral defense in Spain as the turning point of gender distributions at universities. The moment of the doctoral defense is the beginning of the point in their careers when women in academia experience the glass ceiling and sticky floors. In addition, Villarroya [34] found that, while gender equality in the number of doctoral candidates has increased in Spain, there is still a gender imbalance in the committees during the doctoral defense and among thesis supervisors.
The influence of ethnicity on the doctoral defense seems not to have been addressed in previous research. Using a Scopus search on the key terms of ‘race AND “viva voce”’, ‘ethnicity AND “viva voce”’; ‘ethnicity AND “doctoral defense”’; and ‘race AND “doctoral defense”’ yielded no results. Similarly, searching for ‘age AND “viva voce”’ and ‘age AND “doctoral defense”’ did not give me results on the relation between the age of the candidate at the time of the defense and the experience during the doctoral defense.
The influence of the field of study and the differences between different fields of study have been anecdotally mentioned in different previous studies. In addition, in this study of the outcomes of the defense in the UK, Ryder [35,36,37,38,39] found some differences in the outcomes between different fields. He found a slightly higher percentage of candidates with minor corrections in science and engineering majors. For these fields, 93% of the candidates passed with minor or no corrections. Conversely, in the arts, social sciences, and humanities, the percentage of candidates passing with major corrections was higher. This work only focused on reporting the descriptive statistics of the outcome of the survey and did not look at the potential statistical relevance of the field of study.
2.3. Research Gap
This research explores the link between sociodemographic aspects of doctoral candidates and the perception of these candidates about their doctoral defense. As I concluded from previous research that the defense is a very personal experience with an important affective dimension, the research question arose if candidates from minorities (gendered, ethnic, and based on age at the defense) experience the defense and its long-lasting effects differently as compared to the norm of academia, which is dominated by Western, white, cisgendered, economically privileged, and able-bodied men who studied their doctorate directly after their Master’s degree and have been moving steadily through the academic ranks [40,41]. This work also explores the affective dimension of the doctoral defense in an international context. As such, this work broadens the study of the affective and gendered dimensions of the doctoral defense by looking at international data and by widening the scope to include other sociodemographic factors that may affect student perception.
3. Materials and Methods
3.1. Survey Design
For the analysis of the relation between the sociodemographic aspects and students’ perception, I used a survey originally developed to study the relation between defense format and students’ perception [27] (see Supplementary Material). The study and survey received IRB approval 2019-139IN through Universidad San Francisco de Quito. The survey was open between 13 July 2020 and 3 October 2020.
The survey started with an opening question to explain the purpose of the survey to the respondents and ask for their informed consent. Then, the survey contained three blocks of questions: a set of questions on the sociodemographic aspects, a set of questions on the defense format, and a set of questions on the students’ perception. The type of questions that were used in the survey were: closed multiple choice questions (40 in total); 11-point Likert scale [42] questions (8 in total); and open-ended questions (6 in total: 3 short questions regarding year of birth, defense, and email address and three open-ended questions about the defense). The survey contained 54 questions in total.
The questions regarding the sociodemographic aspects studied the following elements: country of residence, country where the candidate defended the doctoral thesis, year of birth, year of defense, ethnicity, gender, current position, and field of study. The question on current position looked at the following options: postdoctoral researcher, assistant professors, associate professor, full professor, other academic appointment, employed in industry, employed in government, business owner/self-employed, unemployed, and other. For the academic positions, I used the promotion system from the United States.
The questions about students’ perceptions looked at the affective level of the defense [2,43], at the perceived purpose of the defense [24], and the long-term impact of the defense on student perception [24]. The emotions that I included are: nervousness (before, during, and after the defense), enjoyment, difficulty, perceived formality, seriousness, and the overall value of the defense as part of the doctoral experience.
The survey was open to all who have defended their doctoral thesis, regardless of the outcome, how long ago the event took place, and the country of defense (or defense format). I found participants for the survey through my personal network: through social media and by email. As such, the sample is a self-selecting convenience sample [44]. For this exploratory work on the doctoral defense, this sample is suitable, but future studies may need to look at a different method of sampling.
3.2. Analysis Methods
3.2.1. Analysis Procedures
The procedures I used for analyzing the data are the same as outlined in [27] but are now applied to the relation between the sociodemographic aspects of the participants and the students’ perception, in order to more deeply explore the affective dimension of the doctoral defense. I used quantitative and qualitative methods to analyze the data. The first step in the data analysis was to read through all responses horizontally and vertically to get a first grasp of the outcomes. Then, I set up filters in the survey platform to be able to process further only the data of the completed surveys. From the outcomes of the completed surveys, I developed a first report on the survey platform. Then, to process the data, I exported the results to MS Excel and set up various spreadsheets to study breakdowns of responses by sociodemographic categories. I also checked the results in these spreadsheets with the tables I could generate on the survey platform using the option to breakdown the data by a selected (sociodemographic) category.
To look at the relations between sociodemographic factors and students’ perception, I first used the crosstabs on the survey platform. This crosstabulation feature shows the breakdown of a certain result by the selected sociodemographic feature in the number of respondents as well as percentages and provides descriptive statistics as well as initial crude stats tests (p-value for the chi-squared test and ANOVA test). To derive the p-values of the statistical tests reported in this paper, I programmed routines in Matlab R2019a using the Wilcoxon rank sum test for comparing two categories of a sociodemographic aspect or using the Kruskal–Wallis when the aspect contained more than two categories [45]. For this purpose, I recoded text values to numerical values in MS Excel, which I then imported as vectors into Matlab. A p-value of <0.05 was considered to be an indication of a strong correlation.
This work focuses on quantitative analysis, but I have used some insights from the qualitative analysis of the survey results to strengthen the argument in this article. The qualitative analysis uses inductive thematic analysis [46,47,48]. In the first step, I read all the responses to each open-ended question to obtain a first grasp of the themes. Then, I used the text analysis feature of the survey platform to tag the responses with emerging themes. I developed the associated memo to the themes by hand in my research notebook to avoid repetition and to discuss the meaning of the codes. In the next step, with my memo by my side, I went through all the responses again to check the codes I had tagged and adjusted where necessary. Then, I exported the codes and number of mentions and arranged these in tables in MS Excel, which included the overarching themes, and then I sorted by the most frequently mentioned overarching theme to the least frequently mentioned. I did not have preconceived ideas about the themes but let these themes surface based on the responses and the analysis procedure that I described here.
3.2.2. Matrix of Analyses
To study the association between the sociodemographic factors and the perception of students of their doctoral defense, I developed the analysis matrix shown in Table 1. In this table, I identified 14 dimensions of student perception and 5 sociodemographic elements. As such, this matrix results in 70 cross-correlations to explore.

Table 1.
Matrix of analysis between categories of sociodemographic properties and categories of student perception.
The analyses were carried out in Matlab, after recoding the text values into numerical categories for processing the data. For each of the five sociodemographic aspects, I wrote a separate code (.m-file).
3.3. Participants
A total of 296 respondents filled out the survey. The dataset generated by this survey is anonymized and provided in the public domain [49]. A total of 204 of the 296 responses were completed up to the last question, and only these completed surveys were used for the data analysis. The time to complete the survey ranged between 2.5 and 4851 min (81 h), with an average time of completion of 39 min and a median of 10.6 min. Respondents could return to the survey at their convenience, as long as they used the same IP address; therefore, the longer completion times indicate that respondents used several sessions to complete the survey.
Table 2 shows the sociodemographic characteristics of the survey respondents, based on the categories ethnicity, age at the defense, current employment, and field of study. All categories are broken down by gender as well. The majority of the survey respondents self-identified as women (64%), white (72%), and currently employed in academia (76%). None of the respondents self-identified as “Other/prefer not to say” gender. The average age of the participants at the time of the defense was 33 years, and the median value of this age was 31 years. The distribution among the fields of study is fairly uniform, with only humanities and arts (14%) and multidisciplinary (4%) fields of study with relatively low representation.
Table 2.
Sociodemographic aspects of survey respondents, broken down by gender. Note, no respondents self-identified as “Other/prefer not to say” gender.
Ethnic diversity is larger in the male respondents than in the female respondents. Employment distribution is similar for male and female respondents. The distribution of age at the time of defense is similar for male and female respondents, with more female (43%) than male (33%) respondents obtaining their doctorate between 26 and 30 years of age, and, conversely, more male (41%) than female (26%) respondents obtaining their doctorate between 31 and 35 years of age. The majority (52%) of all respondents defended between 1 and 5 years before completing the survey. More than half (56%) of all male respondents obtained their doctorate in STEM, whereas the distribution of fields for the female respondents is more uniform, with STEM (13%) and multidisciplinary (6%) fields being relatively underrepresented.
Survey respondents obtained their doctorates in 31 different countries and resided in 34 countries at the time of completing the survey, representing all six inhabited continents. Most of the respondents obtained their doctorate in the United States (33%), the Netherlands (16%), the United Kingdom (12%), Canada (9%), France (3%), and Spain (3%), and most respondents resided in the United States (30%), Ecuador (13%), the Netherlands (13%), the United Kingdom (9%), or Canada (8%) at the time of completing the survey.
4. Results and Analysis
4.1. Results of Questionnaire and Analysis
First, I present the main results of the survey in terms of characteristics of the defense. More information is presented in [27]; here, only a summary is given with a focus on the breakdown by sociodemographic characteristics. The majority of survey respondents (68%) passed their defense. A total of 28% of respondents had minor corrections, and 3% had major corrections. This distribution is the same for the male and female respondents, with small differences in the percentage of respondents who received minor corrections (29% of male respondents versus 28% of female respondents) and major corrections (3% of male respondents versus 4% of female respondents). This distribution is also similar across ethnicities, although the limited participation of non-white respondents results in numbers that are too low to clearly compare the distributions. Given the low number of respondents with major corrections, all respondents who received major corrections self-identified as white. The outcomes are also similar for the different age groups.
As discussed in [27], the timing of the publication of the thesis matters for the students’ perception. Slightly more women (40%) than men (32%) published their thesis before the defense, and, conversely, slightly more men (68%) published their thesis after the defense than women (60%). One female respondent had not finished her thesis yet at the time of responding to the survey. This distribution is similar for all ethnicities, except that the majority of Asian participants submitted their thesis before the defense.
In terms of defense format, the majority of the participants had a one-step defense. The percentage of female participants who had a one-step defense was larger (87%) than that of male participants (68%). Two-step defenses were slightly more common for the male respondents (29%) than the female respondents (12%). Of the male respondents, 3% reported to go through more than two steps, as compared to 2% of the female respondents. Two-step defenses were also slightly more common for the Black or African American respondents (37.5%). The two participants who defended their doctoral thesis in written format were both female.
The majority of participants (53% of males and 58% of females) had a public defense. A larger percentage of female participants (30%) than male participants (25%) had a private defense, whereas more men (22%) had a two-step defense with both parts than women (12%). As two-step defenses were more common in the group of Black or African American respondents (37.5%), a lower percentage (37.5%) had a public defense, and one quarter (25%) had a private defense.
In terms of defense length, the majority of participants reported that the committee determined the length of the defense. Only for the subset of Black or African American respondents did the majority (62.5%) of the respondents have a defense on a fixed time schedule. As for the length of the defense, the distribution is generally similar for male and female respondents, see Figure 1. More male respondents (36%) than female respondents (21%) had a defense that lasted longer than 2 h. This distribution is similar for the different ethnicities.
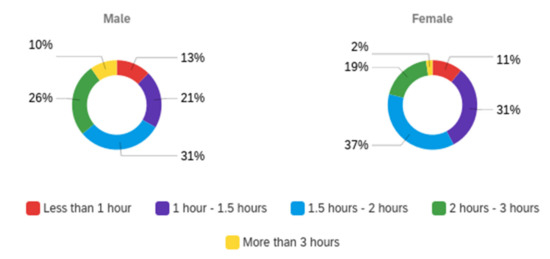
Figure 1.
Breakdown of length of defense by gender, for n = 72 male respondents and n = 128 female respondents.
A slightly larger percentage of the male participants (56%) received committee feedback before the defense than that of the female participants (52%). Of all ethnicities, the majority of the respondents received committee feedback before the defense. The majority (57%) of female respondents implemented this feedback in the thesis before the defense, whereas a lower percentage (45%) of the male respondents implemented the feedback before the defense. Less than half of the white participants implemented the feedback before the defense, as compared to more than half of all respondents of the other ethnicities.
A larger percentage of men (58%) did not have an idea of the committee recommendation before the defense than the women (50%). Of the Black or African American respondents, three quarters (75%) did not have an idea of the recommendation before the defense.
In terms of committee composition, the most common number of committee members was five (30% of respondents). The distribution of the number of committee members was similar for the male and female respondents; see Figure 2. No differences occurred in terms of numbers of committee members when breaking down the data by ethnicity. The majority of respondents (73%) had their supervisor present as part of the committee. More men (22%) had their supervisor as part of the audience than women (17%), and more women (10%) did not have their supervisor present than men (6%). No changes could be observed when comparing the results of participants of different ethnicities. The distribution between committee members that are internal to the department (33%), internal to the university (29%), from another university (33%), from industry (4%), and from the government (1%) is similar for male and female respondents. No noticeable differences in committee composition can be seen across the different ethnicities.

Figure 2.
Distribution of numbers of committee members, broken down by gender. n = 70 for the male respondents and n = 128 for the female respondents.
The majority (79%) of the respondents had a defense that included a presentation. The distribution is similar for male and female respondents and for all groups of ethnicities. Most defenses (87%) focused on the research only, while the rest (13%) included other elements. These results are nearly the same for both genders and all ethnicities. In terms of audience of the defense, the breakdown between guests and committee (68%), only guests (2%), only committee (16%), and other configurations (14%) is similar across the genders and ethnicities. Overall, the distribution between defenses with all committee present physically (73.5%), some present physically and some connected remotely (19.5%), and all connected through online conferencing tools (9%) is the same for male and female participants, except for the modality of some members being present physically and others remotely. This configuration occurred for 12.5% of the male respondents and 20% of the female respondents. No differences were seen as a function of the ethnicities. The questions during the defense came in the majority of cases (64%) from all committee members, followed by the audience (21%) and some committee members (10%). This result is the same for both genders. For the Black and African American participants, 45% of the respondents received questions from all committee members, 27% from the audience, and 27% from some committee members. For the other ethnicities, the breakdown is similar as for the overall answers.
The language of the defense was English in the majority (78%) of the cases, and for the remaining respondents (22%), the language of the defense was the language of the country where the university is located. A slightly larger percentage (26%) of the male respondents than the female respondents (20%) defended in the language of the university’s country. The results are the same for the different ethnicities. In terms of language nativeness, the majority (62%) of the respondents were native speakers. Non-native speakers (27%) and near-native speakers (10%) made up the remaining part of the respondents. A slightly larger percentage of male respondents (31%) than female respondents (26%) were non-native speakers of the language of their defense. Almost half (47%) of the Asian respondents identified as non-native speakers of the language of the defense.
Most defenses (62%) did not require a dress code, with the remaining defenses either requiring formal wear (26%) or togas (13%). A slightly larger percentage of men (67%) than women (58%) had a defense without a dress code, and, conversely, a larger percentage of women (15%) had a defense requiring academic togas than men (8%). A larger part (76%) of the Asian respondents as compared to other ethnicities participated in a defense without a dress code. The majority of the defenses (57%) did not include a laudatio at the end, and the remaining part (43%) included a laudatio. More female respondents (45%) than male (39%) had a defense that included a laudatio. The majority of Black or African American (87.5%), Asian (53%), and First Nations (100%) respondents had a defense format with a laudatio.
4.2. Association between Sociodemographic Factors and Student Perception
4.2.1. Gender
For a number of aspects of the perception of students about the doctoral defense, gender plays a role. Since in this research none of the participants identified as “other” or “prefer not to say” gender, I have used a Wilcoxon rank sum test for the categories “female” and “male” to study the effect of gender on the elements of student perception identified in Table 1. The first sentiment that is clearly related to gender is nervousness. Female PhD candidates experienced more nervousness than male PhD candidates: before the defense (average = 7.242 on a 0–10 Likert scale for females versus average = 5.958 for males, p = 0.0013), during the defense (average = 5.355 for females versus average = 3.931 for males, p = 5.5 × 10⁻⁵), and to a lesser extent after the defense and before knowing the outcome (average = 4.297 for females versus average = 3.444 for males, p = 0.0648, indicating only a weak correlation to gender here). These findings are also reflected in the boxplots in Figure 3.

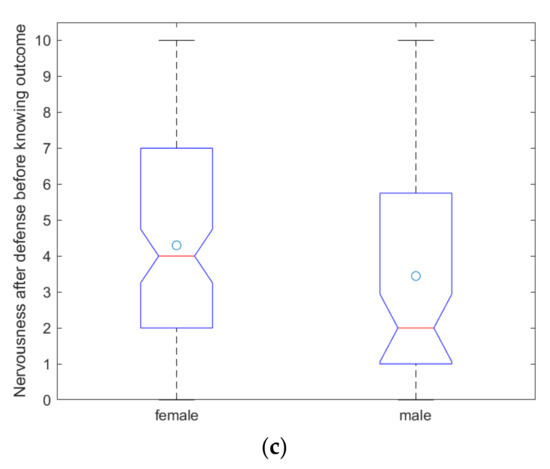
Figure 3.
Nervousness by gender: (a) before the defense, (b) during the defense, and (c) after the defense and before receiving the outcome. n = 200 for before the defense, with n = 128 female respondents and n = 71 male respondents, n = 197 for during the defense, with n = 124 female respondents and n = 72 male respondents, and n = 175 for after the defense, with n = 111 female respondents and n = 63 male respondents. The red line in the boxplot indicates the median, and the blue dot indicates the mean value.
The second sentiment that is correlated to gender is enjoyment. Male PhD candidates enjoy (average = 7.141) their defense more than female candidates (average = 6.341), p = 0.0387; see Figure 4. On average, female students also perceive their defense as more important (average = 7.674) than male students (average = 7.157), but there is no statistically significant relation between the perceived importance and gender. Female students also perceive their defense as more difficult (average = 6.279) than male students (average = 5.183), p = 4.4 × 10⁻⁴; see Figure 5. Perceived formality of the defense, seriousness of the defense proceedings, and overall value of the defense are not correlated to gender.

Figure 4.
Enjoyment of the defense on a 0–10 Likert scale, broken down by gender. n = 197, with n = 126 female respondents and n = 71 male respondents. The red line in the boxplot indicates the median, and the blue dot indicates the mean value.
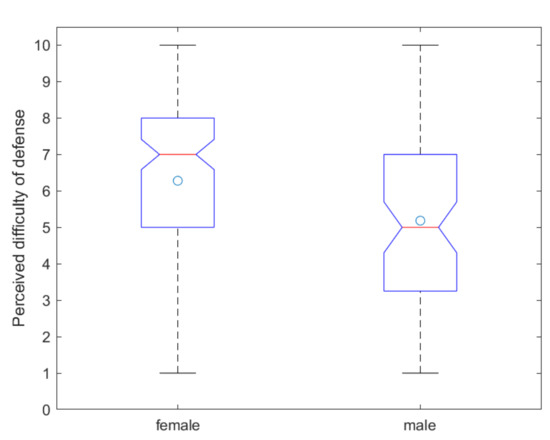
Figure 5.
Perceived difficulty of the defense on a 0–10 Likert scale, broken down by gender. n = 200, with n = 129 female respondents and n = 71 male respondents. The red line in the boxplot indicates the median, and the blue dot indicates the mean value.
In terms of fairness of the committee and suitability of the committee for making a well-balanced assessment of the work of the student, there is an effect of gender as well. As shown in Table 3, fewer women PhD candidates perceive their committee as fair and suitable for making a well-balanced assessment of their doctoral work. For fairness, I found that there is a statistical correlation to gender, p = 0.0236, whereas there is no statistical correlation with suitability.
Table 3.
Committee fairness and suitability, by gender.
The aspects of long-term impact of the defense on the perception of the students are statistically not related to gender, although differences in the percentages of answering could be found, as shown in Table 4. What we can observe from this table is that, overall, fewer female PhD candidates receive a long-term boost in perception after the defense as compared to the male PhD candidates and that a larger percentage of female candidates experiences negative long-term effects on the perception than their male counterparts.
Table 4.
Long-term impact of defense on student perception, by gender.
In the open-ended question about the purpose of the defense in the candidate’s own words, six participants (two male and four female) flagged a negative perception: “Last round of academic hazing” and “A show piece that a PhD is Serious Business and that candidates are lucky to be allowed to join an exclusive club”. A female scholar reflects on the difficulty of the first defense in a two-step defense format as follows:
“The first part of the defense was geared mainly towards receiving feedback and a long and serious discussion took place; it was a tough experience because this was the moment for the members of the committee (not my supervisors) expressed what was good but also what really needed improvement. After this first step I incorporated changes in my dissertation and after it was approved followed the final defense. I would say the purpose of this defense was more ceremonial and formal and it was more a chance to share my experiences, knowledge, etc.”
The difficulty for female scholars who work on feminist issues experience during the defense was also brought to our attention by this response:
“Well, the purpose of what my defense was supposed to be and what is ended up being are two different things. I had attended someone else’s defense before mine and based on that experience, and the information from my advisor, I was under the assumption that the defense was a way to explain my research and to provide clarity on anything that my committee had questions about. Also, to explain any limitations. Unfortunately, 2 of my committee members did not really provide me with the opportunity to do either of these things. The first committee member lectured me for his 20 min time limit about how he didn’t like how I interpreted one of the films I mentioned (not the ones I actually analyzed -- the film in question was just foundational). The other committee member, also male, lectured me about feminism (my dissertation’s sub-title partially includes 20th/21st century Post-modern Feminism) and went over his time soooo much that my advisor was only able to ask 1 question, since she went last. Additionally, both the male committee members wanted extensive edits that had not be[en] mentioned previously and were not possible given the time until I had to submit my final draft, so my advisor told me to do what I could and what I felt was most useful.”
Next, in the open-ended question about if and how the candidate would have prepared differently in hindsight, the n = 4 respondents who reported a negative experience during the defense were all female. Of the n = 7 respondents who would have preferred a different committee interaction, six were female. Negative experiences with the committee were:
“My committee members almost uniformly asked me questions that were not central to my dissertation, for example, about footnotes or asides, and on the whole, I didn’t feel like I was asked to defend my dissertation because I didn’t feel their questions were actually very serious. It was very disappointing. Now, I always tell people to prepare by reviewing their footnotes.”
One of the respondents also pointed out the need for gender balance in committees:
“I had an all male committee, I would have liked gender balance. As a woman, I think being examined by my peers means more than examination by men only.”
Another female respondent also pointed out the importance of insisting on receiving feedback in advance:
“I would have insisted on having feedback from all of the committee members before the defense so there wouldn’t be any surprises. I could have prepared better in advance if I had known all the criticism before, particularly the negative comments.”
Of the n = 10 respondents who in hindsight wished they had had a different mindset towards the defense, only two were men. When analyzing these numbers, it is important to keep in mind that the majority of the respondents to the survey were women, which may skew the numbers of mentions. Regardless, the comments given by female survey respondents are important and should be reflected upon.
Overall, we can conclude that gender plays a role in the perception of the defense as well as the long-term impact of the defense on the candidates. Potential explanations are that female candidates are a minority in academia and perceive their position as such. While gender equality is often achieved at the level of doctoral candidates, much fewer women full professors work at universities than male full professors [50]. Another explanation is that female candidates are more often caught in power struggles between committee members and that research on feminist issues may be faced with resistance by male committee members [21]. Finally, the cultural conditioning of women, which results in speaking in a softer and more searching manner, may be interpreted by committee members as a sign of insecurity and give rise to a negative atmosphere during the defense [5].
4.2.2. Ethnicity
As we can see in Table 2, the majority of respondents self-identify as white. Ethnic groups for which fewer than 10 respondents answered the survey are Black and African American (n = 7), First Nations (n = 1), and mixed (n = 4). As such, the results in this section should be considered as exploratory results, which shine a first light on the doctoral defense experience as a function of ethnicity. As more than two groups are used in this analysis, the statistical test used for this and all following sections is the Kruskal–Wallis test.
Nervousness before the defense is weakly correlated with ethnicity (p = 0.076), as shown in Figure 6. On average, the Latinx respondents report the lowest average level of nervousness before the defense (average = 5.083). The outlier is the one First Nations respondent with a level of nervousness of 1. The highest average level of nervousness before the defense is reported by the respondents of mixed ethnicity (average = 7.5). From the data, I found no correlation to nervousness during the defense or nervousness after the defense but before receiving the outcome and ethnicity.

Figure 6.
Nervousness before the defense on a 0–10 Likert scale, broken down by ethnicity. n = 193, with n = 142 white, n = 7 Black or African American, n = 15 Asian, n = 12 Latinx, n = 1 First Nations, n = 4 mixed, and n = 12 other. The red line in the boxplot indicates the median, and the blue dot indicates the mean value.
Other emotions that are correlated to ethnicity are the enjoyment of the defense (p = 0.0439, Figure 7a) and the perceived seriousness of the defense proceedings (p = 0.0280, Figure 7b). Perceived importance, difficulty, and level of formality were not related to ethnicity. In terms of the enjoyment of the defense, we can see in Figure 7a that the lowest enjoyment is from the n =1 First Nations respondent with a value of 5 on a 0–10 Likert scale. Black and African American respondents also reported lower enjoyment (average = 6.286) as compared to the other groups. The highest enjoyment is reported by those of mixed ethnicity (average = 9.5) and other ethnicity (average = 7.643). When it comes to the perceived seriousness of the defense, we can see in Figure 7b that the lowest perceived seriousness of the defense proceedings is for the white respondents (average = 5.957). For this category of the emotional dimensions of the doctoral defense, there is a marked difference between the experience of the white majority respondents and the perception of the minority ethnic groups. The minority groups all perceived the doctoral defense as a more serious event in which there was less room for humor than the white respondents. The highest seriousness was perceived by the n =1 First Nations respondent (seriousness level of 8) and the Latinx respondents (average = 7.846).

Figure 7.
Affective dimensions of the defense correlated to ethnicity: (a) Enjoyment of the defense proceedings on a 0–10 Likert scale, broken down by ethnicity. n = 194, with n = 141 white, n = 7 Black or African American, n = 15 Asian, n = 12 Latinx, n = 1 First Nations, n = 4 mixed, and n = 14 other, (b) Perceived seriousness of the defense proceedings on a 0–10 Likert scale, broken down by ethnicity. n = 195, with n = 141 white, n = 7 Black or African American, n = 15 Asian, n = 13 Latinx, n = 1 First Nations, n = 4 mixed, and n = 14 other. The red line in the boxplot indicates the median, and the blue dot indicates the mean value.
Finally, the overall value of the doctoral defense as part of the PhD journey is also somewhat correlated (p = 0.0528) to ethnicity; see Figure 8. The overall value is rated lowest by the n =1 First Nations respondent (value = 7) and the white respondents (average = 7.161). The overall value is rate highest by the respondents of mixed ethnicity (average = 9.5) and Latinx respondents (average = 8.692).

Figure 8.
Overall value of the defense as part of the doctoral experience on a 0–10 Likert scale, broken down by ethnicity. n = 197, with n = 143 white, n = 7 Black or African American, n = 15 Asian, n = 13 Latinx, n = 1 First Nations, n = 4 mixed, and n = 14 other. The red line in the boxplot indicates the median, and the blue dot indicates the mean value.
In terms of the results of perceived committee fairness and suitability for making a well-balanced assessment of the doctoral research, Table 5 gives an overview of the results. From these results, we can see that the number of respondents in the non-white groups is too low to capture observations on committee fairness. Only white respondents flagged issues with committee fairness, as the number of white respondents was much larger than the other ethnic categories. Similarly, in terms of suitability of the committee, it is difficult to make conclusions on the experience of candidates from ethnic minorities because of the low number of respondents. A number of respondents in most categories, however, did report that their committee was only suitable to some extent to make a well-balanced assessment of the doctoral work.
Table 5.
Committee fairness and suitability, by ethnicity.
Finally, I explored the long-term impact of the doctoral defense on the perception of the student by ethnicity; see Table 6. When we look at the results of how the defense influenced the respondents’ perception of their academic competence, we see that 40.28% of white respondents were not affected by the defense. This percentage is markedly less in all other ethnic groups, except for the n = 1 First Nations respondent who did not experience an effect of the defense. We can in fact see that all ethnic groups report a larger percentage of respondents who felt that their perception of their academic competence was increased as a result of the defense. On the other hand, the Black or African American respondents and those of the “other” category of ethnicity reported larger percentages of those who felt that the defense decreased their perception of their academic competence.
Table 6.
Long-term impact of defense on student perception, by ethnicity.
In the second category of long-term impact of the defense, I studied how the defense influenced the participants’ desire to continue to work in the sphere of the PhD research. Looking at the results in Table 6 for this question, I do not find marked differences between categories of ethnicity. The one outlier here is the group of Latinx respondents, who report the second to lowest percentage of respondents (23.08%) whose desire to continue to work in the sphere of their PhD research increased as a result of the defense and the largest percentage (30.77%) whose desire to continue to work in the sphere of their PhD research decreased as a result of the defense.
The third long-term aspect of the defense is how the defense influenced the respondents’ desire to continue to work in academia. Here, we find that the white respondents have the lowest percentage (24.31%) of those whose desire to work in academia increased. Similarly, the white respondents have the largest percentage (65.28%) of those whose defense did not affect their desire to work in academia, after the n = 1 First Nations respondent whose desire to work in academia was not affected by the defense. Conversely, two ethnic groups (Latinx with 15.38% and those in the category of other ethnicity with 14.29%) have a larger percentage of respondents whose desire to work in academia decreased as a result of the defense than the white respondents (10.72%).
The final dimension is how the defense influences the respondents’ perception on the publishability of their research. Here, we find that the white respondents report the lowest percentage (38.19%) whose perception on the publishability of their research increased with the defense. The majority (52.78%) of the white respondents did not see their perception of the publishability of their research affected by the defense, which is the second largest percentage after the Asian group (53.33%). What calls my attention as well is that the Black and African American respondents report the largest percentage (28.57%) of those whose perception on the publishability of their research decreased as a result of the PhD defense.
Combining the results from these four categories and observing that ethnicity was not mentioned in the answers to the open-ended questions, we can draw two conclusions. The first conclusion is that more research is necessary on the defense experience of ethnic minority groups. Secondly, in virtually all categories, the white respondents had larger percentages of those who were not affected long-term by the PhD defense, and in three out of four categories, there was a larger percentage of Black and African American and Latinx respondents who had long-term negative consequences of the defense. The former finding indicates that not being affected, positively or negatively, by the defense is potentially a white privilege, and the latter finding calls for further research on the long-term impact of the doctoral defense on Black and African American candidates.
Bringing together all findings from the analysis of these results in the light of ethnicity, I need to repeat that the number of respondents who identify as non-white was quite low in this study. Some worrying signs regarding the impact of ethnicity on the experience during the doctoral defense and the long-term impact of the defense surfaced from the survey data. Therefore, further research on the affective dimension of the doctoral defense in candidates from ethnic minorities is necessary.
4.2.3. Age at the Defense
Overall, when running the statistical tests based on the matrix from Table 1, I found only a weak correlation (p = 0.073) between impact on perceived competence and the age at which the candidate defended their doctorate. For all other categories, no statistical significance was found when subdividing the outcomes into groups of age at the defense. A few of the plots of the results give some insights. In terms of nervousness before, during, and after the defense and before hearing the outcome, Figure 9a shows that the nervousness before the defense on average decreases as the age of the participant increases, with an exception for the <26 years age group. Nervousness during the defense is comparable for all age groups (see Figure 9b) with a small decrease in average nervousness for the participants between 36 and 45. Finally, in terms of nervousness after the defense and before hearing the outcome, no relation to age can be discerned from Figure 9c, as results vary for each age group.

Figure 9.
Nervousness by age group: (a) before the defense, (b) during the defense, and (c) after the defense and before receiving the outcome. n = 193 for before the defense, with n = 5 < 26, n = 75 26–30, n = 61 31–35, n = 26 36–40, n = 11 41–45, n = 8 46–50, n = 7 > 50. n = 190 for during the defense, with n = 5 < 26, n = 74 26–30, n = 59 31–35, n = 26 36–40, n = 11 41–45, n = 8 46–50, n = 7 > 50. n = 168 for after the defense and before knowing the outcome, with n = 5 < 26, n = 66 26–30, n = 52 31–35, n = 21 36–40, n = 10 41–45, n = 7 46–50, n = 7 >50. The red line in the boxplot indicates the median, and the blue dot indicates the mean value.
I also observe some relation, in terms of averages, between age groups and perceived difficulty of the defense; see Figure 10. The respondents from the youngest age groups and oldest age groups seem to perceive their defense as more difficult than those between 26 and 40 years at the time of the defense.

Figure 10.
Perceived difficulty of the defense on a 0–10 Likert scale, broken down by age group. n = 194, with n = 5 < 26, n =77 26–30, n = 61 31–35, n = 26 36–40, n = 10 41–45, n = 8 46–50, n = 7 > 50. The red line in the boxplot indicates the median, and the blue dot indicates the mean value.
The last element for which I observed some relation to age group, is the overall value of the defense as part of the PhD experience, see Figure 11. For this dimension of the defense, the younger and older participants have rated the defense as higher than those between 31 and 45. Again, these categories for which I made observations based on the plots do not all have a statistically significant relation to the age group.
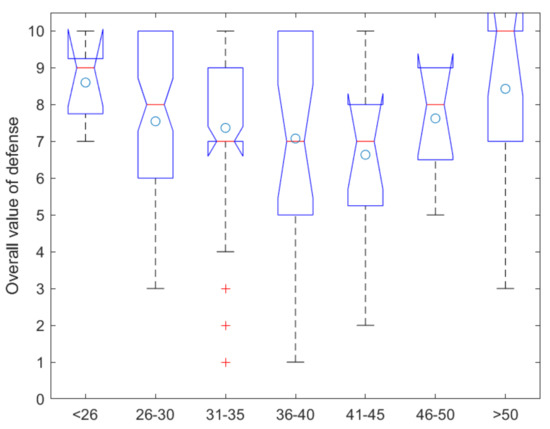
Figure 11.
Overall value of the defense as part of the doctoral experience on a 0–10 Likert scale, broken down by age group. n = 194, with n = 5 < 26, n = 77 26–30, n = 60 31–35, n = 26 36–40, n = 11 41–45, n = 8 46–50, n = 7 > 50. The red line in the boxplot indicates the median, and the blue dot indicates the mean value.
In terms of committee fairness, Table 7 shows that there are only small differences between the age groups. All participants who considered their committee as unfair are in the “36–40 years at the defense” category. Similarly, for the question if the committee was suitable for making a well-balanced assessment, the differences between age categories seem small. The only age categories where the committee was not considered as suitable are in the 31–35 category and the >50 category. The age categories 41–45 and >50 have the lowest percentage of respondents (72.73% for the 41–45 category and 71.43% for the >50 category) who considered their committee suitable for making a well-balanced assessment of the candidates’ work.
Table 7.
Committee fairness and suitability, by age at the defense.
Looking at the long-term impact of the defense on student perception as a function of age at the defense, Table 8 shows the results. In terms of receiving a boost in perceived academic competence, we can see that the youngest (<26) and older (>46) age groups had the largest percentages of respondents who reported an increase in perception of their academic competence thanks to the defense. At the same time, the age groups 26–30 (12.99%), 46–50 (12.50%), and >50 (14.29%) had the largest percentages of participants reporting a decrease in their perceived academic competence.
Table 8.
Long-term impact of defense on student perception, by age at the defense.
For all age groups except the group of respondents >50, the desire to continue to work in the sphere of the PhD research was not affected by the defense for the majority of the respondents. The 36–40 age group (42.31%) and the >50 age group (42.86%) reported the largest percentages of respondents for whom the defense increased the desire to work in the sphere of the PhD research. The 41–45 age group had the largest percentage of respondents (18.18%) for whom the desire to continue to work in the sphere of the PhD research decreased as a result of the defense.
For all age groups except the respondents >50, the desire to work in academia was not affected by the defense for the majority of the respondents. The youngest respondents (<26) had the largest percentage (40%) of respondents whose desire to work in academia increased as a result of the defense. Conversely, the oldest respondents (>50) had the largest percentage (28.57%) of respondents whose desire to work in academia decreased as a result of the defense.
Finally, in terms of perception of publishability of work, the majority of the younger respondents (<40) did not find an effect as a result of the defense. The largest percentage of respondents who experienced an increased perception of publishability of their research are in the 46–50 age group (50%), and the group for which the largest percentage (28.57%) of respondents perceived a decrease in the publishability of their work is the >50 age group.
In terms of the open-ended questions, age is mentioned only once as a factor in the final question about if the candidate would have prepared differently for the defense and what they would have done differently:
“No. I was full of 24-year old confidence, bolstered by a desire to show my supervisor that I had been right to take the approach I did…so I was fairly fired-up and self-assured. That sounds terribly puffed-up, but I felt I knew as much as I could about my subject and had reached a really good level of competence.”
Overall, the influence of age on the perception of the doctoral defense is limited. We see some influences for the youngest and oldest participants. For the younger participants, potentially they do not have that much work experience and confidence yet, which results in more nervousness. For the oldest participants, there is potentially much more at stake in their career for them during the defense. Overall, however, the statistical relevance of the relation between defense perception and age groups is virtually nonexistent. Future work could look at the lived experienced of doctoral candidates in different age groups to study this parameter further.
4.2.4. Current Position
To study the relation between current position and student perception of the defense, I recoded the current position into broader categories: academia, industry and business owners, government, other, and unemployed. Then, I explored the correlation to student perception in Matlab and found that none of the categories of student perception were statistically correlated to the current position. However, since the vast majority of survey respondents (76%, see Table 2) are academics, the number of respondents in the other categories are very small, which makes comparisons between different categories more difficult.
Some differences between categories could be observed in the boxplots of the student sentiments. For example, Figure 12 shows a slightly smaller mean and median value for perceived seriousness of the defense proceedings for those candidates who currently work in academia (average = 6.3179 and median = 6) and for those who work for the government (average = 4.875 and median = 5) than for the other categories.

Figure 12.
Perceived seriousness of defense proceedings on a 0–10 Likert scale, broken down by current position. n = 199, with n = 151 in academia, n = 28 in industry or as business owner, n = 8 in government, n = 5 employed otherwise, and n = 7 unemployed. The red line in the boxplot indicates the median, and the blue dot indicates the mean value.
When it comes to the overall value of the defense as part of the doctoral journey, Figure 13 shows that the median value on a 0–10 Likert scale is higher for those who are in academia (median = 8) and who are currently unemployed (median = 8) than for the other categories. In terms of averages, the differences are not as pronounced.

Figure 13.
Overall value of the defense as part of the doctoral experience on a 0–10 Likert scale, broken down by current position. n = 201, n = 153 in academia, n = 28 in industry or as business owner, n = 8 in government, n = 5 employed otherwise, and n = 7 unemployed. The red line in the boxplot indicates the median, and the blue dot indicates the mean value.
Breaking down the results of committee fairness and suitability for making a well-balanced assessment of the doctoral research, Table 9 shows the breakdown of the results by current position. We can observe that a larger percentage (25%) of those who are currently in industry or business owners considered their committee fair only to some extent. The largest percentage of those who considered their committee unfair are currently employed in the “other” category.
Table 9.
Committee fairness and suitability, by current position.
In terms of the committee being suitable for making a well-balanced assessment of the doctoral candidate’s work, those employed in the “other” category have a majority (60%) of respondents deeming their committee suitable only to some extent for making a well-balanced assessment. The percentage is also slightly higher (21.43%) for those employed in industry or as business owners than for the other categories. Those who work for the government have the largest percentage (12.5%) of respondents indicating that their committee was not suitable for making a well-balanced assessment. The number of respondents in all categories except for academia is however too low to indicate if committee issues are a reason for respondents to seek employment outside of academia.
Table 10 shows a summary of the answers of respondents on the long-term impact of the doctoral defense on student perception, broken down by current position. Those who are currently unemployed had the largest percentage (85.71%) of respondents who found an increase in perception of academic competence as a result of the defense. For those employed in the “other” category, the majority (60%) of respondents did not find that the defense affected their perception of their academic competence. Those currently working in industry or as a business owner had the highest percentage (14.29%) of respondents whose perception of their academic competence decreased after the defense.
Table 10.
Long-term impact of defense on student perception, by current position.
When it comes to the respondents’ desire to continue to work in the sphere of the PhD defense as influenced by their defense, we find that the majority of those in the “other” category (60%) and those currently unemployed (57.14%) find an increase in their desire. For those working in industry or as a business owner and in government, three quarters (75%) of respondents did not find this desire affected by the defense. Those who work for the government also had the largest percentage (12.5%) of respondents whose desire to work in the sphere of their PhD decreased as a result of the defense.
Perhaps surprisingly, when looking at the results of the desire to work in academia, the academics are not the ones who received the largest boost from the defense. Those in the “other” field (40%) and those currently unemployed (57.14%) have a larger percentage of respondents reporting an increase in desire to work in academia as a result of the defense than those employed in academia (31.17%). Those employed in industry and as business owners, and in the government had the largest percentages (71.43% and 75%) of respondents whose desire was not affected by the defense. What may be a logical result is that all categories except for those currently unemployed had a larger percentage of respondents whose desire to work in academia decreased as a result of the defense (17.86% for industry and business owners, 25% for those employed by the government, and 20% for those in the “other” category) than those currently employed in academia (7.14%)
In terms of the perception of the publishability of the work, those currently unemployed had the largest percentage of respondents reporting an increase in perceived publishability (57.14%). For those currently employed in industry and as a business owner, the majority (71.43%) of the respondents did not find an effect of the defense on their perception of the publishability of their work. The largest percentages of respondents who found a decrease in the perception of publishability of their work were in academia (9.74%), in industry and as business owners (7.14%), and in the government (12.5%).
Since the statistical relevance of the results is limited, drawing conclusions on the impact of the defense for those who are currently employed in different sectors can be a large step. There are some indications from these results that those who are currently in industry or a business owner and in the government have had more negative experiences with their committee and have observed no effect or a negative effect of the defense on their long-term perception of the defense than those in academia. Their experience could have been a factor in the decision to pursue a career outside of academia. However, the number of participants from outside of academia to this research was limited, so that drawing strong conclusions is not possible. At the same time, to understand the decisions that lie behind career choices after the defense, further research based on interviews is necessary.
Overall, there is no statistical relation between the current position of the participants and the perception of the student about the doctoral defense, and the topic does also not surface from the qualitative analysis of the open-ended questions. This dimension is thus not important for the way students perceive their defense. There can be two reasons for this: (1) career choices are influenced by a large number of factors, and the role of the defense in these decisions may be minor; and (2) a future career choice may not be obvious during the defense and is not an inherent property of a person at the moment of the defense (such as gender or ethnicity) which can influence the behavior of the committee members and the affective level of the doctoral candidate in the moment of the defense.
4.2.5. Field of Study
The last category to link to the students’ perception is their field of study. I already looked at these results in [27] as I used this aspect to break down the survey results. However, at that time, I looked mostly at field of study in relation to defense format, to identify differences between fields in terms of format. I did not further correlate the results to the students’ perception. Therefore, I have taken field of study as a factor to analyze here as well in relation to the affective dimension of the defense.
The first observation of running the code to find correlations between the dimensions of students’ perception from Table 1 and the field of study is that several dimensions show a correlation or a weak correlation to the field of study. The field of study is thus an important factor to explore.
There is a weak correlation between field of study and nervousness during the defense (p = 0.0817) and after the defense, before receiving the outcome (p = 0.0871), but not for nervousness before the defense (p = 0.6278). During the defense, respondents from the humanities and arts had on average (average = 5.9643 on a 0–10 Likert scale) the highest level of nervousness and those in STEM had the lowest average (average = 4.3684) nervousness. After the defense, and while waiting for the outcome, those in humanities and arts also experience the highest level of nervousness on average (average = 5.3600), and those in the life sciences reported the lowest average nervousness (average = 3.4167).
I found a statistically relevant relation between the enjoyment of the candidate during the defense and the field of study (p = 0.0356); see Figure 14. Participants from STEM had the highest average enjoyment (average = 7.4643), whereas those in multidisciplinary fields had the lowest enjoyment (average = 5.4444). The boxplot of Figure 14 also shows that participants from STEM fields have a small range (between 7 and 9 on a 0–10 Likert scale for the results between the lower and upper quartile of respondents) of indicated values.

Figure 14.
Enjoyment of defense on a 0–10 Likert scale, broken down by field of study. n = 196, with n = 45 in life sciences, n = 27 in humanities and arts, n = 59 in social sciences, n = 56 in STEM, and n = 9 in multidisciplinary fields. The red line in the boxplot indicates the median, and the blue dot indicates the mean value.
Emotional levels of the defense that are not related to the field of study are the perceived importance of the defense and the seriousness of the defense proceedings. On the other hand, there is a weak statistical relevance (p = 0.0769) for the difficulty of the defense. Those in humanities and arts on average perceived their defense as the most difficult (average = 6.7407), whereas those in social sciences perceived their defense as the least difficult (average = 5.433). The perceived formality of the defense is related to the field of study (p = 0.0101); see Figure 15. The perceived formality is lowest in terms of median and average for the respondents in humanities and arts (median = 6, average = 6.0471) and social sciences (median = 6, average = 5.5763). For respondents from STEM (median = 7.5 and average = 7.1897) and the multidisciplinary fields (median = 7 and average = 7.222), the perceived formality is higher.

Figure 15.
Perceived formality of defense on a 0–10 Likert scale, broken down by field of study. n = 198, with n = 46 in life sciences, n = 26 in humanities and arts, n = 59 in social sciences, n = 58 in STEM, and n = 9 in multidisciplinary fields. The red line in the boxplot indicates the median, and the blue dot indicates the mean value.
Finally, the overall value of the defense as part of the doctoral experience is related (p = 0.0024) to the field of study. As we can see in Figure 16, participants from the life sciences rate the experience highest (median = 8, average = 8.1522), and those in the multidisciplinary fields rate the defense lowest (median = average = 6).

Figure 16.
Overall value of the defense as part of the doctoral journey on a 0–10 Likert scale, broken down by field of study. n = 199, with n = 46 in life sciences, n = 27 in humanities and arts, n = 60 in social sciences, n = 57 in STEM, and n = 9 in multidisciplinary fields. The red line in the boxplot indicates the median, and the blue dot indicates the mean value.
In terms of committee fairness and suitability of the committee for making a well-balanced assessment of the candidate, I found a statistically relevant relation to the field of study for committee fairness (p = 0.0381) and a weak relevance for suitability of the committee (p = 0.0678). The results of these questions are represented in Table 11. For those in STEM, we have the largest percentage (89.47%) of respondents who consider their committee fair, which is in contrast to the results from the humanities and arts, where only about two thirds of respondents (64.29%) considered their committee fair. For the multidisciplinary researchers, we find that a third (33.33%) consider their committee fair to only some extent, whereas this number is only a tenth (10.53%) in STEM. The field with the largest percentage of participants (3.57%) identifying their committee as unfair is the field of the humanities and arts.
Table 11.
Committee fairness and suitability, by field of study.
For the results regarding the suitability of the committee for making a well-balanced assessment of the candidate in Table 11 the observations are largely similar as to those of committee fairness. What called my attention, however, is that less than half (44.44%) of all participants from the multidisciplinary fields considered their committee as suitable for making a well-balanced assessment, and that more than half (55.56%) of them considered their committee suitable to only some extent for making a well-balanced assessment. In the humanities and arts, two thirds (67.86%) of respondents considered their committee suitable for making a well-balanced assessment, which is in contrast with 84.48% of the participants in STEM. Similarly, a third (32.14%) of respondents in the humanities and arts considered their committee suitable for making a well-balanced assessment only to some extent, whereas this number was lower (13.33%) in the social sciences. Finally, only in the life sciences (2.17% of respondents) and social sciences (3.33% of respondents), a small number of respondents indicated that their committee was not suitable for making a well-balanced assessment of their work.
In terms of the long-term impact of the doctoral defense on student perception for candidates from different fields, we can see that in STEM, the largest percentage (70.69%) of participants report that the defense increased their perception of their academic competence, while in the multidisciplinary fields, only 22.22% of the respondents perceived an increase. For those in multidisciplinary fields, two thirds (66.67%) of respondents did not find any influence of the defense on their perception of their academic competence, while in STEM, this percentage is lowest (22.41%). For the participants from the humanities and arts, we can observe the largest percentage (25%) of participants who experienced a decrease in their perception of their academic competence as a result of the defense, as compared to only 5% of participants in the social sciences.
When it comes to the influence of the defense on the participants’ desire to continue to work in the sphere of their PhD research, we can observe that the field with the largest percentage (39.29%) who found an increase in this desire is the humanities and arts, compared to the lowest percentage (22.22%) of those in multidisciplinary fields. In the social sciences, the largest percentage of participants (73.33%) report that the defense did not influence their desire to continue to work in the sphere of their PhD, whereas this percentages is lowest for those in the humanities and arts (39.29%). Finally, the largest percentage of participants who found a decrease in the desire to work in the sphere of their PhD research are those in the multidisciplinary fields (22.22%) and the lowest in social sciences (1.67%).
In terms of the influence of the defense on the desire to work in academia, we can see that participants in STEM reported the largest percentage (37.93%) with an increased desire to work in academia as compared to those in the multidisciplinary fields who had the lowest percentage (11.11%). Those in the multidisciplinary fields are mostly not affected (88.89%) in their desire to work in academia, and this percentage is lowest for those in the humanities and arts (46.43%). Finally, in the humanities and arts, we find the largest percentage (28.57%) of those whose desire to work in academia decreased as a result of the defense, as compared to the social sciences (3.33%) and multidisciplinary fields (0%) which have the lowest percentages.
The influence of the defense on the students’ perception on the publishability of their work also differs slightly between fields of study. Half (50%) of the respondents from the social sciences experienced a boost, as compared to only 22.22% of the respondents from the multidisciplinary fields. The field that had the largest percentage of respondents not being affected by the defense in terms of perception of publishability is STEM (62.07%), and the lowest percentage is in the humanities and arts (39.29%). Finally, the largest percentage of respondents for whom the perception of the publishability of their work decreased as a result of the defense is in the humanities and arts (28.57%), compared to only 3.33% of respondents in the social sciences and 1.72% of respondents in STEM.
Looking at the results from Table 11 and Table 12, we can see that students in the multidisciplinary fields and in humanities and arts have the least positive experiences with their committee and the largest long-term negative effects on their perceptions. On the other hand, participants from STEM seem to have the most positive experiences with their committee and in terms of the long-term impact. Potential reasons for these observations are: (1) the nature of research in multidisciplinary fields makes it such that all research-related disciplines should be reflected in the committee composition, and (2) the nature of research in STEM potentially makes discussion on publishability less of an issue when experiments are carried out according to standard lab protocols, whereas there may be more discussion on criteria and methods in the humanities and arts.
Table 12.
Long-term impact of defense on student perception, by field of study.
For those who reported a negative experience during the doctoral defense in the last open-ended question, two participants were from the humanities and arts, one from the social sciences, and one participant from the life sciences indicated she would have done “Everything [differently] from the beginning”. Those who reported issues in terms of committee interaction were from the social sciences (2), life sciences (1), humanities and arts (2), and multidisciplinary (1). None of the respondents who mentioned negative experiences were from STEM fields.
The overall conclusion on these results is that the field of study matters for student perception. In general, those in STEM fields and in the life sciences seem to have a more positive experience during the defense, a more positive relation with their committee, and better long-term effects of the defense. Contrarily, those in multidisciplinary fields and those in humanities and arts have more negative experiences, report more issues with their committee, and have more negative long-term impacts of the defense. I have speculated about the reasons in this section, but more research would be necessary to find the true reasons for the differences in experiences per field. To find the in-depth background to these observations, interviews are necessary.
5. Discussion
Since this work looks at the relation between several sociodemographic factors and the perception of the doctoral defense for the first time in an international context, a direct comparison with previous studies is not possible. This work in particular looked at the differences in student perception of the doctoral defense and long-term impact of the defense by gender, ethnicity, age at the time of the defense, current position, and field of study. Previous research focused only on general aspects of culture, as well as the gendered and affective dimensions of the doctoral defense.
As identified in previous research [5,8,32,33,34], gender plays an important role during the assessment of doctoral candidates. Crossouard [5] pointed out that not only the gender of those involved in the doctoral defense plays a role, but that in academia, masculine hierarchies are perpetuated in the defense. I was inspired by the work of Crossouard [5] to carry out this study, and found a strong effect of gender in the international context of the study I carried out. Overall, female candidates have a more negative perception of their doctoral defense and experience higher levels of nervousness, report percentage-wise more issues with their committee, and have more negative long-term impacts of their defense. Potential explanations for this observation are the following: the minority status of women in academia [51,52,53,54], the gender imbalance in doctoral committees [34], and hostility against certain fields, such as feminist scholarship [55].
The relationship between the ethnicity of the doctoral candidate and the affective dimension had not been studied before, according to my search of the literature. As such, an important finding of this work is that ethnicity matters for the affective dimension of the doctoral defense, albeit not as much as gender. The main caveat here is that the participation of non-white respondents was limited, such that the influence of ethnicity studied in this work is only preliminary.
For the age of the candidate at the defense, there seems to be barely any effect on the affective dimension, except for the youngest and oldest groups, although these observations only result from the descriptive statistics and boxplots and not from the performed statistical test (Kruskal–Wallis). I only looked at the relation between the age at the defense and the students’ perceptions, and not the reason why they defended at a certain stage in their life. For example, a topic that may require further exploration is the observation that a percentage-wise larger amount of those who defended at a later age are women. A potential explanation here is that these women returned to their studies later in life, after raising children, but the data about these reasons are not included in this study and would require additional research.
The intersectionality of the sociodemographic characteristics should be studied as well [56,57]. In particular, the experiences of women from ethnic minorities should be further studied [58,59], and other dimensions which were not included in this study should be addressed, such as queer experiences [60], the effect of ableism, the influence of social class [61,62], and migratory background [54,63,64].
I found no relation between students’ perception of the doctoral defense and their current position. On the other hand, I found that the field of study matters for the emotional dimension of the defense, and that those in STEM and life sciences have better experiences, less committee issues, and better long-term impacts of the defense than those in social sciences, multidisciplinary fields, and humanities and arts. The only study I can relate these findings to is the survey of Ryder [35,36,37,38,39], who found that more candidates in humanities and arts and social sciences receive major revisions on their thesis as compared to those in science and engineering fields.
Further research can be recommended for a number of topics, as this work presents the first findings on the affective dimension and the experience of doctoral students during the defense in relation to the sociodemographic characteristics of the participants. The first topic deals with finding the reasons why women experience the defense more negatively than men as well as finding potential ways to avoid discriminatory acts by committee members. The second topic that merits more research is the influence of ethnicity on the affective dimension of the doctoral defense, as almost three quarters of the participants in the current study self-identified as white, and the results indicate in some aspects percentage-wise more negative long-term consequences of the doctoral defense for Black and African American and Latinx candidates. As such, a more in-depth study of the lived experiences of ethnic minorities during the doctoral defense and the long-term impact is necessary.
The third topic that requires further research is the age at the defense of the candidate. This research indicates that this parameter is barely statistically correlated to the affective dimension of the doctoral defense but that the youngest and oldest participants potentially have differences in their perception. Here, it would be important to evaluate the influence of the defense on the further career trajectory for the oldest participants, and how the break from their previous career influenced their perception of the defense. It would also be interesting to see if the youngest candidates graduated at a young age because they had entered university exceptionally young, and/or finished their PhD faster than average, and what this young age did to their confidence. A fourth topic that requires further study is the relation between the affective dimension of the defense and the career choices that come afterwards, as from this work it appears that there is no relation between current position and experience during the defense. Finally, research is necessary to unearth the differences between fields of study when it comes to students’ perception and the reasons why those in STEM fields and life sciences tend to report more positive experiences than those in the humanities and arts, social sciences, and multidisciplinary fields.
The value of this work lies in exploring the aspects that influence the affective dimension at the defense. Doctoral candidates can read this work to be aware of how their experience during the defense may be a function of their sociodemographic characteristics. Supervisors can read this work to get a better understanding of the emotional level their candidates experience during the defense. Since committee members tend to examine in the way they were examined as a candidate, sometimes refined by observing other committee members, this work can help committee members become more aware of the emotional dimensions involved for minorities. Finally, university administrators can read this work and reflect on its implications for their body of doctoral candidates, potentially conducting surveys on the particular situation in their institution.
6. Conclusions
In this exploratory article, I link sociodemographic aspects of the participants of an international survey to their perception of the defense: emotions before and during the defense, fairness of the committee and its suitability for making a well-balanced assessment of the research of the candidate, and long-term impact of the defense in terms of perception of publishability, desire to continue work in the sphere of the PhD research, desire to work in academia, and perception of academic competence. From these analyses, I drew the following conclusions:
- There is a strong relation between gender of doctoral candidates and their perception of the defense, long-term perception, and committee issues, with female candidates having more negative perceptions of the defense, as well as long-term negative perceptions, and reporting more issues with their committee.
- There is an effect of ethnicity on perception as well. In particular, Black and African American and Latinx participants report percentage-wise larger negative impacts for some dimensions of long-term impact of the defense which require attention.
- The age of the candidate at the defense generally does not influence the affective dimension of the defense. There are some deviations for those in the youngest and oldest age groups that may require further study.
- There is no relation between a respondent’s current position and how they experienced their defense, nor any long-term influence of the defense.
- There are large and statistically relevant differences in students’ perception as a function of their field of study. In particular, those in STEM fields and the life sciences have more positive experiences than those in the social sciences, multidisciplinary fields, and humanities and arts.
My previous research on the relation between the doctoral defense format and students’ perception identified that a student’s feelings before, during, and after the defense are vastly subjective and personal. This work, however, identified aspects of students’ sociodemographics that make it more likely for them to have a negative experience during the defense. As such, raising awareness about these influences on the affective level of the defense and working towards a more diverse, equitable, and inclusive academia are expected to have a positive effect on all those involved in doctoral defenses and, in particular, the doctoral candidates.
Supplementary Materials
The following are available online at https://www.mdpi.com/article/10.3390/educsci11090463/s1.
Funding
This research received no external funding.
Institutional Review Board Statement
Ethical review and approval were waived for this study, due to study with data collection with anonymized participants and adult population. Case 2019-139IN Universidad San Francisco de Quito.
Informed Consent Statement
Informed consent was obtained from all subjects involved in the study.
Data Availability Statement
The dataset generated by this research is available in the public domain: https://doi.org/10.5281/zenodo.5045412, uploaded on 30 June 2021.
Acknowledgments
I would like to thank the participants who responded to my questionnaire about doctoral defense formats.
Conflicts of Interest
The author declares no conflict of interest.
References
- Remenyi, D. Never smile at a crocodile: A bad viva voce by the rule book. Electron. J. Bus. Res. Methods 2019, 17, 67–73. [Google Scholar] [CrossRef]
- Davis, G.; Engward, H. In defence of the viva voce: Eighteen candidates’ voices. Nurse Educ. Today 2018, 65, 30–35. [Google Scholar] [CrossRef] [PubMed]
- Manidis, M.; Addo, R. Learning a practice through practise: Presenting knowledge in doctoral spoken presentations. Stud. Contin. Educ. 2017, 39, 235–250. [Google Scholar] [CrossRef]
- Doloriert, C.; Sambrook, S. Accommodating an autoethnographic phd: The tale of the thesis, the viva voce, and the traditional business school. J. Contemp. Ethnogr. 2011, 40, 582–615. [Google Scholar] [CrossRef]
- Crossouard, B. The doctoral viva voce as a cultural practice: The gendered production of academic subjects. Gend. Educ. 2011, 23, 313–329. [Google Scholar] [CrossRef]
- Wellington, J. Supporting students′ preparation for the viva: Their pre-conceptions and implications for practice. Teach. High. Educ. 2010, 15, 71–84. [Google Scholar] [CrossRef]
- Markulis, P.M.; Strang, D.R. Viva voce: Oral exams as a teaching & learning experience. Dev. Bus. Simul. Exp. Learn. 2008, 35, 118–127. [Google Scholar]
- Morley, L.; Leonard, D.; David, M. Quality and equality in british phd assessment. Qual. Assur. Educ. 2003, 11, 64–72. [Google Scholar] [CrossRef]
- Golding, C.; Sharmini, S.; Lazarovitch, A. What examiners do: What thesis students should know. Assess. Eval. High. Educ. 2014, 39, 563–576. [Google Scholar] [CrossRef]
- Carter, S. English as an additional language (eal) viva voce: The eal doctoral oral examination experience. Assess. Eval. High. Educ. 2012, 37, 273–284. [Google Scholar] [CrossRef]
- LERU. Doctoral Studies in Europe: Excellence in Researcher Taining. Available online: https://www.google.com.hk/url?sa=t&rct=j&q=&esrc=s&source=web&cd=&ved=2ahUKEwigg8Dh28byAhUJ-WEKHVfhAIYQFnoECAYQAQ&url=https%3A%2F%2Fwww.leru.org%2Ffiles%2FDoctoral-Studies-in-Europe-Excellence-in-Researcher-Training-Full-paper.pdf&usg=AOvVaw2J4a9SHQNqus2rEA_sARUt (accessed on 10 May 2007).
- Barnett, J.V.; Harris, R.A.; Mulvany, M.J. A comparison of best practices for doctoral training in europe and north America. FEBS Open Bio. 2017, 7, 1444–1452. [Google Scholar] [CrossRef] [PubMed]
- Mewburn, I.; Cuthbert, D.; Tokareva, E. Experiencing the progress report: An analysis of gender and administration in doctoral candidature. J. High. Educ. Policy Manag. 2014, 36, 155–171. [Google Scholar] [CrossRef]
- Pitskhelauri, N.; Chikhladze, N.; Tsiskaridze, A. New paradigm of phd education at tbilisi state university faculty of medicine in georgia. Turk. J. Biochem. 2011, 36, 82–86. [Google Scholar]
- Petkova, D. Phd education in bulgaria. Turk. J. Biochem. 2011, 36, 45–48. [Google Scholar]
- Van der Ploeg, I. Quality assurance in doctoral education experiences from karolinska institutet. Turk. J. Biochem. 2011, 36, 67–68. [Google Scholar]
- Goulding, N.J.; Geraghty, A. Standards for phd education in pharmacology in the UK. Turk. J. Biochem. 2011, 36, 19–25. [Google Scholar]
- Gurevich, K.G.; Yushuk, N.D. System of research staff training in russian federation. Turk. J. Biochem. 2011, 36, 31–34. [Google Scholar]
- Haque, A. Current status of phd education in biomedicine and health sciences in pakistan. Turk. J. Biochem. 2011, 36, 42–44. [Google Scholar]
- Kyvik, S. Assessment procedures of norwegian phd theses as viewed by examiners from the USA, the UK and Sweden. Assess Eval. High. Educ. 2014, 39, 140–153. [Google Scholar] [CrossRef]
- Sikes, P. And then he threatened to kill himself: Nightmare viva stories as opportunities for learning. Qual. Res. J. 2017, 17, 230–242. [Google Scholar] [CrossRef]
- Clarke, G. Developments in doctoral assessment in the UK. In Criticla Issues Ni Higher Education; Kompf, M., Denicolo, P.M., Eds.; Sense Publisheres: Rotterdam, The Netherlands, 2013; pp. 23–36. [Google Scholar]
- Vaccari, D.; Thangam, S. A proposed doctoral assessment procedure and rubric for science and engineering. In Proceedings of the 2010 Annual Conference & Exposition of the American Society for Engineering Education, Louisville, Kentucky, 20 June 2010. ASEE Conferences, 2010. [Google Scholar]
- Jackson, C.; Tinkler, P. Back to basics: A consideration of the purposes of the phd viva. Assess. Eval. High. Educ. 2001, 26, 355–366. [Google Scholar] [CrossRef]
- Tinkler, P.; Jackson, C. Examining the doctorate: Institutional policy and the phd examination process in britain. Stud. High. Educ. 2000, 25, 167–180. [Google Scholar] [CrossRef]
- Eggleston, J.F.; Delamont, S. Supervision of Students for Research Degrees with a Special Reference to Educational Studies; British Educational Research Association: London, UK, 1983. [Google Scholar]
- Lantsoght, E.O.L. Students’ perception of doctoral defense formats. Educ. Sci. 2021. in review. [Google Scholar]
- Trafford, V.; Leshem, S. Anatomy of a doctoral viva. J. Grad. Educ. 2002, 3, 33–40. [Google Scholar]
- Clarke, G.; Lunt, I. The concept of ‘originality’ in the Ph.D.: How is it interpreted by examiners? Assess. Eval. High. Educ. 2014, 39, 803–820. [Google Scholar] [CrossRef]
- Izadi, A. Culture-generality and culture-specificity of face: Insights from argumentative talk in iranian dissertation defenses. Pragmat. Soc. 2017, 8, 208–230. [Google Scholar] [CrossRef]
- Degtyareva, O.; Lantsoght, E.O.L. Planning and Passing Your Phd Defence-A Global Toolbox for Success; Routledget: London, UK, 2021. [Google Scholar]
- Watts, J.H. Preparing doctoral candidates for the viva: Issues for students and supervisors. J. Furth. High. Educ. 2012, 36, 371–381. [Google Scholar] [CrossRef][Green Version]
- Gallego-Morón, N. Breaking the glass ceiling-the doctoral thesis defence as a key turning point. Métode Sci. Stud. J. 2017, 7, 113–119. [Google Scholar]
- Villarroya, A.; Barrios, M.; Borrego, A.; Frías, A. Phd theses in spain: A gender study covering the years 1990–2004. Scientometrics 2008, 77, 469–483. [Google Scholar] [CrossRef]
- Ryder, N. Viva Experience Research, Part 1: Background. Available online: http://www.nathanryder.co.uk/2014/10/viva-research-part-1/ (accessed on 6 October 2014).
- Ryder, N. Viva Experience Research, Part 2: Some Statistics. Available online: http://www.nathanryder.co.uk/2014/10/viva-research-part-2/ (accessed on 7 October 2014).
- Ryder, N. Viva Experience Research, Part 3: Forming an Outline. Available online: http://www.nathanryder.co.uk/2014/10/viva-research-part-3/ (accessed on 8 October 2014).
- Ryder, N. Viva Experience Research, Part 4: What People Say. Available online: http://www.nathanryder.co.uk/2014/10/viva-research-part-4/ (accessed on 9 October 2014).
- Ryder, N. Viva Experience Research, Part 5: Drawing Threads Together. Available online: http://www.nathanryder.co.uk/2014/10/viva-research-part-5/ (accessed on 10 October 2014).
- Inckle, K. Debilitating times: Compulsory ablebodiedness and white privilege in theory and practice. Fem. Rev. 2015, 111, 42–58. [Google Scholar] [CrossRef]
- Walker, L.; Sin, I.; Macinnis-Ng, C.; Hannah, K.; McAllister, T. Where to from here? Women remain absent from senior academic positions at aotearoa new zealand’s universities. Educ. Sci. 2020, 10, 152. [Google Scholar] [CrossRef]
- Leung, S.O. A comparison of psychometric properties and normality in 4-, 5-, 6-, and 11-point likert scales. J. Soc. Serv. Res. 2011, 37, 412–421. [Google Scholar] [CrossRef]
- Share, M. The phd viva: A space for academic development. Int. J. Acad. Dev. 2016, 21, 178–193. [Google Scholar] [CrossRef]
- Huppatz, K.; Sang, K.; Napier, J. ‘If you put pressure on yourself to produce then that’s your responsibility’: Mothers’ experiences of maternity leave and flexible work in the neoliberal university. Gend. Work Organ. 2019, 26, 772–788. [Google Scholar] [CrossRef]
- Jamieson, S. Likert scales: How to (ab)use them. Med. Educ. 2004, 38, 1217–1218. [Google Scholar] [CrossRef] [PubMed]
- Kilty, T.J.; Burrows, A.C. Secondary science preservice teachers’ perceptions of engineering: A learner analysis. Educ. Sci. 2019, 9, 29. [Google Scholar] [CrossRef]
- Braun, V.; Clarke, V. Using thematic analysis in psychology. Qual. Res. Psychol. 2006, 3, 77–101. [Google Scholar] [CrossRef]
- Lofland, J.; Snow, D.A.; Anderson, L.; Lofland, L.H. Analyzing Social Settings: A Guide to Qualitative Observation and Analysis; Wadsworth: Belmont, CA, USA, 2006. [Google Scholar]
- Lantsoght, E.O.L. Dataset Doctoral Defenses and Defense Formats; Zenodo: Genève, Switzerland, 2021. [Google Scholar] [CrossRef]
- Van den Brink, M.; Benschop, Y. Slaying the seven-headed dragon: The quest for gender change in academia. Gend. Work Organ. 2012, 19, 71–92. [Google Scholar] [CrossRef]
- O’Laughlin, E.M.; Bischoff, L.G. Balancing parenthood and academia: Work/family stress as influenced by gender and tenure status. J. Fam. Issues 2005, 26, 79–106. [Google Scholar] [CrossRef]
- Bodkin, C.P.; Fleming, C.J. Supporting women scholars’ paths to academia: An examination of family-friendly policies of public affairs doctoral programs. J. Public Aff. Educ. 2019, 1–25. [Google Scholar] [CrossRef]
- Small, J.; Harris, C.; Wilson, E.; Ateljevic, I. Voices of women: A memory-work reflection on work-life dis/harmony in tourism academia. J. Hosp. Leis. Sport Tour. Educ. 2011, 10, 23–36. [Google Scholar] [CrossRef]
- Lendák-Kabók, K. Women’s work–life balance strategies in academia. J. Fam. Stud. 2020. [Google Scholar] [CrossRef]
- Morley, L.; Leonard, D.; David, M. Variations in vivas: Quality and equality in british phd assessments. Stud. High. Educ. 2002, 27, 263–273. [Google Scholar] [CrossRef]
- Stanfors, M. Family life on the fast track? Gender and work–family trade offs among highly educated professionals: A cross-cultural exploration. In Gender and the Work-Family Experience: An Intersection of Two Domains; Mills, M.J., Ed.; Springer: Cham, Switzerland, 2015; pp. 329–350. [Google Scholar]
- Duffy, A. Identities, academic cultures, and relationship intersections: Postsecondary dance educators’ lived experiences pursuing tenure. Res. Dance Educ. 2020, 21, 188–208. [Google Scholar] [CrossRef]
- Kachchaf, R.; Hodari, A.; Ko, L.; Ong, M. Career-life balance for women of color: Experiences in science and engineering academia. J. Divers. High. Educ. 2015, 8, 175–191. [Google Scholar] [CrossRef]
- Novich, M.; Garcia-Hallett, J. Strategies for balance: Examining how parents of color navigate work and life in the academy. In The Work-Family Interface: Spillover, Complications, and Challenges; Blair, S.L., Obradović, J., Eds.; Contemporary perspectives in family research; Emerald Publishing: Bingley, UK, 2018; Volume 13, pp. 157–184. [Google Scholar]
- Burford, J. Not writing, and giving ‘zero-f**ks’ about it: Queer(y)ing doctoral ‘failure’. Discourse Stud. Cult. Politics Educ. 2017, 38, 473–484. [Google Scholar] [CrossRef]
- Ward, K.; Fagan, C.; McDowell, L.; Perrons, D.; Ray, K. Class transformation and work-life balance in urban britain: The case of manchester. Stud. Urban 2010, 47, 2259–2278. [Google Scholar] [CrossRef]
- Armstrong, J. Beyond ‘juggling’ and ‘flexibility’: Classed and gendered experiences of combining employment and motherhood. Sociol. Res. Online 2006, 11, 119–134. [Google Scholar] [CrossRef]
- Antoshchuk, I.A.; Gewinner, I. Still a superwoman? How female academics from the former soviet union negotiate work-family balance abroad. Monit. Obshchestvennogo Mneniya Ekonomicheskie I Sotsial’nye Peremeny 2020, 155, 408–435. [Google Scholar] [CrossRef]
- Gewinner, I. Work–life balance for native and migrant scholars in german academia: Meanings and practices. Equal. Div. Incl. 2019, 39, 497–512. [Google Scholar] [CrossRef]


Publisher’s Note: MDPI stays neutral with regard to jurisdictional claims in published maps and institutional affiliations. |
© 2021 by the author. Licensee MDPI, Basel, Switzerland. This article is an open access article distributed under the terms and conditions of the Creative Commons Attribution (CC BY) license (https://creativecommons.org/licenses/by/4.0/).