Abstract
Higher education (HE) funding mechanisms in the European Union (EU) are undergoing substantial reform, with universities facing increasing pressure to improve performance outcomes under constrained public budgets. This study analyses how the design of HE funding mechanisms—specifically, the logic of resource allocation and the principles of performance evaluation, together with the volume of public investment, macroeconomic conditions, and demographic factors—affect graduation rates in the EU. The study uses panel data from 27 EU Member States for the period 2013–2023 and applies multiple regression models with one- to four-year lags to assess the delayed effects of funding and economic factors. The results showed that a larger share of young people in the population and public expenditure per student are positively and statistically significantly associated with higher graduation rates (p < 0.01). Meanwhile, the overall level of funding (HE expenditure as a share of GDP) and performance-based funding (PBF) mechanisms are associated with lower graduation rates (p < 0.01). GDP per capita has a negative effect (p < 0.01), indicating that stronger labour market opportunities may reduce the motivation to complete studies. Youth unemployment and inflation proved to be statistically insignificant (p > 0.05). The most substantial effect was found after two years, confirming the delayed but weakening impact of funding and macroeconomic factors on study graduation rates. The study extends previous work by integrating an analysis of funding design and time dimensions at the EU level. The results emphasise that it is not so much the amount of funding that is important for higher education outcomes, but instead how it is funded—therefore, targeted, student-oriented investments and long-term policy consistency are necessary to achieve higher graduation rates.
1. Introduction
Across the EU, governments are searching for funding mechanisms that can improve study outcomes without increasing public expenditure, yet there is little consensus on which models are most effective for supporting HE graduation rates. At the same time, graduation outcomes differ substantially between EU Member States with comparable levels of public investment, suggesting that the amount of funding alone does not account for these variations. This raises a key policy question: whether it is not how much funding is allocated, but how it is allocated and incentivized, that shapes student graduation outcomes.
The logic of HE funding in the EU has been changing rapidly over the last decade. Countries are looking for ways to reconcile the principle of academic autonomy with efficiency and accountability of public funds. One of the most prominent trends is the shift from incentive-based funding to PBF mechanisms, which are increasingly being applied (Rosinger et al., 2023). This direction reflects a broader policy expectation that universities become active agents of socio-economic development, enhancing the quality and accessibility of education, but also poses new challenges in terms of social equity, academic quality, and the maintenance of long-term goals.
Previous research shows that the design of national funding mechanisms shapes institutional incentives and strategic priorities and can have a significant impact on student graduation, employability, and academic output (Kelchen et al., 2023; Yan et al., 2023). On the other hand, the literature also reveals undesirable effects: overly narrow indicators can encourage gaming, widening the gap between stronger and weaker institutions and reducing opportunities for disadvantaged student groups (Burmicky et al., 2024; Ortagus et al., 2020). This dual situation is particularly relevant in the EU context, where countries’ funding traditions, public sector capacities, and social policy priorities differ significantly.
Despite the intense debate on the effectiveness of HE funding, most existing studies focus on contextual factors such as macroeconomic conditions, demographics, and the volume of public investment. However, the design impact of national HE funding mechanisms on graduation rates is often assessed in a fragmented way or ignored altogether. It is therefore still unclear how different funding logics–negotiation-based, formula-based, or mixed mechanisms—in combination with contextual factors affect graduation rates.
Because HE outcomes develop over several years of study, system-level factors such as economic conditions, demographic changes, and higher education funding arrangements do not produce immediate effects on graduation rates. Their impact becomes visible only once students progress through their full study cycle. To reflect this delayed causal mechanism, the present study incorporates time-lagged independent variables, allowing the model to capture changes as they unfold over time rather than assuming instantaneous effects.
This paper aims to fill this gap by systematically assessing how the design and scope of national HE funding mechanisms, together with contextual factors and time lags, are related to graduation rates in the EU-27, using panel data from 2013 to 2023. Such an approach allows assessing not only the scale of investment but also the importance of its design-whether “how funded” may be more important than “how much funded”.
The contribution of this study is twofold. First, it provides comparative EU-wide evidence on whether funding design matters more than funding scale in shaping graduation outcomes. Second, it integrates time-lagged effects into a cross-national model, capturing how policy and economic conditions influence outcomes over full study cycles.
2. Literature Review
2.1. Why Funding Design Matters
The design and allocation logic of national HE funding mechanisms not only determines the volume of funds allocated but also shapes the incentive structures that guide institutional behaviour and study outcomes. Research shows that mechanisms based on clear and transparent criteria can encourage universities to focus on long-term improvements in educational quality, while poorly structured systems may lead to short-term “indicator chasing” and inefficient use of funds (Ehteshamnejad, 2023; Motala et al., 2023).
Public sector funding systems are often explained through principal–agent theory, which highlights the differences in objectives between funders (principals) and universities (agents). When funding criteria are narrowly defined or tied to a limited set of performance indicators, institutions may respond strategically by focusing on increasing measured outputs rather than improving the underlying conditions for learning. Studies show that such strategic behaviour can raise formal performance indicators without producing genuine improvements in academic quality (Marshall & Salter, 2022). This means that the way performance criteria are constructed can influence not only institutional behaviour, but also the effectiveness of funding mechanisms in improving graduation outcomes.
Transparency and equity in funding allocation are therefore important to ensure balanced institutional development. Performance-based funding mechanisms are often justified as promoting fairness and accountability by linking resource allocation to measurable outcomes (Kutto & Erastus, 2025). However, their effectiveness depends on the relevance and stability of the indicators used. If indicators do not meaningfully reflect the processes that support student learning and progression—such as academic support services, quality of teaching, or student engagement—institutions may focus on improving final output measures rather than strengthening the underlying conditions that enable successful completion. In such cases, performance-based funding may reinforce short-term compliance rather than contribute to sustained improvements in student outcomes.
Efficiency and long-term objectives represent another critical dimension. Funding structures oriented towards short-term goals can create pressure to meet immediate targets rather than support sustained academic progress and student engagement. In contrast, clear and stable long-term funding criteria enable universities to plan ahead, invest in student support, and develop learning environments that contribute to student progression and completion (Kutto & Erastus, 2025).
Funding design is not only important for allocating funds, but also for shaping institutional behaviour, enhancing transparency and equity between institutions, and ensuring long-term goals and efficiency. These functions are carried out through the various national HE funding mechanisms, the logic and principles of which vary significantly across Europe. As a result, how these mechanisms are structured can directly influence student progression and completion, making funding design a key determinant of graduation outcomes.
2.2. Comparing National Funding Mechanisms in Europe
The effectiveness of national HE funding mechanisms impacts institutions’ strategic priorities and outcomes. Funding mechanisms in the EU vary from historical allocations to modern PFB systems. Broadly speaking, these funding mechanisms can be divided into three groups: Negotiation-based, Formula-based, and mixed (European Commission & Directorate General for Education, Youth, Sport and Culture, 2023).
Negotiation funding mechanisms are based on direct agreements between the government and institutions, focusing on the specific needs of institutions and the results of projects. This allows for greater flexibility and the ability to tailor funding to individual strategic priorities (Kelchen et al., 2023). Such models promote institutional adaptability and allow universities to implement innovative strategies and respond to local needs (Ehteshamnejad, 2023). However, this flexibility may increase inequalities, particularly where institutions with stronger political connections or bargaining power benefit disproportionately, thereby reinforcing existing inequalities in resource allocation.
Formula-based mechanisms use predefined criteria such as the number of students, research results, or other performance indicators. Such a system is considered transparent and predictable as it allows institutions to plan their finances according to clear parameters (Wang et al., 2023). However, critics point out that an over-reliance on formula-based allocations can entrench existing inequalities: historically weaker institutions receive less funding, thereby increasing financial instability and limiting their strategic options (Motala et al., 2023). The effectiveness of formula-based funding often depends on stakeholder engagement and satisfaction with the indicators set, and a discussion is needed on how these indicators are constructed and used to allocate funding (Liu et al., 2023).
Mixed funding mechanisms seek to combine the advantages of negotiation-based and formula-based funding, thereby addressing the inherent weaknesses of each approach. This flexibility allows for a more subtle allocation of funds, adapting to the changing HE environment, while ensuring a basic level of funding stability through formulae (Chang & Chang, 2024). These models are particularly effective in encouraging innovative practices through targeted funding initiatives, while maintaining broader allocation strategies that ensure institutional sustainability. However, the complexity of managing mixed systems can pose challenges in terms of clarity and administrative burden, which can reduce their overall effectiveness.
Research shows that these mechanisms have a significant impact on institutional behaviour and resource allocation. For example, institutions operating PBF schemes may prioritise easily measurable outcomes such as graduation rates or research output, potentially sidelining learning experiences that are difficult to quantify (Yan et al., 2023). In contrast, negotiated frameworks allow institutions to choose broader strategic priorities that are more closely aligned to specific funding opportunities, rather than focusing uniformly on student outcomes. This can lead to a dual situation where institutions appear to be successful on specific funding indicators but sacrifice other important aspects of study quality. Among these mechanisms, the PBF is gaining increasing attention, and its impact on graduation rates is becoming an important area of analytical debate.
2.3. PFB and Graduation Outcomes
PBF mechanisms in HE are different from traditional methods based on historical data. These models are based on linking the level of funding to the performance of institutions, such as student graduation rates, employment rates, or research output. The advantage of the PBF is that it can be used as a tool to achieve the objectives of public management, budgeting, and policy-making, while not interfering with the internal processes of the university (Favero & Rutherford, 2020; Ho, 2018).
Empirical research shows that PBF can improve student graduation rates. PFB mechanisms encourage universities to invest in student support services and to manage degree programmes more effectively, thus contributing to better graduation outcomes (Rosinger et al., 2023; Ra et al., 2022). However, the literature notes that this funding mechanism favours large, more resourced institutions that have a better chance of achieving the targets, while smaller or regional HE institutions are often left behind due to a lack of funding (Burmicky et al., 2024; Ortagus et al., 2020; Hagood, 2019).
PBF can also contribute to diversifying resources and fostering innovation as institutions seek to improve performance to attract additional funding (Birdsall, 2018). Thus, there is an increasing focus on improving the quality of education, student engagement, and monitoring of achievement. However, such mechanisms may increase the state’s influence on university autonomy, as the structure of indicators and assessment criteria becomes a means to regulate institutional performance (Kenno et al., 2020). In some states, PBFs have been observed to reduce public investment in education, which may have a negative impact on the long-term sustainability of the sector (Ortagus et al., 2020).
Issues of transparency and equity are central to analysing the impact of PBF on institutional behaviour. PBF mechanisms adopted by the EU may encourage institutions to focus on outcomes. However, this focus sometimes blurs long-term strategic objectives and can create competition between institutions, which is contrary to the overall goal of HE to ensure access for all students (Chang & Chang, 2024). Research shows that while PBF can encourage institutions to improve achievement, it can also have negative consequences, such as reducing enrolment for underrepresented groups of students when funding is directly linked to their success (Rosinger et al., 2023; Ortagus et al., 2020). This suggests that such a model may create tensions between social equity and academic achievement (Burmicky et al., 2024).
An analysis of the literature reveals that the impact of PBF on institutional effectiveness is mixed and depends on the design of the model, the criteria, and the context in which it is implemented (Hagood, 2019; Birdsall, 2018). These conflicting results highlight the need to assess at an empirical level how the design of national HE funding mechanisms and the scale of investment, together with macroeconomic and demographic factors, are associated with graduation rates.
2.4. Other Drivers of Graduation
While this study focuses on the design of national HE funding mechanisms, it is important to consider the wider context. Previous studies (Židonė & Krušinskas, 2025) have extensively analysed the impact of macroeconomic indicators, the volume of national funding, and the time lag of policy changes on graduation rates. Given the continuity of these studies, they are not re-analysed in this paper-only briefly summarised as control variables.
Macroeconomic conditions, such as GDP per capita, youth unemployment, and inflation, determine both the financial capacity of a country and the behaviour of students. Economic growth generally allows for increased public investment in HE but may reduce the motivation for continuing studies when attractive labour market alternatives become available (Filippova et al., 2021; Maneejuk & Yamaka, 2021; Dawud, 2020). High unemployment rates often encourage populations to invest in human capital and increase enrolment (Jia, 2023; Shobande & Asongu, 2022; Behera & Mallick, 2022), while fluctuations in inflation can affect the affordability of studies and social equity (Dokhkilgova et al., 2023; Sebki, 2021).
Demographic factors, especially the share of young people in the general population, also affect graduation rates. This factor is important as it directly reflects the number of potential students and can affect the competitiveness of institutions. With a declining youth share, universities must compete for student numbers, which may encourage them to invest more in attracting and retaining students, thereby indirectly improving graduation rates (Prudente & Yunaningsih, 2023; Teixeira et al., 2022). Although this factor acts as a structural element of the environment, its influence can be significant, especially when looking at long-term changes.
Investment in HE is an important determinant of graduation outcomes, but its impact is not only determined by the volume of funding. The effectiveness of public investment is determined by the alignment of national and institutional objectives (Kelchen et al., 2023; Ortagus et al., 2020). However, an increase in national funding does not guarantee higher graduation rates unless investments are thoughtfully integrated into educational planning and quality improvement (Motala et al., 2023). As a result, the strategic and equitable allocation of funds within institutions plays a greater role than the overall level of funding alone (Jackson et al., 2021).
Moreover, previous studies have shown that the impact of policy and funding changes on graduation rates is often delayed. Institutions need time to adjust to new funding conditions or economic realities, so the effect of changes on graduation rates may not be visible until several years later (Dobrovolska et al., 2023; Zając et al., 2023).
This literature review reveals that while macroeconomic, demographic, and investment factors have a significant impact, they are not sufficient to explain differences in graduation rates between countries. Therefore, the following subsection presents a conceptual model to systematically assess the effects of the design of funding mechanisms on HE outcomes.
2.5. Conceptual Framework
This subsection presents a conceptual model that integrates the main factors discussed in the literature review of this paper. The model builds on previous empirical work, “From Policy to Outcome: How Economic Conditions and National Funding Affect Graduation Rates “ (Židonė & Krušinskas, 2025), which analysed the impact of macroeconomic conditions, the volume of national funding, and the time lags of policy changes on graduation rates in Lithuania. In this paper, we extend this conceptual framework to include two new variables: the design of national funding mechanisms and demographic factors, and apply it to an EU-wide comparison. This allows us to systematically assess whether the design of funding is more important than the scale of investment.
Unlike analysing individual factors in isolation, the model highlights the broader interaction of macroeconomic, demographic, and funding conditions with study outcomes. The five-dimensional framework reveals how national funding mechanisms affect HE performance and graduation outcomes in a broader economic and social context. The conceptual model presented in Figure 1 reflects the interrelationships between these dimensions and provides the theoretical basis for the subsequent empirical analysis.
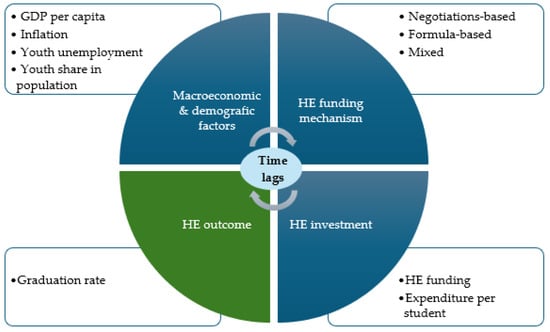
Figure 1.
Conceptual framework linking HE funding mechanisms, contextual factors, and graduation outcomes with time lags.
As illustrated in Figure 1, macroeconomic and demographic factors (GDP per capita, inflation, youth unemployment rate, share of young people in the population) reflect a country’s economic capacity and structural demand for HE. HE funding mechanisms (negotiation-based, formula-based, mixed) structure institutional incentives and can lead to different dynamics in student outcomes. Public investment indicators (total education expenditure, expenditure per student) reflect the government’s priorities in the HE system. The graduation rate is considered the dependent variable in the model, which combines the effects of all these factors. Finally, time lags emphasise that the effects of many policy or economic changes only take a few years to materialise, so that short-term estimates can be misleading.
This integrated approach allows for an analytical assessment of how contextual factors, public investment, and funding design interact to shape HE outcomes. This provides a theoretical basis for subsequent empirical analysis focused on assessing the causal links between funding design and graduation rates.
3. Methodology
3.1. Data and Variables
The empirical part of this study analyses panel data from the 27 EU Member States covering the period from 2013 to 2023. The analysis covers 297 observations (27 countries × 11 years), providing the basis for econometric estimations.
The data were collected from Eurostat, the official EU statistical office, which ensures data reliability, transparency, and international comparability. Using a single data source eliminates possible methodological inconsistencies between indicators reported by different institutions and ensures consistency in the analytical study. All EU Member States are included in the analysis: Austria (AT), Belgium (BE), Bulgaria (BG), Croatia (HR), Cyprus (CY), Czech Republic (CZ), Denmark (DK), Estonia (EE), Finland (FI), France (FR), Germany (DE), Greece (EL), Hungary (HU), Ireland (IE), Italy (IT), Latvia (LV), Lithuania (LT), Luxembourg (LU), Malta (MT), the Netherlands (NL), Poland (PL), Portugal (PT), Romania (RO), Slovakia (SK), Slovenia (SI), Spain (ES) and Sweden (SE).
Three main mechanisms are currently identified in EU countries: negotiation-based (7 countries), formula-based (6 countries), and mixed (14 countries). In those countries with several models of HE funding, the predominant (dominant) mechanism has been selected for classification. These models vary in the extent of performance integration, from no PBF at all to a high performance orientation (60–100%). Over the last decade, most EU countries have strengthened the importance of performance criteria, reflecting a general trend towards greater transparency and accountability in the HE sector (European Commission & Directorate General for Education, Youth, Sport and Culture, 2023).
National HE funding varies considerably between EU Member States, ranging on average between 0.4% and 1.8% of GDP. This is particularly relevant when assessing the effectiveness of public policy and its relationship with HE outcomes, in particular, graduation rates. In this context, it is important to analyse whether higher public spending automatically leads to better results.
Figure 2 shows the relationship between HE expenditure and the graduation rate under different national funding mechanisms. Countries with similar levels of funding often show significantly different results: for example, IE, SK, and FR, with around 0.6% of GDP, have very high graduation rates, while PT and the EU, in a similar funding range, show average results.
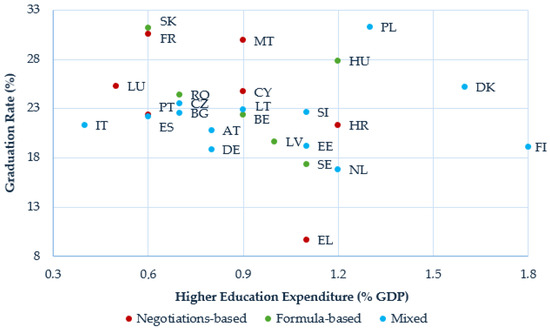
Figure 2.
Mean levels of HE expenditure and graduation rates by funding mechanism type across EU member states.
In contrast, the countries that allocate the largest share of GDP to HE—FI (~1.8%) and DK (~1.6%)—do not perform proportionally better: FI is below the EU average, while DK is only moderately high performing. Other cases, such as MT or PL, show that high graduation rates can be achieved with moderate investments, while EL has one of the lowest performances despite funding close to the EU average.
This shows that the volume of funding alone cannot explain differences in performance, but that national funding mechanisms are also important. As the figure shows, no single type of funding is directly linked to consistently high graduation rates, so the logic of the mechanisms and the contextual factors needs to be further explored.
Figure 3 illustrates the relationship between the dependent and independent variables, such as macroeconomic and demographic factors, national funding mechanisms, and investment in HE, and their potential impact on the graduation rate.
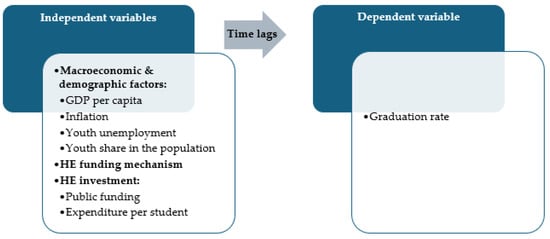
Figure 3.
Structure of dependent and independent variables in the graduation rate model.
The dependent variable is the graduation rate, defined as the share of graduates from publicly funded bachelor’s, master’s, and doctoral programmes in the total number of publicly funded students. This indicator reflects the level of output of the HE system, as it shows the proportion of students who receive public funding and complete their studies.
The study uses several groups of independent variables, which, according to the literature analysis, are considered to be important factors that can influence HE outcomes:
- Macroeconomic and demographic variables:
- GDP per capita (GDP per capita)—used as an indicator of a country’s level of economic development. This indicator will be included in the model in logarithmic form to reduce asymmetric data distribution and to ensure better interpretation.
- Inflation-the annual change in the consumer price index reflecting the dynamics of the price level (HICP).
- Youth unemployment rate—the share of young people aged 15–24 who are not in employment but are looking for work as a percentage of the total labour force in this age group
- Youth share in the population—an indicator showing structural demographic differences between countries that may affect demand for HE and graduation rates.
- HE funding mechanisms. This variable is included in the model as three types of dummy variables, with the mechanisms used by countries noted separately:
- Negotiation-based,
- Formula-based,
- Mixed.
The negotiation-based mechanism was chosen as the reference group because it is the most consistent with the logic of funding based on historical data, is the simplest, and has traditionally been seen as the baseline mechanism from which to move to formula-based or results-based systems. This definition of the variables allows us to determine whether the design of the funding (not just the volume) has a systematic impact on graduate performance.
- 3.
- HE investment:
- HE funding (as % of GDP) ()—the annual share of public spending on HE as a share of GDP.
- Expenditure per student ()—he annual share of public funding per student enrolled in a publicly funded place, expressed as a share of GDP per capita. This indicator allows for international comparability and measures the state’s relative commitment to HE in relation to the country’s economic potential.
This separation of variables allows us to distinguish the difference between the scale of investment and the logic of its allocation, making it possible to determine whether the design of the funding has an independent impact on the performance of HE, independently of the overall level of funding.
3.2. Model Specification
The empirical analysis is carried out using the multiple regression method, which allows us to estimate the effect of the independent variables on the dependent variable—graduation rate. This approach is consistent with the empirical design of the study, which aims to use a sufficiently representative multi-country sample to examine how different types of higher-education funding mechanisms, together with macroeconomic and demographic factors, are associated with graduation outcomes. The main structural independent variable—the funding mechanism—remained unchanged within each country during the analysed period and therefore reflects stable differences in national funding system design. For this reason, it is modelled as a categorical (dummy) variable representing distinct types of higher-education funding systems. In contrast, the other independent variables (GDP per capita, unemployment rate, inflation, youth share, and investment levels) exhibit sufficient variation across countries and years, enabling their meaningful analysis within a regression-based analytical framework that incorporates time-lagged effects. The calculations were performed using IBM SPSS Statistics 29.0.2.0.
The time lags (-1, -2, -3, and -4 years) are applied to all independent variables in the study. This approach reflects the typical duration of HE programmes in the EU: bachelor’s studies usually take 3–4 years, master’s studies 1–2 years, and doctoral programmes approximately 3–4 years. Therefore, changes in demographic and macroeconomic conditions, as well as the design and scope of HE funding, do not produce effects on graduation rates immediately but only after students progress through their study cycle. Introducing time lags into the model allows capturing these delayed effects and reflects the actual temporal sequence of cause and effect, rather than assuming an instantaneous relationship.
Equation (1) specifies the empirical model used to examine the relationship between macroeconomic and demographic conditions, public investment in HE, and graduation rates.
where
- —the intercept, representing the baseline level of the dependent variable.
- —estimated coefficients capturing the marginal effects of macroeconomic, demographic, and public investment variables.
- —estimated coefficients capturing the relative effects of formula-based and mixed funding mechanisms on graduation rates, compared to the reference category (negotiation-based funding).
- —a binary (dummy) variable equal to 1 if a formula-based HE funding mechanism is applied, and zero otherwise.
- —a binary (dummy) variable equal to 1 if a mixed HE funding mechanism (combining formula-based and negotiation-based elements) is applied, and zero otherwise. The negotiation-based funding mechanism serves as the reference category.
- —country index, denoting the cross-sectional unit.
- —time period (year), covering 2013–2023.
- —lag length (1, 2, 3, or 4 years), indicating the number of years by which explanatory variables are lagged.
- —the error term, accounting for unobserved influences not captured by the explanatory variables.
The literature review and the logic of the empirical model developed provide the basis for the following hypotheses.
- H1: The demographic composition (youth share) and macroeconomic conditions (GDP per capita, HICP, youth unemployment) are systematically associated with national graduation rates.
- H2: Higher public investment—both as a share of GDP and as per-student expenditure relative to GDP per capita—is positively associated with graduation rates.
- H3: National higher-education funding mechanisms—negotiation-based, formula-based, or mixed—are significantly associated with graduation rates.
- H4: The associations between demographic and macroeconomic factors, funding mechanisms, HE investments, and graduation rates are time-lagged, with significant relationships expected within one to four years (t − 1 to t − 4).
Table 1 provides a summary of the hypotheses formulated in the study and the variables that will be used to test them empirically.

Table 1.
A summary of hypotheses and their analytical components.
In summary, the model developed allows a systematic assessment of how macroeconomic, demographic, and HE funding factors are associated with graduation rates in EU Member States, using time lags. This methodological approach provides a basis for robust hypothesis testing. It paves the way for further econometric analyses focused on assessing the effectiveness of national policies in the field of HE. To ensure the reliability and validity of the estimated models, classical regression diagnostic tests were conducted to assess residual normality, homoscedasticity, multicollinearity, autocorrelation, and the influence of individual observations. The diagnostic outcomes and robustness checks are presented in Section 4.3.
4. Results and Discussion
4.1. Descriptive Statistics
Descriptive statistical analysis was performed to assess the mean values of the data, the variation, and the goodness of fit for further multiple regression analysis. Such an analysis provides a sound basis for subsequent hypothesis testing on the impact of national funding mechanisms and other factors on graduation. The main statistical indicators-mean, median, standard deviation, minimum, and maximum values-allow us to assess not only the variation in the variables but also possible outliers (see Table 2).
Table 2.
Key descriptive statistical indicators.
The dependent variable, Graduation %, has a reasonable variance between countries: mean 23.25%, median 22.38%, with values ranging from 8.71% to 69.40% (standard deviation 6.09%). The highest value is several times higher than the mean and indicates a possible outlier reflecting the specific situation of HU 2020. Such variation is necessary to test whether the design of the funding models has an independent impact on the study outcomes.
The demographic variables reflect different contexts. The share of young people in the population (Youth Share, %) is relatively stable (mean 10.96%, median 10.81%, range 8.17–15.04%), while the youth unemployment rate (Youth Unemp, %) varies widely from 5.1% to 57.9% (mean 18.73%, standard deviation 10.06%). This wide variance in youth unemployment is analytically essential because it allows us to test the hypothesis that macroeconomic constraints may alter decisions to pursue and complete studies.
Macroeconomic indicators such as log GDP per capita (Log GDP/Capita) and the consumer price index (HICP) show opposite trends. GDP per capita is relatively stable (mean 4.41, standard deviation 0.27, range 3.77–5.08) and is therefore suitable as a structural control variable for a country’s economic level. In contrast, the HICP exhibits wide fluctuations, ranging from deflation (−1.6%) to high inflation (19.4%, mean 2.56%, standard deviation 3.60%), reflecting the impact of the macroeconomic cycle.
Public funding indicators show a wide differentiation of investment across countries. HE expenditure as a share of GDP (Exp/GDP, %) ranges from 0.4% to 2.1% (mean 0.918%, median 0.9%, standard deviation 0.35%), while public expenditure per student as a share of GDP per capita (Exp per Student/GDP per Capita, %) ranges from 8.98% to 62.60% (mean 31.46%, median 30.67%, standard deviation 10.36%). These significant differences provide an opportunity to test whether the size and design of funding have an independent effect on graduation rates, but also require careful diagnostics to distinguish structural differences from potential outliers in regression models.
The descriptive statistics show that the variation in the data is sufficient and representative to reliably model the association of macroeconomic and funding factors with graduation. Some indicators-graduation rate, youth unemployment rate, inflation, and public expenditure per student-have extensive ranges of values. These can be seen as potential outliers, but at the same time reflect real structural differences between EU Member States. In the subsequent stages of the study, the necessary diagnostic and goodness-of-fit tests will be carried out using a multiple regression model; outliers will be identified and removed or transformed if required to ensure the robustness of the models.
4.2. Results of the Models
The sample for the dependent variable, graduation rate, covers the 27 EU Member States for the period 2013–2023. To include all the lags of the independent variables, the sample period was shortened so that for each value of graduation, there is a corresponding data set for the independent variables. The analysis used a multiple regression method with time lags (t − 1, t − 2, t − 3, t − 4) for the independent variables. The time lags were defined for four time periods: t − 1 (2016–2022), t − 2 (2015–2021), t − 3 (2014–2020), and t − 4 (2013–2019). This design allows for a consistent assessment of the lagged impact of macroeconomic, demographic, and funding factors on graduation.
The descriptive analysis carried out prior to the modelling exercise shows that the average graduation rate in the EL is only 9.7% over the period analysed, compared to an EU average of 23.2%. This structural gap represents an extreme value that may disproportionately affect the coefficient estimates and increase the sensitivity of the model. In view of these facts and in line with standard practice in regression analysis, we have decided to exclude EL from the analysis. After this correction, 182 observations were used for each period (t − 1, t − 2, t − 3, t − 4). Subsequently, in the regression analysis of each model, we additionally removed outliers to reduce the sensitivity of the models to outliers. For this reason, the final number of observations in the different models ranged from 156 to 163 (see Table 3).
Table 3.
Coefficients and statistical significance of multiple regression models.
The types of funding mechanisms were transformed into dummy variables, with negotiation-based mechanisms as the reference category. Formula-based and mixed models were included as separate dummy variables.
Statistical significance of the models was confirmed by ANOVA F-test (p < 0.001 for all models), and the explanatory power (Adjusted R2) ranged from 0.376 to 0.513 (see Table 3). This indicates that the factors included explain a significant part of the variation in the graduation rate between EU Member States.
The regression results indicate that demographic structure, economic context, and funding design are systematically associated with graduation rates in the EU. A higher share of young people in the population and greater expenditure per student are positively linked with graduation outcomes. In contrast, higher GDP per capita and total HE expenditure as a share of GDP are negatively associated with graduation rates. Furthermore, formula-based and mixed funding mechanisms consistently show lower graduation rates compared to negotiation-based systems across all lag specifications. These relationships remain stable across the t − 1 to t − 4 lagged models, suggesting that the effects reflect structural patterns rather than short-term fluctuations.
The results are then interpreted according to the hypotheses formulated in the literature review in order to assess the impact of macroeconomic, demographic and funding factors on graduation rates.
Hypothesis 1 (H1).
Demographic composition and macroeconomic conditions—partially supported.
The results showed that the proportion of young people in the population is positively and statistically significantly related to the graduation rate in all models (p < 0.001). This result is in line with Prudente and Yunaningsih (2023) and Teixeira et al. (2022), who highlight that a larger cohort of young people increases the demand for HE, forces institutions to compete more for students, and may stimulate additional investment in attracting and retaining students.
In contrast, GDP per capita was negatively and statistically significantly associated with graduation rates in all models. This is in line with the observations of Filippova et al. (2021) and Dawud (2020) that economic growth and increased labour market opportunities may reduce the motivation for continuing studies. Our previous study (Židonė & Krušinskas, 2025) found a similar trend: higher economic growth was associated with lower continuation rates.
Youth unemployment and HICP were statistically insignificant in all models, suggesting that short-term macroeconomic fluctuations are not a direct determinant of graduation rates. These results are consistent with the findings of Dokhkilgova et al. (2023) and Sebki (2021), and with our previous study (Židonė & Krušinskas, 2025), in which inflation was insignificant in all lag models, and the effect of youth unemployment was only observed with a t − 3 lag.
The results suggest that demographic factors have a stable, long-lasting effect on graduation rates, while short-term macroeconomic fluctuations have a weaker or indirect effect.
Hypothesis 2 (H2).
Public investment—Partially confirmed.
The results show that expenditure per student (Exp per Student/GDP per Capita) is positively and statistically significantly related to graduation rates in all models (p < 0.01). This suggests that the individual level of investment is more important than the overall level of funding. This result is consistent with the findings of Kelchen et al. (2023), Motala et al. (2023), and Ortagus et al. (2020) that well-targeted public investment can reduce financial stress for students, expand academic services, and foster higher graduation rates.
In contrast, the overall level of funding (Exp/GDP) had a negative and statistically significant coefficient in all models. This result contradicts the traditional assumption that higher public investment automatically increases graduation rates. This is in line with the observations of Jackson et al. (2021) that the level of funding without strategic allocation may be inefficient, especially if the funds are not linked to improving the quality of studies and student engagement.
These results may reflect a period of institutional adaptation during which new funds are not yet able to translate into qualitative changes in the learning environment, or an overly fragmented allocation of funds between different programmes. It also supports the argument in the literature that the structure and direction of investment is more important than its overall size, with targeted expenditure per student contributing more to graduation rates than overall public investment as a share of GDP.
Thus, hypothesis H2 was partially supported: while targeted public investment per student leads to higher graduation rates, the effect of the overall scale of funding remains negative, underlining the importance of the direction of investment, strategic allocation, and long-term policy decisions.
Hypothesis 3 (H3).
National funding mechanisms for HE—Partially supported.
The results showed that compared to the negotiation-based funding mechanism, both formula-based and mixed (formula + performance) models had negative and statistically significant coefficients (p < 0.001) in all four lag models. This suggests that the design of funding mechanisms is systematically related to graduation rates, but in the opposite direction to that predicted, with institutions operating under stricter criteria not being associated with higher graduation rates in the short term.
These results contradict predictions in the literature (Rosinger et al., 2023; Ra et al., 2022; Favero & Rutherford, 2020) that PBF mechanisms should lead to higher graduation rates, investment in student support services, and improvements in the quality of studies. However, they are consistent with the observations of Motala et al. (2023), Ehteshamnejad (2023), and Marshall and Salter (2022) that poorly designed or prematurely evaluated funding mechanisms can promote short-term ‘indicator chasing’, increase administrative burdens, and undermine the long-term benefits of quality of study.
A possible explanation for these results is the differing level of institutional capacity required to function under formula-based and mixed funding mechanisms. These models typically involve more extensive monitoring, reporting, strategic planning, and programme management coordination. When internal resources must be allocated to meeting these requirements, less capacity may remain available for activities directly supporting student learning and progression, which can be reflected in lower graduation outcomes during the analysed period. It is also important to note that graduation rate is only one of several HE performance indicators, and its role varies across EU systems. In some countries, it functions primarily as an output indicator used to evaluate institutional effectiveness, while in others it is shaped more by input conditions such as student composition, access policies, and social mission. Therefore, the effects of funding design on graduation may be more visible where this indicator is strongly tied to accountability structures, and less pronounced where other priorities (e.g., research performance) dominate. This interpretation is consistent with Kutto and Erastus (2025), who argue that the effects of funding mechanisms become positive only when criteria are stable, long-term, and aligned with institutional capacity to implement them.
These interpretations are also consistent with broader findings in public-sector budgeting research. Alhasnawi et al. (2025) demonstrate that the outcomes of performance-based funding depend not only on the formal design of allocation rules but also on institutional transparency, information quality, and organisational capacity to adapt. When performance requirements expand faster than internal administrative or academic support systems, funding mechanisms may generate compliance pressure rather than meaningful improvements in outcomes. This reinforces the conclusion that the effectiveness of funding is determined less by its volume and more by whether policy objectives, data systems, and institutional capabilities are coherently aligned.
In summary, Hypothesis H3 is partially supported: although the design of funding mechanisms is statistically significantly related to graduation rates, the direction is the opposite of what is predicted: formula- and PFB mechanisms are associated with lower rather than higher graduation rates in the short term. This suggests that funding design can only be effective if it is stable, long-term, and aligned with the capacity of institutions to implement change, and provides policymakers with important insights into risks in transition.
Hypothesis 4 (H4).
Time lags—confirmed.
The results show that the strongest relationships between macroeconomic, demographic, and funding variables and the graduation rate appear in models with t − 2 and t − 3 lags. This implies that changes in policy, funding, or economic environment tend to affect graduation rates not immediately, but several years later. This finding is in line with studies by Dobrovolska et al. (2023) and Zając et al. (2023), who stress that HE systems require an adaptation period before changes materialise in student outcomes. These results support the theoretical assumptions that causal relationships in education policy are often non-linear and delayed. Whether at the institutional level or at the national level, changes in funding mechanisms, programmes, or macroeconomic conditions require structural transformations, reallocation of resources, and reorientation of curricula, so that the impact on student outcomes takes time to materialise. In summary, Hypothesis H4 was confirmed: the time dimension is crucial in assessing the effectiveness of HE policy interventions. The results of our study showed that the most significant relationships between the independent variables and graduation occur after a few years, which is consistent with the observations of Dobrovolska et al. (2023), Zając et al. (2023), and other authors. This demonstrates that longer-term analysis is necessary to assess the impact of education policies and funding mechanisms properly.
4.3. Model Diagnostics
Model diagnostics were carried out to check whether the multiple regression models are consistent with classical assumptions. This is necessary to ensure that the estimated values of the regression coefficients are unbiased and reliable. Table 4 shows the results of the main diagnostic tests.
Table 4.
Diagnostic results for multiple regression models.
The Kolmogorov–Smirnov test showed that the distribution of standardised residuals in all models satisfies the normality assumption. The p-value for models t − 1 and t − 2 is 0.200, for models t − 3 and t − 4, it is close to the threshold of statistical significance (0.069 and 0.051, respectively). Still, in all cases, it is within the threshold of 0.05, so that the assumption of normality is not violated. The mean of the standardised residuals is zero, which confirms the absence of systematic error in the models.
The residuals are evenly distributed around the predicted values, indicating that there is no evidence of heteroskedasticity in the models. This means that the error variance is constant across the axis of the predicted values and therefore the standard errors of the coefficients are robust.
The Durbin-Watson test shows that the models are free from first-order autocorrelation. The indices range between 1.654 and 2.041: models t − 1, t − 3, and t − 4 show acceptable independence (values close to 2), while in model t − 2, the index of 1.654 is close to the cut-off value, but still shows only a weak risk of autocorrelation. This suggests that the residuals are sufficiently independent.
The Cook’s distance values in all models are small (0.061–0.073), indicating that the influence of individual observations on the regression coefficients is minimal. The Centred Leverage Max is 0.104–0.158, and the standardised residuals range from −2.409 to 2.255, indicating that there are no observations that drastically bias the model results.
The VIF values in all models are below 2.7, and the tolerance exceeds 0.3–0.4, indicating that there is no strong correlation between the independent variables. This confirms that the coefficients of the models are stable and there is no significant multicollinearity.
All the diagnostic tests show that the multiple regression models meet the basic assumptions of classical regression: the residuals are close to a normal distribution, homoskedastic, independent, with no critical outliers, and the independent variables are not overly correlated with each other. On this basis, we conclude that the estimation method applied is statistically appropriate, and that the resulting models are robust and can be interpreted as reflecting the genuine relationships between funding mechanisms, macroeconomic and demographic factors, and graduation rates. Additional robustness checks with alternative lag structures and variable specifications produced consistent results, confirming the stability of the models.
5. Conclusions
This study examined how demographic, macroeconomic, and higher education funding factors, together with their lagged effects, are associated with graduation rates in the EU-27 between 2013 and 2023. The results show that a larger share of young people in the population and higher expenditure per student are positively associated with graduation outcomes, whereas higher GDP per capita is negatively associated with graduation rates, likely reflecting stronger labour market incentives that reduce the motivation to complete studies. Meanwhile, total public expenditure on higher education as a share of GDP showed a negative relationship with graduation outcomes, indicating that the scale of public investment alone is insufficient when funding is not strategically directed toward students.
The findings also demonstrate that the structure of funding mechanisms plays a distinct and consistent role. Formula-based and mixed funding systems were associated with lower graduation rates compared to negotiation-based arrangements across all lag models. Unlike the macroeconomic and funding-volume effects, which were strongest after two years (t − 2), the negative association of formula-based and mixed funding models remained stable across all time lags. This suggests that the influence of funding design reflects underlying institutional incentive structures rather than short-term policy effects.
These results imply that improving graduation outcomes is less a matter of increasing total expenditure and more a matter of targeting resources directly toward student support systems, learning environments, and institutional capacity, under stable and transparent funding arrangements. Funding policies that are predictable and aligned with institutional capabilities are more conducive to long-term improvements than frequent shifts in allocation formulas or performance criteria.
This study is limited by the lack of comparable institutional-level indicators across EU Member States. Factors such as governance quality, internal management capacity, and student support systems, which likely affect graduation outcomes, could not be included due to inconsistent measurement. Future research should therefore integrate institutional-level data and incorporate academic and social environment indicators (e.g., student–faculty ratios, staff qualification levels), alongside causal estimation approaches (e.g., fixed-effects models, GMM, or quasi-experimental identification strategies), to more precisely examine how funding design interacts with institutional practices.
Author Contributions
Conceptualization, G.Ž.-B.; methodology, G.Ž.-B. and R.K.; software, G.Ž.-B.; validation, G.Ž.-B.; formal analysis, G.Ž.-B.; investigation, G.Ž.-B.; resources, G.Ž.-B.; data curation, G.Ž.-B.; writing—original draft preparation, G.Ž.-B.; writing—review and editing, G.Ž.-B. and R.K.; visualisation, G.Ž.-B.; supervision, R.K. All authors have read and agreed to the published version of the manuscript.
Funding
This research received no external funding.
Institutional Review Board Statement
Not applicable.
Informed Consent Statement
Not applicable.
Data Availability Statement
The data supporting the findings of this study are publicly available from the following sources.
Conflicts of Interest
The authors declare no conflicts of interest.
Abbreviations
The following abbreviations are used in this manuscript:
| ANOVA | Analysis of variance |
| AT | Austria |
| BE | Belgium |
| BG | Bulgaria |
| CY | Cyprus |
| CZ | Czechia |
| DE | Germany |
| DK | Denmark |
| EE | Estonia |
| EL | Greece |
| ES | Spain |
| EU | European Union |
| FI | Finland |
| FR | France |
| GDP | Generalised method of moments |
| GMM | Gross domestic product |
| HE | Higher education |
| HICP | Harmonised index of consumer prices |
| HR | Croatia |
| HU | Hungary |
| IE | Ireland |
| IT | Italy |
| LT | Lithuania |
| LU | Luxembourg |
| LV | Latvia |
| MT | Malta |
| NL | Netherlands |
| PBF | Performance-based funding |
| PL | Poland |
| PT | Portugal |
| RO | Romania |
| SE | Sweden |
| SI | Slovenia |
| SK | Slovakia |
| VIF | Variance inflation factor |
References
- Alhasnawi, M. Y., Alshdaifat, S. M., Mansour, M., Saleh, M. W., & Hu, G. (2025). How does performance-based budgeting enhance sustainable performance? A mediated-moderated model of innovation and information quality. International Journal of Innovation Science, 1–19. [Google Scholar] [CrossRef]
- Behera, B. K., & Mallick, H. (2022). Does fiscal deficit matter for economic growth performance of Indian states? Indian Public Policy Review, 3(6), 16–44. [Google Scholar] [CrossRef]
- Birdsall, C. (2018). Performance management in public higher education: Unintended consequences and the implications of organizational diversity. Public Performance & Management Review, 41(4), 669–695. [Google Scholar] [CrossRef]
- Burmicky, J., Clarke, A. T., & Anderson, C. A. (2024). Historically black colleges and universities and performance-based funding: A systematic review of the literature. Journal of Postsecondary Student Success, 3(3), 81–109. [Google Scholar] [CrossRef]
- Chang, D.-F., & Chang, A. (2024). Analysis of the influence of fund allocation and sustainable academic efficiency based on a transformation of public goods in higher education. Sustainability, 16(5), 2000. [Google Scholar] [CrossRef]
- Dawud, S. A. (2020). The impact of human capital development on economic growth in Ethiopia. American Journal of Theoretical and Applied Business, 6(4), 47–51. [Google Scholar] [CrossRef]
- Dobrovolska, O., Sonntag, R., Ortmanns, W., Kadyrus, I., & Rudyanova, T. (2023). Structural and comparative analysis of R & D funding impact on the level of innovation development: The empirical evidence of GII’s leaders and Ukraine. Innovative Marketing, 19(4), 310–322. [Google Scholar] [CrossRef]
- Dokhkilgova, D. M., Saralinova, S., & Malganova, I. G. (2023). Human resource development in the context of global trends. SHS Web of Conferences, 172, 02010. [Google Scholar] [CrossRef]
- Ehteshamnejad, E. (2023). Global perspectives on financing higher education: A comparative analysis. Ijimob, 3(2), 42–50. [Google Scholar] [CrossRef]
- European Commission & Directorate General for Education, Youth, Sport and Culture. (2023). Technical annexes to the final report of the study on the state and effectiveness of national funding systems of higher education to support the European universities initiative (vol. II). Publications Office. Available online: https://ris.utwente.nl/ws/portalfiles/portal/307805972/technical_annexes_to_the_final_report_of_the_study_NC0822189ENN.pdf (accessed on 1 September 2025).
- Favero, N., & Rutherford, A. (2020). Will the tide lift all boats? Examining the equity effects of performance funding policies in U.S. higher education. Research in Higher Education, 61(1), 1–25. [Google Scholar] [CrossRef]
- Filippova, O. V., Grigoriev, A. V., Murzagalina, G. M., Sorgutov, I. V., Latifzoda, D. N., & Kalimullin, D. D. (2021). Trends in economic development and education of future economists. Linguistics and Culture Review, 5(1), 397–405. [Google Scholar] [CrossRef]
- Hagood, L. P. (2019). The financial benefits and burdens of performance funding in higher education. Educational Evaluation and Policy Analysis, 41(2), 189–213. [Google Scholar] [CrossRef]
- Ho, A. T. (2018). From performance budgeting to performance budget management: Theory and practice. Public Administration Review, 78(5), 748–758. [Google Scholar] [CrossRef]
- Jackson, C. K., Wigger, C., & Xiong, H. (2021). Do school spending cuts matter? Evidence from the great recession. American Economic Journal Economic Policy, 13(2), 304–335. [Google Scholar] [CrossRef]
- Jia, H. (2023). The impact of educational development on the economy in China and the United States. Highlights in Business Economics and Management, 19, 158–164. [Google Scholar] [CrossRef]
- Kelchen, R., Ortagus, J., Rosinger, K., Baker, D., & Lingo, M. (2023). The relationships between state higher education funding strategies and college access and success. Educational Researcher, 53(2), 100–110. [Google Scholar] [CrossRef]
- Kenno, S., Lau, M., Sainty, B., & Boles, B. (2020). Budgeting, strategic planning and institutional diversity in higher education. Studies in Higher Education, 46(9), 1919–1933. [Google Scholar] [CrossRef]
- Kutto, N., & Erastus, M. (2025). Equity and social inclusion in higher education: The funding dilemma in public universities in Kenya. Africa Journal of Technical and Vocational Education and Training, 9(1), 20–27. [Google Scholar] [CrossRef]
- Liu, T., Hassan, A., & Mohd Anuar, M. A. B. (2023). Systemic reviews: Financing of higher education internationalisation. Perspectives in Education, 41(4), 275–292. [Google Scholar] [CrossRef]
- Maneejuk, P., & Yamaka, W. (2021). The impact of higher education on economic growth in ASEAN-5 countries. Sustainability, 13(2), 520. [Google Scholar] [CrossRef]
- Marshall, S. L., & Salter, A. O. (2022). Moving beyond the boilerplate: Reflections on equity--centered reviewing for granting organizations. Science Education, 106, 1264–1282. [Google Scholar] [CrossRef]
- Motala, S., Oketch, M., Wangenge-Ouma, G., & Masutha, M. (2023). Higher education funding, justice and equity—Critical perspectives. South African Journal of Higher Education, 37(6), 1–7. [Google Scholar] [CrossRef]
- Ortagus, J. C., Kelchen, R., Rosinger, K., & Voorhees, N. (2020). Performance-based funding in American higher education: A systematic synthesis of the intended and unintended consequences. Educational Evaluation and Policy Analysis, 42(4), 520–550. [Google Scholar] [CrossRef]
- Prudente, J., & Yunaningsih, A. (2023). Improving university competitiveness and quality education through human resource development in the digital era. Bedan Research Journal, 8(1), 173–201. [Google Scholar] [CrossRef]
- Ra, E., Kim, J., Hong, J., & DesJardins, S. L. (2022). Functioning or dysfunctioning? The Effects of performance-based funding. Educational Evaluation and Policy Analysis, 45(1), 79–107. [Google Scholar] [CrossRef]
- Rosinger, K. O., Ortagus, J. C., Kelchen, R., & Choi, J. (2023). The impact of performance funding policy design on college access and selectivity. Educational Evaluation and Policy Analysis, 45(4), 655–681. [Google Scholar] [CrossRef]
- Sebki, W. (2021). Education and economic growth in developing countries: Empirical evidence from GMM estimators for dynamic panel data. Economics and Business, 35, 14–29. [Google Scholar] [CrossRef]
- Shobande, O. A., & Asongu, S. (2022). Has knowledge improved economic growth? Evidence from Nigeria and South Africa. Journal of Public Affairs, 22(S1), e2763. [Google Scholar] [CrossRef]
- Teixeira, P., Silva, P. L., Biscaia, R., & Sá, C. (2022). Competition and diversification in higher education: Analysing impacts on access and equity in the case of Portugal. European Journal of Education, 57(2), 235–254. [Google Scholar] [CrossRef]
- Wang, X., Zhu, L., & Yang, S. (2023). The relationship between the use benefit of educational funds and education quality. Frontiers in Educational Research, 6(31), 1–5. [Google Scholar] [CrossRef]
- Yan, J., Armwood-Gordon, C., & Li, L. (2023). Assessing the impact of state funding on higher education in the United States: Trends, allocation, and implications. International Journal of Research Publications, 139(1), 204–209. [Google Scholar] [CrossRef]
- Zając, T., Żółtak, T., Bożykowski, M., & Jasiński, M. (2023). All that glitters is not gold-mixed early labour market outcomes of STEM graduates in Poland. European Journal of Education, 58, 477–497. [Google Scholar] [CrossRef]
- Židonė, G., & Krušinskas, R. (2025). From policy to outcome: How economic conditions and national funding affect graduation rates: Case of Lithuanian universities. Economies, 13(6), 170. [Google Scholar] [CrossRef]
Disclaimer/Publisher’s Note: The statements, opinions and data contained in all publications are solely those of the individual author(s) and contributor(s) and not of MDPI and/or the editor(s). MDPI and/or the editor(s) disclaim responsibility for any injury to people or property resulting from any ideas, methods, instructions or products referred to in the content. |
© 2025 by the authors. Licensee MDPI, Basel, Switzerland. This article is an open access article distributed under the terms and conditions of the Creative Commons Attribution (CC BY) license (https://creativecommons.org/licenses/by/4.0/).