Abstract
The rheology of liquids affects their ease of pouring. In this study, the subjects evaluated the feeling of pouring liquids with various viscosities. The situation was recorded with a high-speed camera and force plate. The score for ease of pouring water and 5 wt% thickened aqueous solution was 8.9 ± 1.5 and 2.1 ± 1.6 respectively, demonstrating that the score decreased with increasing viscosity. The three stages of the pouring process, namely the flowing state in which the liquid flows out vigorously (I), the yarning state in which the liquid flows out to stretch (II), and the dripping state in which the liquid flows out as droplets (III) were observed. The duration of state II extended as the viscosity increased. These findings can be useful for the development of characteristic containers and beverages.
1. Introduction
The taste and nutritional properties of the contents as well as the geometric/physical properties of the container and the behavior of the liquid in the container are important for improving liquid food and beverages. The container’s sensory/perceptual/semantic associations affected how the contents were perceived: the shape of the container influenced volume judgments and consumption behavior [1]. The texture of the container influenced some of the assessed texture attributes of the food within [2]. Individuals drank a soft drink more quickly from an outward-sloped glass, relative to a straight-sided glass: micro-drinking behaviors, such as sip size, are promising candidates for underlying mechanisms [3].
A variety of interesting phenomena occur in the process of pouring a liquid from a container. Mode bifurcation is found in the water/air interface of the oscillatory flow of water draining from an upside-down bottle with a thin pipe: no flow, oscillatory flow, and counter flow [4]. The cloud of gaseous CO2 can be visualized by IR thermography during champagne serving, and the strong influence of temperature on its loss of dissolved CO2 can be confirmed [5]. Chihara et al. investigated the effects of bottle opening sizes and beverage types on drinking satisfaction and found that the 33-mm opening size was the most preferred irrespective of beverage type [6]. The factor analysis shows that drinking satisfaction is primarily affected by two common factors: the volume of flow from the bottle to the mouth and the adjustability of the flow.
Several factors are involved in the complex behavior of pouring a liquid. Rheology is the most important factor which determines the sensation of pouring, because the behavior of the flowing liquid drastically changes with this mechanical property. In general, pouring a highly viscous liquid into a container can be frustrating since the liquid flow is difficult to control. The discharge of viscous fluid is influenced by the shape and the tipping angle of the container [7]. The discharge rate can be enhanced by using a container of identical height and width and tipping it 45 degrees beyond the horizontal. Zang et al. showed that vibrational and rheological parameters have significant effects on the flowrates [8]. Outflow retardation is observed induced by the flow coefficient difference. The flowrates can be controlled by adjusting vibration parameters.
However, little is known about the relationship between the rheology and psychological factors related to ease of pouring, since few studies have directly observed how liquid is poured into containers. In this study, we clarified the effect of liquid viscosity on ease of pouring from a container. A sensory evaluation was conducted by pouring thickened aqueous solutions with different viscosities. The solutions contained polyethylene glycol with a molecular weight of 500,000 as a thickener. To observe the behavior during the pouring process, a sensory evaluation was recorded and analyzed with a high-speed camera and force plate. The findings on the effect of rheology on some psychological factors are useful for the development of characteristic beverages and containers.
2. Materials and Methods
2.1. Thickener Aqueous Solution
Polyethylene glycol PEG500,000 (molecular weight = 500,000) was purchased from Fujifilm Wako Pure Chemical Corporation (Osaka, Japan). Ion-exchanged water was prepared with a Kurita cartridge pure water device, DEMIACE DX type. The sample composition and viscosity are shown in Table 1. The mixture of PEG500,000 and ion-exchanged water was heated at 60 °C and stirred for more than an hour with a ball mill (small pot mill rotating frame, Nitto Kagaku Co. LTD, Aichi, Japan). The viscosity was evaluated by a rotary viscometer (ViscoQC 300, Anton Paar GmbH, Graz, Austria). Measurement conditions were as follows: Temperature = 25 °C, Rotation speed = 150 rpm (b, c), 10 rpm (d, e), and 5 rpm (f), and spindle = CC12. The viscosity of water (a) was referred from a previous study [9].

Table 1.
Composition of thickened aqueous solutions.
2.2. Observation of the Pouring Process
Figure 1 shows a schematic diagram of the pouring process observation system. A force plate (Trinity-Lab. Inc., Tokyo, Japan) and high-speed camera (VW-9000, Keyence Co., Osaka, Japan) were directly connected to the PC for data processing, and the weight of the poured water was recorded while simultaneously performing a high-speed observation of the subjects during their pouring process. The prototype of this observation system has been reported in several papers [10,11]. The force plate was equipped with strain gauge transducers at the lower four corners of the polycarbonate transparent panel and measured the weight w acting on the plate. These strain gauges were connected to the PC (VW2000, Keyence Co., Osaka, Japan) for data processing via a data logger unit (NR-500, NR-ST04 and NR-CA04, Keyence Co., Osaka, Japan) consisting of three electronic measurement systems. The dynamic range of the force plate was ± 100 N. The observation conditions of the high-speed camera were shutter speed = 1/250 s and frame rate = 125 fps. The captured images were analyzed using analysis software (Motion Analyzer VW-H2MA, Keyence Co., Osaka, Japan).
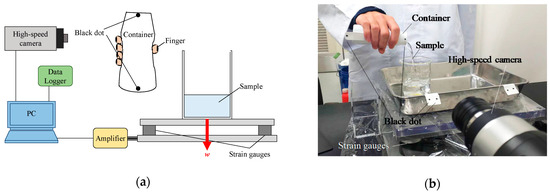
Figure 1.
Pouring process observation system. (a) Conceptual diagram; (b) Image of the evaluation system. The red allow with w means the weight of sample.
2.3. Sensory Evaluation
The sensation when the subjects poured the thickened aqueous solution from the beverage container into a beaker was evaluated using the visual analog scale method (VAS method). Figure 2 shows the beverage containers used in this study. A constricted container used for commercially available yogurt was used with the following characteristics: material, polyester; caliber, 26 mm; maximum diameter, 42 mm; constriction diameter, 31 mm; height, 110 mm; weight, 6 g. The subjects grasped the container with their dominant hand and poured 100 g of thickened aqueous solution from the container into a 200 mL beaker as quickly as possible. In this study, the distance between the container and the beaker was uncontrolled and varied between subjects. Subjects evaluated their feelings during the pouring process. The subjects were 10 males and 10 females aged 10 to 25 years. To eliminate the effect of the order, the order of the thickened aqueous solution was randomized. All the sensory evaluations were performed under the conditions at a temperature of 25 °C ± 1 °C and a humidity of 50% ± 5%. After evaluation, the subjects answered six questions. Q1 and Q2 were as follows: “How easy was it when you poured the liquid? When did you feel it? Further, please write the reason you felt that way.” and “How fast was it when you poured the liquid?”, respectively. Next, in Q3 and Q4, the subjects evaluated “Did you feel that the liquid remained inside the container?” and “How was the feeling of running out of liquid after pouring the contents?”, respectively. Q5 was as follows: “Please write freely how you feel when you pour the liquid.” In Q1 to Q4, the feeling was evaluated based on the VAS method. The VAS method is an evaluation method in which a subject marks on a horizontal straight line indicating the degree of a certain sensation. Subjects marked the most appropriate place on a 10 cm line with “feel strong” or “not at all” written at the ends. The degree of sensation is quantified by the location of the mark. The weight of the container and the total weight including the sample were measured in advance. The purpose of the experiment was revealed to the subject before the evaluation, and the subject determined whether to participate in the evaluation. All evaluations were performed in accordance with the principles set forth in the Declaration of Helsinki. The Ethics Review Committee of Yamagata University has confirmed that the ethics and safety of this study are acceptable.
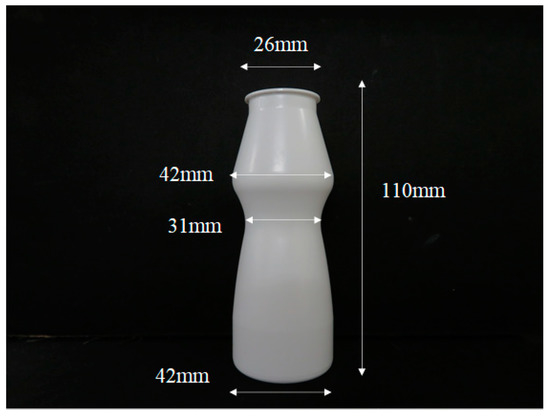
Figure 2.
Image of the container.
3. Results and Discussion
3.1. Sensory Evaluation during the Pouring Process
Figure 3 shows the sensory evaluation scores when the thickened aqueous solution was poured into a beaker. In this figure, small and large circles are raw data and arithmetic mean of all subjects, respectively. The highest and lowest scores of ease of pouring were 8.9 ± 1.6 of water (a, 0.890 mPa·s) and 2.1 ± 1.6 of the 5 wt% thickened aqueous solution (f, 1836 mPa∙s), respectively. The highest scores for “sense of speed” and “running out of liquid” were 9.2 ± 1.0 and 9.2 ± 1.1 for water (a), respectively. These scores decreased with increasing viscosity. Conversely, the highest score of residual feeling of liquid was 8.3 ± 2.2 of the 5 wt% thickened aqueous solution (f): this score increased as the viscosity increased.
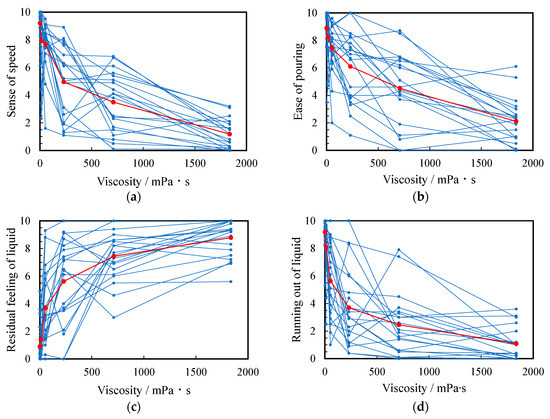
Figure 3.
Relationship between viscosity and score of (a) ease of pouring, (b) sense of speed, (c) residual feeling of liquid, and (d) running out of the liquid. The score for all subjects and their arithmetic mean are plotted as small blue and large red circles, respectively.
3.2. In-Situ Observation of the Pouring Process
Based on the high-speed observation, when the subjects poured the thickened aqueous solution into the beaker, the pouring process was classified into three states. The pouring time was defined as zero when the liquid first came out from the container. Figure 4 shows the images at 5, 10, and 15 s after a subject (ID14) poured the 3 wt% thickened aqueous solution (d, 230.4 mPa∙s) into the beaker. At 5 s after the start of pouring, the pouring was in “the flowing state” in which the liquid flows vigorously (state I). At 10 s and 15 s, it was in “the yarning state” (state II) in which the liquid towed and stretched and “the dripping state” (state III) in which the liquid flowed as a droplet, respectively. Figure 5 shows the change in the pouring state, the tilting angle of the container θ, and the weight of the thickened aqueous solution in the beaker w. In the case of d, when θ at the beginning of pouring was 63.7°, the pouring of the thickened aqueous solution into the beaker started, and the weight w reached 90 g at 9.0 s (state I). Then, when the angle was 132.2°, the state II was found in which the thickening aqueous solution towed the yarn. Under this state, the weight w was almost constant at 93 g. Furthermore, at 12.4 s, the state was changed to the dripping state (state III). The change from a flowing state to a dripping state through a yarning state was observed at thickener concentrations of 2, 3, and 4 wt% (Figure 5 c, 230.4 mPa∙s, d, and e, 710.7 mPa∙s).
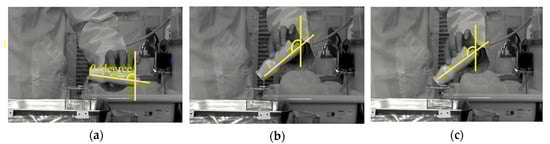
Figure 4.
Image of the pouring process at 5, 10, and 15 s after a subject (ID14) poured the 3 wt% PEG500,000 aqueous solution (d) into a beaker: (a) The flowing state, (b) yarning state, and (c) dripping state. Yellow lines show measured angle of container during pouring process.
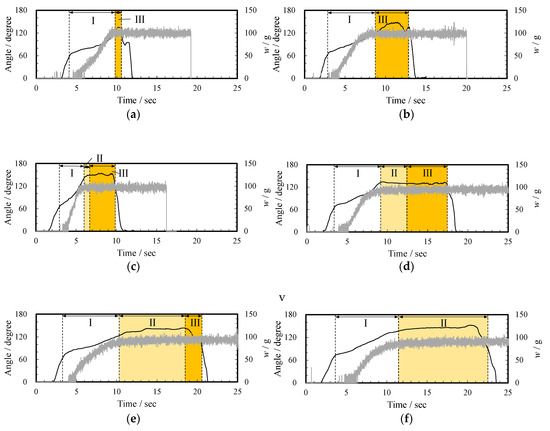
Figure 5.
Relationship between angle (black line), weigh change (gray line), (a) pouring state when a subject (ID14) poured water (a); (b)–(f) pouring state when a subject (ID14) poured 1–5 wt% thickened aqueous solutions (b–f), respectively: (I) The flowing state, (II) yarning state, and (III) dripping state.
The pouring condition of water (a) and 1 wt% thickened aqueous solution (b, 12.15 mPa∙s) changed directly from the flowing state (state I) to the dripping state (state III). In the case of water, the pouring of the thickened aqueous solution into the beaker started when θ was 59.0°. The weight w reached 94 g at 9.0 s. Further, in the case of a 5 wt% thickened aqueous solution (f, 1836 mPa·s), the state changed from the flowing state to a yarning state, and this state continued until the process was completed. In this case, the droplet state was not observed. That is, when θ at the start of pouring was 72.1° at zero s, the pouring of the thickened aqueous solution into the beaker started. The weight w reached 85 g at 11 s (I the flowing state). Then, when the angle was 137.0°, state II was found in which the thickened aqueous solution towed the yarn. Here, since the test subjects returned the container during the yarning state, the dripping state (state III) was not observed (Figure 5f).
3.3. Quantitative Analysis of the Pouring Process
As mentioned in Section 3.2, the flowing condition changed from the flowing state to the dripping state through the yarning state. Figure 6 shows the effect of viscosity on the pouring time ttotal, which is the time required to pour the thickened aqueous solution into the beaker. The parameter ttotal gradually increased as the viscosity increased and was 5.5 ± 2.8 s for a (0.890 mPa∙s) and 21.9 ± 11.6 s for f (1836 mPa∙s). The time for the flowing state (state I) and dripping state (state III), tI and tIII, increased from 4.7 ± 2.4 to 7.1 ± 4.2 s and from 0.8 ± 1.1 to 1.9 ± 3.2 s, respectively. Even if the viscosity increased from 0 to 5 wt%, the time change of state I and III was several seconds. However, a significant change was observed in the time tII of a yarning state (state II). The time tII increased as the viscosity increased and was 12 s for 5 wt% thickened aqueous solution (f).
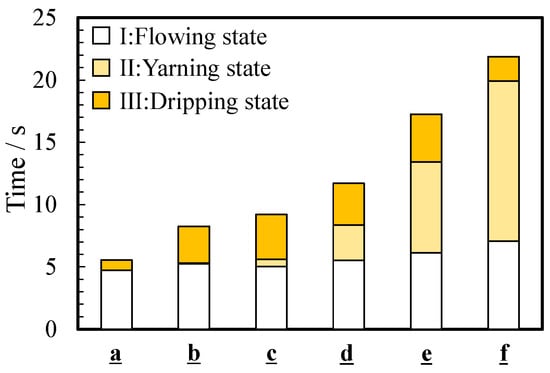
Figure 6.
Average time for three states during pouring: (I) flowing state, (II) yarning state, and (III) dripping state.
The viscosity also changed the residual ratio of the thickened aqueous solution remaining in the container. Figure 7 shows the relationship between the viscosity of PEG500,000 aqueous solutions and liquid residual rate in the container. The residual rate increased as the viscosity increased: 0.12%, 1.2%, 2.8%, 4.6%, 7.3%, and 10.8 % for a to f, respectively. The increase in the residual rate was caused by the stronger adhesion force of the thicker solutions.
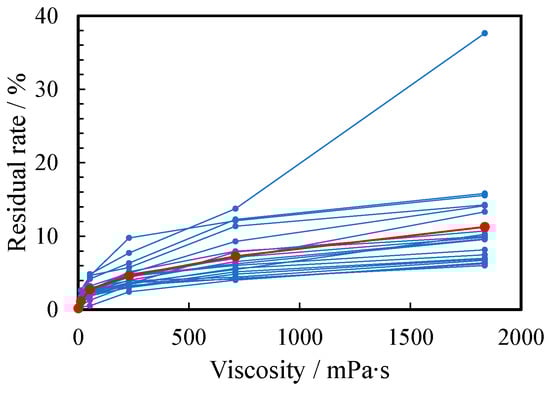
Figure 7.
Relationship between residual rate and viscosity of water (a) and 1~5 wt% PEG500,000 aqueous solutions (b–f). The scores for all subjects and their arithmetic mean are plotted as small blue and large red circles, respectively.
Figure 8a,b show the angle θ at which the liquid begins to emerge and the average angle during pouring, respectively. In the case of a, the angle at which the liquid started to emerge was 63.1°, which was the smallest. As the viscosity increased, the angle at which the liquid came out became larger because it was harder to flow: the maximum angle was 77.4° for f. In the case of the average angle during pouring, the smallest and largest angles were 96.8° and 120.8° for a and f, respectively. When the viscosity was large, the average angle was larger because the durations of the yarning state (II) and the dripping state (III), which kept the container tilted, were longer.
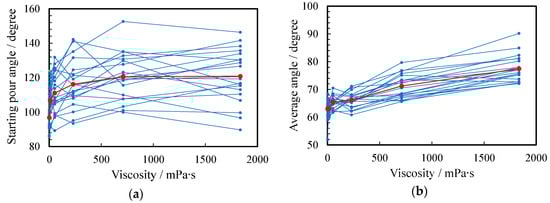
Figure 8.
Relationship between angle and viscosity. (a) Starting pour angle and (b) average angle: water (a) and 1~5 wt% PEG500,000 aqueous solutions (b–f). The scores for all subjects and their arithmetic mean are plotted as small blue and large red circles, respectively.
3.4. Controlling Factor of Ease of Pouring
To understand which factors determine the ease of pouring, we analyzed the relationship between the sensory evaluation of the ease of pouring and physical parameters. Figure 9a,b show the correlation between the ease of pouring and sense of speed, and the correlation between sense of speed and pouring angle, respectively. A strong positive correlation was confirmed between the ease of pouring and sense of speed scores at R = 0.89. Additionally, the correlation coefficient between the sensation of pouring quickly and the angle at the beginning of pouring was negative, R = −0.69. This suggests that the smaller the angle at which the liquid comes out, the faster it is poured. As described in Section 3.3, the angle at the beginning of pouring was larger for 5 wt% thickened aqueous solution (1836 mPa∙s) than that in water (0.890 mPa∙s). Water and 5 wt% aqueous solution started to flow out when the angle was 63.1° and 77.4°, respectively. These results indicate that 5 wt% thickened aqueous solution took longer to come out than the water, resulting in a reduced sense of speed. This difference in angle may also increase the time it takes for the solution to come out and may lead to a sense of frustration since the solution does not come out easily.
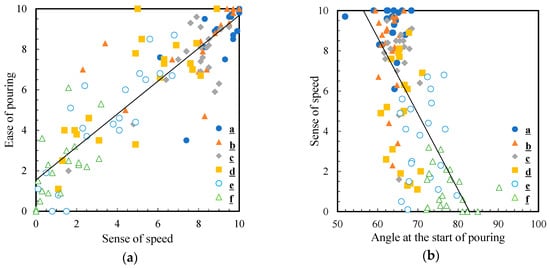
Figure 9.
Correlation diagram between (a) the ease of pouring and sense of speed and (b) sense of speed and angle at the start of pouring. The black line is the approximate straight line.
As mentioned in Section 3.2, the flowing condition changed from the flowing state to the dripping state through the yarning state. The time tII of the yarning state, which was observed when the viscosity was above 50 mPa·s (c-f), increased as the viscosity increased. Some previous studies reported the mechanism of the formation of this state. Firstly, Nakagawa showed that spinnability does not simply depend upon viscosity of liquid; a sort of “elasticity” plays a principal role in this phenomenon [12]. In the case of polymer solutions, the spinnability is related to junction formation among polymer chains [13]. The intermolecular interactions can make higher-order structures and participate not only in viscous property but also in the elastic response of polymer solutions. Malkin et al. found that a possibility of the formation of stable jets from polyethylene glycol solutions is explained by an increase of the intermolecular interactions of extended macromolecular chains, resulting in phase separation and leading to the formation of fibers created by oriented macromolecules [14].
4. Conclusions
In this work, low-viscosity and high-viscosity liquids were poured from a container into a beaker to examine the differences in their behaviors during the pouring process. We found that the pourability scores were lower for liquids with higher viscosity. The pouring process was divided into three states, and the length of state II in which the liquid was extended and flowed out affected the ease of pouring. These findings can be useful for the development of characteristic beverages and containers.
Author Contributions
Conceptualization, C.M., K.S., N.K., and Y.N.; Evaluation, C.M. and Y.N.; Investigation, C.M, K.S., N.K., and Y.N.; Writing—original draft, C.M.; Writing—review & editing, Y.N. All authors have read and agreed to the published version of the manuscript.
Funding
This work was supported by Grant-in-Aids for Scientific Research (B) (No. 18H01402) from the Ministry of Education, Culture, Sports, Science and Technology, Japan (MEXT).
Conflicts of Interest
The authors declare no conflict of interest. The funders had no role in the design of the study; in the collection, analyses, or interpretation of data; in the writing of the manuscript, and in the decision to publish the results.
References
- Spence, C.; Wan, X. Beverage perception and consumption: The influence of the container on the perception of the contents. Food Qual. Prefer. 2015, 39, 131–140. [Google Scholar] [CrossRef]
- Piqueras-Fiszman, B.; Spence, C. The influence of the feel of product packaging on the perception of the oral-somatosensory texture of food. Food Qual. Prefer. 2012, 26, 67–73. [Google Scholar] [CrossRef]
- Langfield, T.; Pechey, R.; Pilling, M.; Marteau, T.M. Impact of glass shape on time taken to drink a soft drink: A laboratory-based experiment. PLoS ONE 2018, 13, e0202793. [Google Scholar] [CrossRef] [PubMed]
- Kohira, M.; Magome, N.; Kitahata, H.; Yoshikawa, K. Plastic bottle oscillator: Rhythmicity and mode bifurcation of fluid flow. Am. J. Phys. 2007, 75, 893–895. [Google Scholar] [CrossRef]
- Belair, L.G.; Bourget, M.; Villaume, S.; Jeandet, P.; Pron, H.; Polidori, G. On the losses of dissolved CO2 during champagne serving. J. Agric. Food Chem. 2010, 58, 8768–8775. [Google Scholar] [CrossRef] [PubMed]
- Chihara, T.; Yamazaki, K.; Itoh, R.; Han, J. Evaluation of drinking ease relative to the opening diameter and beverage type of aluminum beverage bottles. J. Food Eng. 2009, 95, 264–271. [Google Scholar] [CrossRef][Green Version]
- Takagi, D.; Huppert, H.E. Pouring viscous fluid out of a tipped container in minimal time. Phys. Rev. E 2011, 84, 035303. [Google Scholar] [CrossRef] [PubMed]
- Zhan, X.; Shen, B.; Sun, Z.; He, Y.; Shi, T.; Li, X. Numerical study on the flow of high viscous fluids out of conical vessels under low-frequency vibration. Chem. Eng. Res. Des. 2018, 132, 226–234. [Google Scholar] [CrossRef]
- Kestin, J.; Sokolov, M.; Wakeham, A.W. Viscosity of liquid water in the range −8 °C to 150 °C. J Phys. Chem. Ref. Data 1978, 7, 940–948. [Google Scholar] [CrossRef]
- Waga, M.; Aita, Y.; Noma, J.; Kikuchi, T.; Nonomura, Y. Scissors-type haptic device using magnetorheological fluid containing iron nanoparticles. Technologies 2018, 6, 66. [Google Scholar] [CrossRef]
- Waga, M.; Aita, Y.; Noma, J.; Nonomura, Y. Tactile feels in grasping/cutting processes with scissors. Technologies 2019, 7, 26. [Google Scholar] [CrossRef]
- Nakagawa, T. Spinnability of Liquid. A visco-elastic state. I. Spinnability and anomalous viscosity. Bull. Chem. Soc. Jpn. 1952, 25, 88–93. [Google Scholar] [CrossRef]
- Hashimoto, K.; Imae, T. The spinnability of aqueous polymer solutions. Polym. J. 1990, 22, 331–335. [Google Scholar] [CrossRef][Green Version]
- Malkin, A.Y.; Semakov, A.V.; Skvortsov, I.Y.; Zatonskikh, P.; Kulichikhin, V.G.; Subbotin, A.V.; Semenov, A.N. Spinnability of dilute polymer solution. Macromolecules 2017, 50, 8231–8244. [Google Scholar] [CrossRef]


Publisher’s Note: MDPI stays neutral with regard to jurisdictional claims in published maps and institutional affiliations. |
© 2020 by the authors. Licensee MDPI, Basel, Switzerland. This article is an open access article distributed under the terms and conditions of the Creative Commons Attribution (CC BY) license (http://creativecommons.org/licenses/by/4.0/).