Abstract
This paper presents the development and cloud deployment of a system for the segmentation of electromyographic (EMG) signals oriented toward muscle fatigue monitoring in the biceps and triceps. A dataset of 30 subjects was used, resulting in 120 EMG and gyroscope files containing between four and six strength exercise series each. After a quality assessment, approximately 80% of the signals (95 files) were classified as level 1 or 2 and considered suitable for segmentation and subsequent analysis. A near real-time segmentation algorithm was designed based on signal envelopes, sliding windows, and quantile thresholds, complemented with discrete wavelet transform (DWT) filtering. Using EMG alone, segmentation accuracy reached 83% for biceps and 54% for triceps; after incorporating DWT preprocessing, accuracy increased to 87.5% and 71%, respectively. By exploiting the gyroscope’s X-axis signal as a low-noise reference, the optimal configuration achieved an overall accuracy of 80%, with 83.3% for biceps and 76.2% for triceps. The prototype was deployed on Amazon Web Services (AWS) using EC2 instances and SQS queues, and its computational cost was evaluated across four server types. On a t2.micro instance, the maximum memory usage was approximately 219 MB with a dedicated CPU and a maximum processing time of 0.98 s per signal, demonstrating the feasibility of near real-time operation under conditions with limited resources.
1. Introduction
In recent decades, contemporary lifestyles have led to a substantial increase in sedentary behavior and stress, contributing to a growing prevalence of noncommunicable chronic diseases worldwide. The World Health Organization (WHO) estimated that, in 2022, cardiovascular diseases caused 19.8 million deaths, accounting for approximately 32% of all global mortality, with 85% attributable to myocardial infarction and stroke, establishing them as the leading cause of death [1]. The WHO also recommends that adults engage in 150 to 300 min of moderate physical activity per week, or 75 to 150 min of vigorous activity, complemented by strength training at least twice a week [2]. Evidence indicates that strength exercise improves cardiometabolic and neuromuscular health; however, performing it without adequate control increases the risk of muscle fatigue and injury, highlighting the need for objective and real-time monitoring.
Muscle fatigue, understood as the transient inability of a muscle to maintain a given contraction intensity that is reversible with rest, is a common phenomenon during intense or prolonged strength training [3]. Although it does not always represent a serious medical condition, accumulated fatigue can increase the risk of injury, reduce performance, and affect training adherence. Therefore, objective and real-time monitoring becomes a key tool for preventing harm and optimizing exercise routines. In this context, surface electromyography (sEMG) has emerged as an effective technique for assessing muscle electrical activity through surface or intramuscular electrodes. The processing of these signals, which involves stages such as filtering, amplification, segmentation, and feature extraction, enables the development of automatic systems for detecting and characterizing muscle states.
A recent review synthesizes processing, feature extraction, and classification approaches for estimating fatigue from sEMG, highlighting the shift toward machine learning and deep neural network models [4]. In parallel, onset detection (that is, the automatic identification of activation start and end points) remains a methodological bottleneck. A review conducted by the authors in [5] systematizes existing methods and concludes that techniques based on simple, dual, or adaptive thresholds provide high accuracy and low latency, making them suitable for real-time implementation.
Moreover, inter-subject generalization in myoelectric recognition remains a challenge; models trained in laboratory settings often degrade in performance when deployed to unseen users. In response, multi-source domain adaptation and domain generalization frameworks have been proposed to align distributions across subjects and improve cross-user performance without requiring extensive retraining [6]. Complementarily, active learning and regularization strategies have been shown to reduce calibration effort and make inference more robust in real-world scenarios [7].
A closely related aspect is robustness to variations in electrode placement and limb condition. Small deviations in electrode position or posture can significantly alter the distribution of the sEMG signal and, consequently, the accuracy of classifiers. This limitation has motivated the development of systematic electrode-placement protocols and specific mitigation strategies [8].
In the field of segmentation and preprocessing, established approaches include envelope extraction on the rectified signal to separate rest and contraction, as well as noise reduction using dedicated filters or the discrete wavelet transform (DWT) to improve the signal-to-noise ratio before segmentation [9]. Recent studies describe implementations of these methods optimized for low-cost and low-power platforms [10], which are relevant for embedded systems and continuous operation, and confirm that DWT and related approaches are still successfully employed for filtering and for improving classification performance [11,12].
In a complementary way, the availability of wearable sensors and the integration of sEMG with inertial measurement units (IMUs) have driven multimodal solutions for fatigue detection and motor control in sports, ergonomics, and rehabilitation [13]. Recent reviews have mapped the ecosystem of upper-limb wearables, their instrumentation, and the challenges of clinical and industrial integration [14], while other studies show that combining sEMG and IMU signals with deep learning architectures such as CNN–LSTM with attention mechanisms improves the discrimination of fatigue states [15]. The community is also advancing in the development of open datasets that integrate EMG, IMU, and photoplethysmography (PPG) signals [16], which facilitates reproducibility and comparison across algorithms.
In terms of deployment, real-time feasibility requires low-power pipelines with reduced latency. Several studies report embedded implementations with optimized frequency-domain analysis and multichannel acquisition, as well as edge-cloud architectures that balance latency, energy consumption, and operating cost, which are necessary conditions for scaling to clinical or production environments [17,18,19]. In parallel, systematic comparisons of feature selection methods for sEMG identify efficient configurations when end-to-end deep learning is not used, which is particularly useful for resource-constrained devices [20].
Based on the reviewed evidence, three recurrent challenges can be identified in the state of the art: (i) the effective integration of acquisition, segmentation, feature extraction, and classification of EMG signals into automated pipelines that are compatible with near real-time operation; (ii) the need for segmentation strategies that perform consistently in the presence of signal variability associated with different subjects and recording conditions; and (iii) the limited and often fragmented evaluation of computational cost and resource usage when these systems are deployed on cloud or distributed computing infrastructures. In this context, the present work does not aim to propose a new wavelet technique or a novel motion sensing algorithm. Instead, it focuses on designing and validating a reproducible computational architecture that automates the processing and segmentation of sEMG signals oriented toward muscle fatigue monitoring during strength exercises, and on characterizing its technical performance and computational footprint.
The proposed approach builds on established methods and combines a segmentation algorithm that integrates DWT-based filtering with a quantile-based thresholding strategy applied to the signal envelope, adjusted according to the muscle group under study, with an alternative segmentation method driven by inertial gyroscope signals. This processing pipeline is implemented and evaluated on an Amazon Web Services (AWS) environment using a publicly available database of EMG and gyroscope signals collected under a controlled protocol with 30 participants. On top of this architecture, segmentation accuracy metrics and computational cost metrics (processing time and resource consumption across different cloud server types) are analyzed to assess its feasibility for near real-time fatigue monitoring. Rather than introducing new feature extraction or classification algorithms, the study provides a functional and documented prototype that includes feature extraction and can be readily extended with classification modules, outlining a replicable pathway for future developments in sports, rehabilitation, and injury prevention, as well as for subsequent adaptation to portable or embedded systems.
Contributions of This Work
Although the individual signal processing techniques used in this study, such as wavelet filtering and envelope-based thresholding, are well established in the literature, the contribution of this work lies in the integration, systematic evaluation, and operational validation of a complete EMG segmentation pipeline designed for near real-time fatigue monitoring. The main contributions are as follows:
- 1.
- Muscle-adaptive segmentation framework.
The study evaluates the interaction between wavelet decomposition levels, envelope extraction, and quantile-based thresholding for biceps and triceps, showing how muscle-specific tuning improves segmentation robustness and offering a reproducible procedure for parameter optimization.
- 2.
- Inertial-guided segmentation alternative.
An additional segmentation strategy based on gyroscope signals is analyzed, supported by explicit evidence of temporal alignment with EMG activity, providing a complementary option for cases with signal degradation or multimodal monitoring needs.
- 3.
- End-to-end cloud-based EMG processing architecture.
The complete pipeline, including segmentation, feature extraction, and a lightweight prediction block, is implemented and validated in AWS, demonstrating operational feasibility and offering a deployable prototype for future extensions.
- 4.
- Systematic computational cost assessment across cloud tiers.
The work quantifies execution time, CPU and RAM usage, and variability across four AWS instance types, providing practical insights into resource allocation and identifying the limitations of virtualized environments for lightweight EMG workloads.
- 5.
- Reproducibility through the use of a public EMG–IMU dataset.
All experiments rely on an open-access dataset with labeled contractions, accompanied by clear methodological documentation, enabling reproducibility and transparent comparison with future studies.
2. Materials and Methods
2.1. Data Acquisition and Study Population
The database used in this study was collected during the first phase of the research project, with the support of the Magma Ingeniería research group at the Universidad del Magdalena [21]. Data acquisition was carried out using an embedded system specifically designed and built by the research team; its architecture and operation are described in Section 2.5.1.
Two specific strength exercises were implemented for signal acquisition, as illustrated in Figure 1: concentration curl for the biceps and dumbbell kickback on a bench for the triceps. Participants performed both exercises using different load levels with dumbbells. Each subject completed between four and five sets of ten repetitions per exercise, with 30 s of rest between sets, in order to induce acute muscular fatigue. Electrodes were placed following the recommendations of the SENIAM guidelines for upper-limb muscles [22]. For both the biceps brachii and triceps, the electrodes were positioned over the muscle belly, aligned with the fiber orientation, with a reference electrode placed on a nearby bony area to ensure proper impedance and an adequate signal-to-noise ratio.

Figure 1.
Strength exercises selected for this study: (a) Concentration curl for the biceps; (b) Dumbbell kickback for the triceps.
The study involved 30 volunteers, including 24 males and 6 females, aged between 17 and 32 years. All participants performed physical activity at least three times per week. Surface EMG signals were recorded from the biceps and triceps muscles of each subject. The selection aimed to maintain a degree of physical variability to ensure inter-subject differences in the signals. Table 1 summarizes the general characteristics of the participants, including sex, age, body weight, height, number of weekly routines, and the loads used for biceps and triceps. Values are reported as mean ± standard deviation (minimum–maximum).

Table 1.
General characteristics of the participants in the study.
The dataset used in this study, which contains EMG signals and their corresponding labels, is publicly available on Mendeley Data [21], allowing its use in future research.
2.2. EMG Signal Quality Assessment
Based on the conditions previously described, a dataset of 120 signal recordings was generated, each corresponding to one muscle (biceps or triceps) and one participant. Each file consists of four columns: one sEMG channel and the kinematic components of the gyroscope along the X, Y, and Z axes, as illustrated in Figure 2. By design, each recording contains four to five exercise sets per muscle and per subject. After a detailed inspection, it was verified that none of the files contained missing or null values.
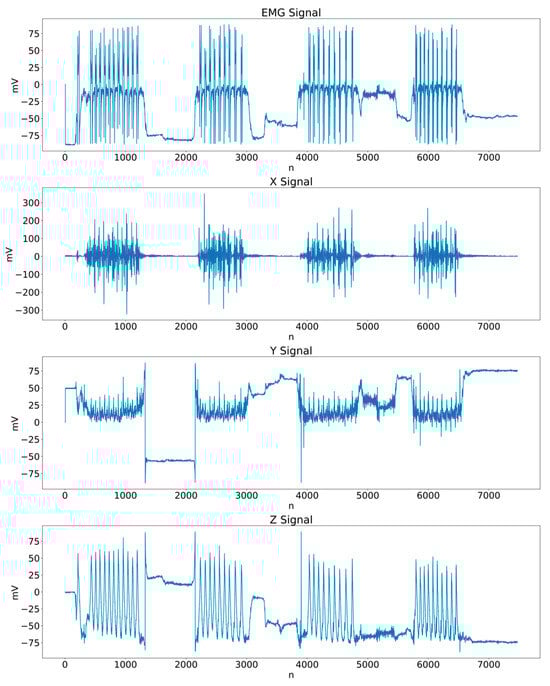
Figure 2.
Example of a biceps recording (Subject 1), including the sEMG channel and the kinematic components along the X, Y, and Z axes.
Regarding the length of the recordings, values ranged between 7473 and 14,999 samples, with an average of 10,931 samples per file. Figure 3 shows the histogram of the distribution of signal lengths. A concentration can be observed around values close to the mean, while longer recordings generally correspond to files containing five or more series.
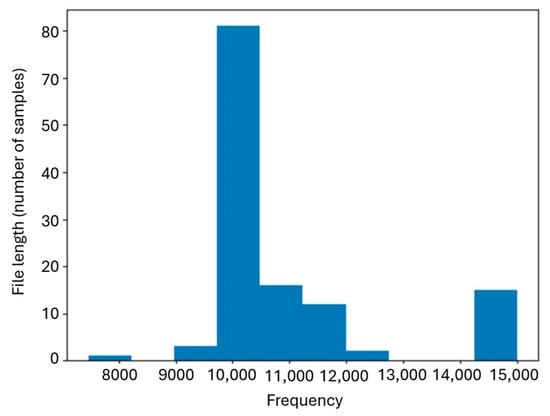
Figure 3.
Histogram of file lengths expressed as number of samples.
Importantly, this variability in total file duration does not affect the segmentation window parametrization. The proposed segmentation method processes the signal sample-by-sample through envelope computation and adaptive thresholding, eliminating the need for fixed-length segmentation windows. Consequently, recordings of different lengths (from approximately 7400 to 15,000 samples) are handled uniformly, and segmentation robustness remains unaffected by the distribution of file lengths.
As part of the quality assurance process, each EMG signal was visually inspected to assess its suitability for subsequent segmentation and classification stages. This evaluation served as a preliminary filter to distinguish signals that could be used directly from those requiring preprocessing or exclusion. To standardize this procedure, three qualitative levels were defined based on the visibility of active and rest periods, the presence of artifacts, and the overall signal-to-noise ratio (See Table 2). The distinction between Level 2 and Level 3 was made explicitly based on the inability to visually identify either the active or the resting phases in a reliable manner; that is, a signal was assigned to Level 3 whenever at least one of these segments could not be clearly detected due to noise dominance, even if some parts of the recording appeared interpretable.
Table 2.
Qualitative levels for the visual evaluation of EMG signals.
The visual inspection revealed that most of the recordings contained four series per file, as summarized in Table 3.
Table 3.
Number of series per signal file.
To further assess suitability for segmentation and classification, each EMG signal underwent qualitative evaluation based on visual criteria. The resulting distribution per quality level is presented in Table 4. A total of 43 signals were classified as Level 1, 52 signals as Level 2, and 25 as Level 3. Thus, approximately 80% of the dataset (Levels 1 and 2) was considered suitable for direct processing or after basic cleaning procedures.
Table 4.
Distribution of signal files according to quality level.
This distribution confirms that the majority of the dataset is usable and supports the feasibility of applying segmentation and subsequent analysis without discarding a significant portion of data.
Additionally, signal quality was quantitatively assessed using the signal-to-noise ratio (SNR) metric to validate the consistency between the visual inspection and the level of interference present in the signals. Figure 4 presents a box plot of SNR for each of the three qualitative levels. The results confirm that Level 3 signals exhibit, on average, the lowest SNR values, whereas Levels 1 and 2 concentrate higher values, supporting the visual criterion used to distinguish acceptable signals from those in which activity or rest phases could not be reliably identified. It is important to note that SNR was not used as a decision threshold for assigning the levels; instead, it served as a consistency check after the qualitative labeling. Moreover, some Level 2 signals present relatively high SNR values and could therefore be retained after basic preprocessing, while a few outliers in Level 3 show unexpectedly high SNR values, suggesting potential usefulness in recognition tasks after appropriate filtering.
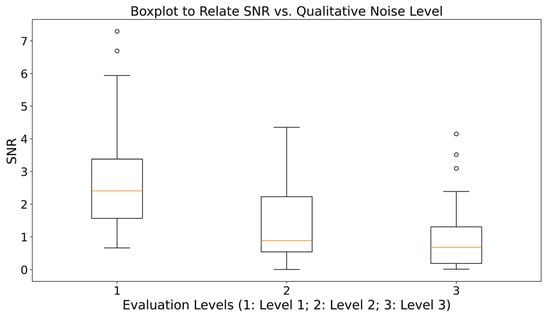
Figure 4.
Box plot of SNR as a function of signal quality level (Circles indicate outlier values lying outside 1.5 times the interquartile range).
2.3. EMG Signal Segmentation Algorithm
In this stage, the problem of segmenting EMG signals was addressed with the objective of identifying intervals corresponding to voluntary muscle activity while excluding resting periods. An initial literature review was conducted focusing on recent studies that propose EMG segmentation algorithms designed for near real-time applications, prioritizing those with methodologies compatible with the acquisition and processing scheme of this work. The approaches analyzed include discrete wavelet transform (DWT), rectification and envelope extraction, adaptive thresholding, and statistical analysis over sliding windows.
Based on this analysis, robust and computationally lightweight strategies were selected as the foundation for the segmentation algorithm implemented in this study. The first family of methods employs the DWT as a preprocessing stage to attenuate noise components associated with electrical interference, electrode movement, and anatomical variability, prior to applying decision rules over sliding windows. The second family of approaches operates directly on a rectified signal, from which an envelope is computed using moving averages. This envelope highlights sustained increases in amplitude that are characteristic of muscle contractions and enables the definition of threshold conditions to determine the onset and offset of each active segment.
In this study, a segmentation scheme based on the signal envelope was adopted, using adaptive thresholds defined from quantiles and optionally incorporating DWT preprocessing as a noise reduction stage. The activity condition is formulated over local windows, which allows the algorithm parameters to be adjusted to the characteristics of each subject and each muscle group (biceps and triceps). These strategies are computationally simple and require only local operations over windows, which favors their implementation in near real-time processing environments. Figure 5 shows an example of a biceps EMG signal from one of the participants, where the muscle activity segments that the segmentation algorithm must automatically detect are visually identifiable.
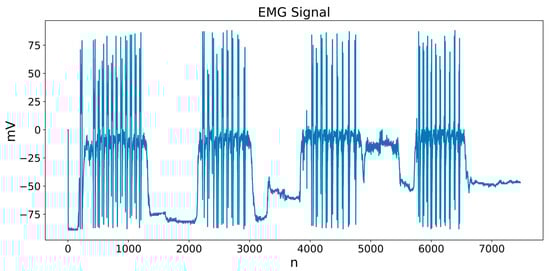
Figure 5.
Example of a biceps EMG signal with visible muscle activity segments.
2.4. Implementation of the Segmentation Algorithm
The segmentation of electromyographic (EMG) signals is a fundamental stage for identifying periods of muscle activation, allowing the extraction of only the relevant fragments for subsequent analysis and classification. The procedure developed in this study is based on an envelope detection strategy combined with adaptive thresholds, which are adjusted according to muscle type and subject. This enables the system to adapt to individual acquisition conditions. The algorithm consists of the following stages: signal rectification, envelope calculation, thresholding and segmentation, and parameter adjustment through a sensitivity analysis.
Figure 6 illustrates the flowchart of the segmentation strategy employed. The diagram highlights the sequential operations applied to the raw EMG signal, which include filtering, rectification, envelope generation, threshold calculation, and binary segmentation.
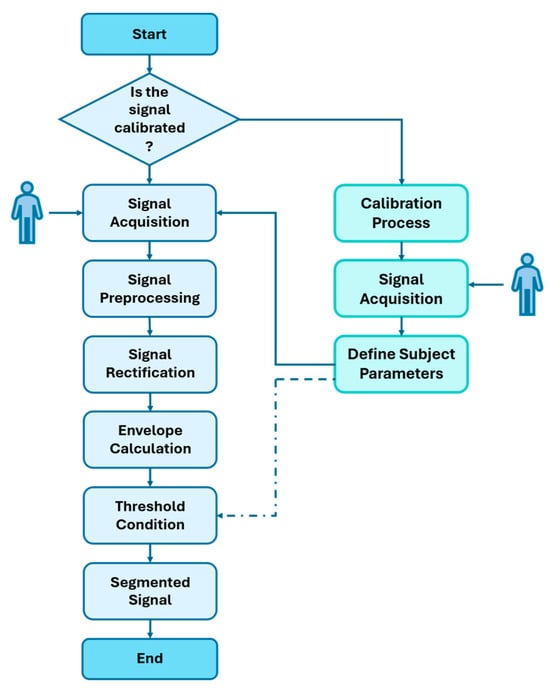
Figure 6.
General diagram of the EMG signal segmentation algorithm.
2.4.1. Rectification and Envelope Calculation
The EMG signal is first rectified using a squared operation to ensure positive magnitudes and emphasize muscle activation peaks. The rectification is defined by:
where represents the raw EMG signal and is the rectified signal obtained point by point. This operation was implemented in Python (v3.9) using a custom function, developed without external libraries, which receives a data series and returns another of the same length.
Figure 7 shows an example of an original EMG signal and its rectified version. It can be observed that the negative values are transformed into positive ones on the Y-axis, while the temporal structure of each active segment remains unchanged on the X-axis. This ensures that the rectified signal can be reliably used as a reference for the subsequent stages of the segmentation algorithm.
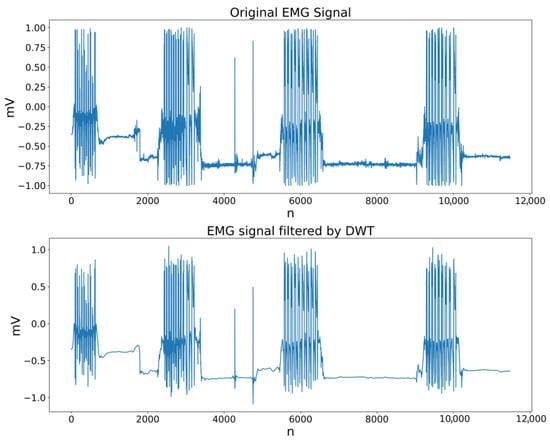
Figure 7.
Comparison between the original EMG signal and its rectified version.
Based on the rectified signal, the upper and lower envelopes were computed using sliding windows of size , applying maximum and minimum operators, respectively. For each sample , the upper envelope and the lower envelope were defined as follows:
The difference between both envelopes enhances the contraction periods by attenuating the background noise. Figure 8 illustrates this process: panel (a) shows the raw EMG signal, panel (b) depicts the upper and lower envelopes, and panels (c) and (d) display the resulting envelope superimposed on the rectified and original signals, respectively. This silhouette exhibits clear amplitude rises during activation intervals, facilitating the subsequent detection of active segments.
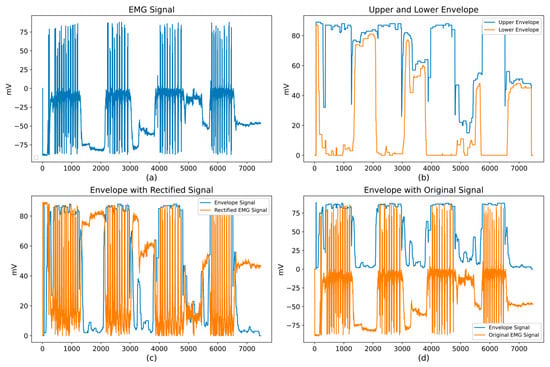
Figure 8.
Stages for computing upper and lower envelopes: (a) Raw EMG signal; (b) Upper and lower envelopes; (c) Envelope over the rectified signal; (d) Envelope over the original signal.
The window size has a direct impact on the smoothness of the envelope and on the sensitivity of the detector. Large values of generate smoother envelopes but tend to include portions of resting activity at the edges of each active segment, while very small values produce noisier envelopes and an excessive number of detected segments.
Although Figure 8 presents both the upper and lower envelopes for visualization purposes, the segmentation stage relies exclusively on the upper envelope computed from the rectified signal. Therefore, occasional intersections between the envelopes, typically occurring in low-amplitude or noisy regions, do not affect the output of the algorithm. The rectification step ensures that the envelope remains strictly non-negative, while the moving-window smoothing mitigates abrupt fluctuations. In addition, the adaptive quantile-based threshold prevents spurious activations by adjusting to the local amplitude distribution. Taken together, these mechanisms provide stable segmentation even when envelope distortions appear in noisy portions of the signal.
Having clarified the behavior of the envelope under noisy conditions, the next step was to determine an appropriate window size for the smoothing operation. To select this value, window sizes between 100 and 1200 samples were evaluated with increments of 50. The segmentation accuracy was computed for each window size and for each muscle group. Figure 9 shows the accuracy trends as a function of window size for biceps, triceps, and for the complete set of signals. For the biceps, the highest accuracy is observed around a window size of 500 samples; however, the performance at 300 samples remains within approximately 5–10% of the maximum accuracy. In contrast, the triceps exhibits a more irregular trend and experiences a noticeable decrease in accuracy when the window increases to 500 samples. Moreover, larger windows introduce resting portions at the boundaries of each segment, compromising the temporal precision required for downstream analysis.
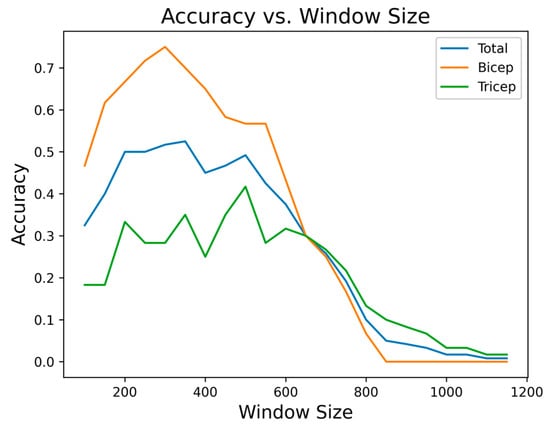
Figure 9.
Segmentation accuracy as a function of window size for biceps, triceps, and the complete set of signals.
Considering these factors, a single window size of 300 samples was adopted for the entire dataset, as it provides a stable trade-off between accuracy, robustness across muscle groups, and segment cleanliness. This value is suitable for the sampling frequency and acquisition device used in this study, although adjustments may be required in other experimental configurations. The choice also contributes to computational efficiency, which is a critical requirement for near–real-time processing.
2.4.2. Adaptive Thresholding and Final Segmentation
Once the envelope signal is obtained, adaptive thresholding is applied using a quantile-based strategy to detect and extract the segments corresponding to voluntary muscle activation. The segmentation condition is defined as follows:
where is the envelope signal, and is the resulting segmented signal. The parameter is an adaptive threshold determined per subject and muscle group, computed from the quantile of the resting and active portions of the EMG signal.
In this study, different quantile values were assigned for biceps and triceps:
For the quantile-based thresholding, the quantile was computed over the entire envelope signal of each recording rather than over isolated resting segments. This choice avoids dependency on a pre-segmentation step and reduces the impact of noisy baseline intervals, since the full-envelope amplitude distribution naturally separates low-level resting activity from high-amplitude contraction peaks. The resulting threshold is therefore derived from a stable global distribution, ensuring consistency across subjects and muscles even when some rest intervals contain moderate noise.
To select these values, segmentation accuracy was analyzed by varying the quantile between 0.05 and 1.00, using increments of 0.05. Figure 10 shows the accuracy obtained for biceps, triceps, and the complete set of signals as a function of the quantile factor. For biceps, the best results were observed between quantiles of 0.80 and 0.90, while higher quantiles yielded better discrimination of active segments in triceps. Based on this analysis, the thresholds were set to and .
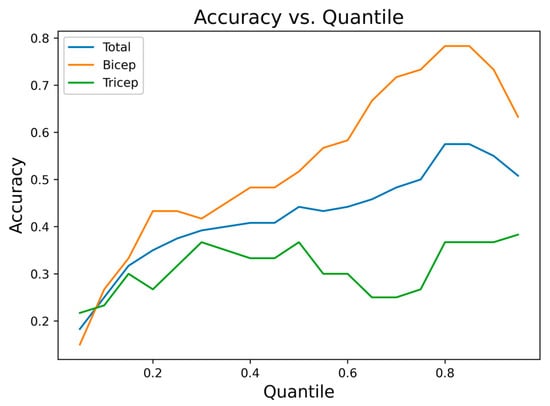
Figure 10.
Segmentation accuracy as a function of the quantile threshold for biceps, triceps, and the complete set of signals.
With these thresholds defined for each subject and muscle type, applying Equations (4) and (5) yields a binary segmented signal in which zeros correspond to resting periods and nonzero values represent active segments. The sub-vectors of containing nonzero values are extracted as individual muscle contractions and subsequently processed for feature extraction, ensuring compatibility with standard classification modules for future implementations.
During the evaluation stage, three segmentation configurations were considered:
- (i)
- Exclusive use of the EMG signal without preprocessing.
- (ii)
- EMG signal with an additional DWT-based filtering stage.
- (iii)
- An alternative approach based on the X-axis gyroscope signal, used as a kinematic reference to detect movement periods.
In all three cases, the same envelope computation and thresholding scheme described in this section was applied. The comparison was carried out based on segmentation accuracy for both biceps and triceps.
2.5. Proposed System Architecture
2.5.1. Acquisition Prototype
Data acquisition was performed using an embedded system designed and built by the authors as part of the activities of the Magma Ingeniería research group. The system is based on an ESP32 microcontroller (Espressif Systems, Shanghai, China) as the central unit, connected to an EMG sensor and a triaxial accelerometer. For EMG detection, a SEN0240 dry electrode (DFRobot, Shanghai, China) was used. This sensor includes an analog front-end with filtering, amplification, and outputs a signal within a 0 to 2 V range. According to the manufacturer, squaring the signal after digital filtering improves its readability due to the low voltage level at the output.
The accelerometer used was the ADXL335-GY61 (Analog Devices Inc., Wilmington, MA, USA), an analog sensor that outputs signals proportional to the acceleration along the X, Y, and Z axes. These signals are read by the analog to digital converter (ADC) of the ESP32 with a 10-bit resolution (range 0–1024) and subsequently scaled to a normalized range from −100 to 100 to facilitate numerical processing. Data acquisition is performed continuously at a sampling frequency configured according to the experimental requirements, and the data are transmitted to the cloud using the ESP32’s built-in Wi-Fi connectivity.
In addition to its low power consumption, the ESP32 provides an architecture well suited for IoT applications and enables the simultaneous acquisition of multiple analog channels and data transmission to remote services within a single device. The direct implementation of this system by the research team ensured full control over signal quality and facilitated seamless integration with the subsequent processing and cloud deployment stages.
2.5.2. Overall System Workflow
The proposed system follows a data flow that begins with signal acquisition using the embedded prototype described above and continues with cloud-based processing through Amazon Web Services (AWS). This enables a fully remote architecture that is decoupled from local hardware constraints. The overall architecture is shown in Figure 11, which summarizes the key components and their interaction from data acquisition to the delivery of results to the end user.
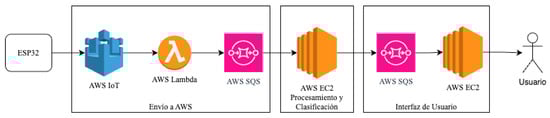
Figure 11.
Overall system architecture.
The workflow consists of the following stages:
- Data are transmitted from the ESP32 to AWS IoT Core, which handles device authentication and message reception.
- An AWS Lambda function processes the incoming messages and forwards them to an AWS SQS queue, effectively decoupling data transmission from processing.
- An Amazon EC2 instance retrieves messages from the SQS queue and executes the processing pipeline, which includes DWT-based filtering, signal rectification, envelope computation, sliding-window segmentation, and feature extraction. These features were computed as part of the pipeline to assess computational performance and ensure compatibility with subsequent classification modules. The detailed processing flow is shown in Figure 12 (Dashed blocks indicate components inherited from the original pipeline that were not assessed in this study).
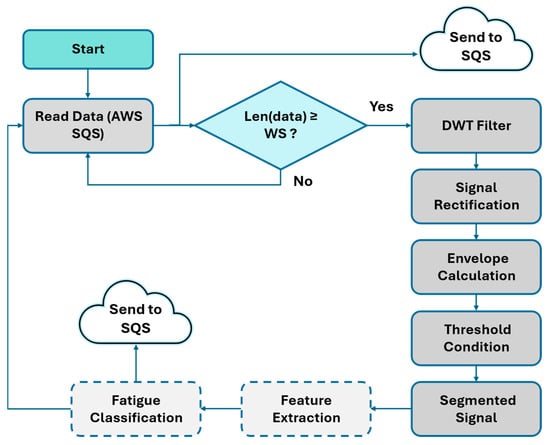 Figure 12. Cloud-based EMG processing workflow used in this work.
Each data packet arriving at the SQS queue is processed automatically. Once the signals are segmented and the features associated with each active segment are computed, the results are sent to a second SQS queue, which is consumed by an EC2 instance dedicated to the user interface. This interface, implemented in Python using the Dash framework, enables near real-time visualization of segmented EMG signals. It highlights periods of muscular activity through color-coded schemes and facilitates the analysis of muscle behavior during the exercises.
2.6. Performance Metrics
To evaluate the overall performance of the proposed system, two types of metrics were employed: segmentation accuracy and computational cost. Segmentation accuracy was calculated as the ratio between the number of correctly identified segments and the total number of real segments present in the ground-truth reference signal, according to:
This metric quantifies the ability of the system to detect relevant events in EMG signals under different preprocessing configurations and segmentation parameters, for both biceps and triceps.
In addition to segmentation accuracy, the feasibility of near real-time execution was assessed using computational cost metrics. CPU usage (%), RAM consumption (MB), and average processing time per signal file (ms) were measured while deploying the full processing pipeline (filtering, rectification, envelope estimation, and segmentation) on different Amazon EC2 instance types (t2.micro, t2.small, and t2.medium). These metrics reflect the behavior of the system within the cloud environment and allow comparisons between configurations with different resource capacities, while verifying that processing times remain within ranges compatible with near real-time operation.
Once the segmentation pipeline and the evaluation metrics were established, the system was assessed under the configurations described above. The results include both the comparative analysis of segmentation accuracy for biceps and triceps and the computational performance across different cloud-based deployment scenarios. These experiments enable a technical validation of the proposed approach and determine whether it meets the requirements for near real-time operation and seamless integration with standard feature extraction workflows. The findings are presented and discussed in the following section.
3. Results
3.1. EMG Signal Segmentation: Performance Evaluation
The performance of the segmentation algorithm was assessed using accuracy as the main metric, defined as the ratio between the correctly detected active segments and the total number of actual segments manually identified. The ground truth reference was obtained through manual annotation of all recordings by a single trained evaluator. The annotator inspected the EMG signal together with the kinematic traces and marked the onset and offset of each contraction following a predefined visual protocol. Once the full dataset was labeled, the annotations were reviewed again to ensure internal consistency. Although no multi expert consensus was used, the same procedure was applied uniformly across subjects and muscles, providing a stable reference for evaluating segmentation performance.
The analysis was performed separately for the biceps and triceps muscles, considering only signals labeled as quality levels 1 and 2. Initially, the algorithm was tested without any additional preprocessing, using a window size of 300 samples and optimal quantiles per muscle (0.85 for biceps and 0.95 for triceps). The initial results are shown in Table 5.
Table 5.
Results of the segmentation algorithm without preprocessing.
The algorithm showed adequate performance for the biceps (83%), but a limited result for the triceps (54%), reflecting the higher variability and noise typically observed in this muscle group.
To mitigate this variability and improve discrimination between rest and contraction, a preprocessing stage based on the discrete wavelet transform (DWT) was incorporated, using Daubechies-4 (db4) as the wavelet function. Decomposition levels between 1 and 6 were evaluated, where level 3 was identified as optimal for the biceps and level 2 for the triceps, as shown in Figure 13.
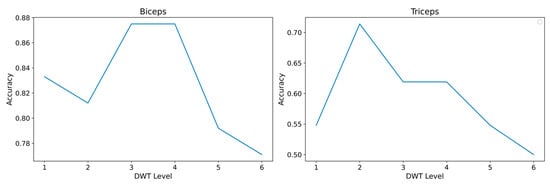
Figure 13.
Accuracy vs. DWT level for EMG signals of the biceps and triceps.
From a signal processing perspective, the DWT decomposition level controls the trade-off between noise attenuation and preservation of the temporal structure of the contractions. Higher levels produce smoother reconstructions and reduce high-frequency noise, but they also tend to smear the onset and offset of short contractions. In the biceps recordings, contractions were more regular and presented a higher signal-to-noise ratio, so a level 3 decomposition provided additional smoothing without losing relevant information at the boundaries. In contrast, the triceps signals showed shorter, more irregular bursts and a higher presence of motion artifacts and baseline fluctuations. Levels above 2 tended to merge adjacent contractions and to distort the transition between rest and activity, whereas level 2 preserved sharper transitions while still attenuating high-frequency noise. This behavior justifies the different optimal levels observed in Figure 13 and motivates the selection of level 3 for the biceps and level 2 for the triceps in the subsequent experiments.
The inclusion of DWT filtering produced a significant improvement for both muscles, particularly for the triceps. The results are summarized in Table 6.
Table 6.
Segmentation results with preprocessing.
These results show that the use of DWT increased accuracy by 4.5% for the biceps and 17% for the triceps, confirming its effectiveness in attenuating nonstationary noise and improving the detection of active segments. The difference between both muscles aligns with their physiological characteristics and with the higher presence of motion artifacts in the triceps during exercise execution.
3.2. Inertial Signal-Based Segmentation Alternative
Given the availability of inertial data from the gyroscope embedded in the acquisition system, an alternative segmentation strategy was explored using the angular signals from the X, Y, and Z axes. Figure 14 shows, in the top panel, the EMG signal for a representative biceps recording and, in the following panels, the corresponding gyroscope signals on the X, Y, and Z axes.
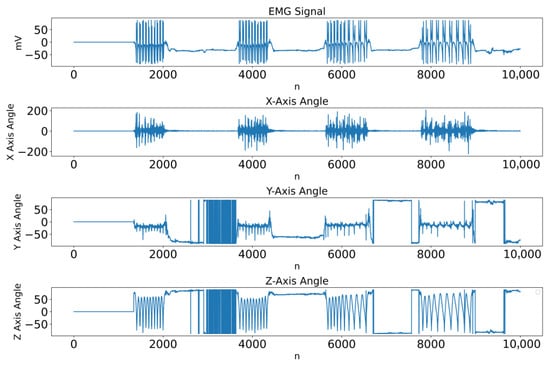
Figure 14.
EMG signal (top panel) and gyroscope signals on the X, Y, and Z axes for a biceps sample.
As can be seen in Figure 14, the bursts of EMG activity that delimit the concentric and eccentric phases of each repetition are temporally aligned with the largest positive and negative excursions of the X-axis signal. In contrast, the Y- and Z-axis traces exhibit slower postural drifts and less consistent changes across repetitions. This systematic visual correspondence between EMG bursts and X-axis deflections was observed across all subjects and motivated the selection of the X-axis as the inertial reference for the alternative segmentation strategy.
Applying the same evaluation methodology used for the EMG signal, the gyroscope signal on the X-axis was preprocessed using a DWT filter (db4), and different decomposition levels were analyzed. As shown in Figure 15, the best performance was achieved with a DWT level of 4, reaching an overall accuracy of 80%, with differentiated values of 83.3% for biceps and 76.2% for triceps.
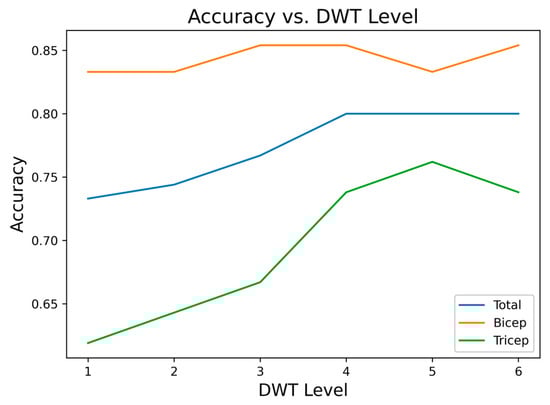
Figure 15.
Accuracy vs. DWT level for the gyroscope X-axis signal.
The selected parameters and the corresponding accuracy values are summarized in Table 7.
Table 7.
Accuracy results of the segmentation algorithm using the gyroscope X-axis signal.
These results confirm the usefulness of the gyroscope X-axis as a reliable reference for muscle activity segmentation, providing a robust alternative when the EMG signal is affected by interference, motion artifacts, or variability in electrode placement. In particular, this approach introduces a complementary mechanism that can operate effectively when EMG quality is compromised and may serve as a fallback strategy in real-world applications.
3.3. Computational Cost Evaluation
To assess the computational efficiency of the proposed system and determine its feasibility in resource-constrained environments, a performance evaluation was conducted using four types of servers with increasing CPU and RAM capacities. The analysis focused on CPU usage, RAM usage, and processing times for each processing stage, including segmentation, feature extraction, and the lightweight prediction block inherited from the original pipeline. To ensure robustness, 120 signals (EMG and gyroscope) were processed, each with four epochs, and the experiments were replicated five times for every server type.
The configurations evaluated are summarized in Table 8. Amazon Web Services (AWS) EC2 instances were used, ranging from t2.micro (1 CPU, 1 GiB RAM) to t2.xlarge (4 CPUs, 16 GiB RAM), with hourly costs between 0.0116 USD and 0.1856 USD.
Table 8.
Servers used in the computational cost evaluation.
The detailed results are presented in Table 9. On average, CPU usage was high (99.34%), indicating intensive processor utilization during system execution, although with low variability across replications. Memory usage remained low, with an average of 212.9 MB and only slight differences between servers, demonstrating an efficient use of RAM.
Table 9.
Computational cost results across server configurations.
The average total processing time per signal ranged from 814.84 ms to 979.04 ms, with an overall mean of 841.46 ms for the entire pipeline. Within this time window, segmentation was the dominant stage (average: 733.81 ms), followed by feature extraction (107.36 ms), while prediction was practically negligible in terms of computational load, with an average of only 0.34 ms.
Although classification was not included in the scope of this manuscript, a basic inference block was retained in the original cloud prototype developed during a previous phase of the project. For this reason, the computational evaluation includes the prediction stage in order to preserve the integrity of the pipeline and assess the feasibility of executing its full structure in a cloud environment. It is important to note that the present study focuses exclusively on segmentation and feature extraction; prediction is reported only as a reference for ensuring architectural consistency and enabling future deployment of classification modules.
Figure 16 provides a visual summary of CPU usage, RAM consumption and time distribution by server type. The t2.micro and t2.small instances exhibited very similar patterns across all metrics, suggesting that increasing RAM from 1 to 2 GiB does not yield substantial improvements for this workload. The t2.medium instance showed a slight reduction in total processing time. In the case of t2.xlarge, the mean processing time per signal was slightly higher than for the other instances, but the variability across the five independent runs remained small, with all values lying within an interval of approximately 15 ms around the mean. This behavior is consistent with minor scheduling and virtualization effects in a lightly loaded virtual machine and does not indicate instability of the proposed pipeline. A detailed analysis of low level hypervisor behavior is beyond the scope of this work and is noted as a limitation for future studies.
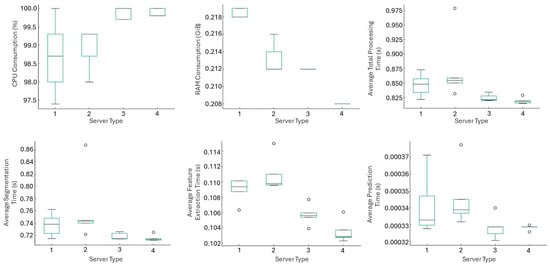
Figure 16.
Comparative visual analysis of CPU, RAM, and processing time by server type (Circles indicate outlier values lying outside 1.5 times the interquartile range).
The behavior across stages was consistent among all platforms. Segmentation remained the most computationally demanding operation, with comparable durations across instances except for the slight degradation observed on t2.xlarge. Feature extraction ranged between 102 and 115 ms, with slightly better average values on t2.micro and t2.medium. Finally, the prediction stage exhibited virtually constant times (0.00032 to 0.00037 s), showing no dependence on hardware configuration.
Overall, these findings validate the portability and efficiency of the proposed system in low-cost architectures, reinforcing its applicability in embedded devices, economical cloud servers, or hospital environments with limited computational resources. Moreover, the total processing time below one second per signal confirms the feasibility of its deployment in near real-time monitoring systems.
3.4. Computational Performance Evaluation and Cloud Deployment Feasibility
The performance assessment across different EC2 server configurations enabled the analysis of the feasibility of deploying the proposed system in a production-ready AWS environment. Key metrics were considered, including CPU usage, RAM usage, total processing time per signal, and execution times of the two main stages of the pipeline, segmentation and feature extraction, as well as the lightweight prediction block inherited from the original implementation.
The results of the analysis of variance (ANOVA), summarized in Table 10, show that the server type has a significant effect on several metrics. Statistically significant differences were observed in CPU usage (p = 0.0082), RAM usage (p < 0.00001), and feature extraction time (p = 0.00002), indicating that these components of the pipeline are sensitive to the hardware configuration. In contrast, no significant differences were found in segmentation time or in the prediction block (p = 0.0974 and p = 0.116, respectively), demonstrating that these stages are stable and computationally lightweight. The overall processing time per signal was close to the threshold of statistical significance (p = 0.0515), suggesting a moderate influence of the server type.
Table 10.
ANOVA results.
From an applied perspective, the results indicate that the AWS t2.micro instance, despite being the lowest-cost option and having limited resources, is sufficient to execute the entire pipeline in near real-time, with a maximum RAM usage of 219 MB and a single dedicated CPU. This finding is especially relevant in scenarios where cost efficiency and scalability are priorities, such as distributed embedded systems or clinical and sports applications that delegate processing to the cloud.
Furthermore, the ability to deploy the solution reliably on a decoupled infrastructure based on AWS IoT Core, Lambda, SQS, and EC2 validates not only the technical feasibility of the system but also its adaptability to modern cloud-based and edge computing architectures. The total processing time below one second per signal confirms the feasibility of integrating automatic segmentation and EMG signal analysis into near real-time monitoring applications.
Overall, these results position the proposal as a feasible, efficient, and robust solution for EMG signal processing and analysis in remote environments, establishing a foundation for future developments aimed at fatigue detection and monitoring in clinical or sports contexts with distributed deployment.
4. Discussion
The results obtained in this study demonstrate the effectiveness of an integrated approach for the automatic processing and segmentation of EMG signals oriented toward muscle fatigue detection. This approach combines efficient segmentation algorithms with a cloud-based execution architecture. The system integrates signal acquisition, data transmission through an IoT platform, and remote processing on AWS, enabling the management of continuous data streams without requiring specialized local infrastructure while maintaining response times compatible with near real-time applications.
From a signal processing perspective, one of the main contributions of this work is the use of a segmentation scheme based on DWT, rectification, and adaptive-threshold envelope computation. This strategy enabled the automatic identification of contraction intervals during biceps and triceps exercises. The systematic comparison of configurations showed that DWT-based preprocessing markedly improved segmentation accuracy compared to the use of raw EMG alone: accuracy reached 87.5% for biceps and 71% for triceps, representing increases of 4.5 and 17 percentage points, respectively. These findings are consistent with previous studies reporting that DWT effectively attenuates non-stationary noise and enhances the delineation of EMG events, particularly in muscles with higher variability and motion artifacts.
Several prior studies have investigated DWT-based denoising and envelope-based processing for EMG analysis. For example, Ranaldi et al. [9] discuss how envelope estimation choices can influence EMG amplitude interpretation, Esposito et al. [10] report robust envelope extraction and denoising strategies for human machine interfaces, and Ouyang et al. [12] presents wavelet thresholding improvements to attenuate EMG noise. In line with this literature, the present study does not claim a new wavelet formulation. Instead, its contribution is a system-level and experimental analysis of how a standard DWT plus adaptive envelope thresholding pipeline behaves across heterogeneous recordings and muscle groups, while quantifying the resulting segmentation accuracy together with computational cost under a deployable architecture.
In addition, the exploration of an alternative segmentation strategy based on gyroscope signals constitutes another relevant contribution. The X-axis of the sensor exhibited clear temporal correlation with the activation phases observed in the EMG signals and, after applying the same preprocessing scheme, achieved an overall accuracy of 80%, with 83.3% for biceps and 76.2% for triceps. While multimodal approaches combining sEMG and IMU signals are increasingly used for fatigue detection and motor control, they are often integrated at the classification stage using learning-based fusion strategies [13,14]. By contrast, this work evaluates the inertial signal as a kinematic reference specifically for the segmentation layer, showing that it can provide a reliable complementary mechanism when EMG quality deteriorates due to interference, motion artifacts, or electrode misplacement.
Regarding computational performance, the evaluation across different EC2 instances showed that the processing pipeline can be executed with an average time per signal of less than 1 s, with segmentation being the most time-consuming stage, while the lightweight inherited prediction block contributes a negligible fraction of the total time. The ANOVA analysis indicated that the server type significantly affected CPU and RAM usage, as well as feature extraction time, but did not meaningfully influence segmentation time or the lightweight prediction stage. Importantly, the AWS t2.micro instance, despite being the most limited and low-cost configuration, proved sufficient to execute the entire pipeline while keeping memory usage below 219 MB. This reinforces the feasibility of deploying similar systems on cost-efficient and scalable cloud infrastructures.
From a deployment perspective, several studies have reported embedded or edge-enabled EMG acquisition and processing pipelines that achieve real-time operation on local hardware [18,19], and broader reviews highlight the trade-offs between latency, energy consumption, bandwidth, and operating cost in edge cloud IoT analytics [17]. In this context, the cloud-based component of the present work is not intended to replace embedded execution, but to provide a replicable and scalable alternative that can be deployed without specialized local computing resources. A key added value is the quantitative benchmarking of CPU usage, memory footprint, and processing time across multiple EC2 configurations, demonstrating that near real-time execution can be achieved with sub-second latency even on low-cost cloud instances (t2.micro), which is relevant for remote monitoring scenarios where computation is centralized and device-side complexity must remain minimal.
Overall, the results consolidate the proposed system as a feasible and efficient solution for EMG signal processing and segmentation in remote environments. Although this study focused on segmentation and cloud integration, the developed pipeline provides a validated and reproducible foundation for implementing fatigue monitoring strategies and can be extended in future work to incorporate and validate task-specific classification modules or patient- and exercise-specific adaptive configurations.
5. Conclusions
This study presented a complete solution for the automatic processing and segmentation of EMG signals aimed at muscular fatigue analysis, validated through biceps and triceps strength protocols and deployed on a scalable cloud-based architecture. The system integrates data acquisition, DWT-based preprocessing, envelope computation, and adaptive segmentation within a service-oriented framework, removing the need for specialized local infrastructure.
The segmentation algorithm proved effective under real acquisition conditions. Using DWT filtering and quantile-based thresholding, the system achieved segmentation accuracies of 87.5% for biceps and 71% for triceps, while the gyroscope-based alternative reached 80% by leveraging kinematic information. These results confirm the robustness of the proposed approach and highlight the utility of inertial sensors as a complementary reference when EMG quality is affected by noise or motion artifacts. From a computational perspective, the cloud-based evaluation demonstrated that the pipeline can be executed with per-signal processing times below one second. Notably, the low-cost t2.micro instance was sufficient to run the system with less than 219 MB of RAM, reinforcing its applicability in constrained settings such as distributed devices or remote monitoring environments.
Overall, the proposal constitutes a solid foundation for remote myoelectric monitoring systems, combining robust segmentation, complementary inertial sensing, and a modular cloud architecture that can be adapted to clinical, sports, or rehabilitation applications.
Three specific future directions will be pursued: (1) implementation of a new protocol covering additional muscle groups and dynamic exercises with controlled fatigue induction; (2) integration and validation of advanced classification models (e.g., CNN and LSTM) using the current cloud-based pipeline; and (3) development of a user-oriented mobile interface followed by a pilot study with athletes and physiotherapists to assess usability and practical deployment. These advances may contribute to the development of scalable fatigue-assessment tools that speed up clinical monitoring, rehabilitation feedback, and sports performance tracking.
Author Contributions
Conceptualization, A.P. and C.R.-A.; Methodology, A.P., M.C.C. and O.R.-Á.; Software, A.P. and M.C.C.; Validation, A.P., M.C.C., L.A.R.S. and O.R.-Á.; Formal analysis, A.P. and M.C.C.; Investigation, A.P. and M.C.C.; Data curation, M.C.C.; Writing—original draft preparation, A.P.; Writing—review and editing, L.A.R.S. and C.R.-A.; Visualization, C.R.-A. and O.R.-Á.; Supervision, L.A.R.S.; Project administration, L.A.R.S. and O.R.-Á.; Resources, C.R.-A.; Funding acquisition, C.R.-A. All authors have read and agreed to the published version of the manuscript.
Funding
This research was funded by the Vicerrectoría de Investigación, Universidad del Magdalena.
Institutional Review Board Statement
The ethical approval was granted under the category of Investigación sin riesgo, according to Colombian legislation (Resolución 8430 de 1993). All procedures were carried out in accordance with the Declaration of Helsinki (1975, revised 2013).
Informed Consent Statement
Informed consent was obtained from all subjects involved in the study.
Data Availability Statement
The original contributions presented in this study are included in the article material. Further inquiries can be directed to the corresponding authors.
Conflicts of Interest
The authors declare no conflicts of interest.
Abbreviations
The following abbreviations are used in this manuscript:
| ADC | Analog-to-Digital Converter |
| ANOVA | Analysis of Variance |
| AWS | Amazon Web Services |
| CNN | Convolutional Neural Network |
| CPU | Central Processing Unit |
| DWT | Discrete Wavelet Transform |
| EC2 | Elastic Compute Cloud |
| EMG | Electromyography |
| sEMG | Surface Electromyography |
| IMU | Inertial Measurement Unit |
| IoT | Internet of Things |
| LSTM | Long Short-Term Memory |
| RAM | Random Access Memory |
| SNR | Signal-to-Noise Ratio |
| SQS | Simple Queue Service |
References
- World Health Organization Cardiovascular Diseases (CVDs). Available online: https://www.who.int/news-room/fact-sheets/detail/cardiovascular-diseases-%28cvds%29?utm_source=chatgpt.com (accessed on 14 August 2025).
- Bull, F.C.; Al-Ansari, S.S.; Biddle, S.; Borodulin, K.; Buman, M.P.; Cardon, G.; Carty, C.; Chaput, J.-P.; Chastin, S.; Chou, R.; et al. World Health Organization 2020 Guidelines on Physical Activity and Sedentary Behaviour. Br. J. Sports Med. 2020, 54, 1451–1462. [Google Scholar] [CrossRef] [PubMed]
- Behrens, M.; Gube, M.; Chaabene, H.; Prieske, O.; Zenon, A.; Broscheid, K.-C.; Schega, L.; Husmann, F.; Weippert, M. Fatigue and Human Performance: An Updated Framework. Sports Med. 2023, 53, 7–31. [Google Scholar] [CrossRef] [PubMed]
- Sun, J.; Liu, G.; Sun, Y.; Lin, K.; Zhou, Z.; Cai, J. Application of Surface Electromyography in Exercise Fatigue: A Review. Front. Syst. Neurosci. 2022, 16, 893275. [Google Scholar] [CrossRef] [PubMed]
- Carvalho, C.R.; Fernández, J.M.; del-Ama, A.J.; Oliveira Barroso, F.; Moreno, J.C. Review of Electromyography Onset Detection Methods for Real-Time Control of Robotic Exoskeletons. J. Neuroeng. Rehabil. 2023, 20, 141. [Google Scholar] [CrossRef] [PubMed]
- Zhang, X.; Wu, L.; Zhang, X.; Chen, X.; Li, C.; Chen, X. Multi-Source Domain Generalization and Adaptation toward Cross-Subject Myoelectric Pattern Recognition. J. Neural Eng. 2023, 20, 016050. [Google Scholar] [CrossRef] [PubMed]
- Ding, Z.; Hu, T.; Li, Y.; Li, L.; Li, Q.; Jin, P.; Yi, C. A Novel Active Learning Framework for Cross-Subject Human Activity Recognition from Surface Electromyography. Sensors 2024, 24, 5949. [Google Scholar] [CrossRef] [PubMed]
- Wang, H.; Li, N.; Gao, X.; Jiang, N.; He, J. Analysis of Electrode Locations on Limb Condition Effect for Myoelectric Pattern Recognition. J. Neuroeng. Rehabil. 2024, 21, 177. [Google Scholar] [CrossRef] [PubMed]
- Ranaldi, S.; Corvini, G.; De Marchis, C.; Conforto, S. The Influence of the SEMG Amplitude Estimation Technique on the EMG–Force Relationship. Sensors 2022, 22, 3972. [Google Scholar] [CrossRef] [PubMed]
- Esposito, D.; Centracchio, J.; Bifulco, P.; Andreozzi, E. A Smart Approach to EMG Envelope Extraction and Powerful Denoising for Human–Machine Interfaces. Sci. Rep. 2023, 13, 7768. [Google Scholar] [CrossRef] [PubMed]
- Boyer, M.; Bouyer, L.; Roy, J.-S.; Campeau-Lecours, A. Reducing Noise, Artifacts and Interference in Single-Channel EMG Signals: A Review. Sensors 2023, 23, 2927. [Google Scholar] [CrossRef] [PubMed]
- Ouyang, C.; Cai, L.; Liu, B.; Zhang, T. An Improved Wavelet Threshold Denoising Approach for Surface Electromyography Signal. EURASIP J. Adv. Signal Process. 2023, 2023, 108. [Google Scholar] [CrossRef]
- Hwang, S.; Kwon, N.; Lee, D.; Kim, J.; Yang, S.; Youn, I.; Moon, H.-J.; Sung, J.-K.; Han, S. A Multimodal Fatigue Detection System Using SEMG and IMU Signals with a Hybrid CNN-LSTM-Attention Model. Sensors 2025, 25, 3309. [Google Scholar] [CrossRef] [PubMed]
- Karoulla, E.; Matsangidou, M.; Frangoudes, F.; Paspalides, P.; Neokleous, K.; Pattichis, C.S. Tracking Upper Limb Motion via Wearable Solutions: Systematic Review of Research from 2011 to 2023. J. Med. Internet Res. 2024, 26, e51994. [Google Scholar] [CrossRef] [PubMed]
- Cerqueira, S.M.; Vilas Boas, R.; Figueiredo, J.; Santos, C.P. A Comprehensive Dataset of Surface Electromyography and Self-Perceived Fatigue Levels for Muscle Fatigue Analysis. Sensors 2024, 24, 8081. [Google Scholar] [CrossRef] [PubMed]
- Yasar, M.N.; Sica, M.; O’Flynn, B.; Tedesco, S.; Menolotto, M. A Dataset for Fatigue Estimation during Shoulder Internal and External Rotation Movements Using Wearables. Sci. Data 2024, 11, 433. [Google Scholar] [CrossRef] [PubMed]
- Edje, A.E.; Abd Latiff, M.S.; Chan, W.H. IoT Data Analytic Algorithms on Edge-Cloud Infrastructure: A Review. Digit. Commun. Netw. 2023, 9, 1486–1515. [Google Scholar] [CrossRef]
- Lu, C.; Xu, X.; Liu, Y.; Li, D.; Wang, Y.; Xian, W.; Chen, C.; Wei, B.; Tian, J. An Embedded Electromyogram Signal Acquisition Device. Sensors 2024, 24, 4106. [Google Scholar] [CrossRef] [PubMed]
- Chen, B.; Chen, C.; Hu, J.; Nguyen, T.; Qi, J.; Yang, B.; Chen, D.; Alshahrani, Y.; Zhou, Y.; Tsai, A.; et al. A Real-Time EMG-Based Fixed-Bandwidth Frequency-Domain Embedded System for Robotic Hand. Front. Neurorobot. 2022, 16, 880073. [Google Scholar] [CrossRef] [PubMed]
- Hellara, H.; Barioul, R.; Sahnoun, S.; Fakhfakh, A.; Kanoun, O. Comparative Study of SEMG Feature Evaluation Methods Based on the Hand Gesture Classification Performance. Sensors 2024, 24, 3638. [Google Scholar] [CrossRef] [PubMed]
- Polo, A.; Moreno-Barriga, O.; Narváez, P.; Viloria-Porto, J. EMG Dataset for Muscle Fatigue Analysis in Biceps and Triceps; Mendeley Data, V1, 2025. Available online: https://data.mendeley.com/datasets/8j2p29hnbv/1 (accessed on 12 December 2025).
- Hermens, H.J.; Freriks, B.; Disselhorst-Klug, C.; Rau, G. Development of Recommendations for SEMG Sensors and Sensor Placement Procedures. J. Electromyogr. Kinesiol. 2000, 10, 361–374. [Google Scholar] [CrossRef] [PubMed]
Disclaimer/Publisher’s Note: The statements, opinions and data contained in all publications are solely those of the individual author(s) and contributor(s) and not of MDPI and/or the editor(s). MDPI and/or the editor(s) disclaim responsibility for any injury to people or property resulting from any ideas, methods, instructions or products referred to in the content. |
© 2025 by the authors. Licensee MDPI, Basel, Switzerland. This article is an open access article distributed under the terms and conditions of the Creative Commons Attribution (CC BY) license.