Abstract
As climate disasters intensify, their financial shockwaves increasingly threaten residential stability and the resilience of the U.S. mortgage market. While prior research links natural disasters to payment delinquency, far less is known about foreclosure—the terminal outcome of housing distress. We construct a novel property-level panel covering 55 flood, wildfire, and hurricane events, integrating transactional, mortgage, and insurance data. A difference-in-differences framework compares foreclosure rates for damaged parcels with nearby undamaged controls within narrowly defined hazard perimeters. Results show that flooding substantially increases foreclosure risk: inundated properties experience a 0.29-percentage-point rise in foreclosure likelihood within three years, with effects concentrated outside federally mandated flood-insurance zones. In contrast, wildfire and hurricane wind damage are associated with lower foreclosure incidence, likely reflecting standard insurance coverage and rapid post-event price recovery. These findings suggest that physical destruction alone does not drive credit distress; rather, insurance liquidity and post-disaster equity dynamics mediate outcomes. Policy interventions that expand flood insurance coverage, stabilize insurance markets, and embed climate metrics in mortgage underwriting could reduce systemic exposure. Absent such measures, climate-driven foreclosures could account for nearly 30% of lender losses by 2035, posing growing risks to both household wealth and financial stability.
1. Introduction
1.1. Motivation
The intensification of climate-related natural disasters represents a formidable and rapidly accelerating threat to the stability of the United States housing market and the broader financial system. The economic scale of this threat has grown exponentially; while major disasters caused an average of USD 33.3 billion (inflation-adjusted to 2024 dollars) in annual losses in the 1980s, that figure has skyrocketed by 1580% to an average of USD 559.4 billion (2024 dollars) in the 2020s (). The most acute and immediate damages are borne by residential real estate, the primary store of wealth for the majority of American families. In 2022 alone, an estimated 1.9 million households were displaced by a disaster (), a figure that signals not only the expanding geographic reach of climate hazards but also a pervasive financial fragility that leaves millions at risk of permanent displacement and economic ruin.
This risk is amplified within the mortgage market, which underpins the U.S. financial system. For the 61.2% of homeowners carrying a mortgage (), a natural disaster introduces a severe financial shock that collides with the unyielding contractual obligation of monthly loan payments. Foreclosure represents the terminal stage of this distress and serves as a critical, yet not fully understood, transmission channel through which physical climate risk metastasizes into systemic financial risk. The pathway to default is paved with numerous obstacles for affected households, including significant underinsurance, bureaucratic delays in claims processing, and income shocks from disaster-induced economic disruptions. With household savings rates at historic lows and only a fraction of families maintaining dedicated emergency funds, the capacity to absorb these shocks is profoundly limited. This confluence of high-cost damages, interrupted income, and insufficient liquidity creates a direct pathway from disaster to delinquency and, for many, to foreclosure.
The stability of the multi-trillion-dollar U.S. mortgage market is predicated on the consistent performance of underlying loans. Widespread, climate-correlated defaults could threaten the solvency of mortgage lenders, servicers, and the government-sponsored enterprises (GSEs) that guarantee a vast portion of all outstanding mortgage debt. To examine this escalating challenge, we construct a parcel-level panel encompassing 55 climate events—floods, wildfires, and hurricanes (Appendix A and Appendix B)—by integrating hazard footprints with property transactions, mortgage performance records, and insurance data. To identify causal effects, we estimate a difference-in-differences model that compares damaged parcels with proximate undamaged parcels within narrowly defined hazard perimeters, incorporating parcel fixed effects and high-frequency time controls. Event-time specifications trace foreclosure dynamics over a 36-month horizon.
1.2. Research Questions
This study seeks to establish causal estimates of disaster impacts on the most severe form of mortgage distress. Our primary research questions are:
- What is the causal effect of direct exposure to a major natural disaster, specifically floods, wildfires, and hurricanes, on the risk of residential property foreclosure?
- To what extent do extreme weather damages, together with insurance coverage gaps and indirect climate pressures such as rising premiums, home-value fluctuations, and macroeconomic stress, drive foreclosures?
1.3. Contributions
This paper offers several significant contributions to the intersecting fields of climate economics, housing finance, and public policy. First, by providing a rigorous, property-level causal analysis of foreclosure across three distinct climate perils, we advance the understanding of the ultimate financial consequences of disaster exposure. Second, our work bridges the literature on property finance and spatial science by explicitly modeling the roles of insurance, income, and equity as critical mediators in the climate-foreclosure nexus. Finally, our findings yield actionable policy insights. As the landscape of property insurance shifts and federal programs like the National Flood Insurance Program (NFIP) face reform, our evidence on the efficacy of insurance mandates and the stark consequences for uninsured and low-income households provides a critical foundation for designing more resilient and equitable housing and financial policies in an era of escalating climate risk.
1.4. Paper Structure Overview
The remainder of the paper proceeds as follows. Section 2 reviews related work on climate risk, mortgage outcomes, and insurance. Section 3 documents descriptive trends around disasters. Section 4 describes data and measurement; Section 5 outlines the empirical strategy. Section 6 presents results, and Section 7 discusses mechanisms and policy implications. Section 8 concludes.
2. Literature Review
2.1. Climate Risk and Housing Markets
A foundational question in climate economics is whether financial markets accurately price long-term climate risk. Within housing markets, the primary methodological tool for investigating this question has been the hedonic pricing model, which seeks to isolate the marginal effect of risk exposure on property values. A significant body of this work confirms that, to some extent, climate risks are capitalized into real estate prices. For instance, properties located within federally designated 100-year floodplains are consistently found to trade at a discount relative to observationally equivalent homes in less risky locations (; ). However, this risk capitalization is often imperfect and temporally inconsistent. The salience of a risk, and therefore its associated price discount, tends to decay over time following a disaster event, a phenomenon often described as “disaster amnesia” (; ).
More recent and concerning scholarship has moved beyond this paradigm to argue that, far from being efficiently priced, climate risks are systematically underpriced, leading to a potential “climate housing bubble” (). This literature suggests that millions of homes, particularly those exposed to flood risk, are overvalued because their market prices do not reflect the expected future damages from climate change. () find that while sophisticated, repeat-buyer investors are beginning to price in risks like sea-level rise, the broader market lags significantly, creating a valuation gap that poses a systemic threat. The abrupt repricing of this risk, which can be triggered by a salient disaster event, can lead not only to wealth destruction for homeowners but also to a cascade of mortgage defaults that threaten financial stability. Indirect risks, such as rising insurance premiums and declining location desirability, also exert downward pressure on property values, with projections indicating significant value declines in high-risk areas over the coming decades.
Rather than assuming a uniform pathway from risk repricing to foreclosure, the consequences are mediated by the interaction of insurance, local price dynamics, and borrower balance sheets. In some cases, most notably floods where insurance penetration is thin, repricing can erode equity and contribute to foreclosure. In others, such as wildfires or hurricane winds in appreciating markets with broad insurance coverage, price rebounds can actually mitigate foreclosure risk despite severe physical damage. This paper therefore examines foreclosure as one possible, but not inevitable, endpoint of climate risk repricing.
2.2. Mortgage Outcomes After Disasters
A growing body of empirical work has established a clear link between natural disasters and adverse mortgage outcomes, primarily focusing on delinquency. A disaster imposes a multifaceted financial shock on households, combining unexpected repair costs with potential income loss and the psychological stress of recovery, all of which impair a borrower’s ability to remain current on their mortgage (). Using granular loan-level data, numerous studies have documented statistically and economically significant spikes in 30-, 60-, and 90-day delinquency rates in the months following major hurricanes and floods (; ). After Hurricane Harvey, for instance, delinquency rates in Houston surged by 300% year-over-year, the sharpest increase since the 2008 financial crisis.
Similar findings have emerged from wildfire events. () find that California wildfires lead to a significant increase in both mortgage delinquency and forbearance claims for properties within fire perimeters, with property damage being a key driver of this distress. In a complementary study, () demonstrate that these properties have an elevated risk of being priced into secondary mortgage markets, indicating that financial institutions are increasingly aware of these localized risks.
Despite this consensus on delinquency, the literature on completed foreclosures as a direct outcome of climate shocks is substantially less developed. Foreclosure is a longer-term process that follows sustained delinquency, requiring longitudinal datasets that track properties for several years post-disaster. While some work, like (), has explored how lenders adjust securitization and credit standards in disaster-prone areas, few have been able to model the full household-level progression from disaster exposure to a foreclosure sale. This study addresses this critical gap, providing a multi-peril analysis focused explicitly on foreclosure as the terminal outcome of climate-induced financial distress.
2.3. The Role of Insurance in Post-Disaster Recovery
Insurance should transform a destructive climate shock into a liquidity event rather than a credit event by financing repairs and sustaining mortgage payments (). For mortgage-backed homes, standard HO-3 policies are nearly universal but exclude flood damage—the most common and costly peril in the United States—leaving the NFIP as the primary source of coverage.
Four empirically salient features of this system shape foreclosure risk. First, coverage is incomplete: although federal law mandates NFIP policies for federally backed mortgages in Special Flood Hazard Areas (SFHAs), compliance is weak. Only ~48% of households in SFHAs maintain active coverage (), and millions more at-risk properties lie outside mapped SFHAs with no mandate at all. The depth of this gap was starkly illustrated by Hurricane Helene in 2024, where only 0.7% of homeowners in heavily flooded Buncombe County, NC, carried an NFIP policy (). Second, coverage is often inadequate: NFIP’s USD 250,000 structural cap leaves many households underinsured relative to rebuilding costs. Third, indemnity is delayed: only 61% of NFIP claims settle within 90 days, and disputes over peril attribution (e.g., wind vs. flood) frequently extend resolution well beyond six months, forcing borrowers to cover both repairs and mortgage payments during the interim. Fourth, private markets are retreating from high-risk states, raising premiums or exiting altogether, which shifts households into state-backed “insurers of last resort” with narrower protection and higher cost.
These facts directly motivate our hypotheses. Flood-exposed borrowers face elevated foreclosure risk because coverage is partial, limits are insufficient, and indemnity flows are slow. By contrast, wildfires and hurricane winds are typically covered under standard HO-3 policies, and insurance proceeds flow quickly and directly to both borrower and lender, mitigating liquidity shortfalls and insulating mortgage performance despite severe physical damage.
2.4. Identifying Causal Effects in Disaster Contexts
Establishing a causal link between disaster exposure and foreclosure is econometrically challenging. A simple comparison of outcomes between affected and unaffected areas is likely to be biased by unobserved differences; for example, properties in floodplains may differ systematically from those on higher ground in ways unrelated to the flood itself. To overcome such selection biases, researchers have increasingly turned to quasi-experimental methods, with the Difference-in-Differences (DiD) framework being the most prominent (). DiD models attempt to isolate the causal effect of a “treatment” (the disaster) by comparing the change in an outcome over time for a treated group to the change for an untreated control group, thereby differencing out both time-invariant group characteristics and secular time trends.
While powerful, the application of DiD to disaster contexts faces several hurdles. A key challenge is the definition of the treatment itself. Disaster impacts are not binary; they vary intensely over small geographic spaces. Defining treatment at a coarse level, such as a county-wide disaster declaration, can mask significant heterogeneity and attenuate estimated effects. Another challenge is the potential for spatial spillovers, where the economic disruption from a disaster contaminates nearby control areas, violating the Stable Unit Treatment Value Assumption (SUTVA) (). Finally, when analyzing multiple disasters that occur at different times, standard two-way fixed-effects DiD models can produce biased estimates in the presence of treatment effect heterogeneity, an issue that has given rise to a new generation of more robust estimators (e.g., ; ). The literature continues to evolve, pushing for more granular data and more sophisticated econometric techniques to credibly identify the causal pathways of disaster impacts.
2.5. Determinants of Foreclosure Risk
The economic literature has long established a canonical framework for understanding mortgage default, known as the “dual-trigger” theory (). This theory posits that two conditions are generally necessary to induce a homeowner to default on their mortgage. The first trigger is a severe, negative life event that impairs the borrower’s ability to pay, most commonly job loss or a major health expense (). The second trigger is the presence of negative home equity, where the outstanding loan balance exceeds the current market value of the property. Negative equity provides a financial incentive for “strategic default,” as the homeowner has little or no financial stake left in the property.
A natural disaster is a powerful exogenous shock that can activate both triggers simultaneously and with devastating efficiency. The disaster itself, through property damage, temporary displacement, and income loss, serves as the first trigger. It directly impacts a household’s cash flow and liquidity. At the same time, the disaster can activate the second trigger by causing a sharp, localized decline in property values, thereby eroding or eliminating homeowner equity. The risk of entering a negative equity position is a function of the initial loan-to-value (LTV) ratio and subsequent house price dynamics. Homeowners who enter a disaster with high LTV ratios are therefore significantly more vulnerable ().
Socioeconomic status is a critical mediating factor in this process. Low- and moderate-income (LMI) households are particularly vulnerable to the first trigger, as they typically possess fewer liquid assets to buffer against an income or expense shock. Analysis shows that borrowers in high-risk areas often have higher debt-to-income (DTI) and LTV ratios at loan origination, indicating a pre-existing financial vulnerability that is compounded by their geographic exposure. Our study situates the climate-foreclosure link squarely within this dual-trigger framework, examining how a disaster shock interacts with the pre-existing financial and socioeconomic conditions of households to produce the ultimate outcome of foreclosure.
2.6. Conceptual Framework: Disasters and the Dual-Trigger Model of Foreclosure
The mechanisms linking climate shocks to foreclosure can be formalized through the canonical “dual-trigger” model of mortgage default (). In this framework, foreclosure typically requires the joint activation of two conditions: (i) a cash-flow or liquidity shock that impairs the borrower’s ability to meet monthly payments, and (ii) negative home equity, which removes the financial incentive to continue payment. Natural disasters represent exogenous shocks capable of activating both triggers simultaneously. Direct damages and displacement generate immediate income and expense shocks, while localized house-price declines erode equity cushions and increase the incidence of underwater mortgages.
Importantly, the pathways by which different hazards map into this dual-trigger structure vary systematically. Floods are uniquely prone to producing both triggers: standard homeowners’ policies exclude flood losses, NFIP take-up is incomplete and delayed, and riverine flood markets often experience post-event depreciation, leaving borrowers both illiquid and underwater. Wildfires and hurricane winds, by contrast, are generally covered under standard HO-3 policies, where indemnity flows are rapid and often payable jointly to borrower and lender. These payments restore liquidity, while concurrent regional house-price appreciation replenishes equity, insulating borrowers from the second trigger. This conceptual framework thus provides a theoretical foundation for interpreting heterogeneous results across hazards: floods generate foreclosure because they activate both the liquidity and equity channels, whereas wildfires and hurricanes do not.
3. Trends in Mortgage and Housing—Market Dynamics
Before turning to causal identification, this section documents how foreclosure activity, price movements, and borrower balance-sheet indicators behave around extreme-weather events.
In this study, foreclosure is defined narrowly as the legal transfer of a property through a trustee-sale deed or sheriff’s sale recorded in county deed files. These transactions mark the terminal stage of the foreclosure process, distinguishing them from broader measures such as notices of default, lis pendens filings, or loans in serious delinquency that may or may not culminate in a completed foreclosure. While this definition captures only a subset of mortgage distress, it provides a clear and consistent outcome across jurisdictions and over time. Because many distressed borrowers resolve default through alternatives such as short sales, deed-in-lieu agreements, or loan modifications, our estimates should be interpreted as the lower bound of disaster-related housing loss. Nonetheless, completed foreclosure sales are the most policy-salient indicator of credit failure, as they represent both the permanent displacement of households and realized losses for lenders.
3.1. Regional Foreclosure and Delinquency Baselines
The Federal Housing Finance Agency’s National Mortgage Database () shows that 1.6 percent of U.S. first-lien mortgages were at least thirty days delinquent in 2024, and only 0.1 percent were in foreclosure. Yet delinquency is far from spatially uniform. Figure 1 ranks one hundred metropolitan areas and reveals that the highest-risk climate markets also post the highest mortgage distress. Baton Rouge and New Orleans report 3.7 and 3.0 percent delinquency, respectively, roughly double the national average, while low risk St Louis and Milwaukee post 1.1 and 1.3 percent.
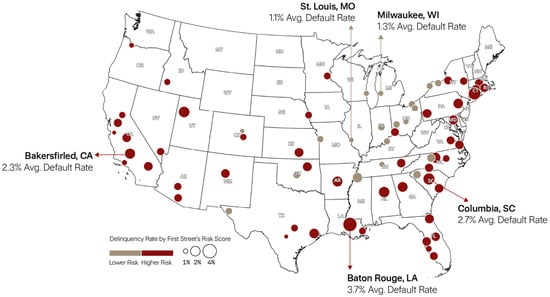
Figure 1.
Metro Area Delinquency Rates across 100 select Metropolitan Statistical Areas (MSAs), 2023. Source: (), HMDAVision.
As also shown in Figure 2, disaster shocks quickly erode local mortgage market performance. Following Hurricane Harvey, the share of Houston mortgages thirty days past due leapt from 1 percent in 2017 Q4 to 3 percent in 2018 Q4, the sharpest one-year increase since the Great Recession. Although delinquency has since subsided, it stood at 2.4 percent in 2024, still 0.8 percentage points above the national mean.
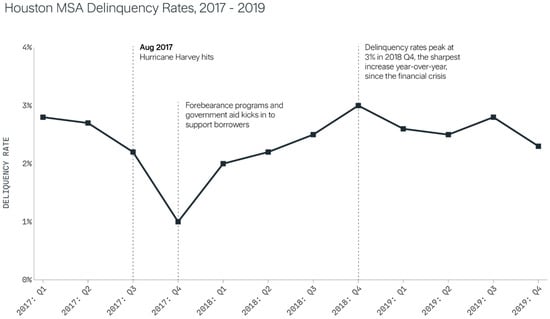
Figure 2.
Delinquency Rates, Houston MSA 2017–2019. Source: FHFA National Mortgage Database (NMDB) (), Residential Mortgage Performance Statistics.
3.2. Borrower Leverage and Debt-to-Income Profiles
The data confirm that homeowners in hazard-exposed counties carry heavier debt burdens. Using 2024 origination files from Polygon Research’s HMDAVision, the report finds that the average debt-to-income ratio in counties with major flood, hurricane, or wildfire risk is 38 percent, nearly two percentage points higher than in low-risk counties (). Loan-to-value differences are of similar magnitude. In high-risk counties the mean combined LTV at origination is 74.9 percent, compared with 72.8 percent in low-risk counties (Figure 3). These larger leverage and payment loads leave climate-exposed borrowers more vulnerable to any income interruption or repair expense.
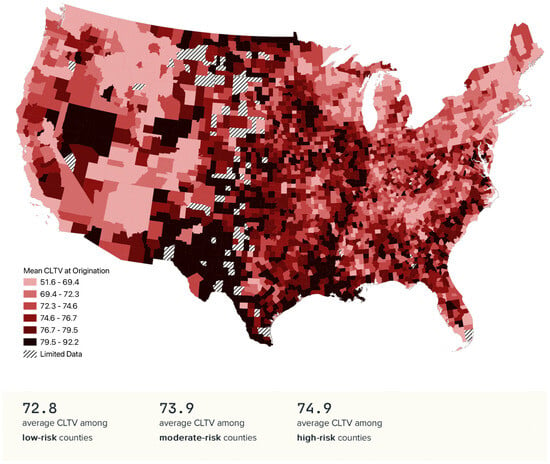
Figure 3.
Mean Combined Loan-to-Value by County, 2024. Source: (), HMDAVision.
3.3. Foreclosure Counts Around Floods, Hurricanes, and Wildfires
The raw foreclosure tallies collected for First Street’s 13th National Risk Assessment display marked variation by hazard type. Flood events emerge as the primary driver of post-disaster foreclosures; on average, flooded properties record a 40 percent rise in completed foreclosures relative to their pre-event baseline. In contrast, wildfire and wind events show the opposite tendency. Burned structures are 1.46 percentage points less likely to foreclose than unburned homes in the same perimeter, while wind-damaged homes are 0.41 percentage points less likely to foreclose than undamaged homes inside the hurricane wind field. Because these figures reflect simple before-and-after comparisons, they illustrate the overall scale of distress but do not adjust for underlying neighborhood trends.
3.4. House-Price Movements and Equity Recovery After Disasters
Home-price trajectories in the run-up to a climate event, and the speed with which equity is rebuilt afterwards, are central to understanding post-disaster mortgage distress. Using county-level Home Price Index (HPI) data from the FHFA, sale prices were indexed to the HPI at the time of the most recent transaction and projected forward to the event month and six months thereafter. This dynamic valuation captures market momentum that a static pre- or post-event snapshot would miss.
3.4.1. Pre-Event Appreciation Versus Depreciation
Across all flood events examined, properties experienced an average HPI increase of 7.0% from the time of their last transaction until the disaster. However, this average masks significant variation depending on the specific timing of the event (Figure 4). For example, properties impacted by Hurricane Sandy saw an average price decline of 3.6% from the transaction date to the hurricane’s landfall, followed by a modest gain of 0.6% in the months after. In Hurricane Sandy and other events occurring near the financial crisis, such as Hurricane Isaac, Hurricane Irene, and several river floods, the negative trend in property values created financial vulnerabilities for affected homeowners, particularly for those with high loan-to-value ratios.
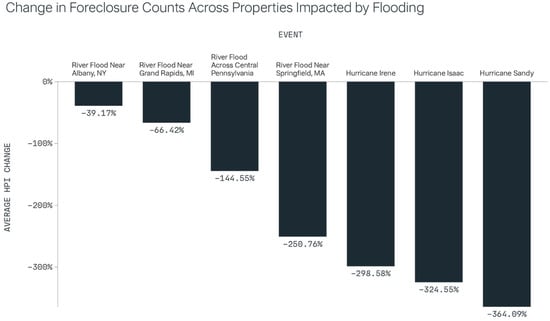
Figure 4.
Average HPI Changes from Sale to Event (Flood Events Following the Financial Crisis). Source: FHFA House Price Index.
Depreciating markets at landfall. Homes struck by Hurricane Sandy, Hurricane Isaac, and other late-2000s/early-2010s events recorded 3–5 percent price declines from sale to event. Thin equity cushions, already eroded by the post-crisis downturn, left borrowers exposed; foreclosure rates in these counties climbed despite only modest physical damage.
Rapidly appreciating markets. At the opposite extreme, properties hit by Hurricane Wilma in October 2005 rode the mid-2000s housing boom. The five hardest-hit Florida counties, Monroe, Martin, Palm Beach, Charlotte, and Lee, posted average three-year appreciation of ~78 percent before the storm (Table 1 below). Even after a 15–26 percent correction in the following year, rising pre-storm equity insulated owners: completed foreclosures in these counties fell by roughly 80 percent relative to their pre-event baseline, bucking the national uptrend.

Table 1.
HPI Changes for Wilma Affected Counties.
Aggregating across all events underscores the equity channel. Properties that appreciated between sale and disaster saw post-event foreclosures fall 20.0 percent; those that depreciated experienced a 9.1 percent increase (Figure 5). Hurricanes drive much of the contrast (−21.0 percent vs. +8.4 percent), whereas riverine floods raise foreclosure counts in both appreciating and depreciating markets, suggesting that inland households face lower flood insurance penetration and slower claim settlements regardless of price momentum.
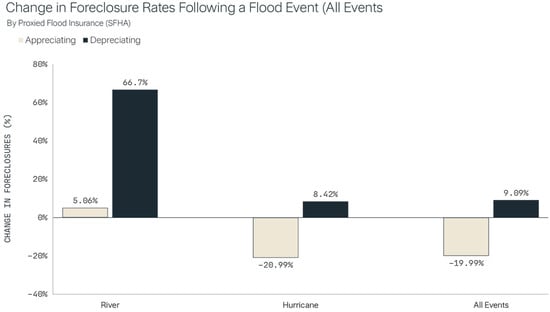
Figure 5.
Change in Foreclosures Among Damaged Properties by Home Appreciation. Source: First Street analysis from Lightbox Transaction and Foreclosure Records.
3.4.2. Loan-to-Value Erosion and Equity Stress
Dynamic equity can be traced through amortization schedules. Combining projected valuations with outstanding principal yields time-specific loan-to-value (LTV) ratios at purchase, at the event, and even three years later.
Equity loss as a precursor to default. Among flood-affected properties, 20.3 percent of foreclosed homes saw LTV rise between purchase and event, versus 11.7 percent for non-foreclosed homes (Figure 6). In LMI tracts the disparity widens to 27.8 percent vs. 14.9 percent.
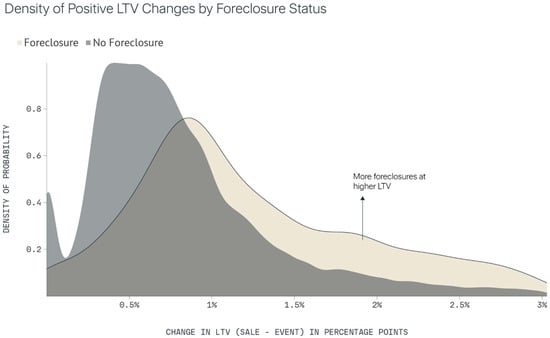
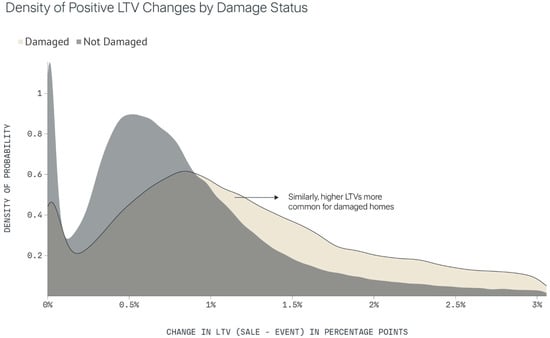
Figure 6.
Density of Positive LTV Changes by Foreclosure Outcome and Damage Status. Source: First Street analysis from Lightbox Transaction and Foreclosure Records.
The Hurricane Sandy case study crystallizes the LTV mechanism. Average HPI in affected counties fell 3.6 percent pre-event, pushing median property value from USD 265,000 at sale to USD 254,000 by landfall. Concurrently, median LTV climbed from 70.5 percent to 75.3 percent. Logistic estimates indicate that each 10-point LTV uptick increased default odds by 0.76 percentage points (≈30 percent of the 2.5 percent baseline). To capture heterogeneity by damage status, we estimate a pooled logit for the LTV-mechanism analysis to model the binary foreclosure outcome with a nonlinear link while allowing interaction terms by damage status. The logit complements our linear DiD by (i) accommodating non-Gaussian error, (ii) yielding odds-ratio interpretations for LTV changes, and (iii) avoiding predictions outside [0,1]. Because logit coefficients are non-collapsible, we present marginal effects and keep the DiD as the primary causal design:
where for damaged properties. Figure 7 plots the implied foreclosure probability against , holding at its median. The two lines correspond to undamaged properties () and damaged properties , with the latter disoplaying a steeper slope. This indicates that the sensitivity of foreclosure risk to rising LTV is considerably stronger for damaged homes, consistent with the intuition that physical impacts compound financial fragility.
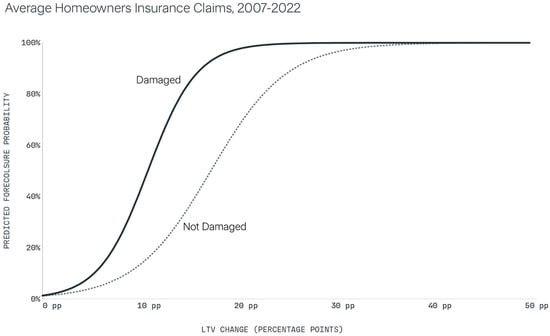
Figure 7.
Foreclosure Probability as a Function of LTV Change by Damage Status. Source: First Street.
3.5. Insurance Landscape and Coverage Gaps
Insurance is the first line of defense that should convert a destructive climate shock into a liquidity event rather than a credit event. Descriptive evidence, however, shows that the U.S. property insurance system is under intensifying stress from three directions: the scale of catastrophe losses, the erosion of affordable coverage, and large spatial gaps in mandatory take-up.
3.5.1. Rising Catastrophe Share in Homeowners Insurance Claims
The frequency and severity of insured losses have grown rapidly. Figure 8 shows that the mean weather-related claim climbed to USD 37,152 in 2022—well over twice the USD 15,747 average for all perils.
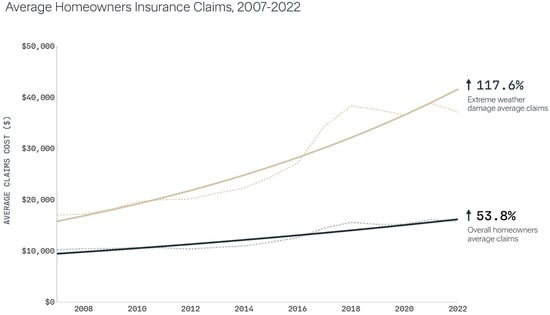
Figure 8.
Average Homeowners Insurance Claims, 2007–2022. Source: ().
When dissected by type of peril, it is possible to pinpoint a strong compositional shift: natural catastrophes accounted for roughly 90 percent of all homeowners insurance claims in 2022, up from about 78 percent two decades earlier. On the federal side, it has been recorded a 223 percent increase in the mean National Flood Insurance Program (NFIP) payout, from roughly USD 19,800 in the early 2000s to USD 64,100 in the 2020–2024 period, even though the statutory USD 250,000 structural-coverage cap has remained unchanged. These escalating losses feed directly into higher premiums: the insurance component of monthly principal-interest-tax-insurance (PITI) payments has risen from a stable 3–4 percent pre-2013 to exceed 10 percent of total mortgage outgoings by 2022.
3.5.2. Geo-Spatial Under-Insurance of Flood Risk
Even where insurance remains available, coverage penetration is incomplete and spatially uneven. Standard HO-3 homeowners’ policies exclude flood losses, leaving the NFIP (or private flood products) to fill the gap. Yet compliance with the NFIP’s mandatory-purchase rule is weak: survey estimates indicate that only 48.3 percent of households located inside Special Flood Hazard Areas (SFHAs) maintain an active policy. Thus, while SFHA designation captures where the federal mandate applies, it is not equivalent to actual coverage. The mapping itself is partial: through high-resolution modeling, First Street has identified that 17.7 million properties nationwide face at least a one-percent annual probability of flooding, of which 9.8 million lie outside FEMA-designated SFHAs and thus face no compulsory-purchase requirement. This “mapping gap” leaves a majority of high-risk homes effectively uninsured against the most financially burdensome peril in the U.S. housing market.
3.6. Stylised Facts
Three facts emerge from these purely descriptive statistics. First, significant post-event foreclosure surges appear only in connection with floods; wildfire and wind damage are followed by stable or improving foreclosure performance. Second, within the flooded cohort, virtually all of the raw foreclosure overhang is borne by parcels not subject to compulsory flood insurance. Third, the trajectory of local house prices, and therefore of borrower equity, tracks default outcomes tightly: declining prices after riverine floods erode cushions, whereas rapid appreciation in California fire markets replenishes them despite severe structural loss. These patterns align with a straightforward balance-sheet mechanism in which indemnity payments and capital gains prevent physical shocks from translating into mortgage failure. The next section introduces an econometric framework that separates these intuitive channels from confounding influences and estimates the average causal effect of each hazard on foreclosure risk.
4. Data and Measurement
To test our hypotheses regarding the causal impact of climate shocks on residential foreclosure, we construct a novel, property-level panel dataset. This database integrates granular geospatial data on disaster events with comprehensive property transaction records, mortgage characteristics, and local economic indicators. The high-resolution nature of our data allows for a precise classification of treatment and control groups and a robust empirical design that overcomes many of the limitations inherent in more aggregated studies.
4.1. Core Datasets
Our empirical analysis draws upon five primary data sources, which are merged at the individual property level, identified by a unique Assessor’s Parcel Number (APN) and precise geographic coordinates.
- First Street (FS) Event Database: The source for our exogenous climate shocks is the FS’s comprehensive historical event database. This database provides detailed, high-resolution spatial footprints for major climate events across the United States, including floods, hurricanes, and wildfires. For flood events, we utilize historical reconstructions that model flood depths at the property level for both riverine and hurricane-driven storm surge events. For hurricane events, we use wind-field reconstructions derived from the International Best Track Archive for Climate Stewardship (IBTrACS), which generate swaths of wind speeds based on the Saffir-Simpson scale. For wildfires, we use burn perimeters sourced from the Monitoring Trends in Burn Severity (MTBS) program and the National Interagency Fire Center (NIFC). This event-level granularity is the cornerstone of our treatment assignment strategy.
- Lightbox Transaction and Foreclosure Records: Our primary source for property-level outcomes and transaction characteristics is the Lightbox database (formerly CoreLogic/DataQuick). We utilize records spanning from 2000 to 2019 across 2059 U.S. counties. This comprehensive dataset contains the full transaction history for residential properties, including detailed information on transaction type (e.g., resale, refinance, new construction, or foreclosure sale), sale dates, property characteristics (e.g., single-family residential), and loan information from mortgage origination. From this, we construct our primary dependent variable, a binary indicator for a foreclosure sale, and extract key information for modeling loan dynamics.
- Federal Housing Finance Agency (FHFA) House Price Index (HPI): We use county-level annual FHFA HPI to track single-family price movements (repeat-sales/refinance based) and to “mark-to-market” property values by escalating each parcel’s last observed sale price from the transaction date to the disaster date and beyond; this allows construction of dynamic equity and LTV measures. Following common practice in mortgage default research (e.g., ; ; ), we pair the HPI-based value with an amortization of the origination balance to approximate the outstanding mortgage and compute time-varying LTV. We acknowledge that local HPIs may not perfectly track parcel-specific valuations and that balances can change through refinancing, curtailments/prepayments, or second liens, which are not fully observed here. In our DiD setting, comparing treated and control parcels within the same local markets and calendar months—area-level valuation noise should largely difference out; remaining idiosyncratic error would most likely attenuate LTV-related coefficients toward zero. We also report core DiD results that do not depend on the LTV proxy and note that future work using richer loan-servicing histories or automated valuation models (AVMs) could further validate these relationships.
- HUD Low- and Moderate-Income (LMI) Geographies: To investigate heterogeneity based on socioeconomic status, we use data from the U.S. Department of Housing and Urban Development (HUD) that designates census tracts as LMI. A tract is defined as LMI if its median family income is at or below 80% of the Area Median Income (AMI). We spatially merge these tract-level designations with our property-level data to classify each property as being located in an LMI or non-LMI neighborhood, serving as a proxy for borrower income and financial resilience.
- FEMA Special Flood Hazard Area (SFHA) Shapefiles: To proxy for the presence of mandatory flood insurance, we use digital flood insurance rate maps (DFIRMs) from the Federal Emergency Management Agency (FEMA). These shapefiles delineate the official boundaries of SFHAs, which are areas with at least a 1% annual chance of flooding. By performing a spatial join, we identify whether each property is located inside or outside an SFHA. Crucially, to ensure temporal validity, our analysis only uses SFHA boundaries that were in effect prior to each flood event date, as flood maps are often updated post-disaster. While we use SFHA designation as a proxy for insurance protection, we note that the federal mandate applies only to federally backed mortgages and compliance is incomplete. Thus, SFHA status should be interpreted as indicating a greater probability of insurance coverage, rather than a strict binary between insured and uninsured properties.
4.1.1. Data Preparation and Harmonization
- Each dataset required cleaning and transformation before being merged into the analytic panel. LightBox transaction records were filtered to include only single-family residential properties and foreclosure sales (trustee-sale deeds and sheriff’s sales), with duplicate entries removed and assessor parcel numbers (APNs) standardized. Event footprints from First Street, IBTrACS, MTBS, NIFC, and FEMA were projected into a common coordinate reference system, clipped to county boundaries, and spatially joined to parcels using APNs and geocoded centroids.
- For floods, modeled depths were linked to Arup fragility curves to generate property-level damage indicators; for wildfires, California Department of Forestry and Fire Protection (CAL FIRE) Damage Inspection (DINS) classifications were used when available; and for hurricanes, properties flagged as subject to significant inundation were excluded from the wind sample to avoid conflating perils. County-level HPI from FHFA was then applied to escalate transaction values to event dates, enabling dynamic estimates of homeowner equity. Finally, HUD LMI designations and FEMA SFHA shapefiles were merged by tract and parcel geography, providing socioeconomic and insurance proxies. The resulting dataset is an event–parcel monthly panel spanning 36 months before and after each disaster, with standardized treatment and control groups across all three hazard types.
4.2. Treatment Assignment
A central innovation of this study is our granular, hazard-specific approach to defining treatment and control groups. This property-level classification allows for a more precise estimation of disaster impacts by distinguishing between direct physical damage and indirect or spillover effects. For each of the 55 disaster events included in our final analysis, we assign properties to one of three mutually exclusive categories based on a spatial buffering approach.
- Flood Events: For the 29 flood events in our sample (Table 2), property exposure is defined using property-level flood depth simulations. A 1.5-mile buffer is generated around all properties with any modeled inundation to capture the relevant local housing market. Properties within this unified buffer are then classified into:
 Table 2. Flood Events—Summary Statistics.
- Damaged: Properties with modeled flood depths greater than zero and associated structural damage estimates (derived from engineering-based fragility curves) exceeding zero. This is our primary treatment group.
- Exposed (Flooded Only): Properties with modeled flood depths greater than zero but no estimated structural damage.
- Control (Nearby): Properties within the 1.5-mile buffer but with a modeled flood depth of zero, which are subject to the same local economic conditions but not direct inundation.
- Hurricane Wind Events: For the 16 hurricane wind events (Table 3), we classify properties based on modeled wind intensity from the Saffir-Simpson scale, explicitly excluding properties with significant flood risk to isolate the effect of wind.
 Table 3. Wind Events—Summary Statistics.
- Damaged: Properties experiencing winds of Category 1 (≥74 mph) or higher that also have simulated structural damage. This serves as the primary treatment group.
- Exposed (Cat 1+ Winds Only): Properties experiencing Category 1+ winds but with no simulated damage.
- Control (Tropical Storm Winds): Properties within the storm’s path but only experiencing tropical-storm-force winds (<74 mph).
- ○
- Handling Overlapping Hazards. Because hurricanes often generate both damaging winds and extensive flooding, we took explicit steps to avoid conflating the two perils in our analysis. Properties identified as highly exposed to coastal storm surge or fluvial flooding during a hurricane were excluded from the hurricane wind sample, ensuring that the hurricane cohort reflects wind impacts rather than inundation. Conversely, properties analyzed in the flood cohort were drawn from modeled flood extents and damage functions, irrespective of concurrent wind exposure. This disaggregation creates disjoint treatment groups across hazard types, preventing double-counting and allowing us to attribute observed foreclosure effects specifically to wind or flood exposure.
- Wildfire Events: For the 10 California wildfire events (Table 4), we adopt a “donut-style” buffer design around the official burn perimeter, a strategy modeled on recent literature to mitigate spillover effects ().
 Table 4. Wildfire Events—Summary Statistics.
- Damaged: Properties located inside the burn perimeter with structural damage confirmed by CAL FIRE’s Damage Inspection (DINS) database. This is the treatment group.
- Exposed (Within Perimeter): Undamaged properties also located inside the burn perimeter.
- Control (Outside Perimeter): Properties located in an outer buffer zone spanning from 1 to 2.5 miles from the fire perimeter. An inner 1-mile buffer is excluded from the analysis to create a clean separation between treated and control areas.
For wildfires, we adopted the described donut-hole design (excluding parcels within one mile of the perimeter and using parcels 1–2.5 miles away as controls) to reduce visual and environmental spillovers, since adjacency to burn scars may itself affect foreclosure risk. For floods, by contrast, inundation varies at a hyper-local level due to elevation and drainage, so control properties are defined within the same flood-affected census tracts but with modeled depth = 0. This distinction reflects the physical nature of each hazard and ensures that control groups capture indirect effects appropriately.
4.3. Key Outcome and Covariates
Our analysis centers on a primary outcome variable and a set of covariates designed to test our hypotheses regarding heterogeneous effects and underlying financial mechanisms.
- Outcome, Foreclosure Sale: The dependent variable is a binary indicator, Foreclosure, which equals one if a property transaction is recorded as a foreclosure sale in the Lightbox database, and zero otherwise. The analysis is conducted at the transaction level within a 72-month window (36 months pre-event and 36 months post-event) centered on each disaster.
- Subgroup Variables: To explore the channels through which climate shocks affect foreclosure, we utilize three key moderating variables:
- SFHA Status: A binary variable indicating if a property is located within a pre-existing Special Flood Hazard Area, serving as our proxy for mandatory flood insurance.
- LMI Status: A binary variable indicating if a property is located within a U.S. Department of Housing and Urban Development (HUD)-designated Low- to Moderate-Income census tract, serving as our proxy for household socioeconomic vulnerability.
- LTV Changes: We construct a dynamic, property-level Loan-to-Value (LTV) ratio to capture changes in homeowner equity. This is constructed via a multi-step process: (i) we identify the original loan amount and property value from the most recent prior transaction; (ii) we update the property’s value over time by applying the county-level FHFA HPI; (iii) we estimate the remaining loan balance at any given point by modeling a standard 30-year amortization schedule based on the original loan terms; and (iv) the LTV is the estimated outstanding balance divided by the HPI-adjusted property value. A rising LTV between purchase and the disaster event signals equity erosion and heightened financial strain.
5. Empirical Strategy
To quantify the causal impact of climate shocks on the incidence of mortgage foreclosure, the study adopts a property-level differences-in-differences design that exploits the precise timing and spatial footprint of fifty-five discrete disasters. The approach compares changes in foreclosure probability for homes suffering direct physical damage with changes for observationally similar homes that escaped damage but shared the same local housing market, thereby purging the estimates of both time-invariant property characteristics and macroeconomic trends common to all parcels. Because the damage classification is derived from high-resolution hazard footprints rather than coarse county declarations, the design mitigates attenuation bias associated with spatial mis-measurement and allows separate identification of flood, wildfire, and hurricane-wind effects.
Our identifying variation arises from within-market comparisons of damaged and proximate undamaged parcels, where markets are defined by narrowly drawn hazard perimeters and their surrounding buffers. This parcel-level definition, based on high-resolution hazard footprints, avoids reliance on coarse county boundaries.
With 55 disasters occurring at different times, our setting constitutes a staggered DiD design. We acknowledge that standard two-way fixed-effects estimators can produce biased averages when treatment effects are heterogeneous across events (); our robustness checks therefore include alternative estimators that explicitly account for staggered timing.
We model foreclosure as a linear probability outcome within the DiD framework. The linear specification has three advantages in our setting: (i) coefficients are directly interpretable as percentage-point changes in foreclosure risk; (ii) high-dimensional fixed effects (parcel, event, month) are straightforward to include and compare across hazards and event-study plots; and (iii) linear DiD aligns cleanly with staggered-timing estimators and diagnostics we report (e.g., interaction-weighted event studies), while avoiding non-collapsibility and incidental-parameter issues that complicate two-way-FE logit/probit. As a robustness check, we also estimated nonlinear models (logit/probit) and obtained qualitatively similar hazard-specific patterns; full outputs are available upon request. Our core conclusions therefore do not hinge on functional-form choice.
5.1. Baseline Differences-in-Differences Model
Let index individual parcels, index disaster events, and index half-year periods measured relative to each event date. For each peril, the baseline specification is a linear probability model of the form.
where equals one if parcel experiences a trustee-sale deed in event period and zero otherwise. The indicator equals one for all periods after the calendar date of event ; equals one if parcel falls in the treatment class for event (flood-inundated with structural loss, burned inside the CAL FIRE perimeter, or subject to Category 1-plus hurricane winds with modeled wind damage), and zero if it is assigned to the contemporaneous control buffer. The interaction therefore captures the within-parcel change in foreclosure probability attributable to disaster damage net of contemporaneous shocks faced by the control group.
The inclusion of transaction fixed effects absorbs all static structural, locational, and borrower attributes. Calendar-time dummies purge national housing cycles, and event fixed effects flexibly absorb unobserved severity differences across disasters such as storm magnitude or fire intensity. With this saturated set of fixed effects, the identifying assumption reduces to a “parallel trends” condition, that, absent the disaster, treated and control parcels would have followed similar within-market foreclosure trajectories.
Because foreclosure events cluster in space and time, and because all treated parcels within a given disaster share the same timing shock, standard errors are clustered by event when a single hazard is estimated or by event-by-state when multiple hazards are pooled. This strategy is conservative with respect to spatial correlation and guards against over-rejecting the null under multi-way clustering ().
5.2. Treatment of Multiple Exposures
To isolate the effect of each peril, we explicitly restricted exposures so that no parcel is simultaneously “treated” by more than one hazard within the estimation window:
- Wind vs. Flood: For the wind-event specification, we excluded properties classified as high-risk for either pluvial (riverine) or coastal flooding that is frequent in hurricane disasters given First Street’s property-level flood source designations. This ensures that observed foreclosure effects following wind events are not confounded by latent flood risk or concurrent flood events.
- Wildfire: The wildfire specification was limited to California, in counties where no major flood or wind events overlapped during the study period. This allows wildfire exposures to be analyzed in isolation.
- Multiple events within a peril: When parcels could have been exposed to multiple events of the same peril type within the observation window, we assigned treatment status based on the timing of the first event relative to the foreclosure outcome and controlled for event timing with fixed effects for both the event date and transaction date.
In short, parcels are only ever exposed to one peril type at a time within a given model specification, and our fixed effects absorb timing shocks from repeated events.
5.3. Why a DiD Design?
Our property-level, within-market comparisons exploit sharp treatment timing and granular footprints, which suit DiD. Matching cannot remove time-varying unobservables; IV lacks strong, external shocks at parcel level; synthetic control is tailored to aggregate units. We address staggered timing and heterogeneity using modern estimators (; ) and report event-study pre-trends to support parallel trends.
5.4. Robustness and Ancillary Analyses
In addition to the baseline DiD results presented in the main text, we conducted a suite of ancillary analyses to probe identification assumptions and test robustness. Event-study specifications with leads and lags confirmed the absence of differential pre-trends across treated and control parcels. Estimates were also resilient to alternative buffer definitions (e.g., varying flood-market radii and wildfire donut widths), placebo treatments assigned to pseudo-event years, and sensitivity checks with spatial heteroskedasticity- and autocorrelation-consistent (HAC) standard errors and alternative clustering schemes (event vs. event × state). We also explored specifications including time-varying covariates such as local unemployment, LMI status, and HPI dynamics; these did not alter the sign or magnitude of results, though in some cases they reduced precision, so they were not retained in the final specification. As mentioned, we further excluded events with overlapping perils and re-estimated on single-hazard cohorts, with consistent results. Because of length restrictions, we do not present these full outputs here, but complete tables and figures are available from the authors upon request.
6. Results
A difference-in-differences design isolates the causal impact of each peril on completed foreclosures by contrasting trends for damaged parcels with those for observationally similar, undamaged parcels in the same local markets and disaster windows. The estimates below correspond to the interaction coefficient in the fully saturated specification that includes parcel, event, and calendar-time fixed effects.
For wildfires (Table 5), the point estimate indicates that structurally damaged parcels are 1.46 percentage points less likely to enter foreclosure than undamaged parcels within the same burn perimeter. The negative coefficient implies a relative post-event improvement in mortgage performance for burned homes. This counterintuitive result is consistent with two contextual factors documented for the 2013–2019 California fire cohort. First, rapid appreciation of regional house prices preserved positive homeowner equity even after accounting for reconstruction costs. Second, standard HO-3 homeowners’ policies cover fire losses in full, and insurers typically issue claim checks payable to both the borrower and the mortgagee. Those proceeds either financed rebuilding or directly satisfied outstanding loan balances, thereby forestalling default.

Table 5.
DiD Results—Wildfire Model.
For hurricanes (Table 6), after excluding parcels exposed to concurrent flood hazards, the difference-in-differences estimate shows that homes sustaining Category 1-or-stronger wind damage are 0.41 percentage points less likely to foreclose than undamaged homes in the same wind field. The protective effect mirrors the wildfire pattern and likewise points to the role of insurance (). Wind loss is a named peril in standard policies, and lenders’ position as loss payees ensures that indemnity flows reduce delinquency pressure. By contrast, the complexities of flood coverage, which is excluded from HO-3 forms, are absent for these strictly wind-damaged properties, explaining why the net effect is a small, statistically insignificant decline in completed foreclosures.

Table 6.
DiD Results—Wind Model.
In stark contrast, flooding (Table 7) exhibits a positive and statistically significant impact. Properties that incur measurable inundation are 0.29 percentage points more likely to foreclose within three years than non-inundated properties located inside the same 1.5-mile market buffer. The result corroborates descriptive evidence of elevated post-flood defaults and is strongest for riverine events, where federal disaster aid and insurance take-up are comparatively limited. The absence of compulsory coverage outside Special Flood Hazard Areas leaves many flooded borrowers without liquid resources to repair or to remain current on mortgage obligations, thereby translating physical damage into credit distress.

Table 7.
DiD Results—Flood Model.
To further explore mechanisms behind the regression results, Table 8 reports pre- and post-event foreclosure rates across borrower and property strata. The baseline foreclosure rate declines from 4.9 percent pre-event to 2.9 percent post-event. However, LMI households exhibit rates nearly double the baseline in both periods (9.2 percent pre vs. 5.3 percent post), while negative-equity borrowers show the steepest deterioration (6.3 percent to 5.5 percent, a 0.6 multiplier increase over baseline). By contrast, properties inside SFHAs are relatively protected: their foreclosure rates remain below baseline pre-event (3.4 percent vs. 4.9 percent) and converge to the baseline post-event (2.9 percent). Taken together, these patterns reinforce the insurance mechanism: households with mandated coverage (SFHA) do not experience disproportionate post-flood foreclosures, whereas vulnerable borrowers (LMI, negative equity) shoulder the bulk of the risk.

Table 8.
Heterogeneity in Foreclosure Rates Following a Flood Event, by Socioeconomic and Risk Attributes.
A complementary heterogeneity test for flood events stratifies the sample by house price dynamics to capture the role of borrower equity. Event-study (Figure 9) estimates reveal that properties in appreciating markets display no systematic divergence in pre-event foreclosure trends between treated and control units, consistent with the parallel trends assumption. By contrast, borrowers in depreciating markets face a markedly different trajectory: although both strata experience an initial post-flood dip in foreclosure, likely reflecting temporary forbearance or disaster relief, foreclosure risk subsequently rebounds more sharply where prices are falling. This differential response supports the interpretation that equity erosion amplifies flood-induced credit distress, as underwater borrowers outside of appreciating markets have fewer resources or incentives to remain current on mortgage obligations.
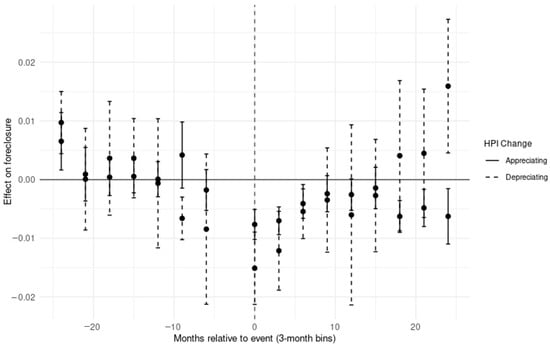
Figure 9.
Event-Study Estimates for Flood Events: Appreciating versus Depreciating Properties (County Fixed Effects, Clustered Standard Errors). Note: Coefficients are relative to the half-year immediately preceding the event (t = −1).
Collectively, the hazard-specific difference-in-differences estimates reveal that only flood exposure produces a positive foreclosure shock, whereas wildfire and wind damage do not, a divergence traceable to the presence or absence of readily available insurance protection.
Interpretation and Caveats. The baseline results we present are derived from a standard two-way fixed effects DiD framework, and as such the Treat and Post indicators are absorbed by parcel and time fixed effects. Reported tables retain these terms for completeness, but they are not the focus of interpretation; the coefficient of interest is always the interaction term (Treat × Post). While the main DiD estimates are consistently directionally robust across hazards, we note that statistical significance is sometimes at the 10% level. This fragility reflects both the limited number of qualifying events (55 disasters with sufficient foreclosure activity out of 223 examined) and the inherent heterogeneity in disaster timing, geography, and local economic conditions.
To strengthen confidence in interpretation, we conducted extensive robustness analyses during the broader assessment process: varying flood buffers, excluding events with overlapping wind and flood exposure, applying placebo years, testing alternative clustering schemes (event vs. event × state vs. spatial HAC), and stratifying results by SFHA status, borrower income, and timing relative to the financial crisis. Across these ancillary checks, the central finding—that floods uniquely increase foreclosure risk while wildfires and hurricane winds do not—remained consistent in sign and magnitude. Because of space constraints in the manuscript, these additional results are not reported in full but are available upon request. Accordingly, our institutional interpretation emphasizing the role of insurance markets (robust wind and wildfire coverage vs. incomplete flood insurance take-up) should be viewed as plausible but not definitive. It is best understood as consistent with, rather than directly proven by, the evidence in the tables.
7. Discussion and Policy Implications
7.1. Synthesis of Empirical Evidence
The combined descriptive and causal analyses paint a consistent narrative: physical climate risk becomes a mortgage-credit problem when two buffers, insurance liquidity and post-disaster capital gains, fail simultaneously. Floods stand out because insurance coverage is partial and spatially patchy. Although federal law mandates National Flood Insurance Program (NFIP) policies inside Special Flood Hazard Areas (SFHAs), fewer than half of covered households remain insured, and 9.8 million high-risk homes lie entirely outside mapped zones. In this uninsured fringe, damaged parcels record an additional 11.6 foreclosures per 10,000 in the thirty-six months after inundation, while equally damaged, but insured, parcels inside SFHAs show virtually no increase.
Wildfire and hurricane-wind events, by contrast, occur in markets where standard HO-3 policies still cover the dominant peril, and where post-event house-price appreciation is strong. California wildfire counties move from 6.6 percent to 9.1 percent annual appreciation after major burns, and median loan-to-value (LTV) among burned homes actually falls by two percentage points because insurers either fund repairs or pay off mortgages on total-loss structures. As a result, raw foreclosure counts decline rather than rise. These opposite outcomes across hazards underscore that physical destruction alone is not sufficient to produce credit distress; what matters is the borrower’s post-shock liquidity and equity position.
Liquidity is further strained by claim-settlement lags. NFIP data show that only 61 percent of flood claims reach final settlement within ninety days, and a long right tail extends beyond six months. During that limbo borrowers must cover both repair expenses and mortgage payments, a dual burden that pushes highly leveraged owners into delinquency even if coverage eventually materializes (; ). Rising insurer retreat compounds the problem. Homeowners insurance non-renewals average 0.99 percent nationally but run two-to-three times higher in Louisiana, Florida, and California. Thirty-five states now operate Fair Access to Insurance Requirements (FAIR) plans, insurers of last resort that provide basic fire or wind cover but no flood protection and often cap structural limits well below replacement cost.
Given these stress points, the First Street macro-risk projections are sobering. In a severe-weather year, climate-driven foreclosures could impose USD 1.21 billion in lender credit losses by 2025, rising to USD 5.36 billion by 2035. The climate share of total foreclosure losses would thereby grow from 6.7 percent to nearly 30 percent, even before accounting for potential contagion through mortgage-backed securities.
7.2. Mechanisms Linking Climate Shocks to Foreclosure
Three channels dominate. First, the insurance-liquidity channel. Where indemnity payments are prompt and robust, as with wind and fire, the shock is absorbed. Where coverage is absent or delayed, as with many floods, borrowers face an immediate cash-flow shortfall. Second, the equity channel. Stagnant or declining post-flood house prices push median LTV above ninety-five percent, triggering strategic default behavior predicted by the dual-trigger model. Rapid appreciation after fires or storms replenishes equity and neutralizes the second trigger. Third, the leverage-vulnerability channel. Hazard-exposed counties already exhibit higher debt-to-income ratios (38 percent versus 36 percent elsewhere) and higher initial combined loan-to-value (CLTV) (74.9 percent versus 72.8 percent), leaving borrowers with less margin for error when disaster strikes.
7.3. Policy Implications
7.3.1. Modernize Flood-Risk Mapping and Mandates
FEMA’s SFHA boundaries omit more than half of the 17.7 million properties facing at least a one-percent annual flood probability. Expanding the mandatory-purchase requirement to probabilistically defined risk zones, or instituting automatic enrolment with an opt-out, would narrow the uninsured fringe. Because affordability remains a barrier, means-tested vouchers or sliding-scale NFIP premiums could raise take-up among low- and moderate-income households, who currently shoulder a 50 percent higher foreclosure response to flooding.
7.3.2. Stabilize the Homeowners Insurance Market
State regulators could supplement FAIR plans with public re-insurance backstops that lower capital costs for private carriers, slowing market exits in high-risk areas. Premium-smoothing mechanisms, such as multi-year contracts or state-subsidized rate corridors, would reduce payment shocks that now push insurance costs to more than ten percent of monthly mortgage expenses, up from three percent a decade ago.
7.3.3. Embed Climate Metrics in Mortgage Underwriting
Like First Street suggests on its 13th National Risk Assessment, treating physical risk as the “sixth C” of credit (alongside character, capacity, capital, collateral, and conditions) would encourage originators and investors to price exposures correctly. Automated underwriting systems could incorporate parcel-level hazard scores and projected insurance costs, flagging loans that will become unaffordable as premiums rise. At the portfolio level, regulators might require stress-testing against the USD 5 billion climate-loss scenario projected for 2035.
7.3.4. Improve Post-Disaster Mortgage Relief
Given that NFIP settlements often lag by three to six months, automatic 180-day forbearance for disaster-declared zones would bridge the liquidity gap. Streamlined modification protocols, similar to the COVID-era waterfall, could convert accrued arrears into non-interest-bearing principal while extending term lengths, especially for borrowers whose LTV exceeds ninety-five percent after a flood. Because lender losses scale with both default probability and loss-given-default, early intervention is cost-effective.
7.3.5. Accelerate Data Transparency
Linking NFIP policy files, homeowners insurance claims databases, and mortgage performance records would allow regulators to monitor the insurance-credit nexus in real time. Public–private data co-operatives could flag neighborhoods where non-renewal rates spike, enabling pre-emptive outreach before delinquency takes hold.
7.4. Limitations and Future Research
Several data constraints temper the policy guidance. SFHA status is an imperfect proxy for actual insurance coverage; lapses and grandfathered exemptions abound. Lightbox deed data miss foreclosures resolved through short sale or deed-in-lieu, understating the full distress burden. Finally, the empirical window ends in 2019; since then, wind and fire insurance markets have deteriorated further, suggesting that the protective findings for those perils may weaken in newer cohorts. Future work should merge parcel-level mortgage performance with policy-level insurance records, quantify repeat-event exposure, and assess how securitizers and guarantors reprice loans as climate information becomes more granular.
While the linear probability DiD offers transparency and comparability across events, future research should further probe nonlinearity—e.g., generalized linear DiD with flexible interactions or doubly robust estimators—to verify that the estimated relationships persist when the link function and heteroskedasticity structure are modeled explicitly.
Our LTV proxy relies on county-level HPI escalation and amortization from origination; while common in applied work, this approach can mismeasure property-specific values and balances (e.g., due to refinancing or second liens). Such error likely attenuates estimated LTV effects and should be explored further with richer loan-level histories or AVMs in future work.
Finally, a further limitation concerns hurricanes, which often generate both damaging winds and extensive flooding. Our main specification mitigates this by excluding parcels with significant concurrent flood exposure from the wind cohort, but spillovers from nearby flooding may still affect local liquidity or servicer behavior. Addressing this fully would require alternative treatment definitions (e.g., distance-based exclusions or nested buffers) and is beyond the present scope. Preliminary checks with alternative buffer definitions produced consistent results, but hurricane–flood interactions remain an important avenue for future research.
8. Conclusions and Policy Implications
The evidence assembled in this study indicates that climate shocks have already begun to reallocate mortgage-credit risk across the United States. In localities where flood coverage remains thin and post-event house-price dynamics are anemic, even moderate inundation is sufficient to erode borrower equity, activate the strategic-default option, and translate idiosyncratic hazards into material credit losses for depository institutions. Conversely, in jurisdictions where indemnity payments arrive swiftly and real estate markets recover quickly, as has typically been the case for wind- and fire-affected areas with robust HO-3 coverage, the same physical destruction leaves only a negligible imprint on foreclosure incidence and bank charge-offs. These asymmetric outcomes underscore that the transmission of climate risk to credit markets is mediated less by the scale of physical damage per se than by the interaction of insurance liquidity and post-shock capital gains.
Three policy priorities follow. First, closing the flood insurance gap, whether through probabilistic mapping, automatic enrollment, or income-linked subsidies, would address the liquidity shortfall that underpins the excess foreclosure burden outside Special Flood Hazard Areas. Second, stabilizing homeowners insurance supply in high-risk states via re-insurance backstops and premium-smoothing mechanisms would mitigate payment shocks that have doubled insurance’s share of monthly housing costs over the past decade. Third, embedding parcel-level hazard metrics and forward-looking insurance premia in underwriting and stress-testing regimes would internalize location-specific externalities, align credit pricing with expected loss, and reduce the tail risk currently borne by government guarantors and bank balance sheets. Absent such reforms, prior projections, like the ones included in First Street’s 13th National Risk Report, anticipate an increase in climate-driven foreclosure losses, from 6.7 percent of the total in 2025 to nearly 30 percent by 2035, which poses a non-trivial threat to both household wealth accumulation and the resilience of the broader financial system.
Author Contributions
Conceptualization: J.S.H., J.M.B., and J.R.P.; Methodology: J.S.H., J.M.B. and Z.M.H.; Formal Analysis: J.S.H., J.M.B. and Z.M.H.; Writing Original Draft: J.S.H., J.M.B. and J.R.P.; Writing Revised Draft: J.S.H.; Visualization: J.S.H., J.M.B. and Z.M.H.; Supervision: J.R.P. All authors have read and agreed to the published version of the manuscript.
Funding
This research received no external funding.
Institutional Review Board Statement
Not appliable.
Informed Consent Statement
Not appliable.
Data Availability Statement
The original contributions presented in this study are included in the article. Further inquiries can be directed at the corresponding author. All requests will be considered along with any restrictions placed on data sharing given proprietary and legal conditions.
Conflicts of Interest
The authors declare no conflicts of interest. Although the authors are affiliated with First Street, the manuscript does not involve or discuss the company’s products or business activities.
Appendix A. List of Events Studied
| Flood Events | Event Month-Day-Year |
| Hurricane Isidore’s storm surge | 01/09/2002 |
| Hurricane Isabel’s storm surge | 01/09/2003 |
| River Flood near Lansing, MI | 01/05/2004 |
| Hurricane Charley’s storm surge | 01/08/2004 |
| River Flood near Harrisburg, PA | 01/09/2004 |
| River Flood near Pittsburgh, PA | 01/09/2004 |
| Hurricane Jeanne’s storm surge | 01/09/2004 |
| Hurricane Katrina’s storm surge | 01/08/2005 |
| Hurricane Wilma’s storm surge | 01/10/2005 |
| River Flood across eastern Iowa | 01/06/2008 |
| River Flood near Des Moines, IA | 01/06/2008 |
| River Flood near Ames, IA | 01/07/2008 |
| Hurricane Gustav’s storm surge | 01/08/2008 |
| Hurricane Ike’s storm surge | 01/09/2008 |
| River Flood near Springfield, MA | 01/08/2011 |
| Hurricane Irene’s storm surge | 01/08/2011 |
| River Flood across central Pennsylvania | 01/09/2011 |
| Hurricane Isaac’s storm surge | 01/08/2012 |
| Hurricane Sandy’s storm surge | 01/10/2012 |
| River Flood near Toledo, OH | 01/06/2015 |
| River Flood near Beaumont, TX | 01/03/2016 |
| Hurricane Hermine’s storm surge | 01/08/2016 |
| Hurricane Matthew | 01/09/2016 |
| River Flood near Rocky Mount, NC | 01/10/2016 |
| Hurricane Harvey | 01/09/2017 |
| Hurricane Irma’s storm surge | 01/09/2017 |
| Hurricane Florence | 01/09/2018 |
| Hurricane Michael’s storm surge | 01/10/2018 |
| River Flood across eastern Nebraska | 01/03/2019 |
| Fire Events | |
| Valley | 12/09/2015 |
| Erskine | 23/06/2016 |
| Northern California | 09/10/2017 |
| Thomas | 04/12/2017 |
| Carr | 23/07/2018 |
| Ranch | 27/07/2018 |
| Camp | 08/11/2018 |
| Woolsey | 08/11/2018 |
| North Complex | 17/08/2020 |
| Glass | 27/09/2020 |
| Wind Events | |
| Charles | 12/08/2004 |
| Frances | 05/09/2004 |
| Ivan | 11/09/2004 |
| Jeanne | 15/09/2004 |
| Katrina | 25/08/2005 |
| Rita | 24/09/2005 |
| Wilma | 21/10/2005 |
| Gustav | 26/08/2008 |
| Ike | 07/09/2008 |
| Harvey | 25/08/2017 |
| Irma | 06/09/2017 |
| Florence | 14/09/2018 |
| Michael | 08/10/2018 |
| Zeta | 27/10/2020 |
| Ida | 27/08/2021 |
| Ian | 27/09/2022 |
Appendix B. Maps of Events Studied
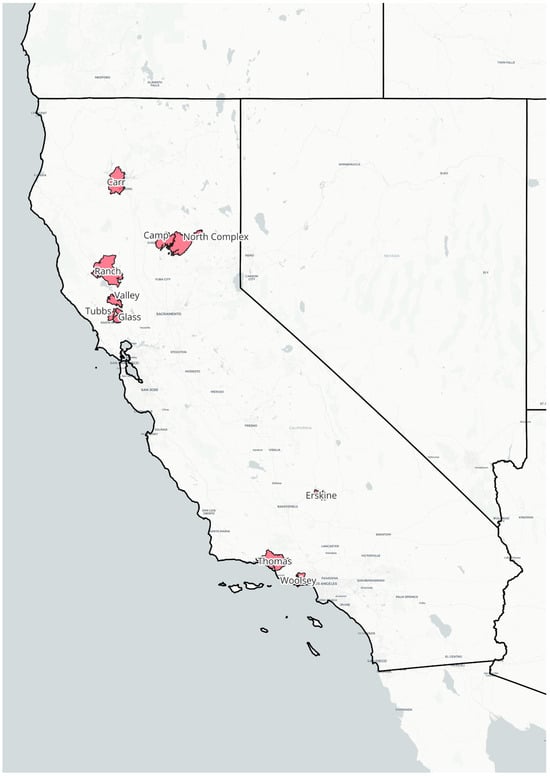
Figure A1.
Wildfire Events Map. Source: ().
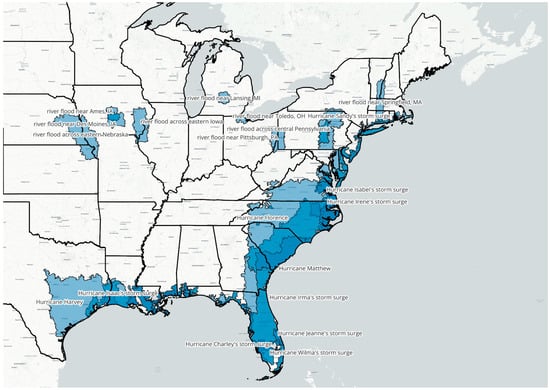
Figure A2.
Flood Events Map. Source: ().
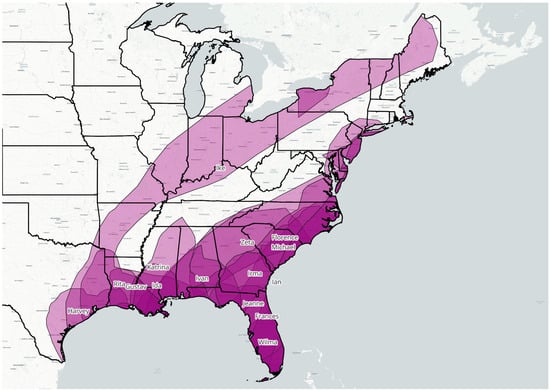
Figure A3.
Wind Events Map. Source: ().
References
- Angrist, J. D., & Pischke, J. S. (2008). Mostly harmless econometrics: An Empiricist’s companion. Princeton University Press. [Google Scholar]
- Atreya, A., Ferreira, S., & Kriesel, W. (2013). Forgetting the flood? An analysis of the flood risk discount over time. Land Economics, 89(4), 577–596. [Google Scholar] [CrossRef]
- Bernstein, A., Gustafson, M., & Lewis, R. (2019). Disaster on the horizon: The price effect of sea level rise. Journal of Financial Economics, 134(2), 253–272. [Google Scholar] [CrossRef]
- Bhutta, N., Dokko, J., & Shan, H. (2010). The depth of negative equity and mortgage default decisions. Finance and economics discussion series 2010-35. Board of Governors of the Federal Reserve System. [Google Scholar]
- Bin, O., & Polasky, S. (2004). Effects of flood hazards on property values: Evidence before and after Hurricane Floyd. Land Economics, 80(4), 491–506. [Google Scholar] [CrossRef]
- Biswas, S., Hossain, M., & Zink, D. (2023). California wildfires, property damage, and mortgage repayment (Working Paper No. 23-05). Federal Reserve Bank of Philadelphia. [Google Scholar]
- Callaway, B., & Sant’Anna, P. H. C. (2021). Difference-in-differences with multiple time periods. Journal of Econometrics, 225(2), 200–230. [Google Scholar] [CrossRef]
- Cameron, A. C., & Miller, D. L. (2015). A practitioner’s guide to cluster-robust inference. Journal of Human Resources, 50(2), 317–372. [Google Scholar] [CrossRef]
- Clarke, D. J., & Dercon, S. (2016). Dull disasters? How planning ahead helps when things get bad. In The Oxford handbook of the economics of disasters. Oxford University Press. [Google Scholar]
- Dastrup, S. R., Gabriel, S. A., & Zias, R. (2021). Hurricanes and mortgage performance: Evidence from the Community Reinvestment Act. Journal of Urban Economics, 125, 103369. [Google Scholar]
- Deng, Y., Gabriel, S. A., & Nothaft, F. E. (2003). The role of loan-to-value and debt-to-income ratios in the market for mortgage credit. Journal of Urban Economics, 54(3), 488–507. [Google Scholar]
- Di Maggio, M., Kermani, A., Keys, B. J., Piskorski, T., Ramcharan, R., Seru, A., & Yao, V. (2017). Interest rate pass-through: Mortgage rates, household consumption, and voluntary deleveraging. American Economic Review, 107(11), 3550–3588. [Google Scholar] [CrossRef]
- Federal Housing Finance Agency (FHFA). (2025). National mortgage database (NMDB)—Residential mortgage performance statistics. Available online: https://www.fhfa.gov/data/national-mortgage-database-aggregate-statistics (accessed on 4 June 2025).
- Federal Reserve Bank of Richmond. (2025, March 27). Hurricane Helene’s impact on housing in Western North Carolina. Regional Matters. Available online: https://www.richmondfed.org/research/national_economy/macro_minute/2024/hurricane_helene_flood_risk_and_insurance_20241015#:~:text=Low%20Uptake%20of%20Flood%20Insurance,need%20of%20relief%20following%20Helene (accessed on 4 June 2025).
- First Street. (2025). 13th national risk assessment: Climate, the sixth “C” of credit. First Street Foundation Research Library. [Google Scholar]
- Foote, C. L., Gerardi, K., & Willen, P. S. (2008). Negative equity and foreclosure: Theory and evidence. Journal of Urban Economics, 64(2), 234–245. [Google Scholar] [CrossRef]
- Fuster, A., Goodman, L., Lucca, D. O., Madar, L., Molloy, L., & Willen, P. S. (2013). The rising gap between primary and secondary mortgage rates. Economic Policy Review (Federal Reserve Bank of New York), 19(2), 17–39. [Google Scholar]
- Gallagher, J. (2014). Learning about an infrequent event: Evidence from flood insurance. American Economic Journal: Applied Economics, 6(3), 206–236. [Google Scholar] [CrossRef]
- Gallagher, J., Hartley, D., & Parker, N. (2020). The impact of natural disasters on mortgage delinquency. Federal Reserve Bank of Cleveland. [Google Scholar]
- Gerardi, K., Lambie-Hanson, L., & Willen, P. S. (2010). The impact of unemployment on mortgage default [Unpublished manuscript]. Federal Reserve Bank of Atlanta.
- Gourevitch, J. D., Kousky, C., Liao, Y., Nolte, C., Pollack, A. B., Porter, J. R., & Weill, J. A. (2023). Unpriced climate risk and the potential consequences of overvaluation in US housing markets. Nature Climate Change, 13, 250–257. [Google Scholar] [CrossRef]
- He, J., & Wang, H. (2017). The impact of natural disasters on household consumption: Evidence from the 2008 Wenchuan earthquake in China. Natural Hazards, 87(1), 543–562. [Google Scholar]
- Insurance Information Institute. (2025). Facts + Statistics: Homeowners insurance. Available online: https://www.iii.org/fact-statistic/facts-statistics-homeowners-and-renters-insurance (accessed on 4 June 2025).
- Issler, P., Stanton, R. H., Vergara-Alert, C., & Wallace, N. E. (2024). Housing and mortgage markets with climate risk: Evidence from wildfires in California. Available online: https://ssrn.com/abstract=3511843 (accessed on 4 June 2025).
- Kousky, C. (2019). The US National Flood Insurance Program in historical perspective. Risk Management and Insurance Review, 22(3), 243–261. [Google Scholar]
- Kunreuther, H., & Michel-Kerjan, E. (2009). At War with the weather: Managing large-scale risks in a new era of catastrophes. MIT Press. [Google Scholar]
- MacDonald, D. N., Murdoch, J. C., & White, H. L. (1987). Uncertain hazards, insurance, and consumer choice: Evidence from housing markets. Land Economics, 63(4), 361–371. [Google Scholar] [CrossRef]
- National Low Income Housing Coalition (NLIHC). (2023, January 17). New data from household pulse survey suggest disparities among households displaced by disasters. Memo to Members. Available online: https://nlihc.org/resource/new-data-household-pulse-survey-suggest-disparities-among-households-displaced-disasters#:~:text=As%20of%20December%202022%2C%20nearly,for%20longer%20periods%20of%20time (accessed on 4 June 2025).
- National Oceanic and Atmospheric Administration (NOAA). (2025). Billion-dollar weather and climate disasters: Summary statistics. National Centers for Environmental Information. Available online: https://www.ncei.noaa.gov/access/billions/ (accessed on 4 June 2025).
- Ouazad, A., & Kahn, M. E. (2023). Mortgage securitization dynamics in the aftermath of natural disasters: A reply. Available online: https://ssrn.com/abstract=4445723 (accessed on 4 June 2025).
- Polygon Research. (2025). HMDAVision: Mortgage market analytics platform. Available online: https://www.polygonresearch.com/polygon-vision (accessed on 4 June 2025).
- Sun, L., & Abraham, S. (2021). Estimating dynamic treatment effects in event studies with heterogeneous treatment effects. Journal of Econometrics, 225(2), 175–199. [Google Scholar] [CrossRef]
- U.S. Census Bureau. (2024). Nearly all U.S. counties had more homeowners than renters between 2019 and 2023 (Press Release CB24-208, December 12, 2024). U.S. Census Bureau.
Disclaimer/Publisher’s Note: The statements, opinions and data contained in all publications are solely those of the individual author(s) and contributor(s) and not of MDPI and/or the editor(s). MDPI and/or the editor(s) disclaim responsibility for any injury to people or property resulting from any ideas, methods, instructions or products referred to in the content. |
© 2025 by the authors. Licensee MDPI, Basel, Switzerland. This article is an open access article distributed under the terms and conditions of the Creative Commons Attribution (CC BY) license (https://creativecommons.org/licenses/by/4.0/).