Abstract
This study expands the tourism development literature by examining how currency valuation and financial sector maturity influence the tourism–growth relationship. While prior research emphasizes direct or bidirectional causality, this study distinguishes itself by exploring the mediating and moderating roles of financial development and exchange rate stability. Using an instrumental variables approach and empirical data from Africa, we find that exchange rates and financial development partially mediate tourism’s effect on economic growth, particularly in economies with weaker currencies and more developed financial systems. Our results challenge the tourism–growth neutrality hypothesis by demonstrating that exchange rates not only influence tourism demand but also actively shape its growth effects. A panel ARDL analysis confirms bidirectional causality, which reinforces the interdependence between tourism and growth. However, unlike previous studies that view tourism as an isolated driver of growth, we demonstrate that its economic impact depends on a country’s financial maturity and exchange rate competitiveness. Policy recommendations aimed at enhancing economic growth through improved tourism and financial infrastructure are offered.
1. Introduction
Tourism has long been viewed as a strategic pathway to economic development in many developing economies (Aboagye & Kwakwa, 2023; Asongu et al., 2023; Nyasha et al., 2021). This is largely due to four unique features of the sector that align with these countries’ growth challenges. First, it is relatively low-tech (Lee et al., 2021), meaning it requires less advanced infrastructure than many other industries. This is an obvious advantage for countries with limited technological capacity.
Second, tourism offers widespread employment opportunities, particularly for women and youth. The World Travel & Tourism Council (WTTC, 2019) highlights the sector’s capacity to absorb young workers (ages 15 to 24) and women, both of whom make up a significant portion of the tourism labor force. Voumik et al. (2023) found that rising tourism activities are associated with increased labor force participation among women. In Africa, this inclusivity is crucial, given persistently high unemployment rates among women and youth (Statista, 2024).
Third, the industry promotes educational and cultural tourism. African nations with rich ecological and cultural heritage can attract visitors seeking authentic learning experiences. Educational tourism, which emphasizes heritage, wildlife, indigenous knowledge, and exchange programs, offers a path to build appreciation for African values (Ankomah & Larson, 2000).
Fourth, tourism generates significant employment and income. According to WTTC (2023), prior to the COVID-19 pandemic, tourism supported over 10% of global GDP and one in five new jobs. Beyond direct employment in hospitality, travel, and retail, tourism indirectly supports local supply chains and generates broader economic benefits (Ivanov & Webster, 2007; Dritsakis, 2004; Durbarry, 2004; Akan et al., 2007). These insights are reinforced by more recent empirical studies (e.g., Cárdenas-García et al., 2024; Singh & Alam, 2024; Panagiotidis et al., 2023).
Scholars explain the tourism–growth link with three hypotheses: (1) tourism-led growth, where tourism drives growth (Haini et al., 2024; Almeida, 2023; Adeleye et al., 2022); (2) growth-led tourism, where economic expansion stimulates tourism (Khanna & Sharma, 2023; Rivera, 2017; Payne & Mervar, 2010); and (3) a reciprocal relationship, in which tourism and growth reinforce one another (Wijesekara et al., 2022; Pulido-Fernández & Cárdenas-García, 2021; Odhiambo & Nyasha, 2020; Bilen et al., 2015; Apergis & Payne, 2012).
Unfortunately, in many developing economies, significant obstacles hinder the full realization of the benefits of international tourism. These obstacles include inadequate air infrastructure, poor visa facilitation, ineffective tourism marketing, and, most critically, a weak financial system. This study argues that a well-developed financial system and a stable exchange rate regime are essential for maximizing tourism’s positive impact on economic growth. Accordingly, the central hypothesis is that exchange rate stability and country-level financial development are key drivers of the tourism–growth relationship.
Accordingly, this study aims to analyze tourism’s direct effect on growth using a continent-wide dataset, evaluate how financial development and exchange rate conditions mediate that relationship, explore moderation effects, that is, whether these conditions alter the strength of tourism’s growth impact, and reassess bidirectional causality between tourism and growth, testing both the tourism-led and growth-led views.
In a methodological departure from previous studies, we apply a two-part methodology: a static panel analysis (via Baron and Kenny’s mediation steps) and a dynamic model using an error-correction framework. Further, this work uses a much broader dataset than most existing studies, many of which focus on only a few countries on the continent. Here, we include 31 African countries spanning north and sub-Saharan regions, offering greater generalizability.
2. Exchange Rates, Financial Development, and Growth
The linkages among exchange rates, financial development, tourism, and economic growth are multifaceted and often bidirectional. While many existing studies have explored specific two-way relationships, such as tourism and exchange rate movements (e.g., Adeleye et al., 2022; Obi et al., 2016) or tourism and financial development (Aboagye & Kwakwa, 2023; Abbas et al., 2022), few have examined these connections within an integrated framework. This study fills that gap by demonstrating that both exchange rate dynamics and financial system maturity serve as critical enablers (or constraints) in the tourism–growth ecosystem.
A competitive exchange rate can substantially increase a destination’s attractiveness by improving tourists’ purchasing power. Ding and Timmer (2023) argue that favorable exchange rates increase visitor spending and length of stay, making destinations more appealing, particularly for budget-conscious travelers. As a result, countries with stable or undervalued currencies can gain a larger share of international tourism revenues (Obi et al., 2016).
In parallel, financial development influences tourism by improving access to capital and enabling efficient transactions. Research has shown that tourism can drive financial innovation in low-income economies (Khanna & Sharma, 2023; Abbas et al., 2022). Building on the financial development frameworks of Čihák et al. (2012) and Svirydzenka (2016), Aboagye and Kwakwa (2023) provide evidence that the positive effects of tourism on financial development are especially pronounced in economies with weaker financial systems. These findings support the inclusion of both exchange rate conditions and financial development as mediating mechanisms in the conceptual model proposed in this study.
3. Literature Review
The tourism sector is a critical contributor to national economies, particularly in terms of foreign exchange earnings. According to the World Tourism Organization (WTO), tourism is defined as “a social, cultural, and economic phenomenon involving the movement of people to countries or places outside their usual environment for personal or professional reasons” (IRTS, 2008, 2.9). However, tourism activity is often influenced by macroeconomic conditions, including currency fluctuations. For instance, a depreciation in the local currency can enhance the spending power of foreign visitors, thereby increasing tourist inflows (Adeleye et al., 2022). In addition to generating foreign exchange, tourism revenues are instrumental in supporting capital imports, building foreign reserves, and financing essential inputs (Matthew et al., 2021; Ehigiamusoe, 2021; Kumar Narayan et al., 2010). This literature review is structured into three thematic areas: (i) the relationship between tourism and economic growth, (ii) the connection between financial development and both tourism and economic growth, and (iii) the role of exchange rate movements in shaping tourism outcomes and their economic implications.
3.1. Tourism–Growth Relationship
Four main theoretical perspectives dominate the literature on the tourism–growth nexus: the tourism-led growth hypothesis, the growth-led tourism hypothesis, the reciprocal (or feedback) hypothesis, and the neutrality hypothesis. The tourism-led growth hypothesis argues that tourism acts as a catalyst for economic expansion by stimulating production, employment, and investment, especially in low-income countries. Meta-analyses by Alcalá-Ordóñez et al. (2023), Le et al. (2022), Naseem (2021), Songling et al. (2019), Nunkoo et al. (2019/2020), and Brida et al. (2016) affirm the predominance of this view, though most of the data analyzed relate to non-African economies. The vulnerabilities of tourism to global shocks were highlighted during the COVID-19 pandemic, as studies by Gounder and Cox (2021) and Koçak et al. (2022) illustrate its adverse economic ripple effects, particularly in tourism-dependent countries.
On the other hand, the growth-led tourism hypothesis argues that economic development enables tourism by increasing disposable income, improving infrastructure, and expanding services. Empirical support for this view comes from studies like Colacchio and Vergori (2023) in Italy, Zhang et al. (2021) in China, Rivera (2017) in Ecuador, and Oh (2005) in South Korea. The reciprocal hypothesis suggests mutual causality, in that tourism and economic growth reinforce each other. This stance is supported by Dritsakis (2004), Durbarry (2004), Balcilar et al. (2014), Nene and Taivan (2017), and Rasool et al. (2021), among others. Several studies (e.g., Chiu, 2021; Yazdi et al., 2017; Ridderstaat et al., 2014; Katircioglu, 2009; Apergis & Payne, 2012) provide evidence of such bidirectional effects.
In contrast, the neutrality hypothesis maintains that no significant causal link exists between tourism and growth. This position is supported by studies such as Katircioglu (2009) for Turkey and Tang and Jang (2009) for the United States. Notably, most of these studies focus on specific countries or small regional groups, often excluding much of Africa. This study addresses that gap by covering 31 African economies and introducing mediating and moderating variables, namely financial development and exchange rates, to investigate the conditions under which tourism can influence economic outcomes.
3.2. Financial Development, Economic Growth, and Tourism
Financial development encompasses the institutions, markets, tools, and regulatory mechanisms that facilitate efficient credit allocation and economic transactions. It plays a dual role in economic development. It does this directly by mobilizing savings for investment, and indirectly by optimizing the allocation of capital resources (Menegaki & Tiwari, 2022; Ehigiamusoe, 2021).
Two major schools of thought dominate the finance–growth debate. The supply-leading hypothesis, rooted in Schumpeter’s (1911) theory, posits that financial sector growth precedes and stimulates broader economic development. Empirical support is extensive, including studies by Levine et al. (2000), Beck et al. (2000), Kouki and Harrathi (2013), Amoro (2014), Ehigiamusoe and Lean (2018), and Menyari (2019). Alternatively, the demand-following hypothesis contends that economic expansion increases demand for financial services, leading to financial sector growth (Ghirmay, 2004; Ang & McKibbin, 2007; Blanco, 2009). Some studies also suggest a bidirectional relationship (Apergis et al., 2007; Bangake & Eggoh, 2011; Adusei, 2013; Musakwa & Odhiambo, 2022), while others find no significant link (Atindehou et al., 2005; Gries et al., 2009; Grassa & Gazdar, 2014; Chortareas et al., 2015; Musakwa et al., 2022).
In relation to tourism, financial development improves access to credit and reduces transaction costs, thereby facilitating travel, business expansion, and investment in tourism infrastructure (Al-Mulali et al., 2021). Several empirical studies, such as those by Aboagye and Kwakwa (2023), Khanna and Sharma (2023), and Shahbaz et al. (2019), highlight the positive interplay between tourism and financial development across diverse regional contexts, including BRICS, South Asia, and sub-Saharan Africa. Some of these studies found that tourism spurs financial development (e.g., Cannonier & Burke, 2017; Li & Qamruzzaman, 2022), while others suggested that financial development is a prerequisite for tourism growth (Başarir & Çakir, 2015; Katircioglu et al., 2018; Khan et al., 2019).
3.3. Tourism, Exchange Rates, and Economic Growth
Exchange rate movements directly affect the cost of travel, making them a crucial factor in determining tourism flows. A depreciated currency enhances a country’s affordability to foreign visitors, which can potentially increase tourist arrivals and expenditures (Adeleye et al., 2022). However, the tourism–exchange rate–growth relationship is complex and context-dependent.
Some studies report significant causal links among these variables. Akadiri and Akadiri (2021), for example, observed that both tourism and exchange rate movements drive economic growth in small island economies. Conversely, Garcia (2012) argued that tourism does not inherently lead to growth unless accompanied by effective policy measures for foreign exchange utilization and tax collection.
Other studies have shown mixed results. Primayesa et al. (2017) found no long-term link between exchange rates and tourism in Indonesia, while Harvey et al. (2013) reported short-term effects in Malaysia and Indonesia, and both short- and long-term impacts in the Philippines. Our study builds on these insights by analyzing the mediating role of exchange rates in the tourism–growth nexus for African economies. Unlike the previous literature, we incorporate both exchange rate conditions and financial development as potential transmission channels using robust econometric models.
4. Conceptual Model and Hypotheses
4.1. Conceptual Framework
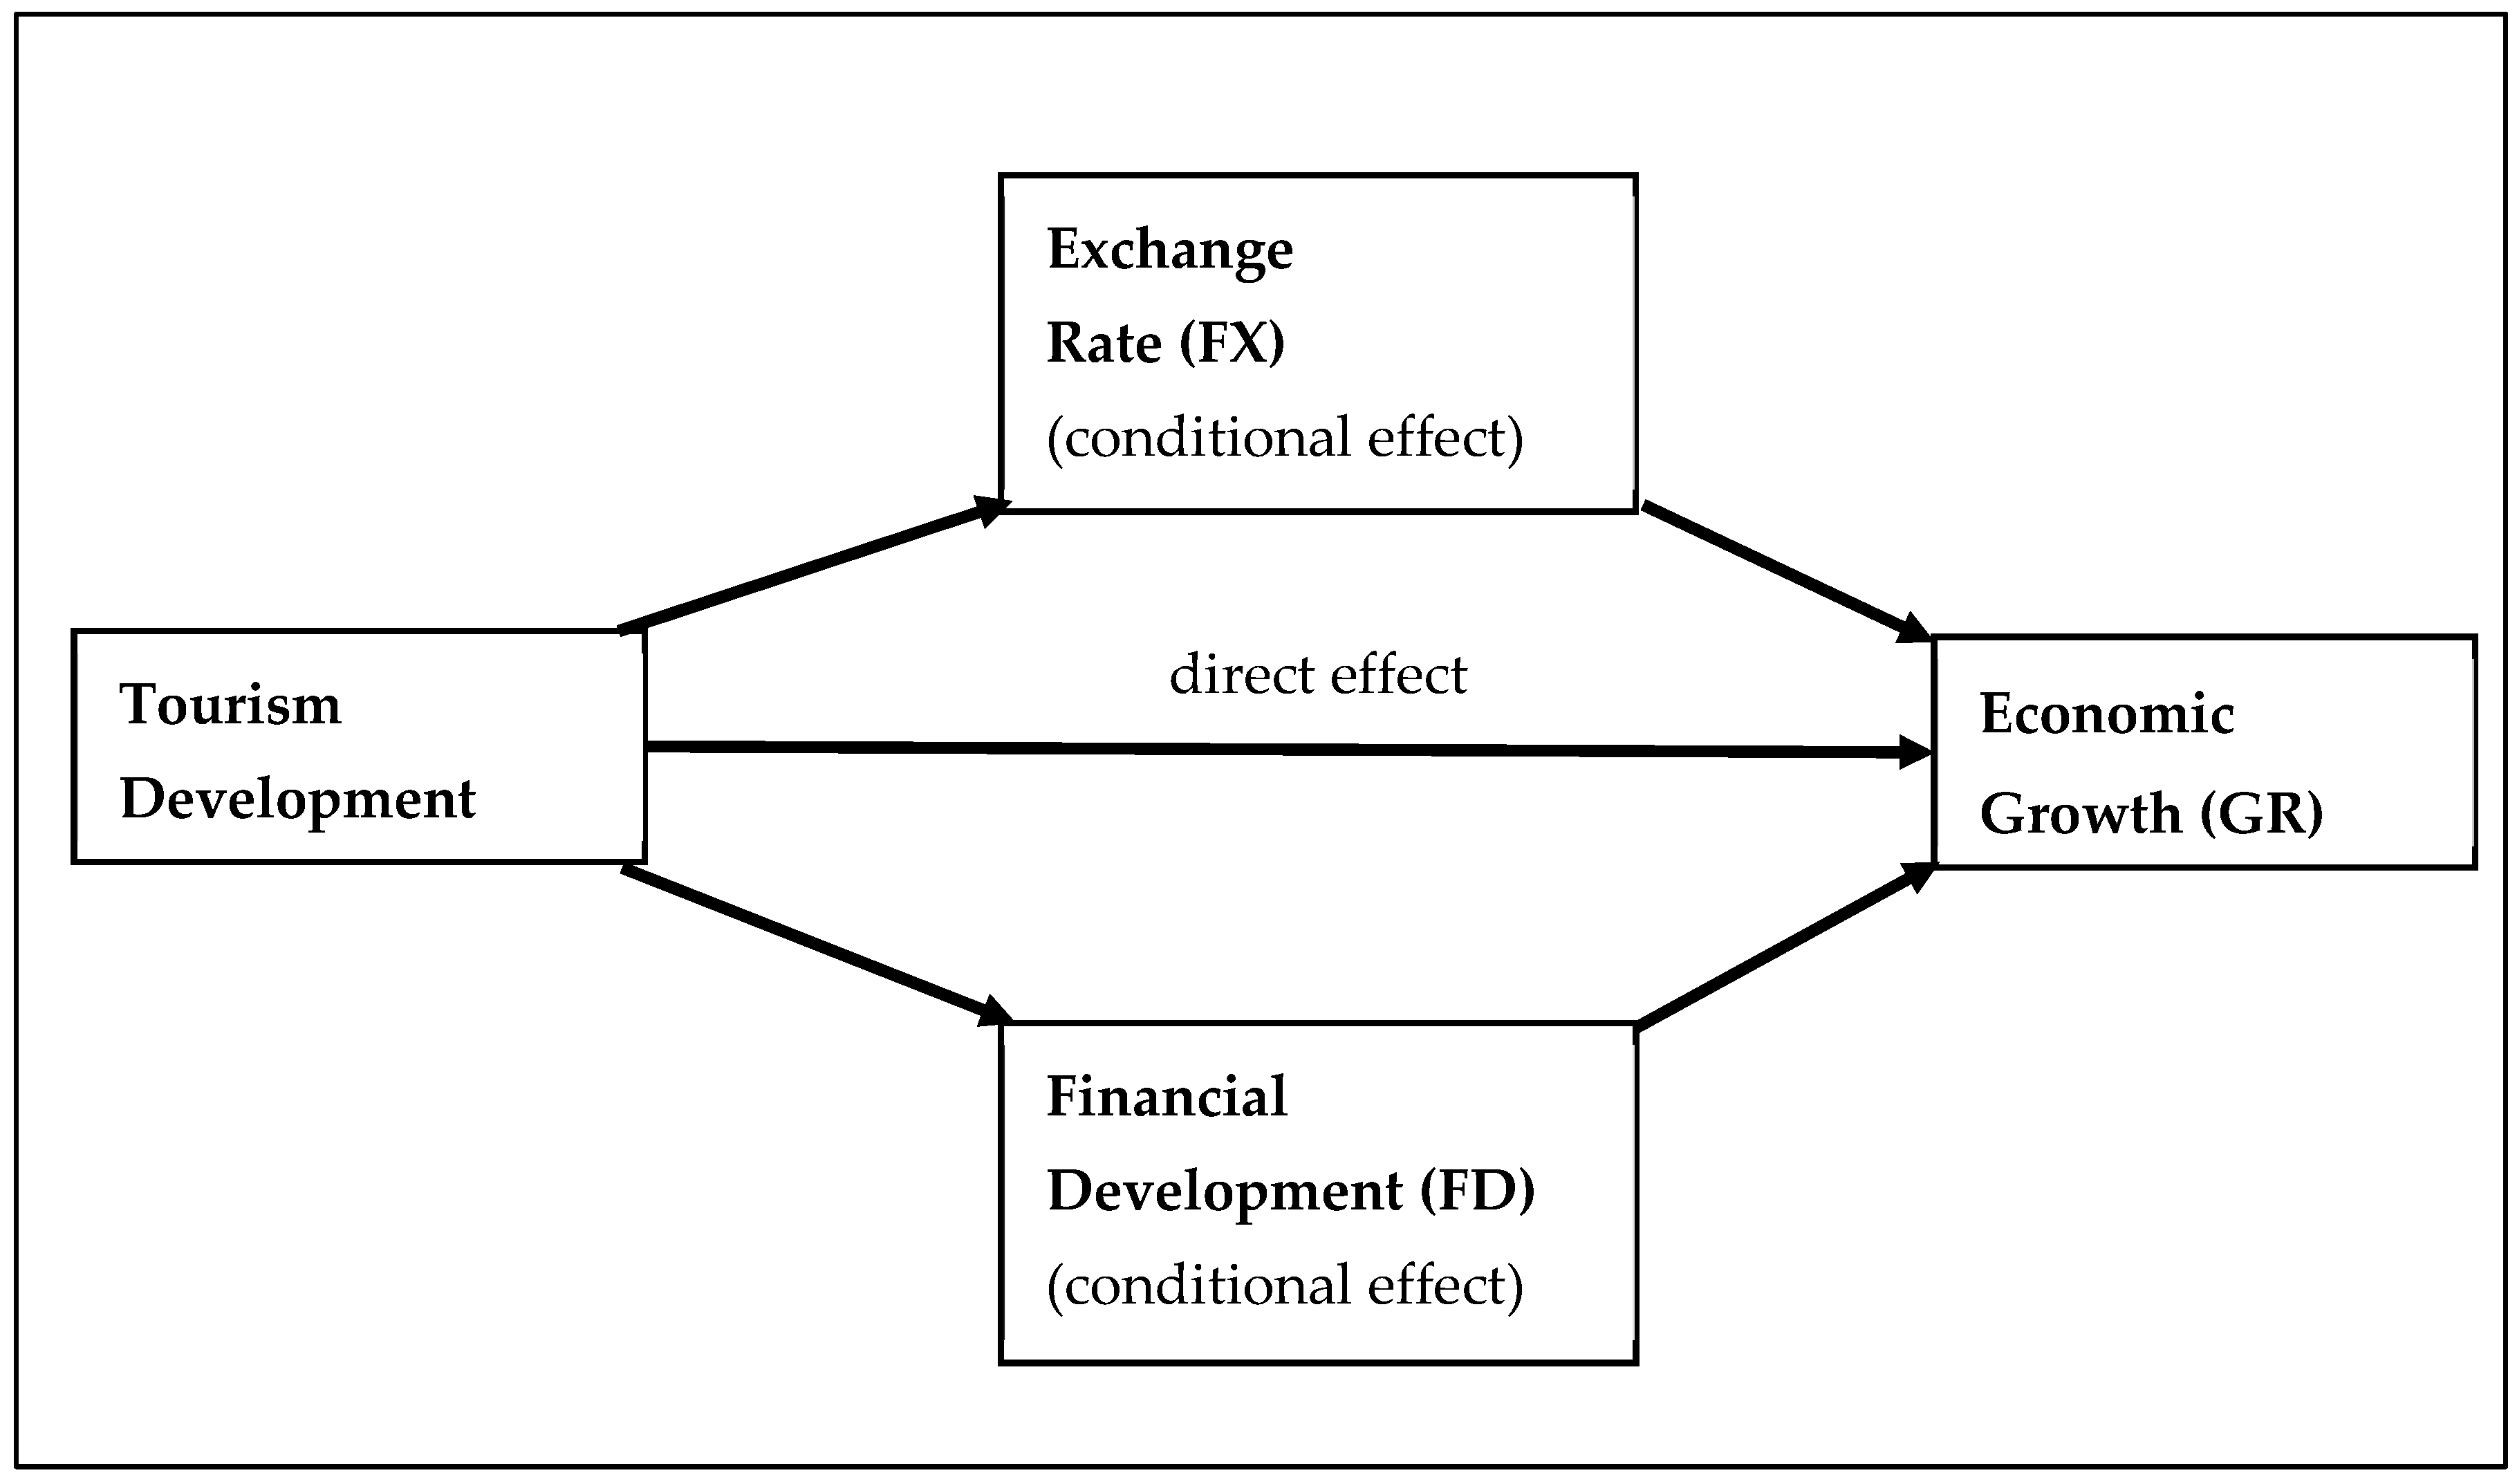
The conceptual framework for this study is presented in Figure 1. It illustrates the complex relationship between tourism and economic growth. It also delineates the mediating influence of financial development and exchange rate dynamics. These two mediators serve as essential channels through which tourism may impact broader economic outcomes.
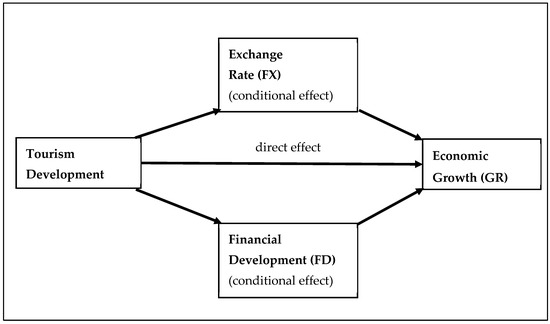
Figure 1.
Conceptual model illustrating the mediating roles of financial development and exchange rate in the tourism–growth nexus (source: authors’ own work).
In particular, the framework illustrates that a country’s financial sector’s maturity and exchange rate competitiveness can significantly condition the effect of tourism development on economic growth. The logic is that financial development enhances credit access, supports business expansion, and facilitates transactions, while a favorable exchange rate boosts tourism inflows by increasing the purchasing power of foreign visitors. Collectively, these variables shape both the intensity and effectiveness of tourism-driven growth across countries.
This model integrates both mediating and moderating pathways and reflects the multifaceted role of financial and macroeconomic conditions in shaping tourism’s impact on economic performance.
4.2. Research Objectives
This study is guided by three key objectives. The first is to investigate how exchange rate movements influence the relationship between tourism development and economic growth. The second is to evaluate the mediating role of financial development in shaping the tourism–growth linkage. The third objective is to explore the dynamic interactions among the variables using a panel-based estimation model that captures both short-run and long-run effects across countries.
4.3. Research Hypotheses
From the conceptual framework and research objectives, the following four hypotheses are proposed:
- H1: The impact of tourism development on economic growth is contingent on the country’s level of financial development and exchange rate conditions.
- H2: Financial development and exchange rates moderate the relationship between tourism and economic growth, such that the strength or direction of the relationship varies depending on these contextual factors.
- H3: Tourism development positively influences economic growth in both the short and long run when exchange rate dynamics are accounted for in the model.
- H4: Economic growth positively influences tourism development over both short- and long-term horizons, contingent on currency valuation effects.
5. Data and Methodology
This study employs a cross-country panel dataset comprising 31 African nations, selected based on the availability of consistent data in the period 2000–2020. While the initial sample included all 54 countries on the continent, incomplete records led to the exclusion of some economies, particularly those lacking continuous time series data for the variables of interest. The final sample includes a mix of countries from both North and sub-Saharan Africa, allowing for a more holistic continental analysis.
Data were sourced from a variety of authoritative databases. Real GDP and exchange rate indicators were extracted from the World Bank’s World Development Indicators (WDI), while data on tourist arrivals and tourism receipts were obtained from the United Nations World Tourism Organization (UNWTO). The level of financial development in each country was proxied using the IMF’s Financial Development Index.
To control for other macroeconomic factors that may affect economic performance, we included inflation (measured by the consumer price index), population growth, and political stability. These control variables are consistent with those used in recent empirical studies examining tourism and economic growth dynamics (e.g., Singh & Alam, 2024; Albaladejo et al., 2023; Panagiotidis et al., 2023). Table 1 summarizes all variables used in the analysis, along with their descriptions and data sources.

Table 1.
Variable definition and data sources.
5.1. Model Specification
The analytical approach that we used is grounded in the neoclassical growth model originally developed by Ramsey (1928) and later extended by Solow (1956). This framework suggests that capital accumulation, including discretionary spending such as tourism-related consumption, contributes to economic expansion through multiplier effects. To capture the direct and indirect relationships, we estimated several equations. The baseline model in Equation (1) measures the direct effect of tourism receipts (TR) on economic growth (GR), controlling for other macroeconomic variables. Subsequent models introduce the exchange rate (FX) and financial development (FD) as mediators.
where GR refers to economic growth, measured by real per capita GDP, and TR refers to tourism receipts. Similar to the specifications in Aduba et al. (2023) and Panagiotidis et al. (2023), the control variables include the inflation rate, measured as the change in consumer price index, population growth, and political stability, and the time-dependent error term is , while and are the group-specific and idiosyncratic error terms, respectively.
Equations (2) and (3) present the mediation structure for FX and FD, respectively.
The coefficients and measure the direct effects of the associated regressors. To test for mediation effects, we followed Baron and Kenny’s (1986) four-step procedure, widely adopted in econometric studies (e.g., Truong & Berrone, 2022; Aduba et al., 2023). The models were initially estimated using a fixed effects (FE) panel approach to control for country-specific heterogeneity. However, since endogeneity was a concern, we also employed a two-stage least squares (2SLS) method, using lagged variables and theoretically justified instruments to mitigate bias. The mediation steps are outlined as follows:
Model 1, TR should significantly affect GR:
Model 2a, TR should significantly affect FD:
Model 2b, TR should significantly affect FX:
Model 3a, FD should affect GR:
Model 3b, FX should affect GR:
The mediator should significantly affect GR in the following final estimation models, presented earlier as Equations (2) and (3):
Model 4a:
Model 4b:
In Equations (2) and (3), the effect of FX and FD on GR () should remain significant. However, the effect of TR on GR () should decrease if partial mediation or become non-significant if full mediation. Similar to the design in Truong and Berrone (2022), our analysis initially used the fixed effects model in order to control for heterogeneity across groups. However, the additional problem of endogeneity is likely to persist due to correlations between the regressors and the error term. To address potential endogeneity, Wu et al. (2020) and Shaver (2005) suggested using a two-stage least squares (2SLS) regression with lagged regressors as internal instruments or any suitable internal instruments. The sufficiency of internal instruments was also noted by Roodman (2009).
To explore moderating effects, we introduced interaction terms between TR and the two mediating variables (FX and FD), as shown in Equations (9) and (10). This allowed us to assess whether the strength of the tourism–growth relationship is influenced by exchange rate dynamics or financial sector development. The strength of moderation is measured by the size, sign, and statistical significance of (Azmy et al., 2023; Hayes, 2017).
5.2. Dynamic Panel Data Estimation with Error Correction
To complement the static mediation models, we implemented a panel autoregressive distributed lag (ARDL) model in its error correction form. This dynamic specification allowed us to account for both short- and long-run relationships between variables, with heterogeneous short-run coefficients across countries but homogeneous long-run effects. The pooled mean group (PMG) estimator, developed by Pesaran et al. (1999), was employed for this purpose. The general form of the ARDL model is described in Equations (11) and (12) below:
And with FD included in the model,
Equations (11) and (12) are re-examined for reverse causality by specifying TR as the target variable in the following models:
And with FD included as a regressor,
The short-run coefficients are , , and , while the long-run coefficient is . The error-correction term in the parenthesis is the long-run representation in the unrestricted ECM. Its coefficient, , is the speed of adjustment to equilibrium. With the PMG estimation, the short-run coefficients (, , and ) and the speed of adjustment () can be examined for causality in the entire panel as well as across the countries.
Overall, this framework enabled us to test bidirectional causality between tourism and growth while accounting for the influence of financial development and exchange rate competitiveness. Prior to estimation, unit root tests were conducted to ensure that none of the variables were integrated by an order two or higher, which could invalidate the ARDL approach. The model’s design allowed for a mix of I(0) and I(1) variables, which made it well suited for macroeconomic panel data.
6. Results
This section presents the empirical findings in four parts: (1) summary statistics and data characteristics, (2) analysis of the mediating roles of exchange rate and financial development, (3) examination of moderating effects through interaction terms, and (4) dynamic panel results based on the ARDL cointegration framework.
6.1. Descriptive Statistics
Table 2 reports the descriptive statistics for all key variables. The GDP figures, both total and per capita, exhibit considerable dispersion. For instance, real GDP ranges from $0.14 billion to over $500 billion, with a mean of $53.6 billion and a standard deviation nearly twice that value, indicating significant heterogeneity among the sampled countries. Similar patterns are observed for tourism receipts and tourist arrivals, where the distributions are positively skewed, suggesting that most countries have relatively low values, with a few outliers reporting very high figures. This disparity is further emphasized in the kurtosis and skewness statistics, which highlight the clustering of countries at the lower end of the economic and tourism performance spectrum. These characteristics suggest that tourism may serve as a significant growth lever for lower-income countries. Appendix A shows that countries with the highest tourism receipts per capita generally correspond with those that have the highest GDP per capita, suggesting a potential link between tourism development and economic performance.
Table 2.
Descriptive statistics.
6.2. Correlation Analysis
The correlation matrix presented in Table 3 provides insights into variable relationships. Notably, tourism receipts and population growth exhibit strong positive correlations with real GDP, implying their relevance in explaining economic performance across the sample. Tourism-related variables such as tourist arrivals and tourism receipts are also highly correlated with each other, which may pose multicollinearity concerns in regression models. Similarly, positive associations are observed between financial development and both GDP and tourism metrics. These correlations validate the inclusion of these variables as mediators in the tourism–growth framework. Additionally, the matrix helps identify potential substitutes for robustness checks, e.g., using tourist arrivals in place of tourism receipts, where applicable.
Table 3.
Correlation matrix.
6.3. Mediating Analysis: Exchange Rate and Financial Development
The mediation analysis, presented in Table 4, followed Baron and Kenny’s (1986) four-step framework. First, the direct effect of tourism receipts on economic growth was estimated, yielding a statistically significant and positive coefficient (0.0258, p < 0.01), thereby confirming the tourism-led growth hypothesis (Model 1).
Table 4.
Estimation results of the mediating effects of exchange rate and financial development.
Next, we assessed whether tourism significantly affects the two mediating variables. The results show that tourism receipts are negatively associated with FX(Model 2) and positively associated with FD(Model 3), consistent with theoretical expectations: more tourists strengthen the local currency and encourage financial sector expansion.
In the third step, we tested the impact of each mediator on economic growth, excluding tourism from the model. Both FX and FD exhibit positive and statistically significant effects on growth, supporting their roles as channels through which tourism exerts economic influence (Models 4 and 5, respectively).
Finally, when both tourism and the mediators are included in the model, the coefficients for FX and FD remain significant, while the coefficient for tourism declines—indicating partial mediation (Models 6 and 7). For instance, tourism’s coefficient drops from 0.0258 to 0.0216 in the FX model (a 16.35% reduction), and to 0.021 in the FD model (an 18.4% reduction). These results confirm H1, that the tourism–growth effect is shaped by both financial development and exchange rate conditions. The two-stage least squares (2SLS) estimation was used to address endogeneity. Instrument validity was confirmed through strong F-statistics and Hansen J-statistics, indicating robust identification and reliable inference.
6.4. Moderating Effects: Interaction Analysis
Table 5 presents the results of moderation analysis using interaction terms between tourism receipts and each mediator. In Panel A, the interaction term (TR × FX) is positive and significant at the 1% level, suggesting that tourism’s impact on growth is amplified in countries with more favorable exchange rates. The main effect of FX becomes negative, likely due to multicollinearity with the interaction term—a common occurrence in moderation analysis.
Table 5.
The moderating effects of FX and FD.
In Panel B, the interaction between tourism receipts and financial development (TR × FD) also shows a strong and positive effect on growth. This implies that tourism is more effective in stimulating economic activity in countries with more advanced financial systems. These findings support H2, confirming that both exchange rate and financial development condition the strength of the tourism–growth relationship.
6.5. Dynamic Panel Analysis: ARDL Cointegration Model
To capture long-term relationships and short-term dynamics, we estimated a panel ARDL model using the pooled mean group (PMG) estimator. The specification included both tourism receipts and the two mediators, as well as control variables. Stationarity test results are summarized in Table 6, while the panel ARDL results are presented in Table 7 and Table 8.
Table 6.
Panel unit root test summary.
Table 7.
Panel ARDL esults (arget ariable: GR).
Table 8.
Panel ARDL esults (arget ariable: TR).
The results confirm cointegration among the key variables, indicating the existence of long-run equilibrium relationships. In the long term, both tourism and financial development are positively associated with economic growth (Table 7). Reverse causality tests, the case where tourism is treated as the dependent variable (Table 8), reveal that economic growth also influences tourism receipts, especially in the long run. The error correction term is negative and significant, validating the adjustment process toward long-run equilibrium. These findings support H3 and H4, and thus provide evidence of bidirectional causality within the tourism–growth argument when financial and macroeconomic factors are taken into account.
Overall, the results confirm the presence of both tourism-led growth and growth-led tourism, regardless of the model used to analyze the interrelationships. In all cases, currency valuation and financial development play a significant role in that dynamic. Evidence of cointegration between tourism and growth was found in nearly all countries, as shown in Table 9. However, the speed of adjustment varies widely, reflecting different levels of economic growth and tourism development across the continent. Table 10 presents a summary of the confirmation of the four hypotheses of this study.
Table 9.
Cross-section cointegrating coefficients.
Table 10.
Hypothesis confirmation summary.
7. Robustness Checks
To ensure the reliability and consistency of the empirical findings, we conducted several robustness checks by modifying model specifications, testing alternative proxies, and re-estimating results with different estimation techniques.
7.1. Alternative Measures of Tourism Development
To validate the role of tourism in economic growth, we substituted tourism receipts with tourist arrivals as an alternative proxy for tourism activity. Although these two indicators are highly correlated, they capture slightly different aspects of tourism’s economic impact, namely, monetary inflow versus volume of visits. The re-estimated models using tourist arrivals yielded results consistent with the original findings: a positive and statistically significant effect of tourism on economic growth, both directly and indirectly, through the mediating channels of financial development and exchange rate. This reinforces the robustness of the tourism–growth linkage and affirms the reliability of the original variable choice.
7.2. Use of per Capita Measures
In an additional robustness exercise, we normalized both GDP and tourism receipts by population to examine whether the results hold up when considering economic and tourism activity on a per capita basis. This adjustment helps to account for differences in population size across countries, which can otherwise skew aggregated metrics. The mediation and moderation results remained largely unchanged when per capita data were used. Tourism continued to show a statistically significant effect on growth, with partial mediation through both financial development and exchange rate. These outcomes support the conclusion that the observed relationships are not driven by scale effects or population biases.
7.3. Alternative Estimation Techniques
To further validate our findings, we re-estimated the core models using the generalized method of moments (GMM). These estimators are particularly effective in addressing potential endogeneity issues in dynamic panel data contexts and provide robustness to serial correlation and measurement error. The GMM-based results reaffirmed the main conclusions drawn from the 2SLS and PMG estimators. Tourism retained a positive and significant impact on economic growth, while both exchange rate and financial development continued to exhibit significant mediating and moderating effects. The direction, magnitude, and significance of the coefficients were largely in line with those obtained through previous estimation methods.
7.4. Inclusion of Additional Controls
Finally, we expanded the set of control variables by including trade openness, which is sometimes used in growth regressions. The inclusion of these controls had minimal impact on the primary relationships under investigation. Tourism remained a significant driver of growth, with exchange rate and financial development maintaining their roles as key mediators and moderators.
7.5. Summary of Robustness Tests
Across all robustness checks, whether through alternative proxies, per capita adjustments, estimation techniques, or added control variables, the results consistently point to a stable relationship between tourism, financial development, exchange rate, and economic growth. These robustness exercises enhance the credibility of our empirical results and underscore the broader applicability of our findings across different model specifications.
8. Conclusions
This study set out to investigate the role of financial development and exchange rate dynamics in shaping the relationship between tourism and economic growth in Africa. By integrating both mediating and moderating variables into a comprehensive empirical framework, the research offers new insights into how tourism contributes to economic performance under varying macro-financial conditions.
Using a panel of 31 African countries over the period 2000–2020, the analysis employed both static (2SLS) and dynamic (panel ARDL) estimation techniques to explore causal linkages. The findings confirm that tourism has a significant and positive effect on economic growth. More importantly, the results show that this effect is not uniform, but is strongly conditioned by a country’s exchange rate environment and the maturity of its financial sector.
Exchange rates influence tourism primarily through their impact on travel affordability and international competitiveness, while financial development enhances tourism’s impact by supporting transactions, credit access, and investment. The mediation and moderation analyses show that both variables strengthen the tourism–growth linkage when functioning effectively.
By highlighting the conditional nature of tourism’s economic impact, this study contributes to the literature in three important ways. First, it expands the tourism–growth framework by empirically testing the roles of exchange rate and financial development as transmission mechanisms. Second, it offers a continental perspective, drawing from a diverse sample of African economies rather than focusing on a single country or sub-region. Third, it underscores the importance of aligning tourism strategies with broader macroeconomic and financial reforms.
While this study provides robust evidence of the tourism–growth nexus under specific financial and macroeconomic conditions, there remain opportunities for further exploration. Future research could extend this analysis in at least three specific ways. First, by disaggregating tourism into sub-sectors (e.g., eco-tourism, education tourism, medical tourism) to assess sector-specific impacts; second, by exploring non-linear effects or threshold levels of financial development; and third, by investigating institutional quality as a potential third mediator in the tourism–growth relationship.
9. Discussion and Policy Implications
The empirical evidence presented in this study highlights the nuanced and interconnected relationship between tourism development, financial system maturity, exchange rate dynamics, and economic growth in African economies. Our findings demonstrate that tourism can be a powerful engine of growth, but its effectiveness depends significantly on the broader macro environment.
9.1. The Conditional Impact of Tourism on Growth
The results confirm that tourism has a direct and statistically significant effect on economic performance, consistent with the tourism-led growth hypothesis. However, this relationship is not uniform across countries. The mediating and moderating effects identified in the analysis suggest that tourism’s contribution to growth depends heavily on the stability of exchange rates and the development of financial infrastructure. In particular, the presence of a well-functioning financial system enhances the ability of the economy to absorb and allocate tourism-related revenues efficiently. Likewise, a competitive or favorable exchange rate increases the attractiveness of a country to international tourists, particularly those seeking cost-effective destinations.
9.2. Implications for Financial Sector Reform
Given the significant mediating role of financial development, policymakers should prioritize strengthening domestic financial systems. This includes expanding access to credit, encouraging financial inclusion, improving regulatory frameworks, and promoting investment in financial technologies that support tourism-related businesses. Developing a sound and inclusive financial sector can have a multiplier effect not only enhancing tourism’s direct impact but also stimulating entrepreneurship, job creation, and infrastructure development in tourism-related sectors.
9.3. Exchange Rate Management for Tourism Competitiveness
The findings also emphasize the importance of exchange rate stability in shaping tourism flows and associated economic benefits. Countries with undervalued or stable currencies are more likely to attract inbound tourism, which in turn can boost local businesses, increase foreign exchange earnings, and support broader economic activity. However, policymakers must balance tourism competitiveness with macroeconomic stability. Exchange rate management strategies should consider inflationary pressures, trade balances, and monetary policy goals while seeking to maintain an environment favorable to international tourism.
9.4. Strategic Positioning of Tourism in National Development Agendas
This study’s results support the argument that tourism should not be viewed in isolation from other structural and macroeconomic factors. Rather, it should be integrated into broader national development strategies, particularly those focused on sustainable growth, employment generation, and trade. Countries with strong governance structures, effective institutions, and strategic investment in infrastructure are more likely to realize the long-term benefits of tourism. Moreover, cross-sectoral policies, which link tourism with finance, trade, education, and technology, can enhance spillover effects and ensure more inclusive growth.
9.5. Relevance for the African Context
Given the diversity of African economies and the continent’s growing appeal as a tourism destination, these findings are especially relevant. The continent’s abundant cultural and ecological assets offer strong potential for tourism-driven development, but realizing this potential requires addressing constraints related to capital markets, foreign exchange volatility, and weak institutional frameworks. This research offers valuable insights for regional economic communities and development agencies focused on promoting intra-African tourism, facilitating cross-border investment, and harmonizing financial sector policies.
In summary, this study demonstrates that tourism, while important in its own right, achieves greater developmental impact when supported by sound financial systems and stable macroeconomic conditions. Policies aimed at enhancing financial access, exchange rate stability, and institutional capacity can materially amplify the positive economic effects of tourism across Africa.
While not directly addressed in our empirical model, ancillary but important issues that impede tourism growth in Africa include inadequate air infrastructure, restrictive visa policies, and insufficient global marketing. To tackle these challenges, governments should invest in modernizing airports and, importantly, in training airport and airline staff to provide a welcoming and tourist-friendly experience, as they represent the primary point of contact for inbound tourists. That initial interaction can significantly shape both the first and lasting impressions of a tourist upon arrival. Simplifying visa procedures, such as offering visa-free entry for visitors from high-income countries, visa-on-arrival, and e-visas, could significantly boost inbound tourism. Additionally, national tourism boards should implement digital marketing strategies, including partnerships with travel influencers and targeted social media campaigns. By taking these measures, African nations could enhance their competitiveness as global tourism destinations.
Author Contributions
Conceptualization, P.O.; methodology, P.O.; software, P.O.; validation, P.O., K.A.-A. and E.S.-K.; formal analysis, P.O.; investigation, P.O., K.A.-A. and E.S.-K.; resources, P.O. and K.A.-A.; data curation, P.O.; writing—original draft preparation, P.O., K.A.-A. and E.S.-K.; writing—review and editing, P.O. and K.A.-A. All authors have read and agreed to the published version of the manuscript.
Funding
This research received no external funding.
Institutional Review Board Statement
Not applicable.
Informed Consent Statement
Not applicable.
Data Availability Statement
The original contributions presented in this study are included in the article material. Further inquiries can be directed to the corresponding author.
Conflicts of Interest
The authors declare no conflict of interest.
Appendix A. GDP and Tourism Receipts, Ranked by Tourism Receipts per Capita
| Country | Real GDP per Capita (2023) | Tourism Receipts per Capita (2019) | Tourism Rank |
| Seychelles | $17,879.24 | $6330.35 | 1 |
| Mauritius | $11,416.86 | $1598.76 | 2 |
| Cape Verde | $4321.58 | $982.62 | 3 |
| São Tomé and Príncipe | $2601.79 | $321.37 | 4 |
| Botswana | $7249.80 | $284.99 | 5 |
| Morocco | $3441.99 | $274.04 | 6 |
| Tunisia | $3747.42 | $222.67 | 7 |
| Namibia | $4742.78 | $184.33 | 8 |
| South Africa | $6253.16 | $170.72 | 9 |
| Egypt | $4295.41 | $134.98 | 10 |
| Ghana | $2238.16 | $47.27 | 11 |
| Tanzania | $1211.06 | $43.83 | 12 |
| Kenya | $1949.90 | $34.58 | 13 |
| Madagascar | $528.65 | $34.54 | 14 |
| Uganda | $1014.21 | $32.60 | 15 |
| Togo | $1012.97 | $32.03 | 16 |
| Ethiopia | $1293.78 | $30.92 | 17 |
| Senegal | $1745.97 | $30.54 | 18 |
| Cameroon | $1673.65 | $26.41 | 19 |
| Sudan | $2272.49 | $23.76 | 20 |
| Libya | $6716.10 | $23.52 | 21 |
| Ivory Coast | $2728.80 | $21.05 | 22 |
| Gabon | $8420.10 | $17.94 | 23 |
| Eswatini | $3797.30 | $12.23 | 24 |
| Angola | $2309.52 | $12.21 | 25 |
| Mali | $897.45 | $10.36 | 26 |
| Burkina Faso | $874.12 | $8.26 | 27 |
| Nigeria | $1621.12 | $7.24 | 28 |
| Niger | $618.29 | $5.55 | 29 |
| Malawi | $672.87 | $3.29 | 30 |
| Benin | $1434.66 | $2.98 | 31 |
| Data source: World Development Indicators (World Bank). | |||
References
- Abbas, Z., Afshan, G., & Mustifa, G. (2022). The effect of financial development on economic growth and income distribution: An empirical evidence from lower-middle and upper-middle-income countries. Development Studies Research, 9(1), 117–128. [Google Scholar] [CrossRef]
- Aboagye, S., & Kwakwa, P. A. (2023). The role of international tourism, trade openness and renewable energy in the financial development of selected African countries. Research in Globalization, 7, 100170. [Google Scholar] [CrossRef]
- Adeleye, N., Ogede, J., Rabbani, M., Adam, L., & Mazhar, M. (2022). Moderation analysis of exchange rate, tourism and economic growth in Asia. PLoS ONE, 17(12), e0279937. [Google Scholar] [CrossRef] [PubMed] [PubMed Central]
- Aduba, J., Asgari, B., & Izawa, H. (2023). Does FinTech penetration drive financial development? Evidence from panel analysis of emerging and developing economies. Borsa Istanbul Review, 23(5), 1078–1097. [Google Scholar]
- Adusei, M. (2013). Finance-growth nexus in Africa: A panel generalized method of moments (GMM) analysis. Asian Economic and Financial Review, 3(10), 1314–1324. [Google Scholar]
- Akadiri, S. S., & Akadiri, A. C. (2021). Examining the causal relationship between tourism, exchange rate, and economic growth in tourism island states: Evidence from second-generation panel. International Journal of Hospitality and Tourism Administration, 22(3), 235–250. [Google Scholar]
- Akan, Y., Arslan, İ., & Isik, C. (2007). The impact of tourism on economic growth: The case of Turkey. Journal of tourism, 9(1), 1–24. [Google Scholar]
- Albaladejo, I. P., Brida, J. G., González-Martínez, M. I., & Segarra, V. (2023). A new look to the tourism and economic growth nexus: A clustering and panel causality analysis. World Economy, 46(9), 2835–2856. [Google Scholar] [CrossRef]
- Alcalá-Ordóñez, A., Brida, J. G., & Cárdenas-García, P. J. (2023). Has the tourism-led growth hypothesis been confirmed? Evidence from an updated literature review. Current Issues in Tourism, 27(22), 3571–3607. [Google Scholar] [CrossRef]
- Almeida, A. (2023). Tourism development and economic growth: The validity of the tourism-led growth hypothesis for madeira. Revista Portuguesa de Estudos Regionais, 65, 31–50. [Google Scholar] [CrossRef]
- Al-Mulali, U., Solarin, S. A., & Gholipour, H. F. (2021). Relationship between financial development and inbound tourism: A revisit. Journal of Public Affairs, 21(3), e2233. [Google Scholar] [CrossRef]
- Amoro, G. (2014). The study of causal relationship between foreign direct investment, financial market development and economic growth for eight West African countries: Evidence from panel data analysis. TIJ’s Research Journal of Economics and Business Studies, 3(8), 42–65. [Google Scholar]
- Ang, J. B., & McKibbin, W. J. (2007). Financial liberalization, financial sector development and growth: Evidence from Malaysia. Journal of Development Economics, 84(1), 215–233. [Google Scholar]
- Ankomah, P., & Larson, R. (2000). Education tourism: A strategy to sustainable tourism development in sub-Saharan Africa. Education, environmental science, sociology. Available online: https://api.semanticscholar.org/CorpusID:155251854 (accessed on 22 April 2024).
- Apergis, N., Fillippidis, I., & Economidou, C. (2007). Financial deeping and economic growth linkages: A panel data analysis. Review of World Economics, 143(1), 179–198. [Google Scholar]
- Apergis, N., & Payne, J. E. (2012). Research note: Tourism and growth in the Caribbean—Evidence from a panel error correction model. Tourism Economics, 18(2), 449–456. [Google Scholar] [CrossRef]
- Asongu, S., Rahman, M., & Nnanna, J. (2023). Law, political stability, tourism management and economic development in sub-Saharan Africa. Current Issues in Tourism, 26(16), 2678–2691. [Google Scholar] [CrossRef]
- Atindehou, R. B., Gueyie, J. P., & Amenounve, E. K. (2005). Intermediation and economic growth: Evidence from Western Africa. Applied Financial Economics, 15(2005), 777–790. [Google Scholar]
- Azmy, A., Wiadi, I., & Risza, H. (2023). The effect of psychological contract, employer branding and job satisfaction on turnover intention: Organizational commitment as moderating variable at start-up IT company. E+M Ekonomie a Management, 26(2), 87–104. [Google Scholar] [CrossRef]
- Balcilar, M., Van Eyden, R., Inglesi-Lotz, R., & Gupta, R. (2014). Time-varying linkages between tourism receipts and economic growth in South Africa. Applied Economics, 46(36), 4381–4398. [Google Scholar]
- Bangake, C., & Eggoh, J. C. (2011). Further evidence on finance-growth causality: A panel data analysis. Economic Systems, 35(2), 176–188. [Google Scholar] [CrossRef]
- Baron, R. M., & Kenny, D. A. (1986). The moderator-mediator variable distinction in social psychological research: Conceptual, strategic, and statistical considerations. Journal of Personality and Social Psychology, 51, 1173–1182. [Google Scholar] [CrossRef] [PubMed]
- Başarir, Ç., & Çakir, Y. N. (2015). Causal interactions between CO2 emissions, financial development, energy and tourism. Asian Economic and Financial Review, 5(11), 1227–1238. [Google Scholar] [CrossRef]
- Beck, T., Levine, R., & Loayza, N. (2000). Finance and the source of growth. Journal of Financial Economics, 58(1), 261–300. [Google Scholar] [CrossRef]
- Bilen, M., Yilanci, V., & Eryüzlü, H. (2015). Tourism development and economic growth: A panel granger causality analysis in the frequency domain. Current Issues in Tourism, 20(1), 27–32. [Google Scholar] [CrossRef]
- Blanco, L. (2009). The finance-growth link in Latin America. Southern Economic Journal, 76(1), 224–248. [Google Scholar] [CrossRef]
- Brida, J., Cortes-Jimenez, I., & Pulina, M. (2016). Has the tourism-led growth hypothesis been validated? A literature review. Current Issues in Tourism, 19(5), 394–430. [Google Scholar] [CrossRef]
- Cannonier, C., & Burke, M. G. (2017). Tourism and financial development in small states: Evidence from Caribbean countries. Tourism Economics, 23(6), 1369–1377. [Google Scholar] [CrossRef]
- Cárdenas-García, P. J., Brida, J. G., & Segarra, V. (2024). Modelling the link between tourism and economic development: Evidence from homogeneous panels of countries. Humanities and Social Sciences Communications, 11(1), 308. [Google Scholar] [CrossRef]
- Chiu, C. N. (2021). Tourism expansion and economic development: Evidence from the United States and China. Journal of China Tourism Research, 17(1), 120–141. [Google Scholar] [CrossRef]
- Chortareas, G., Magkonis, G., Moschos, D., & Panagiotidis, T. (2015). Financial development and economic activity in advanced and developing open economies: Evidence from panel cointegration. Review of Development Economics, 19(1), 163–177. [Google Scholar] [CrossRef]
- Colacchio, G., & Vergori, A. S. (2023). Tourism development and Italian economic growth: The weight of the regional economies. Journal of Risk and Financial Management, 16(4), 245. [Google Scholar] [CrossRef]
- Čihák, M., Demirgüç-Kunt, A., Feyen, E., & Levine, R. (2012). Benchmarking financial systems around the world (World Bank Policy Research Working Paper (6175)). Elsevier. [Google Scholar]
- Ding, D., & Timmer, Y. (2023). Exchange rate elasticities of international tourism and the role of dominant currency pricing (International Finance Discussion Papers 1378). Board of Governors of the Federal Reserve System. [Google Scholar] [CrossRef]
- Dritsakis, N. (2004). Tourism as a long-run economic growth factor: An empirical investigation for Greece using causality analysis. Tourism Economics, 10, 305–316. [Google Scholar] [CrossRef]
- Durbarry, R. (2004). Tourism and economic growth: The case of Mauritius. Tourism Economics, 10, 389–401. [Google Scholar] [CrossRef]
- Ehigiamusoe, K. U. (2021). The nexus between tourism, financial development, and economic growth: Evidence from African countries. African Development Review, 33(2), 382–396. [Google Scholar] [CrossRef]
- Ehigiamusoe, K. U., & Lean, H. H. (2018). Finance–growth nexus: New insights from the West African region. Emerging Markets Finance and Trade, 54(11), 2596–2613. [Google Scholar] [CrossRef]
- Garcia, P. J. C. (2012). Tourism growth versus economic development: An analysis since the perspective of the foreign exchange generation and tax collection capacity. Revista de Economia Mundial, 32, 73–102. [Google Scholar]
- Ghirmay, T. (2004). Financial development and economic growth in sub-Saharan African countries: Evidence from time series analysis. African Development Review, 16(3), 415–432. [Google Scholar] [CrossRef]
- Gounder, A., & Cox, C. (2021). Exploring the role of tourism dependency on COVID-19 induced economic shock in the Small Island Developing States. Current Issues in Tourism, 25(7), 1151–1168. [Google Scholar] [CrossRef]
- Grassa, R., & Gazdar, K. (2014). Financial development and economic growth in GCC countries: A comparative study between Islamic and conventional finance. International Journal of Social Economics, 41(6), 493–514. [Google Scholar] [CrossRef]
- Gries, T., Kraft, M., & Meierrieks, D. (2009). Linkages between financial deepening, trade openness, and economic development: Causality evidence from sub-Saharan Africa. World Development, 37(12), 1849–1860. [Google Scholar] [CrossRef]
- Haini, H., Wei Loon, P., Yong, S. K., & Husseini, S. (2024). Does social globalization affect the relationship between international tourism and economic growth? Journal of Travel Research, 63(1), 252–269. [Google Scholar]
- Harvey, H., Furuoka, F., & Munir, Q. (2013). The role of tourism and exchange rate on economic growth Evidence from the BIMP-EAGA countries. Economics Bulletin, 33(4), 27562762. [Google Scholar]
- Hayes, A. F. (2017). Introduction to mediation, moderation, and conditional process analysis, second edition: A regression-based approach. Guilford Publications. [Google Scholar]
- IRTS. (2008). Available online: https://unstats.un.org/unsd/publication/seriesm/seriesm_83rev1e.pdf (accessed on 1 November 2024).
- Ivanov, S., & Webster, C. (2007). Measuring the impact of tourism on economic growth. Tourism Economics, 13(3), 379–388. [Google Scholar]
- Katircioglu, S. (2009). Testing the tourism-led growth hypothesis: The case of Malta. Acta Oeconomica, 59, 331–343. Available online: https://www.jstor.org/stable/40729910 (accessed on 3 April 2025).
- Katircioglu, S., Katircioğlu, S., & Altinay, M. (2018). Interactions between tourism and financial sector development: Evidence from Turkey. Service Industries Journal, 38(9–10), 519–542. [Google Scholar]
- Khan, M. T. I., Yaseen, M. R., & Ali, Q. (2019). Nexus between financial development, tourism, renewable energy, and greenhouse gas emission in high-income countries: A continent-wise analysis. Energy Economics, 83, 293–310. [Google Scholar] [CrossRef]
- Khanna, R., & Sharma, C. (2023). Does financial development raise tourism demand? A cross-country panel evidence. Journal of Hospitality and Tourism Research, 47(6), 1040–1070. [Google Scholar] [CrossRef]
- Koçak, E., Dogru, T., Shehzad, K., & Bulut, U. (2022). The economic implications of the COVID-19 outbreak on tourism industry: Empirical evidence from Turkey. Tourism Economics, 29(3), 742–758. [Google Scholar] [CrossRef]
- Kouki, I., & Harrathi, N. (2013). Financial development and economic growth in the North African region. African Development Review, 25(4), 551–562. [Google Scholar]
- Kumar Narayan, P., Narayan, S., Prasad, A., & Chand Prasad, B. (2010). Tourism and economic growth: A panel data analysis for Pacific Island countries. Tourism Economics, 16, 169–183. [Google Scholar]
- Le, P. N. M., Nguyen, H. T. T., & Tran, T. D. T. (2022). The triangular causal relationship between economic growth, tourism, and foreign direct investment: A case study in central Vietnam. Asian Economic and Financial Review, 12(7), 565–581. [Google Scholar]
- Lee, C. C., Chen, M. P., Wu, W., & Xing, W. (2021). The impacts of ICTs on tourism development: International evidence based on a panel quantile approach. Information Technology & Tourism, 23, 509–547. [Google Scholar] [CrossRef]
- Levine, R., Loayza, N., & Beck, T. (2000). Financial intermediation and growth: Causality and cause. Journal of Monetary Economics, 46(1), 31–77. [Google Scholar]
- Li, J., & Qamruzzaman, M. (2022). Does tourism induce sustainable human capital development in BRICS through the channel of capital formation and financial development? Evidence from augmented ARDL with structural break and fourier-TY causality. Frontiers in Psychology, 13, 804349. [Google Scholar]
- Matthew, O. A., Ede, C., Osabohien, R., Ejemeyovwi, J., Ayanda, T., & Okunbor, J. (2021). Interaction effect of tourism and foreign exchange earnings on economic growth in Nigeria. Global Business Review, 22(1), 7–22. [Google Scholar] [CrossRef]
- Menegaki, A. N., & Tiwari, A. K. (2022). The stability of interaction channels between tourism and financial development in 10 top tourism destinations: Evidence from a Fourier Toda-Yamamoto estimator. Tourism Economics, 28(7), 1914–1942. [Google Scholar] [CrossRef]
- Menyari, E. Y. (2019). Financial development, foreign banks and economic growth in Africa. African Development Review, 46(1), 190–201. [Google Scholar]
- Musakwa, M. T., & Odhiambo, N. M. (2022). Tourism and financial development in South Africa: A trivariate approach. Journal of Policy Research in Tourism, Leisure and Events, 14(2), 148–164. [Google Scholar]
- Musakwa, M. T., Odhiambo, N. M., & Nyasha, S. (2022). Does tourism influence financial development in Kenya? Acta Economica, 20(36), 155–173. [Google Scholar]
- Naseem, S. (2021). The role of tourism in economic growth: Empirical evidence from Saudi Arabia. Economies, 9(3), 117. [Google Scholar] [CrossRef]
- Nene, G., & Taivan, A. (2017). Causality between tourism and economic growth: Evidence from sub-Saharan Africa (SSA). The Journal of Developing Areas, 51(2), 155–169. [Google Scholar] [CrossRef]
- Nunkoo, R., Seetanah, B., Jaffur, Z. R. K., Moraghen, P. G. W., & Sannassee, R. V. (2020). Tourism and economic growth: A meta-regression analysis. Journal of Travel Research, 59(3), 404–423, (Original work published 2019). [Google Scholar] [CrossRef]
- Nyasha, S., Odhiambo, N. M., & Asongu, S. A. (2021). The impact of tourism development on economic growth in sub-Saharan Africa. The European Journal of Development Research, 33, 1514–1535. [Google Scholar] [CrossRef]
- Obi, P., Martin, R., & Obi, G. (2016). Tourism: The untapped goldmine in the gold coast. Tourism and Hospitality Management, 22(1), 17–28. [Google Scholar] [CrossRef]
- Odhiambo, N. M., & Nyasha, S. (2020). Is tourism a spur to economic growth in South Africa? An empirical investigation. Development Studies Research, 7(1), 167–177. [Google Scholar] [CrossRef]
- Oh, C. (2005). The contribution of tourism development to economic growth in the Korean economy. Tourism Management, 26(1), 39–44. [Google Scholar]
- Panagiotidis, T., Mussoni, M., & Voucharas, G. (2023). How important is tourism for growth? International Journal of Finance and Economics, 29(4), 4704–4720. [Google Scholar] [CrossRef]
- Payne, J. E., & Mervar, A. (2010). Research note: The tourism-growth nexus in Croatia. Tourism Economics, 16(4), 1089–1094. [Google Scholar] [CrossRef]
- Pesaran, M. H., Shin, Y., & Smith, R. P. (1999). Pooled mean group estimation of dynamic heterogeneous panels. Journal of the American Statistical Association, 94(446), 621–634. [Google Scholar] [CrossRef]
- Primayesa, E., Widodo, W., Sugiyanto, F. X., & Firmansyah, F. X. (2017). The dynamic relationship between economic growth, tourism activity, and real exchange rate in Indonesia. Journal of Environmental Management and Tourism, 8(4), 798–810. [Google Scholar] [CrossRef]
- Pulido-Fernández, J. I., & Cárdenas-García, P. J. (2021). Analyzing the bidirectional relationship between tourism growth and economic development. Journal of Travel Research, 60(3), 583–602. [Google Scholar] [CrossRef]
- Ramsey, F. P. (1928). A mathematical theory of saving. The Economic Journal, 38(152), 543–559. [Google Scholar] [CrossRef]
- Rasool, H., Maqbool, S., & Tarique, M. (2021). The relationship between tourism and economic growth among BRICS countries: A panel cointegration analysis. Future Business Journal, 7(1), 1. [Google Scholar]
- Ridderstaat, J., Croes, R., & Nijkamp, P. (2014). Tourism and long-run economic growth in Aruba. International Journal of Tourism Research, 16(5), 472–487. [Google Scholar] [CrossRef]
- Rivera, M. A. (2017). The synergies between human development, economic growth, and tourism within a developing country: An empirical model for Ecuador. Journal of Destination Marketing and Management, 6(3), 221–232. [Google Scholar] [CrossRef]
- Roodman, D. (2009). How to do xtabond2: An introduction to difference and system GMM in Stata. Stata Journal, 9(1), 86–136. [Google Scholar] [CrossRef]
- Schumpeter, J. A. (1911). The theory of economic development. Harvard University Press. [Google Scholar]
- Shahbaz, M., Benkraiem, R., Miloudi, A., & Tiwari, A. K. (2019). Tourism-induced financial development in Malaysia: New evidence from the tourism development index. Tourism Economics, 25(5), 757–778. [Google Scholar] [CrossRef]
- Shaver, J. M. (2005). Testing for mediating variables in management research: Concerns, implications, and alternative strategies. Journal of Management, 31(3), 330–353. [Google Scholar] [CrossRef]
- Singh, D., & Alam, Q. (2024). Is tourism expansion the key to economic growth in India? An aggregate-level time series analysis. Annals of Tourism Research Empirical Insights, 5(2), 100126. [Google Scholar] [CrossRef]
- Solow, R. M. (1956). A contribution to the theory of economic growth. The Quarterly Journal of Economics, 70(1), 65–94. [Google Scholar] [CrossRef]
- Songling, Y., Ishtiaq, M., & Thanh, B. T. (2019). Tourism industry and economic growth nexus in Beijing, China. Economies, 7(1), 25. [Google Scholar] [CrossRef]
- Statista. (2024). Unemployment rate in Africa in 2024, by gender. Statista Research Department. Available online: https://www.statista.com/statistics/1319852/unemployment-rate-in-africa-by-gender/ (accessed on 3 April 2025).
- Svirydzenka, K. (2016). Introducing a new broad-based index of financial development. International Monetary Fund. [Google Scholar]
- Tang, C. H., & Jang, S. C. (2009). The tourism-economy causality in the United States: A sub-industry level examination. Tourism Management, 30(4), 553–558. [Google Scholar] [CrossRef]
- Truong, Y., & Berrone, P. (2022). Can environmental innovation be a conventional source of higher market valuation? Journal of Business Research, 142, 113–121. [Google Scholar] [CrossRef]
- Voumik, L., Nafi, S., Majumder, S., & Islam, M. (2023). The impact of tourism on women employment in South American and Caribbean countries. International Journal of Contemporary Hospitality Management, 35(9), 3095–3112. [Google Scholar] [CrossRef]
- Wijesekara, C., Tittagalla, C., Jayathilaka, A., Ilukpotha, U., Jayathilaka, R., & Jayasinghe, P. (2022). Tourism and economic growth: A global study on Granger causality and wavelet coherence. PLoS ONE, 17(9), e0274386. [Google Scholar] [CrossRef] [PubMed] [PubMed Central]
- World Travel & Tourism Council. (2019). Travel & tourism: Global economic impact & trends 2019. Available online: https://wttc.org/research/economic-impact (accessed on 1 November 2024).
- World Travel & Tourism Council. (2023). Travel & tourism economic impact 2023. Available online: https://assets-global.website-files.com/6329bc97af73223b575983ac/647df24b7c4bf560880560f9_EIR2023-APEC.pdf (accessed on 1 November 2024).
- Wu, Y., Jin, B., & Rao, C. R. (2020). Estimation and model selection in general spatial dynamic panel data models. Proceedings of the National Academy of Sciences, 117(10), 5235–5241. [Google Scholar]
- Yazdi, S., Salehi, K., & Soheilzad, M. (2017). The relationship between tourism, foreign direct investment and economic growth: Evidence from Iran. Current Issues in Tourism, 20(1), 15–26. [Google Scholar]
- Zhang, C., Arif, M., Shehzad, K., Ahmad, M., & Oláh, J. (2021). Modeling the dynamic linkage between tourism development, technological innovation, urbanization and environmental quality: Provincial data analysis of China. International Journal of Environmental Research and Public Health, 18, 8456. [Google Scholar] [CrossRef]
Disclaimer/Publisher’s Note: The statements, opinions and data contained in all publications are solely those of the individual author(s) and contributor(s) and not of MDPI and/or the editor(s). MDPI and/or the editor(s) disclaim responsibility for any injury to people or property resulting from any ideas, methods, instructions or products referred to in the content. |
© 2025 by the authors. Licensee MDPI, Basel, Switzerland. This article is an open access article distributed under the terms and conditions of the Creative Commons Attribution (CC BY) license (https://creativecommons.org/licenses/by/4.0/).