1. Introduction
Language is a complex system that reflects patterns of social change and adaptation, emerging through interactions between speakers. The convergence of different speech communities as a result of migration and gentrification has created a constant and dynamic flow of languages. According to
Blommaert and Rampton (
2015), “Migration makes communicative resources such as language varieties and scripts globally mobile, and this affects neighborhoods in very different corners of the world” (23). At the same time, neighborhoods and cities are complex systems (
Bettencourt 2021;
Portugali 2021) that are open to feedback from external sources, becoming more complex due to a fluctuating and divergent combination of nationalities, ethnicities, and languages, a diversification of diversity, which
Vertovec (
2022) described as
superdiversity. This study, thus, explores three neighborhoods of Philadelphia (United States) to measure how languages are displayed and coexisting in the public spaces of areas in which different Hispanic immigrant communities have settled.
A way to explore the use of language(s) within communities is through a linguistic landscape (LL) analysis, which focuses on how written signs in public spaces construct the environment. The study of signs is not a recent development in linguistics, but it gained special interest in the early 2000s after the seminal paper published by
Landry and Bourhis (
1997) in which the linguistic landscape (LL) was defined as “the language of public road signs, advertising billboards, street names, place names, commercial shop signs, and public signs on government buildings” (25). This first definition of the LL was the seed for a series of different studies, new methodological approaches, and new implications for the study of language in society (
Gorter 2013). Linguistic landscape studies (LLSs) have become an asset in obtaining a holistic understanding of communities, as they allow researchers to go beyond spoken language and make space a central object of study (
Blommaert 2013).
The LL is a broad and evolving field that encompasses various approaches and domains. While originally defined as the language of public signs and advertising billboards, the LL now covers a wider range of linguistic artifacts, and its studies have expanded beyond simply counting signs to include investigations of people’s interactions with these signs and what they represent to different communities (
Van Mensel et al. 2020;
Kallen 2023). Researchers have also explored the virtual linguistic landscape (VLL), analyzing computer-mediated communication (CMC) in virtual spaces (
Biró 2018;
Hiippala et al. 2019;
Guarín and Oliveiro-Cardoso 2023). When exploring language in society, LLSs are crucial to understanding social identity and bilingual practices, and the way communities are shaped through language use. From a sociolinguistic perspective, LLSs turn common spaces into ethnographic objects worthy of examination.
When analyzing signs, it is important to categorize them into
top-down and
bottom-up signs, since this difference is significant for contemplating power dynamics and language planning.
Top-down signs, also known as
official signs, are those created and placed by the government or other related institutions, while
bottom-up signs (non-official signs) are placed by commercial enterprises, private organizations, or members of a community (
Gorter 2006). This categorization is significant, as it has been demonstrated (
Cenoz and Gorter 2006;
Ben-Rafael et al. 2006) that the different types of signs—official/non-official—carry different meanings and are used in different ways.
LLSs have made significant contributions to variationist perspectives on language and society. Specifically, LL researchers have created accurate and detailed inventories of urban multilingualism in public spaces, which sheds light on how languages encode people’s sociolinguistic identity (
Blommaert 2017;
Blommaert and Maly 2015). When a city is understood as a complex system or a “geography of possibilities instead of a static physical environment” (
Wang and Lamb 2024, p. 7), dialectal pursuits within the LL framework have the potential to help researchers reconceptualize the dialect continuum in terms of autonomy and heteronomy and obtain a broader view of the communities who make the space dynamic.
The “Hispanic or Latino” population in Philadelphia, according to The United States Census data from 2022, was reported to be 15.7%. As documented by the
Historical Society of Pennsylvania (
2014), Philadelphia accommodates various Latino communities dispersed across the city. Following World War II, Puerto Ricans, enticed by diverse employment prospects in Philadelphia and Camden, NJ, relocated to the city. Despite grappling with a range of sociopolitical challenges (i.e., gentrification and demolitions), they eventually established roots in North Philadelphia’s Fairhill neighborhood, forming what is now recognized as
El bloque de oro [the Golden Block] along 5th Street, where the Hispanic population represents 81.5% (
Wherry 2011;
Wilson 2003). Subsequently, during the 1990s—a pivotal era for globalization (
Eriksen and Schober 2016;
Blommaert 2010;
Eriksen 2014)—there was a surge in migration, leading to the settlement of Colombian and Mexican communities in Upper North Philadelphia’s Olney, where the Hispanic or Latino population represents 26.3%, and South Philadelphia along the Italian Market corridor, respectively.
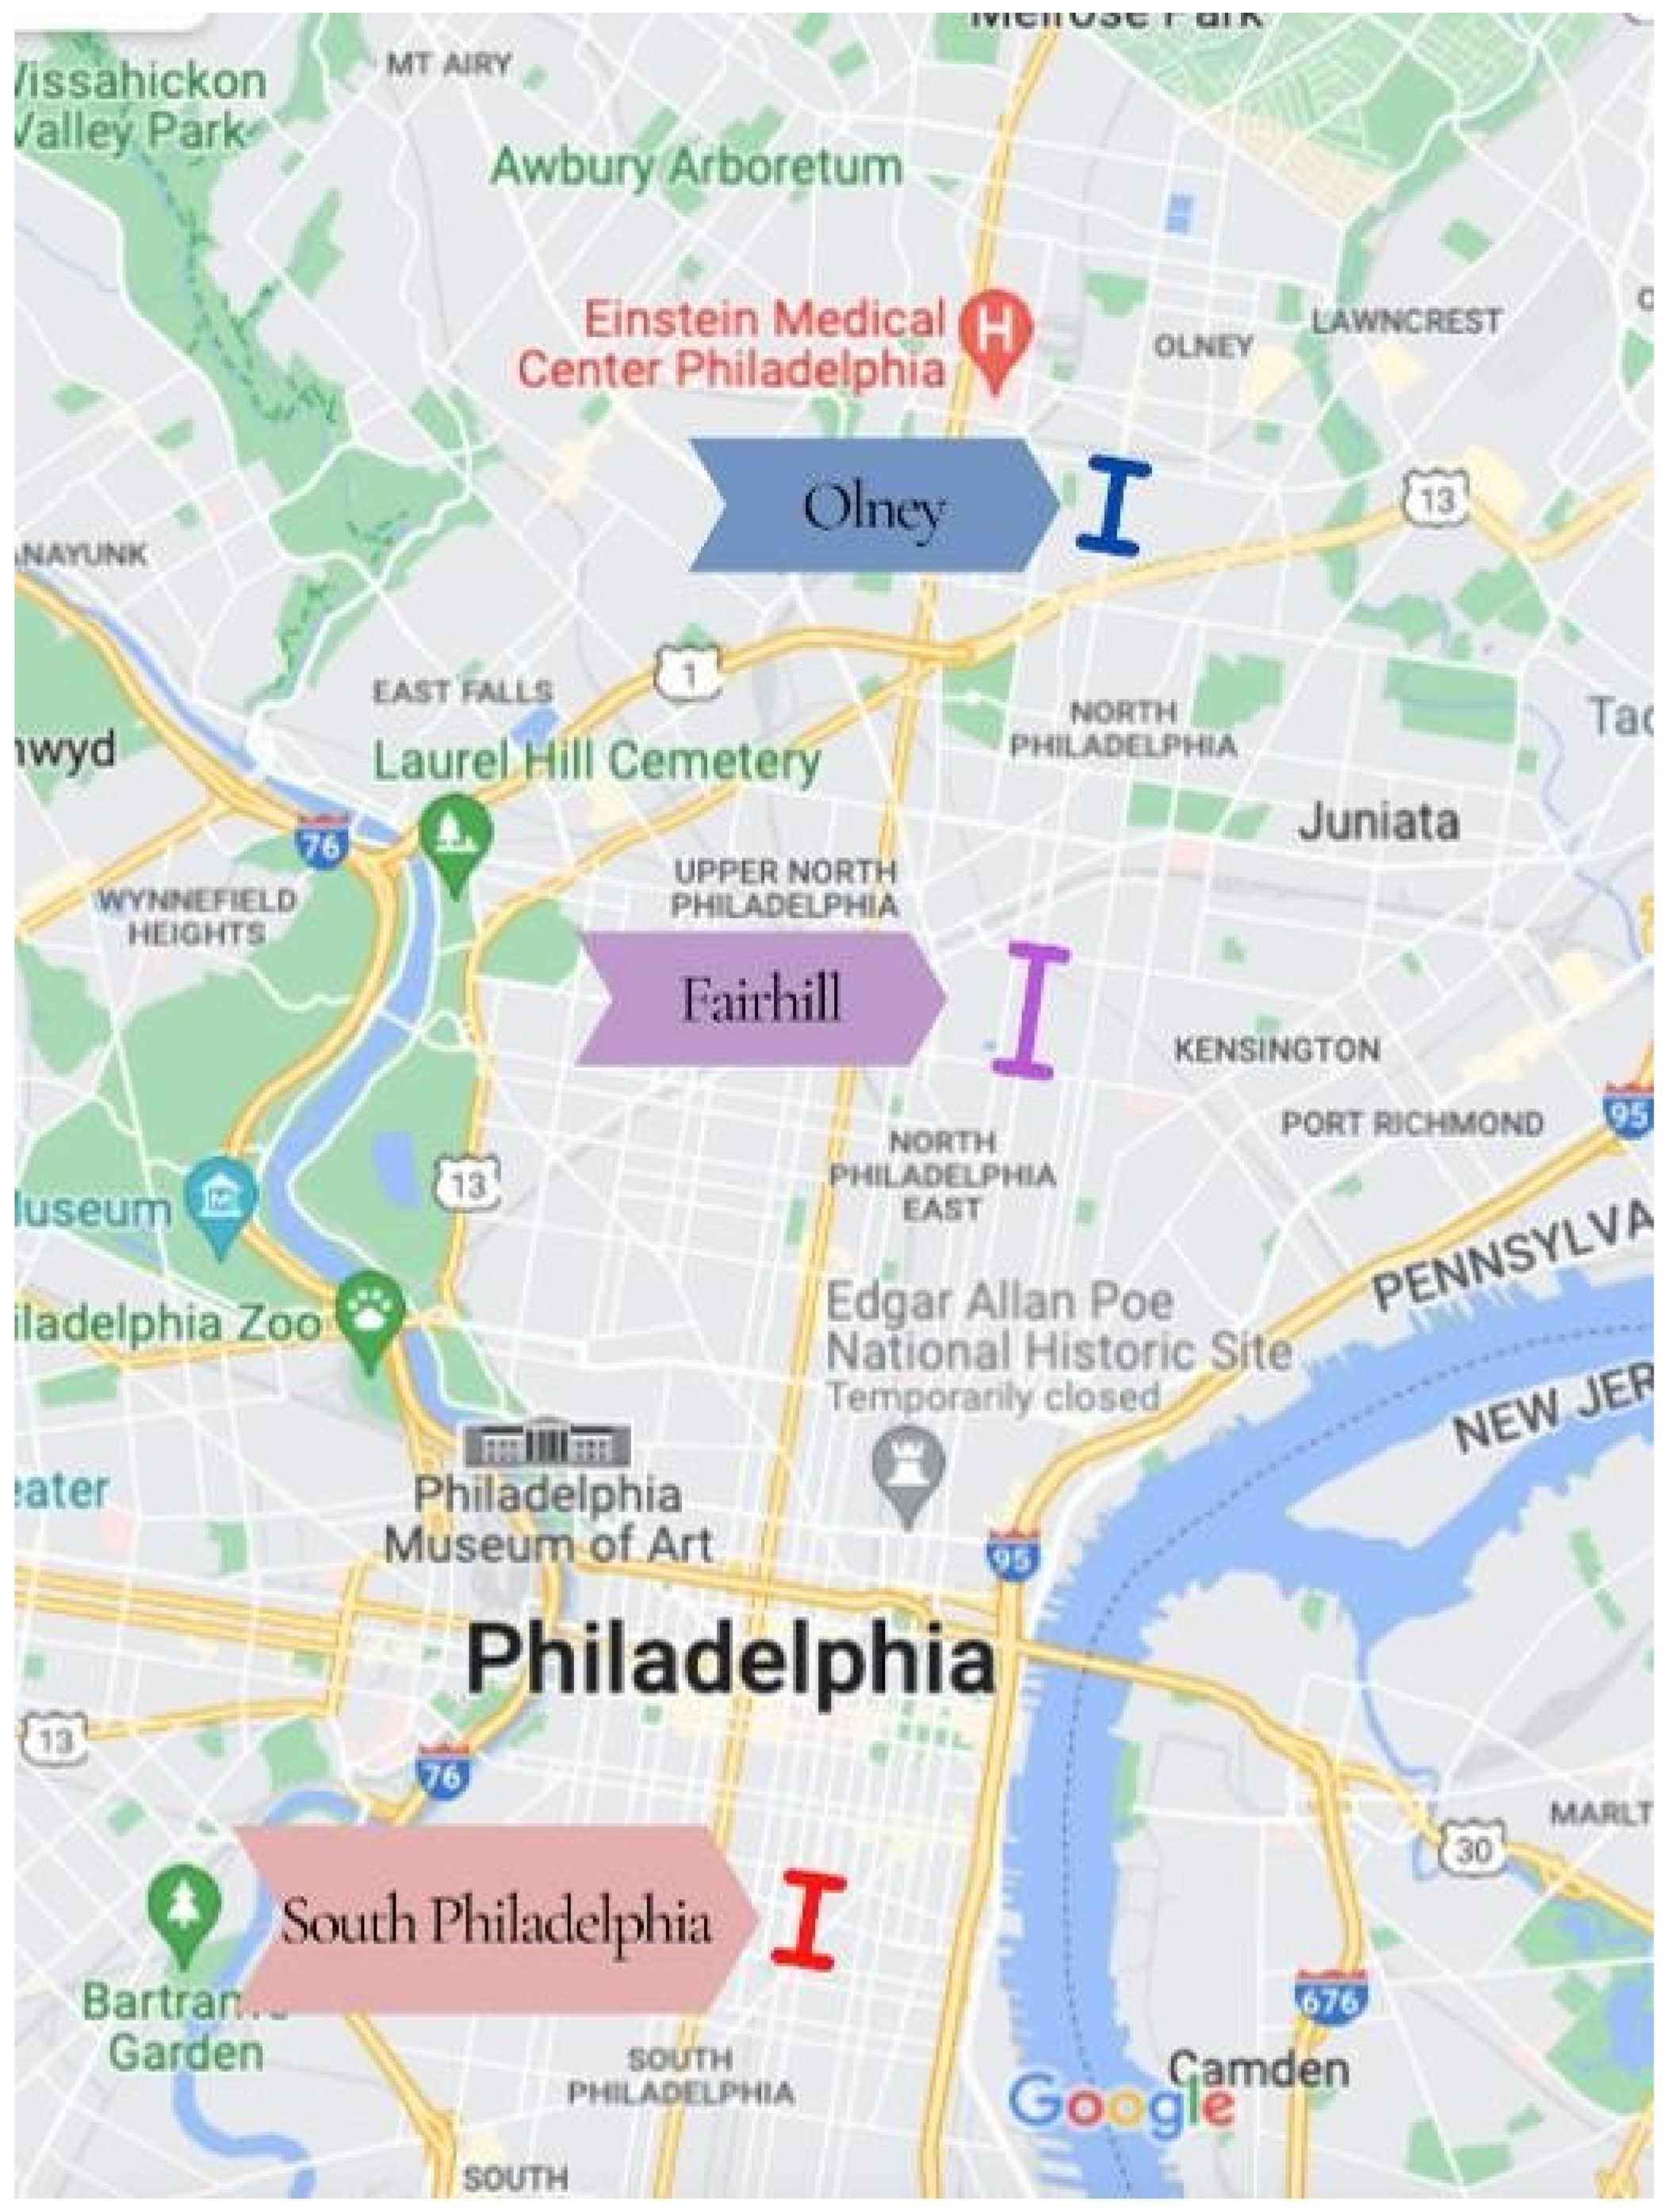
This article presents a linguistic landscape study conducted in Philadelphia, PA, in the three mentioned Hispanic areas (see
Figure 1). The study measures how Spanish is displayed in public spaces and how its presence changes regarding its location (neighborhood) and through time. Since language is the most immediate and direct identifier of social change (
Blommaert and Maly 2015), this research aims to achieve four main objectives: (i) measure the use of Spanish
language in public spaces, (ii) assess the impact of
time on the linguistic landscape of Hispanic Philadelphia, (iii) identify how different locations influence
language usage within this landscape, and (iv) identify which languages are used in different establishments. The results aim to contribute to a deeper understanding of Hispanic communities in the city by documenting the distribution of languages in Hispanic neighborhoods and shedding light on the enduring linguistic vitality of Spanish in the United States.
2. Method
The ethnographic study was conducted between March 2021 and December 2023 and involved meticulous and iterative visits to targeted regions within Philadelphia, PA (those areas which have been labeled as “Hispanic”). The primary objective was to understand the demographic makeup, explore the linguistic diversity, and grasp any geographical nuances for detailed analysis and data collection. Thus, the initial stages of this investigation centered on immersion within various neighborhoods in order to obtain a general idea of the communities residing there, identify prevalent languages, observe social interactions, and discern the cultural landscape. Subsequent visits were then strategically conducted to capture photographic evidence and gather data relevant to the study’s objectives.
The focus of the study was directed towards the Golden Block, a significant section nestled within the Fairhill neighborhood. Specifically, attention was drawn to the stretch along North 5th Street, bounded by West Lehigh Avenue and West Allegheny Avenue. This corridor emerged as a prime locus for examination due to its dynamic array of establishments, including service offices, auto repair shops, and restaurants, offering a rich tapestry of written language for meticulous analysis within the study.
Similarly, in Upper North Philadelphia, exploration began along the Olney neighborhood, followed by an investigation of North 5th Street between W Rockland Street and W Fisher Avenue. This section revealed a robust and vibrant presence of the Latino community, fostering a diverse array of Hispanic-owned businesses, such as beauty salons, bakeries, restaurants, tattoo studios, convenience stores, and churches. While extending further north, the landscape transitioned to accommodate establishments catering predominantly to the Korean diaspora, delineating shifts in cultural and linguistic dynamics within the locality, so it was decided not to extend the study further than Fisher Avenue.
Contrastingly, despite its renowned Italian heritage, the Italian Market in South Philadelphia, specifically 9th Street between Federal Street and Christian Street, was included in the study. This bustling commercial hub provides a unique blend of establishments, comprising predominantly restaurants while also featuring a diverse mix of service offices, stores, technology outlets, beauty salons, and laundromats, contributing distinct linguistic elements to the study’s purview. As has been observed before, this Italian market is going through a semiotic transformation in which the Italian culture is being mixed with the Mexican and Central American cultures (
Niedt 2020;
Vitiello 2014), making this a valuable area for an LLS.
All signs were collected using a mobile phone’s camera and stored on a portable hard drive. The signs were photographed from shops, stores, walls, and poles within the mentioned areas. Adhering to the methodological framework of variationist studies, which consider the exploration of social variables like
age,
gender,
sex, and
economic class to decipher patterns in
language usage (
Silva Corvalán and Enrique-Arias 2017), this study took
language as the dependent variable, while
location,
year and
establishment were regarded as independent variables, essential for a comprehensive understanding of linguistic trends across different periods and diverse geographical settings. In strict adherence to the principle of accountability (
Labov 1972), the data collection process encompassed all languages encountered in
bottom-up signs within the linguistic landscape, recognizing each instance (sign) as a valid token (data point).
The first categorization of
language was into six distinct groups—spanning from singular languages like Spanish and English to various forms of bilingual and multilingual usage—and was employed to facilitate a granular analysis of linguistic phenomena. Concurrently, the classification of
location into three distinct categories—Golden Block, Olney, and South Philadelphia—allowed for a meticulous examination of linguistic variations across these specific geographical settings. The temporal aspect was encapsulated within the year classification, delineating the study into three distinct temporal epochs: 2021, 2022, and 2023. Finally, following previous research on Hispanic LLs in the US (
Hassa and Krajcik 2016;
Pastor 2021), signs were also classified by their type of establishment.
This thorough classification framework was carefully developed to allow for a nuanced and detailed examination of language dynamics within specific areas. Its goal was to document the linguistic distribution and evolution of the LL during a span of 3 years (2021–2023) in the Hispanic neighborhoods and cultural enclaves of Philadelphia.
The dataset compiled for this study encompassed a total of 3437 tokens (
n = 3437), distributed across different years, with 1125 tokens collected in 2021, 1073 in 2022, and 1239 in 2023, as shown in
Table 1. Employing descriptive statistics facilitated a comprehensive understanding of language display patterns across various locations, as well as fluctuations and constancies in language choices throughout the data collection periods.
To streamline the analysis and ensure accuracy (reducing the degree of freedom), modifications were made to the language variable. Specifically, the chi-squared test was executed focusing solely on tokens featuring signs written in Spanish and English, as well as bilingual (English and Spanish) and multilingual signs. Hence, certain signs were omitted from the study. These predominantly consisted of instances of different languages such as Italian, Korean, Vietnamese, and Mandarin, as well as bilingual signs in English and any other language. Since the number of tokens for these omitted signs was minimal, it was decided not to include them in the analysis, as they would not yield statistically significant results. Moreover, the primary focus of the research was to examine the use of Spanish.
The tokens that were discarded included the following: bilingual signs in English and a language other than Spanish, with 3 instances in the Golden Block, 36 in South Philadelphia, and 34 in Olney (n = 73); signs in Italian, with 2 instances in South Philadelphia (n = 2); signs in Korean, with 1 instance in Olney (n = 1); signs in Mandarin, with 2 instances in South Philadelphia (n = 2); and signs in Vietnamese, with 3 instances in South Philadelphia (n = 3).
Within this subset, the total number of tokens accounted for 3356 instances (n = 3356). This tailored approach aimed to enhance the precision of the analysis by isolating and scrutinizing a more specific subset of language representations—namely, those expressed in English, Spanish, or a bilingual or multilingual amalgamation—thus offering a focused lens through which to evaluate language dynamics within the study’s scope.
For the data analysis, since variables were all categorical, contingency tables were created and chi-squared tests were run to measure the impact and statistical significance of location and time in regard to language use. To explore language use across different establishments, due to the high degree of freedom, it was decided to combine variables into clusters using a heatmap instead of running a chi-squared test. This helped us visually represent the data using colors to capture variable values across categories based on their patterns or correlations, that is, which language would be more likely to be found in each establishment.
To run the tests, we first set up our null hypothesis and alternative hypothesis:
Null hypothesis: There is no association between the choice of language and the location, the year, or the type of establishment in which the signs were posted.
Alternative hypothesis: There is an association between the choice of language and location, year, or establishment in which the signs were posted.
We used a significance level of 0.05, which means that if the p-value was less than 0.05, we could reject the null hypothesis and conclude that there was a significant association between the choice of language and the independent variables.
3. Results
The primary objectives of this study were to measure the use of Spanish language in public spaces and to investigate the influence of location, time, and establishment on the linguistic landscape of Hispanic Philadelphia. Data were systematically gathered across the years 2021 to 2023 within three distinct Hispanic neighborhoods: Golden Block, South Philadelphia’s Italian Market, and Olney. The dataset, encompassing a total of 3437 tokens, underwent refinement, focusing exclusively on signs written in Spanish, signs written in English, bilingual (English and Spanish) signs, and multilingual signs. Subsequently, 3356 tokens were subjected to detailed analysis.
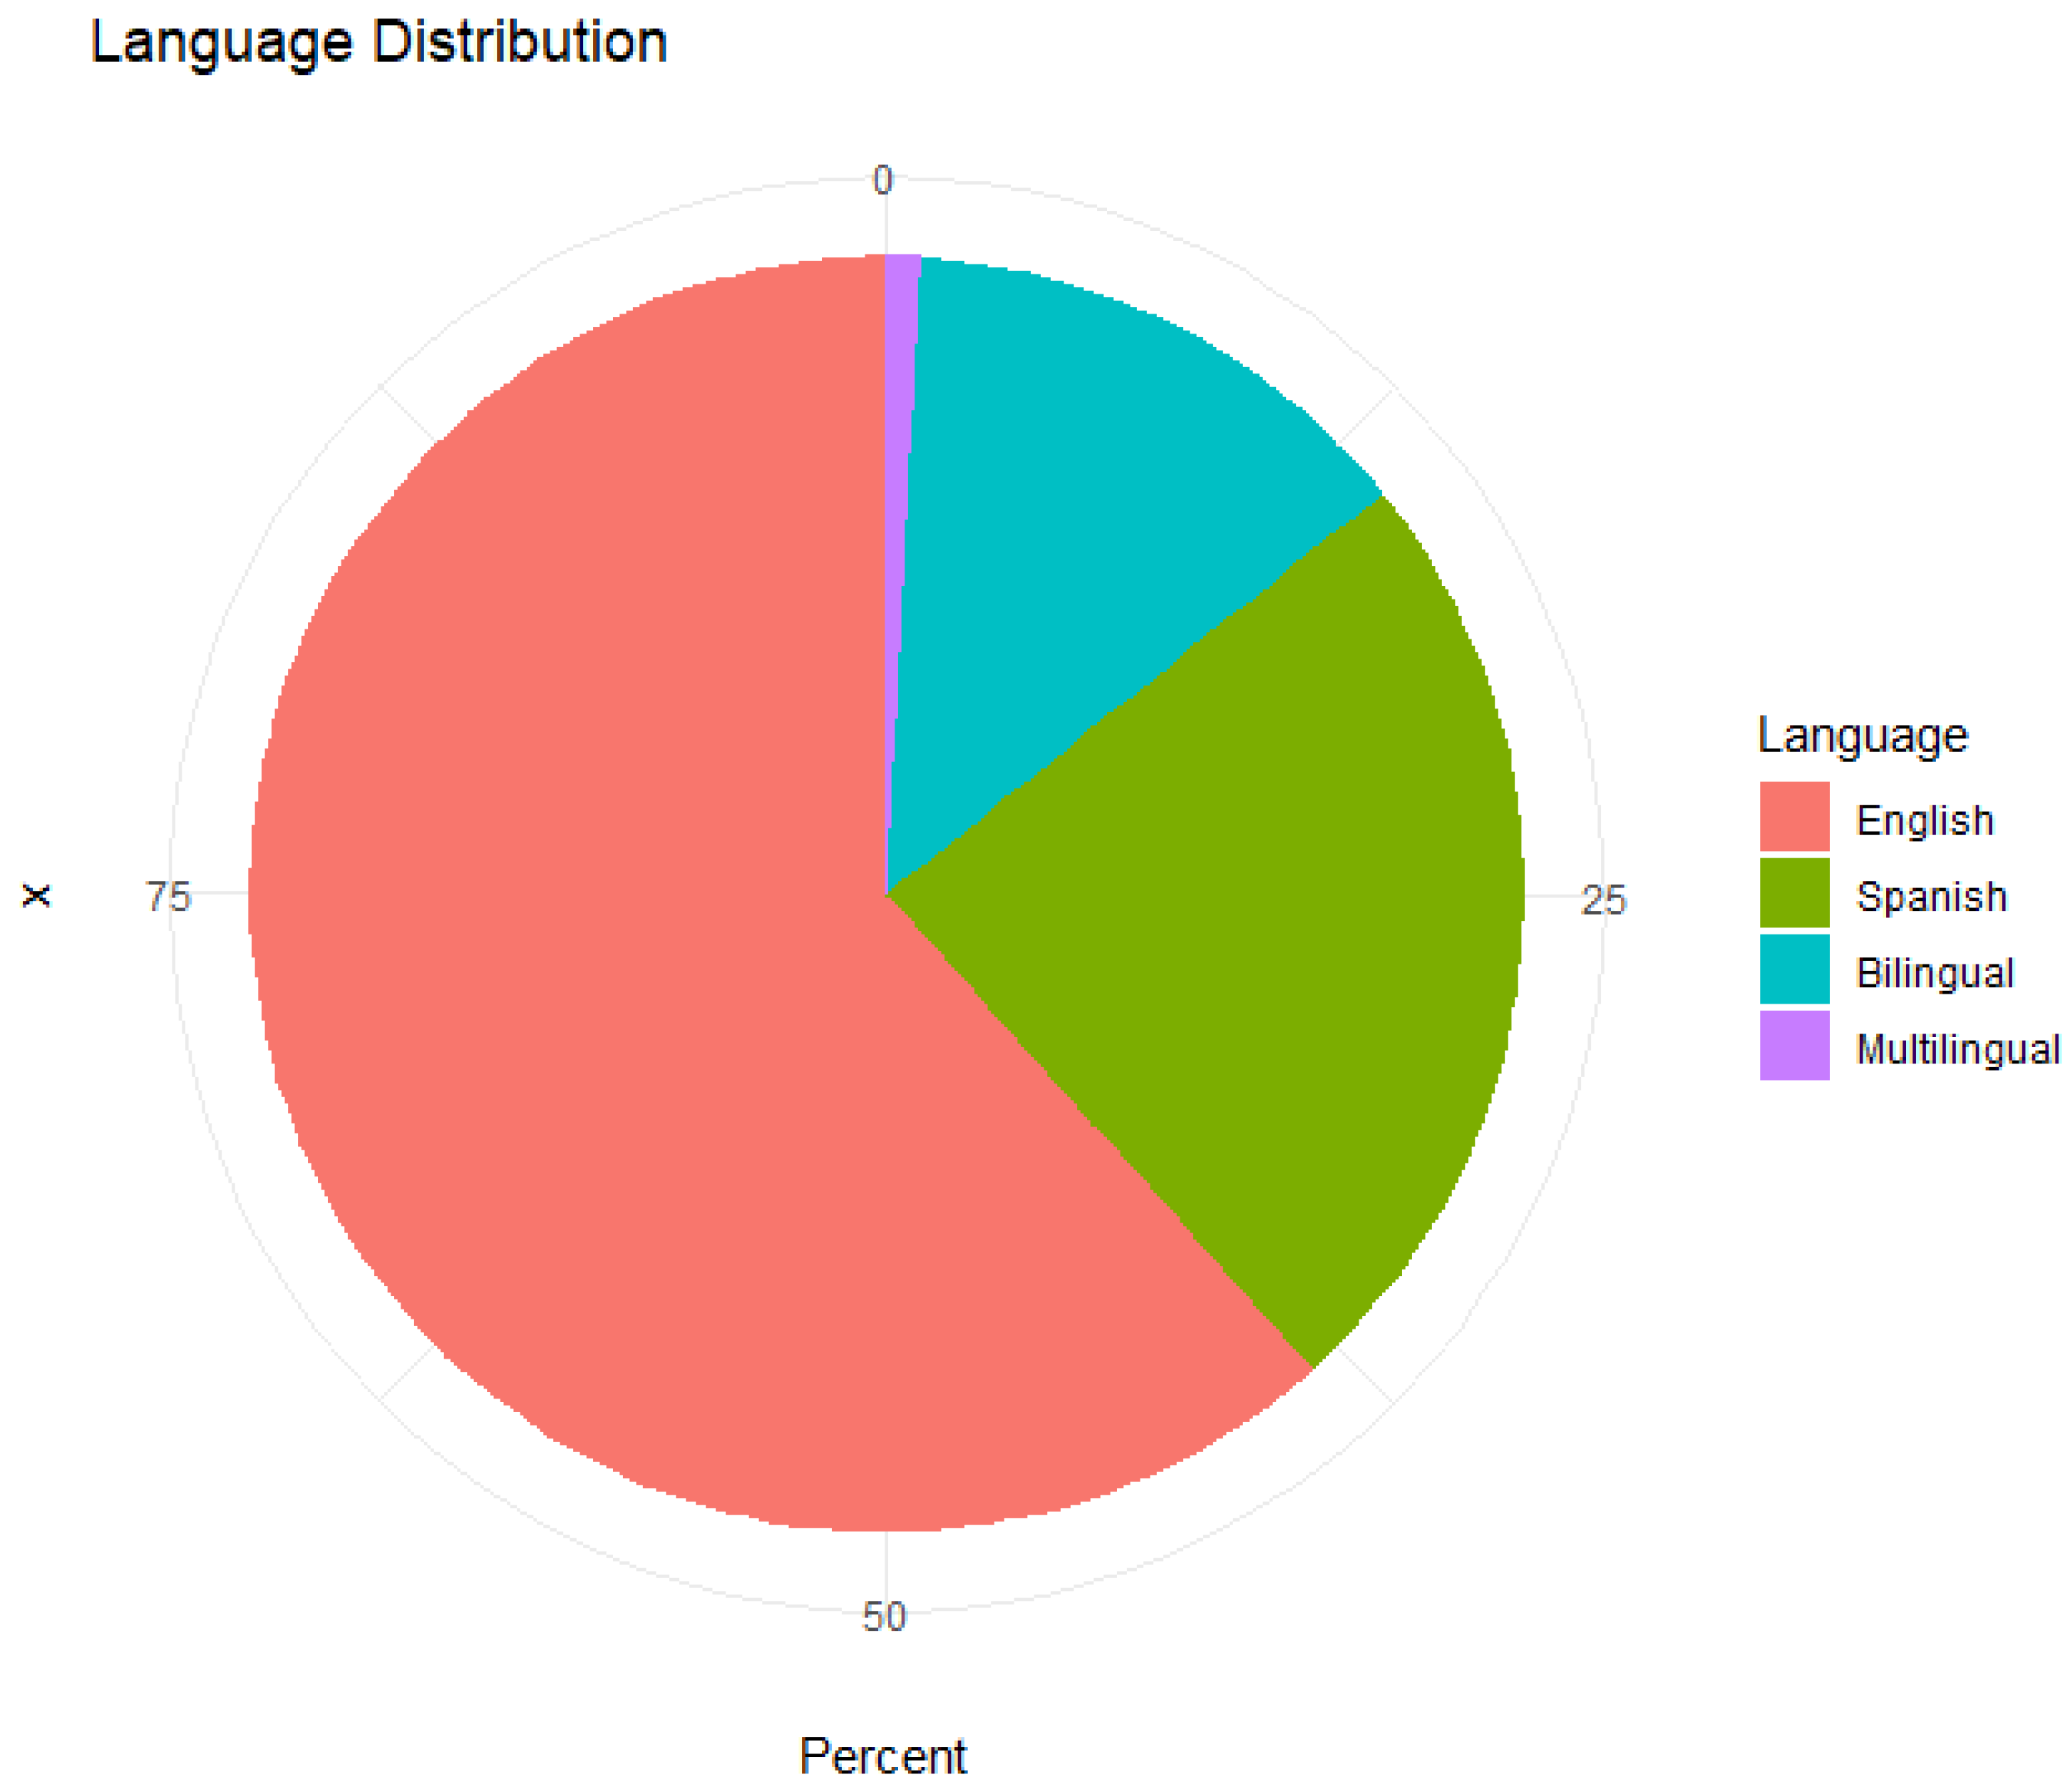
A visual representation of the linguistic distribution is presented in
Figure 2, where descriptive statistics underscore the prevailing prominence of English within the linguistic landscape. Specifically, our findings reveal that English comprises the largest share, with a total of 2069 signs, constituting 61.65% of the linguistic landscape. Following closely, Spanish exhibits a presence with 811 tokens (24.16%); bilingual signs, incorporating both English and Spanish, account for 447 tokens, corresponding to 13.31%; and multilingual signs exhibit a notably lower prevalence, with only 29 occurrences, constituting a mere 0.86% of the linguistic landscape of Hispanic Philadelphia.
3.1. Results for Time
To address the second objective of this research, which focuses on assessing the temporal impact on the linguistic landscape of Hispanic Philadelphia, contingency tables were constructed, with the independent variable being the year in which the data was collected. Subsequently, a chi-squared test was conducted to gauge the influence of time on language use. As detailed in the methodology section, the null hypothesis posited that there would be no discernible association between the choice of language and the respective collection year of the signs.
The obtained result—presented in
Table 2—reveals a statistically significant impact of
time on
language use (χ2 (6,
n = 3356) = 63.911,
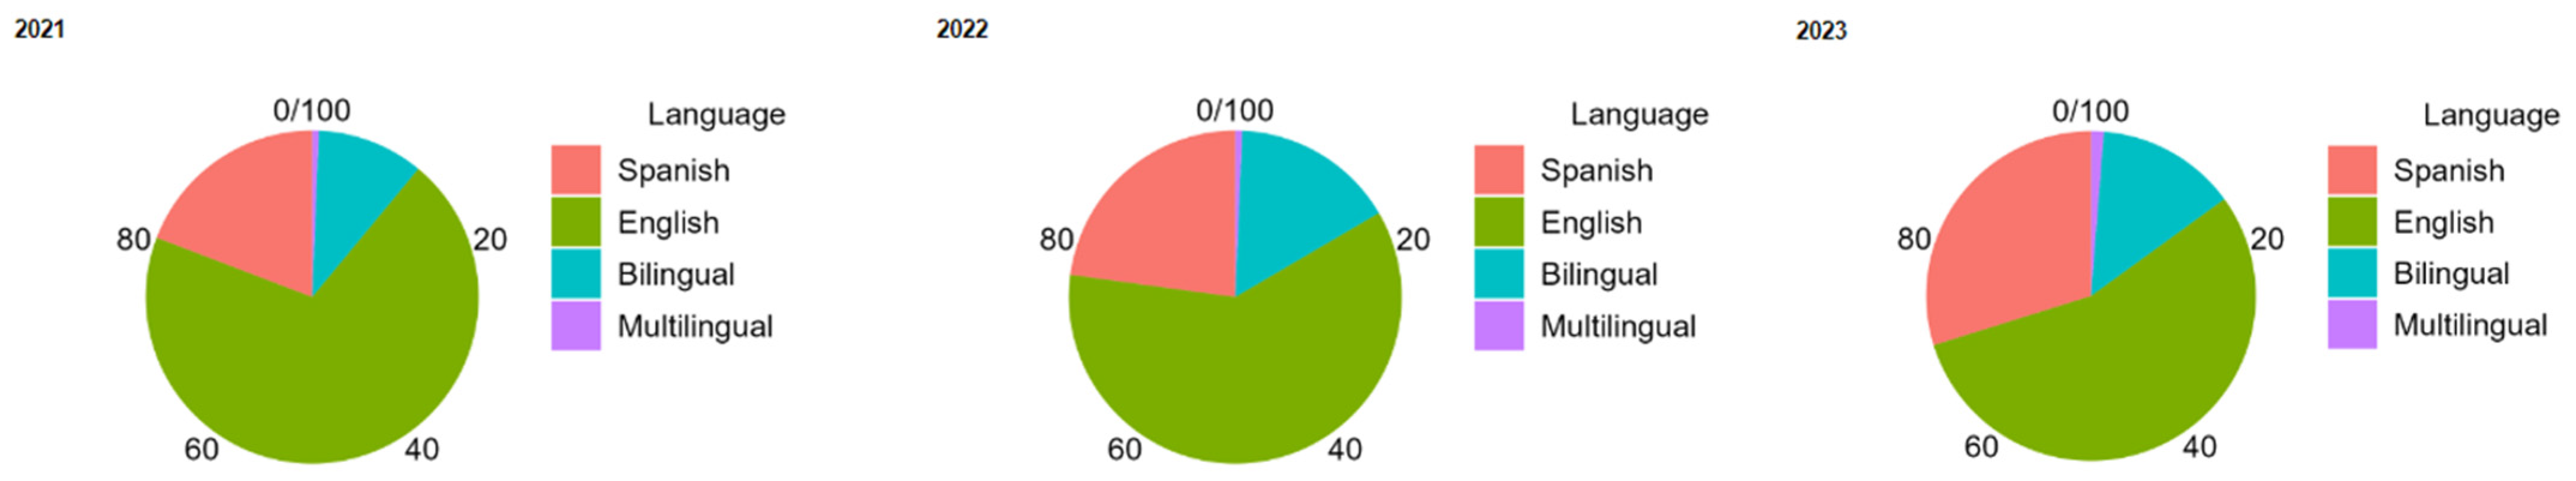
p < 0.001, φ = 0.098), thereby rejecting the null hypothesis and indicating that the linguistic landscape of Hispanic Philadelphia undergoes changes over time. Delving into the data, it is evident that signs in English experienced a decrease from 767 to 636 in 2022, followed by an increase to 666 in 2023. Concurrently, signs in Spanish exhibited an upward trend, rising from 211 in 2021 to 240 in 2022 and further escalating to 360 in 2023. This observation underscores an expanding presence of monolingual signs in Spanish.
Moreover, bilingual signs demonstrated growth, ascending from 114 in 2021 to 167 in 2022 and maintaining stability in 2023. In contrast, multilingual signs remained consistent in 2021 and 2022, each registering 7 occurrences, but witnessed an increase to 15 in 2023. To offer a comprehensive visual representation,
Figure 3 combines three distinct pie charts, providing an insightful analysis of how these languages are distributed across the years. This nuanced exploration enhances our understanding of the evolving linguistic dynamics within the Hispanic neighborhoods of Philadelphia.
The chi-squared test, with a calculated value of 63.911, further supports the conclusion that the observed changes in language use across years are not mere chance variations but reflect systematic shifts.
3.2. Results for Location
To fulfill the third objective of this research a frequency table (
Table 3) was created by combining the variables
language and
location, and a chi-squared test was applied to determine any significant relationships between them. Again, the null hypothesis posited that there would be no discernible association between the choice of language and the location in which the tokens were gathered: the Golden Block, which is widely recognized as the main Hispanic neighborhood in Philadelphia (
Wherry 2011;
Wilson 2003); the Italian Market area of South Philadelphia, where the Mexican community has been established since the 1990s (
Benitez 2009); and Olney, a neighborhood known for its diverse culinary offerings, including Colombian cafes, Jamaican bakeries, and Korean restaurants (
Blumgart 2020).
The results of the chi-squared test indicate that location significantly impacts language use in the linguistic landscape of Philadelphia (χ2 (6, n = 3356) = 109.454, p < 0.001, φ = 0.128). The Italian Market in South Philadelphia presents a big impact for language choice. This area is the most predominant neighborhood for Spanish, English, and multilingual signs. In this area, 52.03% of monolingual Spanish signs were collected; 45.33% of the monolingual English signs and 96.55% of multilingual signs were also found here. Bilingual signs, on the other hand, were more prevalent in the Golden Block, where 37.58% of the bilingual signs were gathered.
3.3. Results for Time and Location
The variables time and location were combined to analyze which languages were used in these locations from 2021 to 2023. Results are presented in the following clustered bar charts.
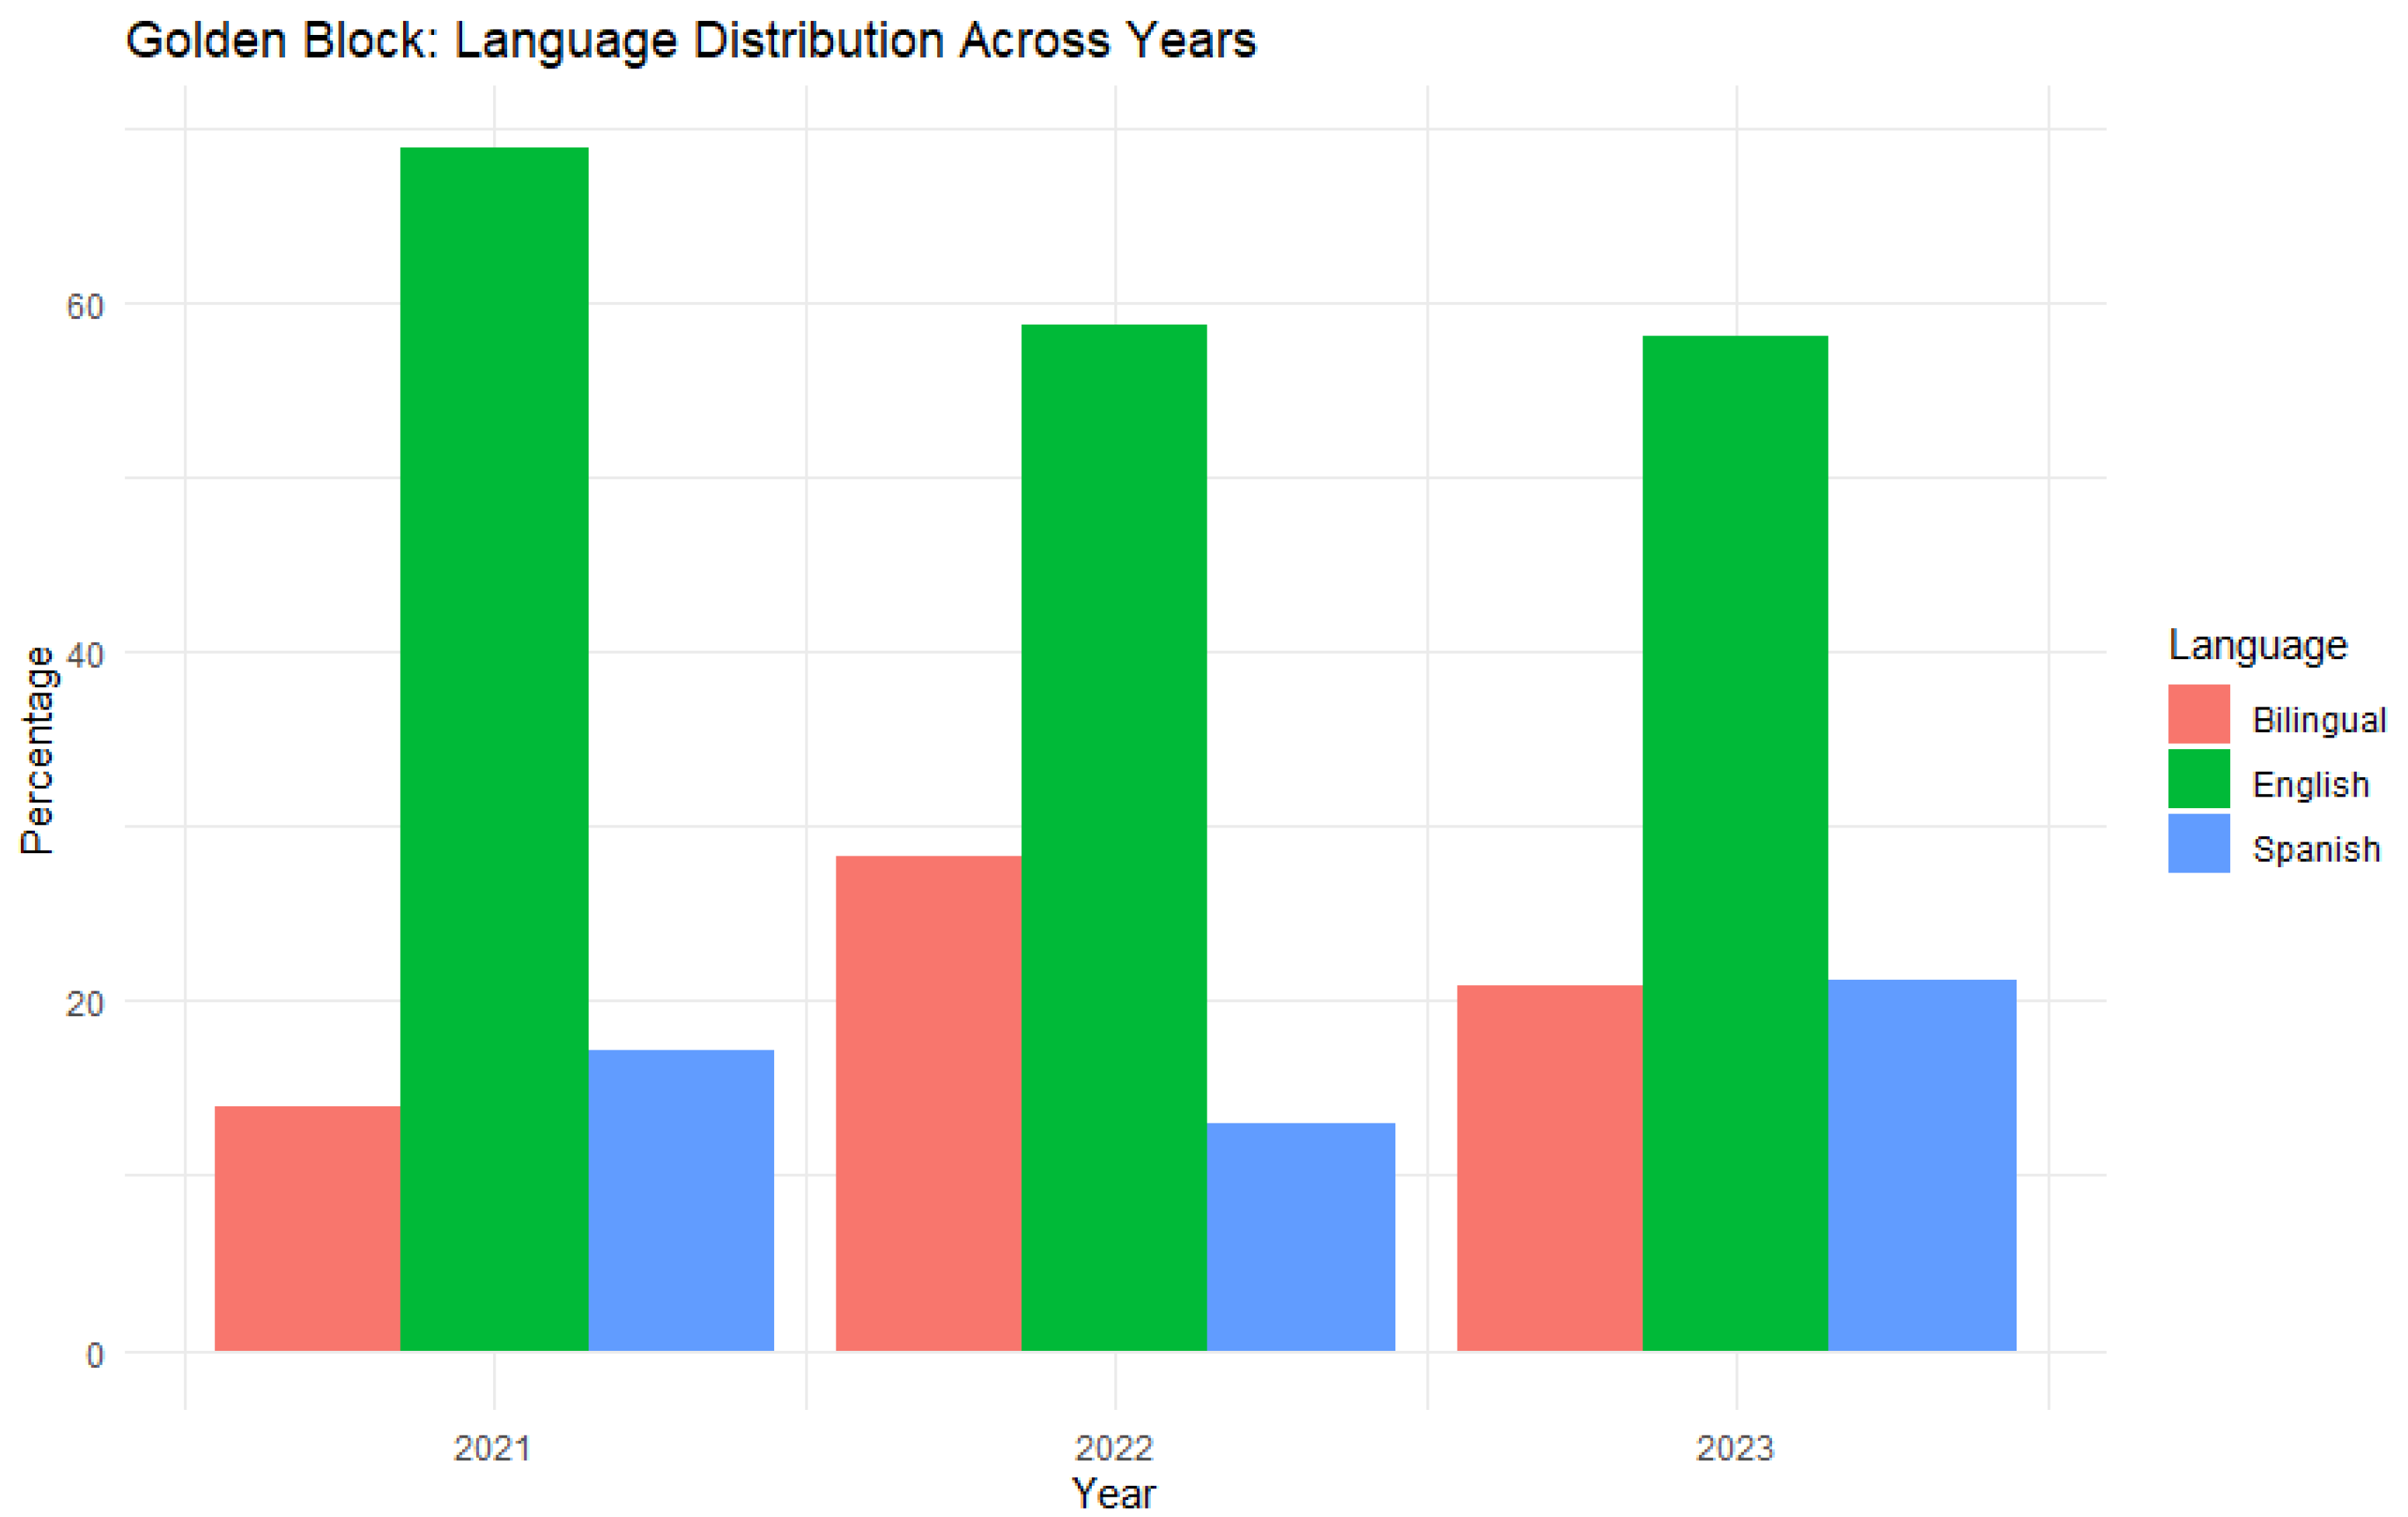
Figure 4 provides a concise and clear overview of the language dynamics within the linguistic landscape of the Golden Block between 2021 and 2023. The use of a chronological sequence helps in understanding the temporal changes in language presence. The data regarding monolingual signs in English show a decrease from 2021 to 2022 but remain stable in 2023, conveying a specific trend and providing a snapshot of language usage over the mentioned years. Similarly, the fluctuations in the presence of Spanish, with a decrease in 2022 followed by an increase in 2023, and bilingual signs going up in 2022 and then decreasing again in 2023 add another layer to the narrative, illustrating the variability in language use within the Golden Block during the specified time frame.
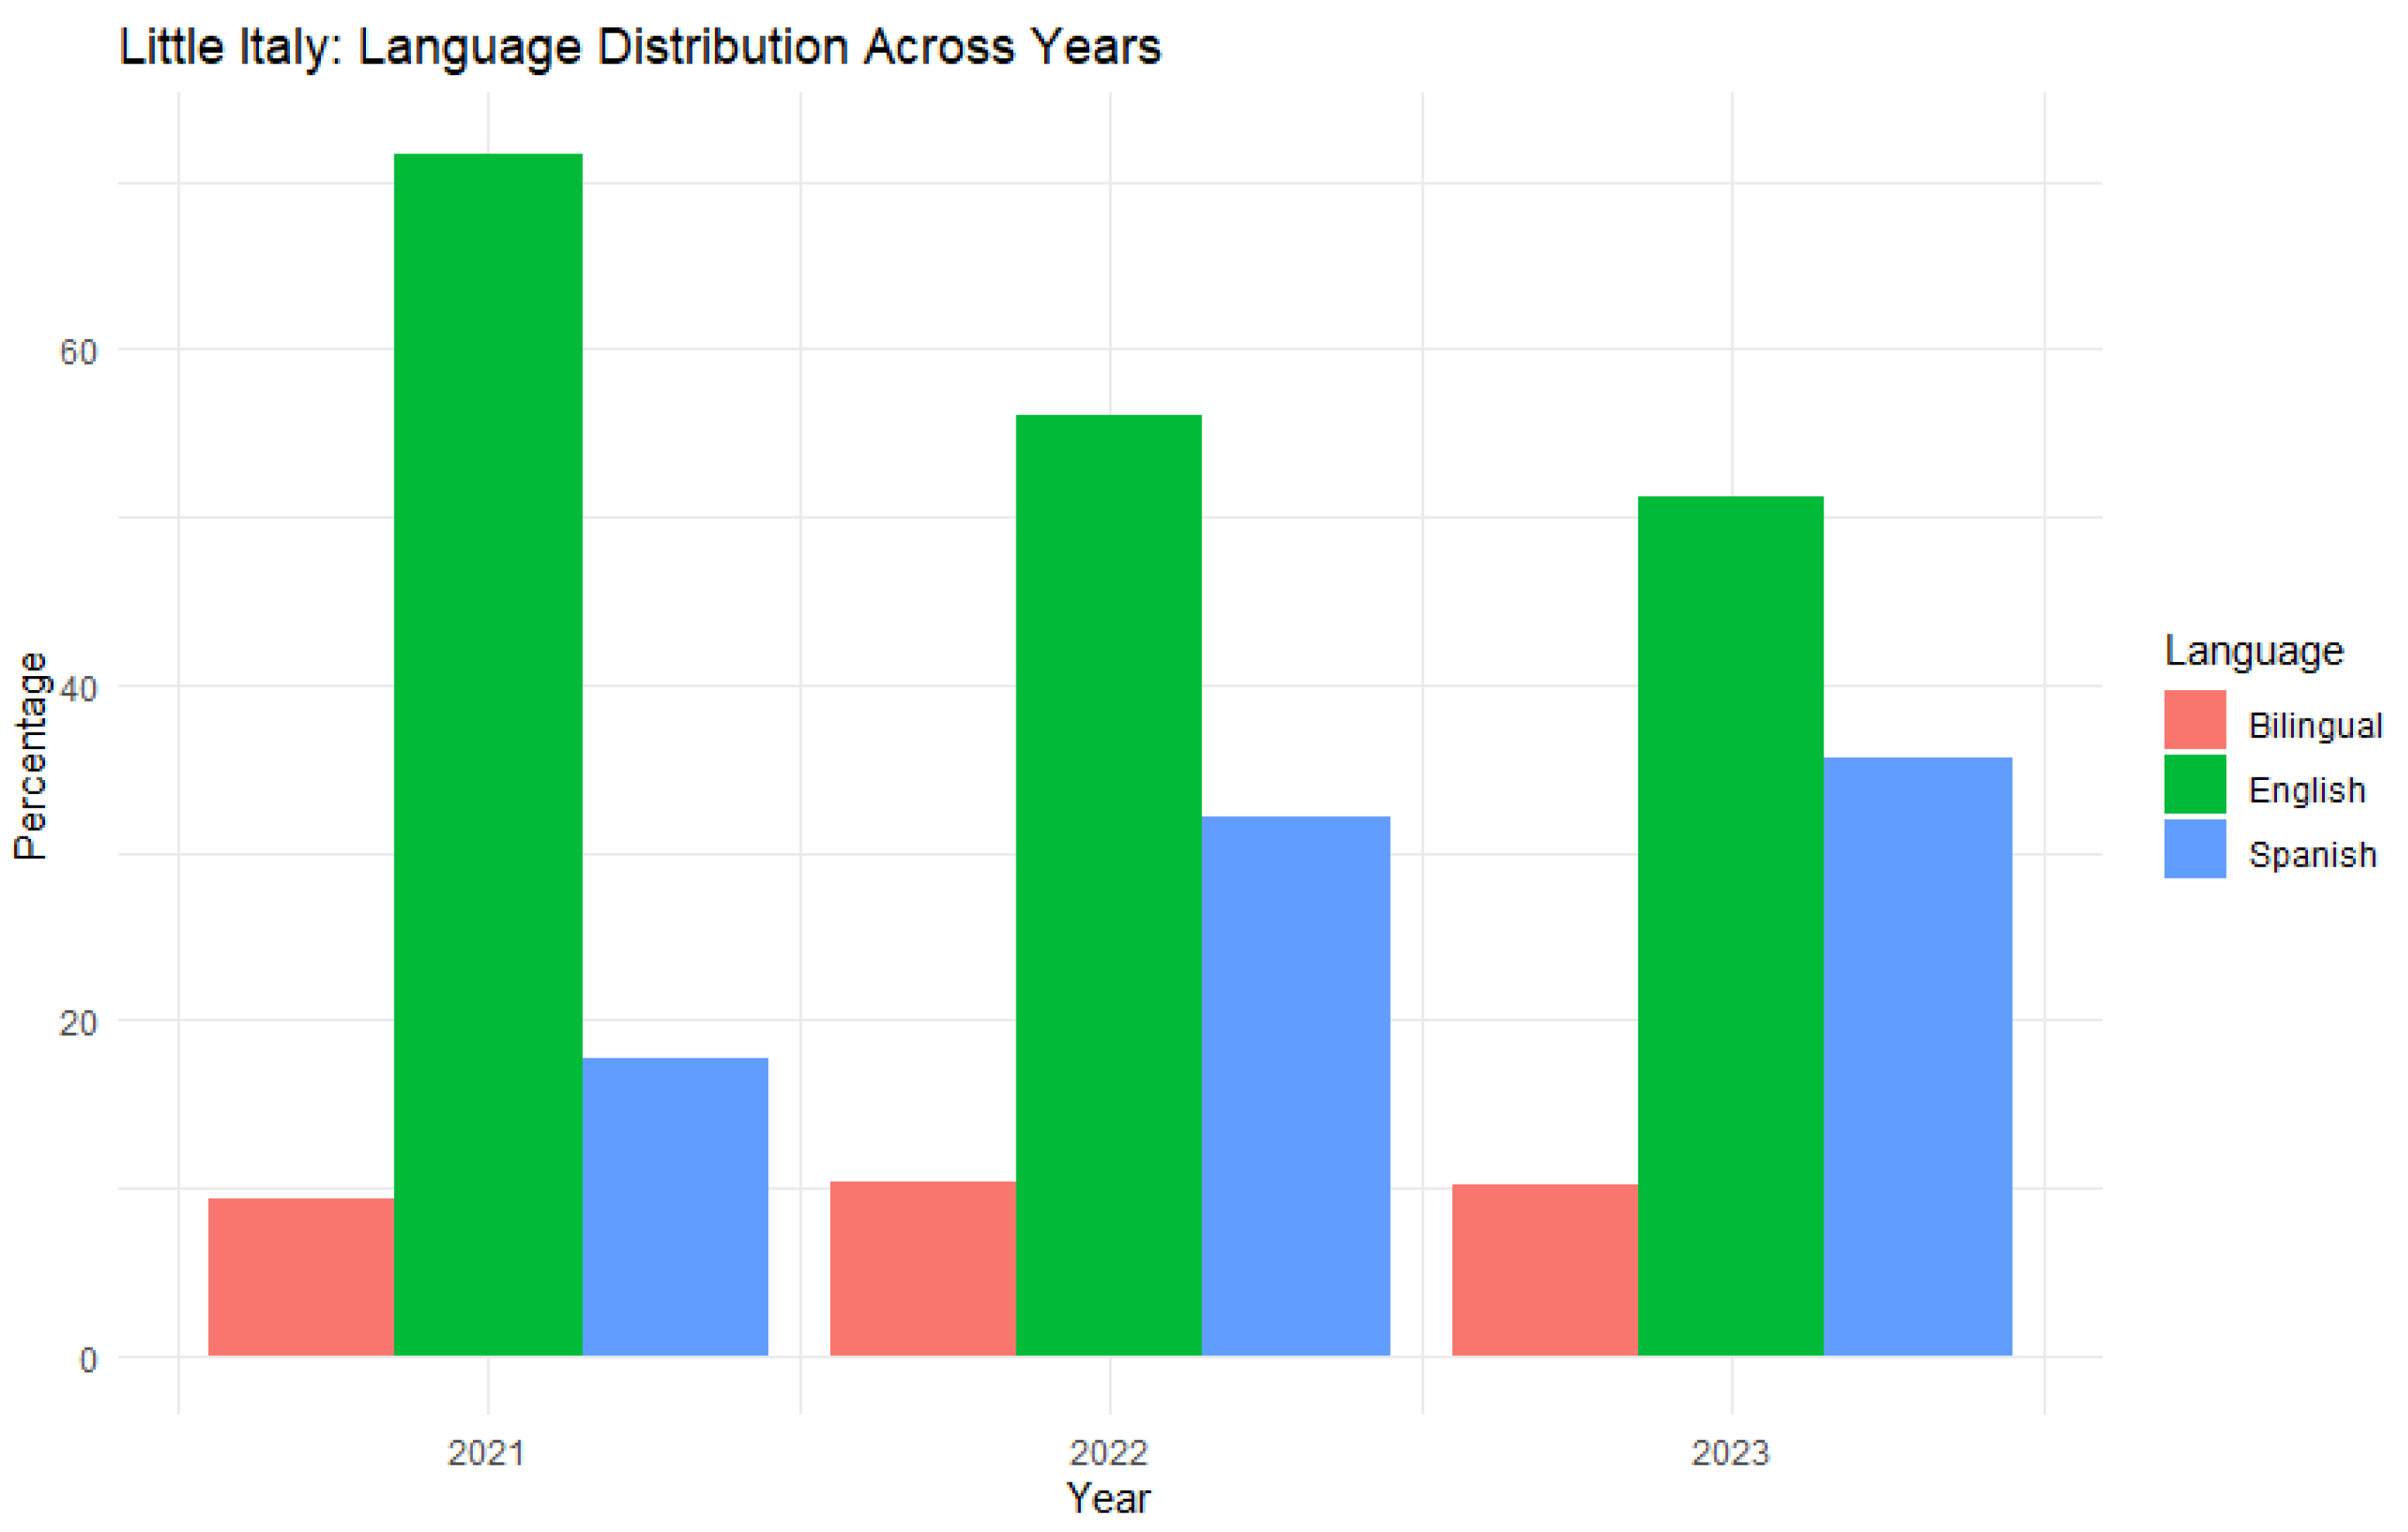
Figure 5 offers a comprehensive overview of tokens identified in South Philadelphia, revealing distinct trends in language distribution. Monolingual English signs exhibit a consistent linear decrease from 71.72% in 2021 to 56.00% in 2022 and further to 51.20% in 2023. In contrast, signs in Spanish demonstrate a clear upward trajectory, maintaining a steady increase throughout the specified period (17.77% in 2021, 32.18% in 2022, and 35.60% in 2023). Interestingly, the prevalence of bilingual signs remains stable over the course of the study, showing minimal fluctuations; the percentages for bilingual signs indicate a consistent presence, with 9.36% in 2021, 10.30% in 2022, and 10.10% in 2023.
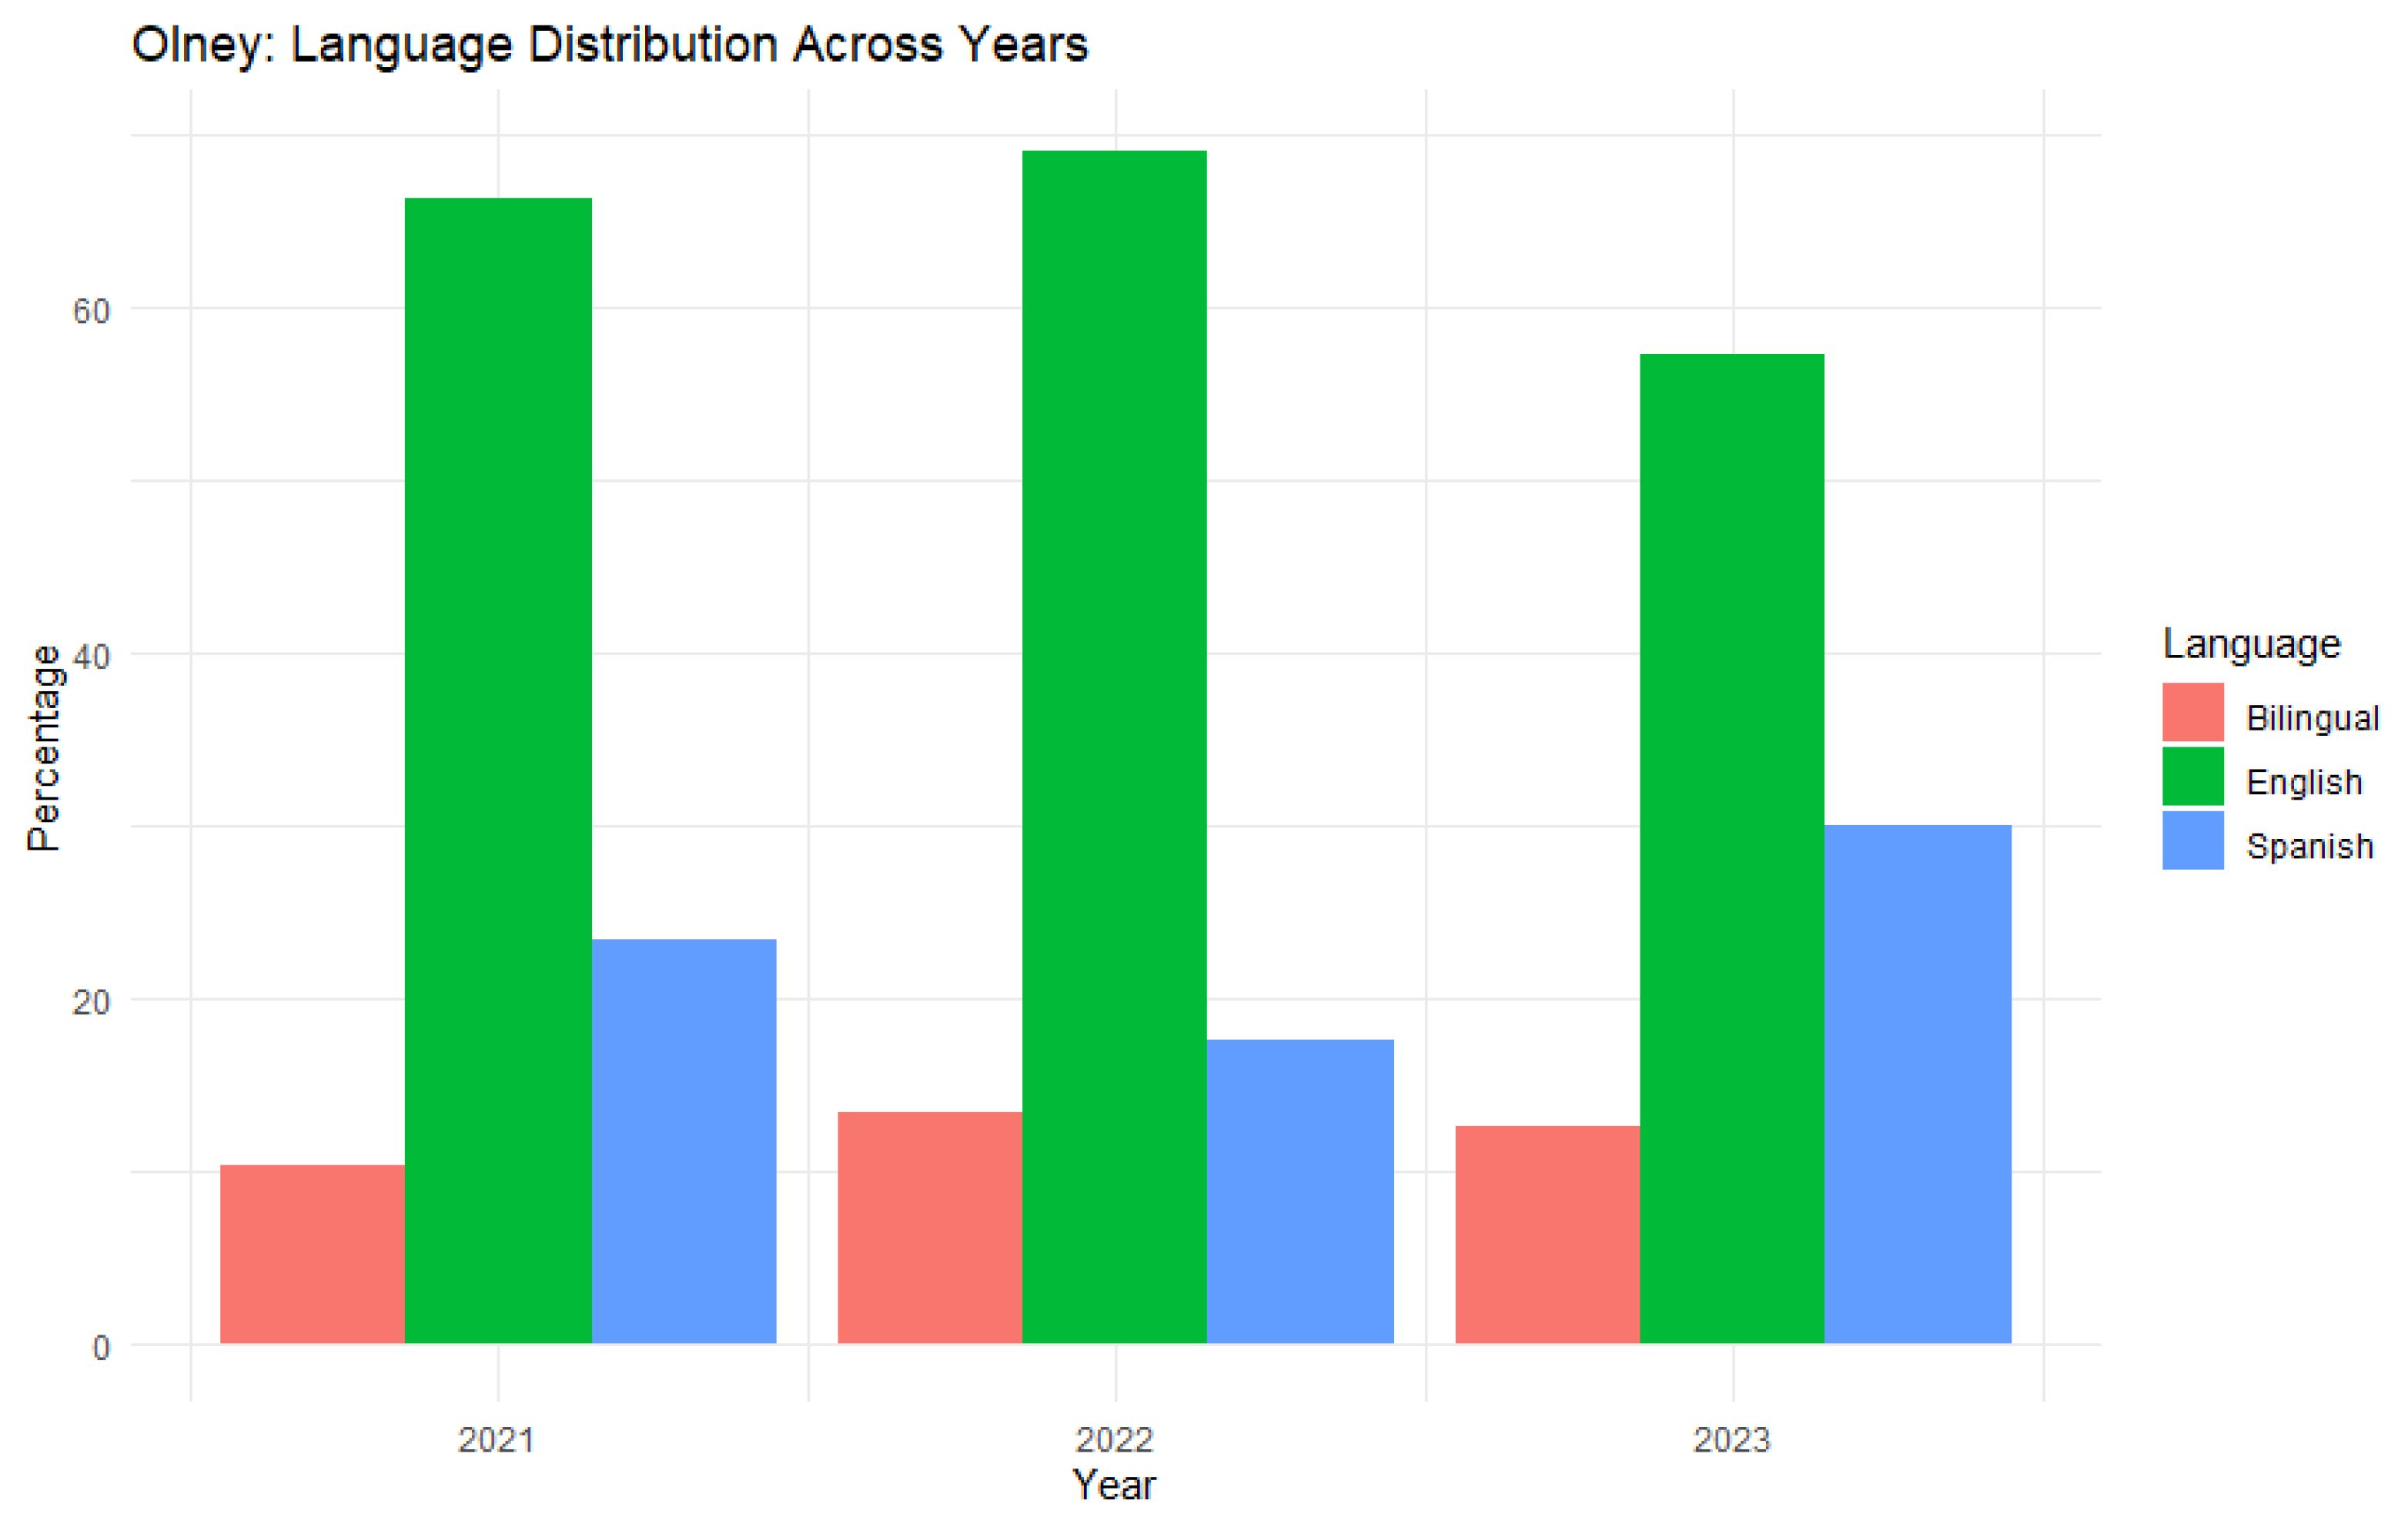
Finally,
Figure 6 illustrates the linguistic dynamics in Olney. The prevalence of English signs exhibited a temporal progression, starting at 66.33% in 2021, escalating to 69.15% in 2022, and subsequently declining to 57.27% in 2023. Conversely, Spanish signs demonstrated a discernible trend, initiating at 23.33% in 2021, decreasing to 17.53% in 2022, and resurging to 30% in 2023. Bilingual signs, akin to the observations in South Philadelphia, demonstrated relative stability with marginal fluctuations. Specifically, bilingual signs transitioned from 10.33% in 2021 to 13.31% in 2022 and eventually settled at 12.50% in 2023.
3.4. Results for Establishment
Inspired by previous research on Hispanic LLSs in the United States (
Hassa and Krajcik 2016;
Pastor 2021), signs were also categorized based on the type of establishment in which they were displayed. Hence, the categories were Beauty, encompassing hair salons and barber shops; Education; Furniture; Grocery or Convenience Stores; Health, in which all health-related institutions were combined (i.e., clinics, therapy, mental health, etc.); Mobile Signs (food trucks and vans); Pharmacies; Poles; Religious Temples; Restaurants; Services, combining different kind of offices such as lawyers, bills payments, taxes, and auto tags; Store, combining shoes and clothes stores; Technology; and Wall.
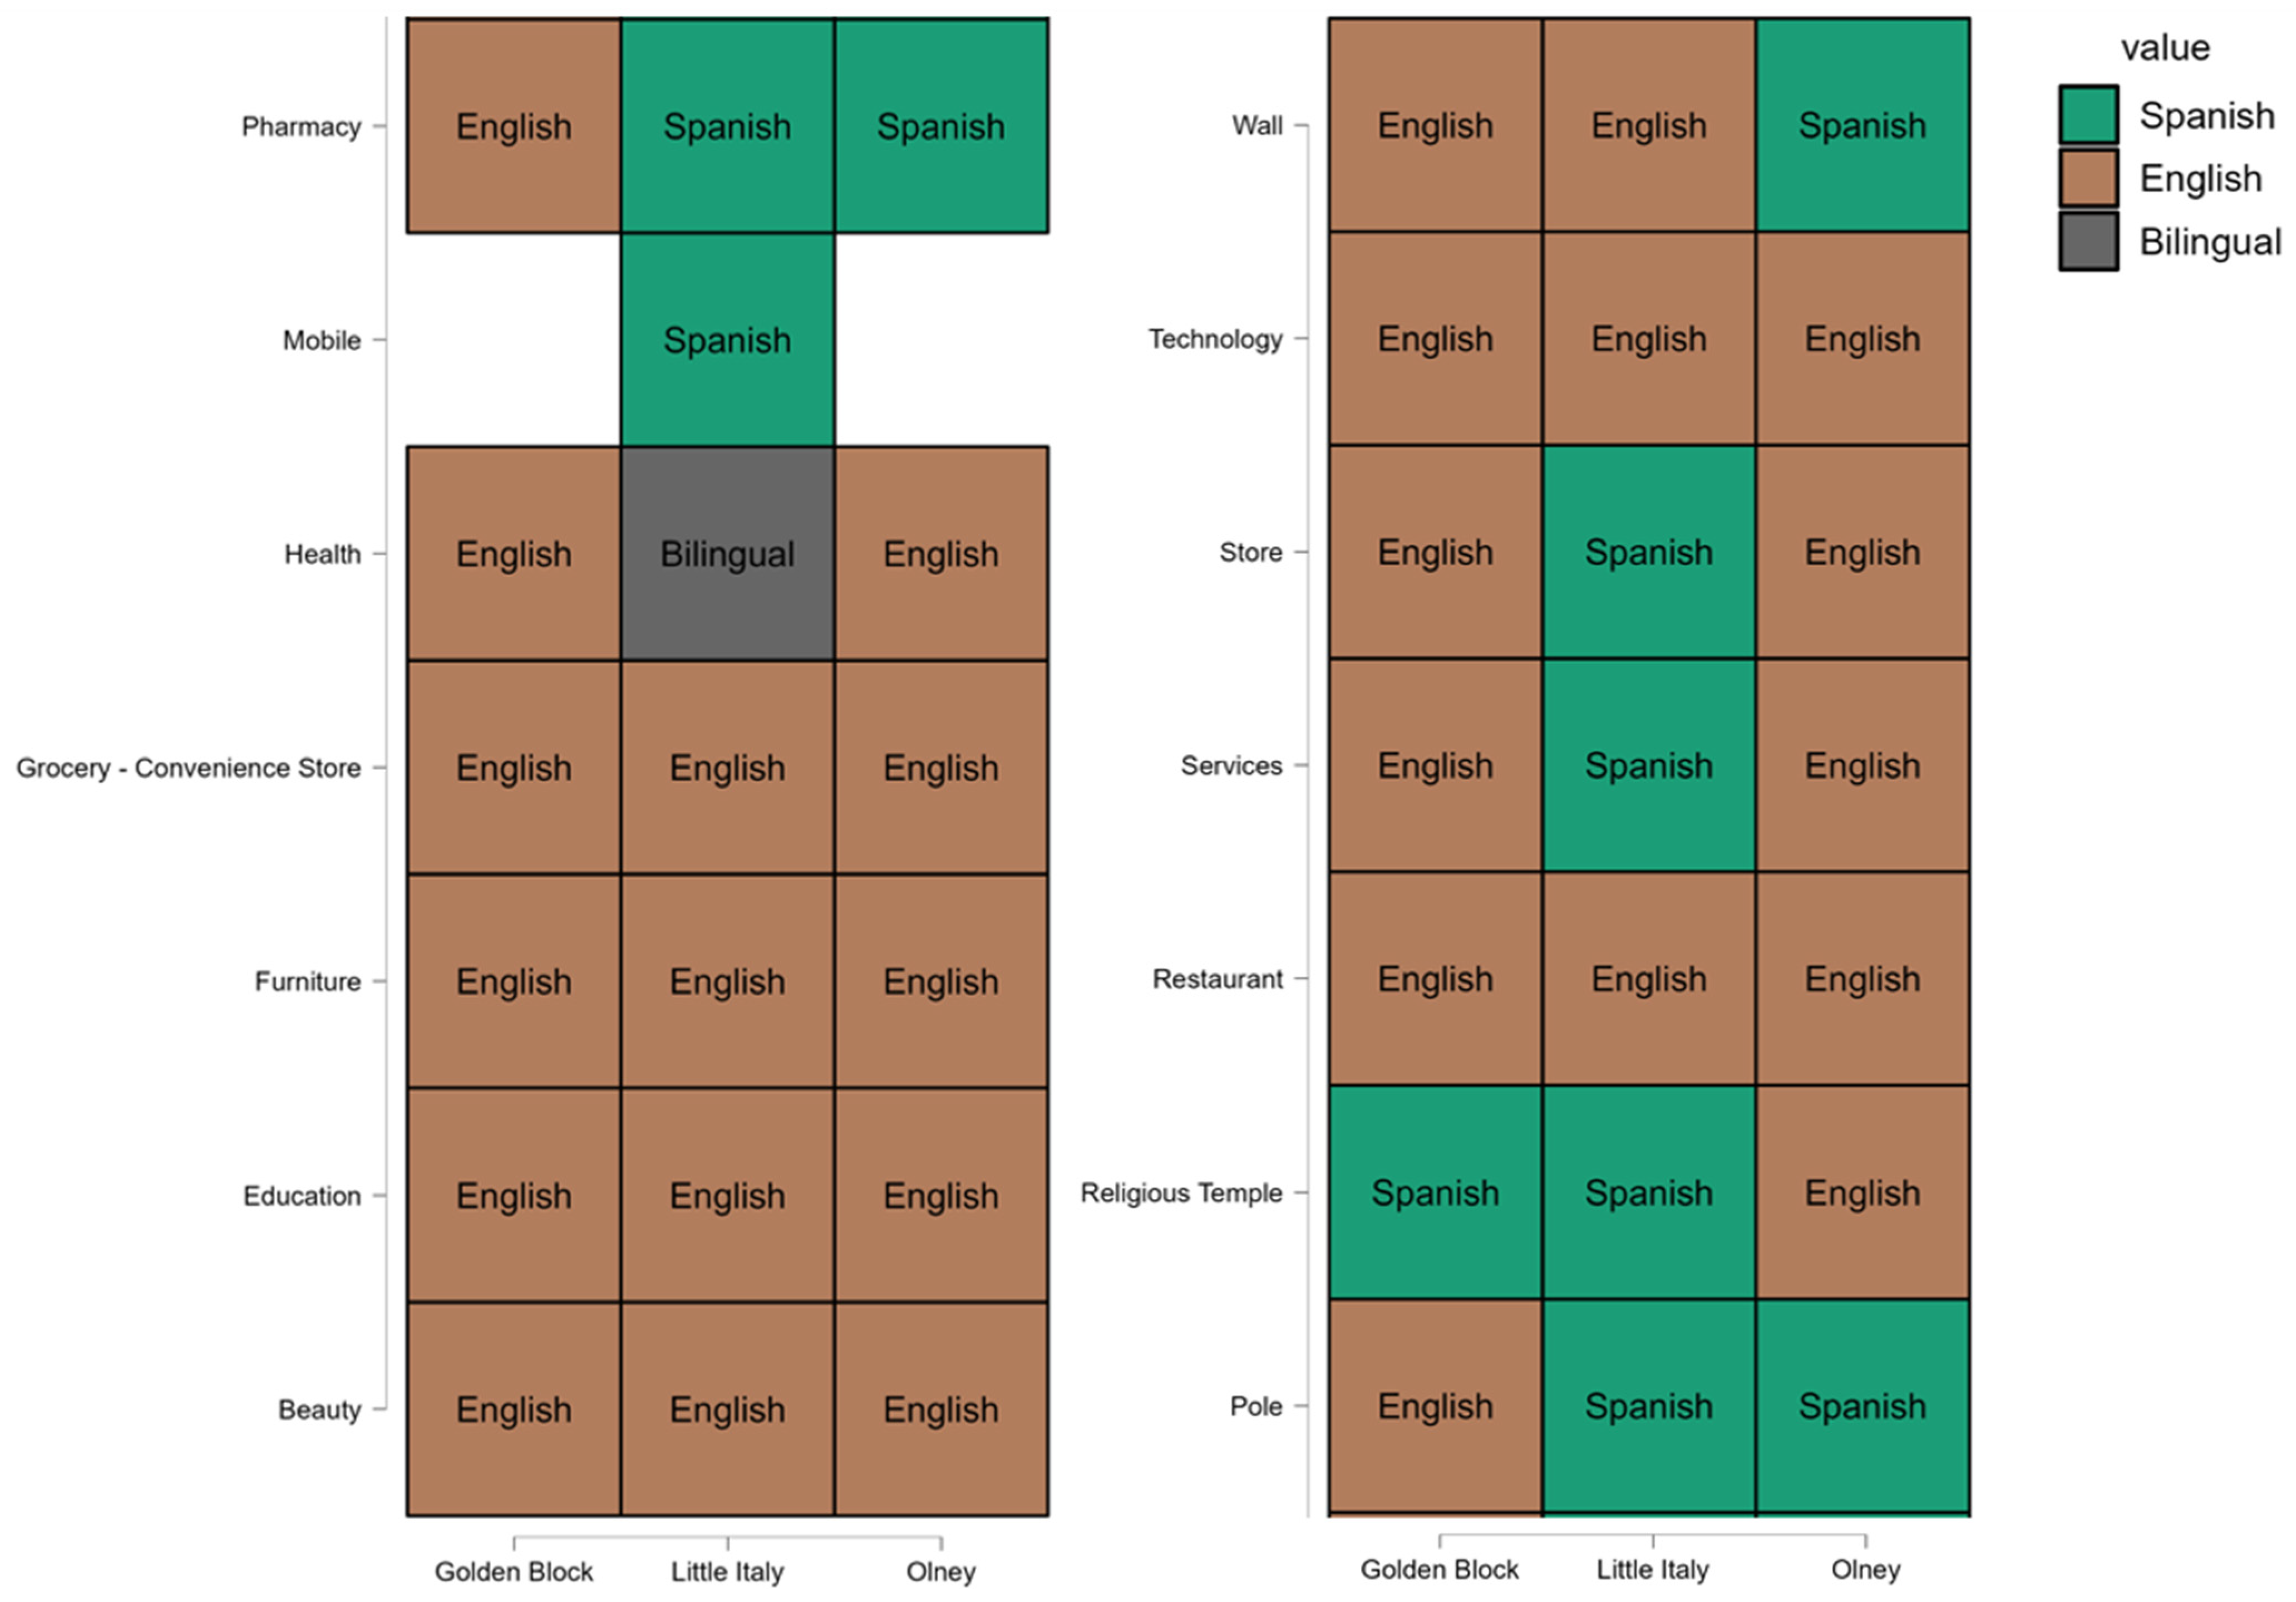
Due to the high degree of freedom (df) when running the chi-squared test (39), we did not consider the category to be statistically significant despite the low p-value (<0.001). Instead, it was decided to aggregate variables into clusters using a heatmap. This involved plotting the location on the horizontal axis and the type of establishment on the vertical axis, aiming to discern prevalent languages within these clusters.
The heatmap presented in
Figure 7 reveals that, while English remains the most utilized language overall, Spanish asserts its presence in specific establishments. Notably, the Golden Block signifies a prevalence of Spanish in signs displayed in religious temples. In South Philadelphia, Spanish is prominent in signs across stores, service offices, religious temples, poles, pharmacies, and food trucks. Conversely, in Olney, Spanish is more likely in signs on walls, on poles, or in pharmacies. Bilingual signs are notably prevalent in health institutions in South Philadelphia.
4. Discussion
Overall, the results of this linguistic landscape study provide important insights into the impact of
time and
location on
language use in Hispanic Philadelphia. Even though Spanish speakers in the United States constitute one of the largest Spanish-speaking agglomerations in the world (
Otheguy 2019, p. 9), in Philadelphia, Spanish is still considered a minority language and, as any other minority language, it tends to play a secondary role in the public domain (
Matras 2009, p. 45). This is reflected in the high percentage of monolingual English signs in the LL (61.65%). However, the study also shows that Spanish and other minority languages are becoming more present over time, as is shown in the pie chart comparison in
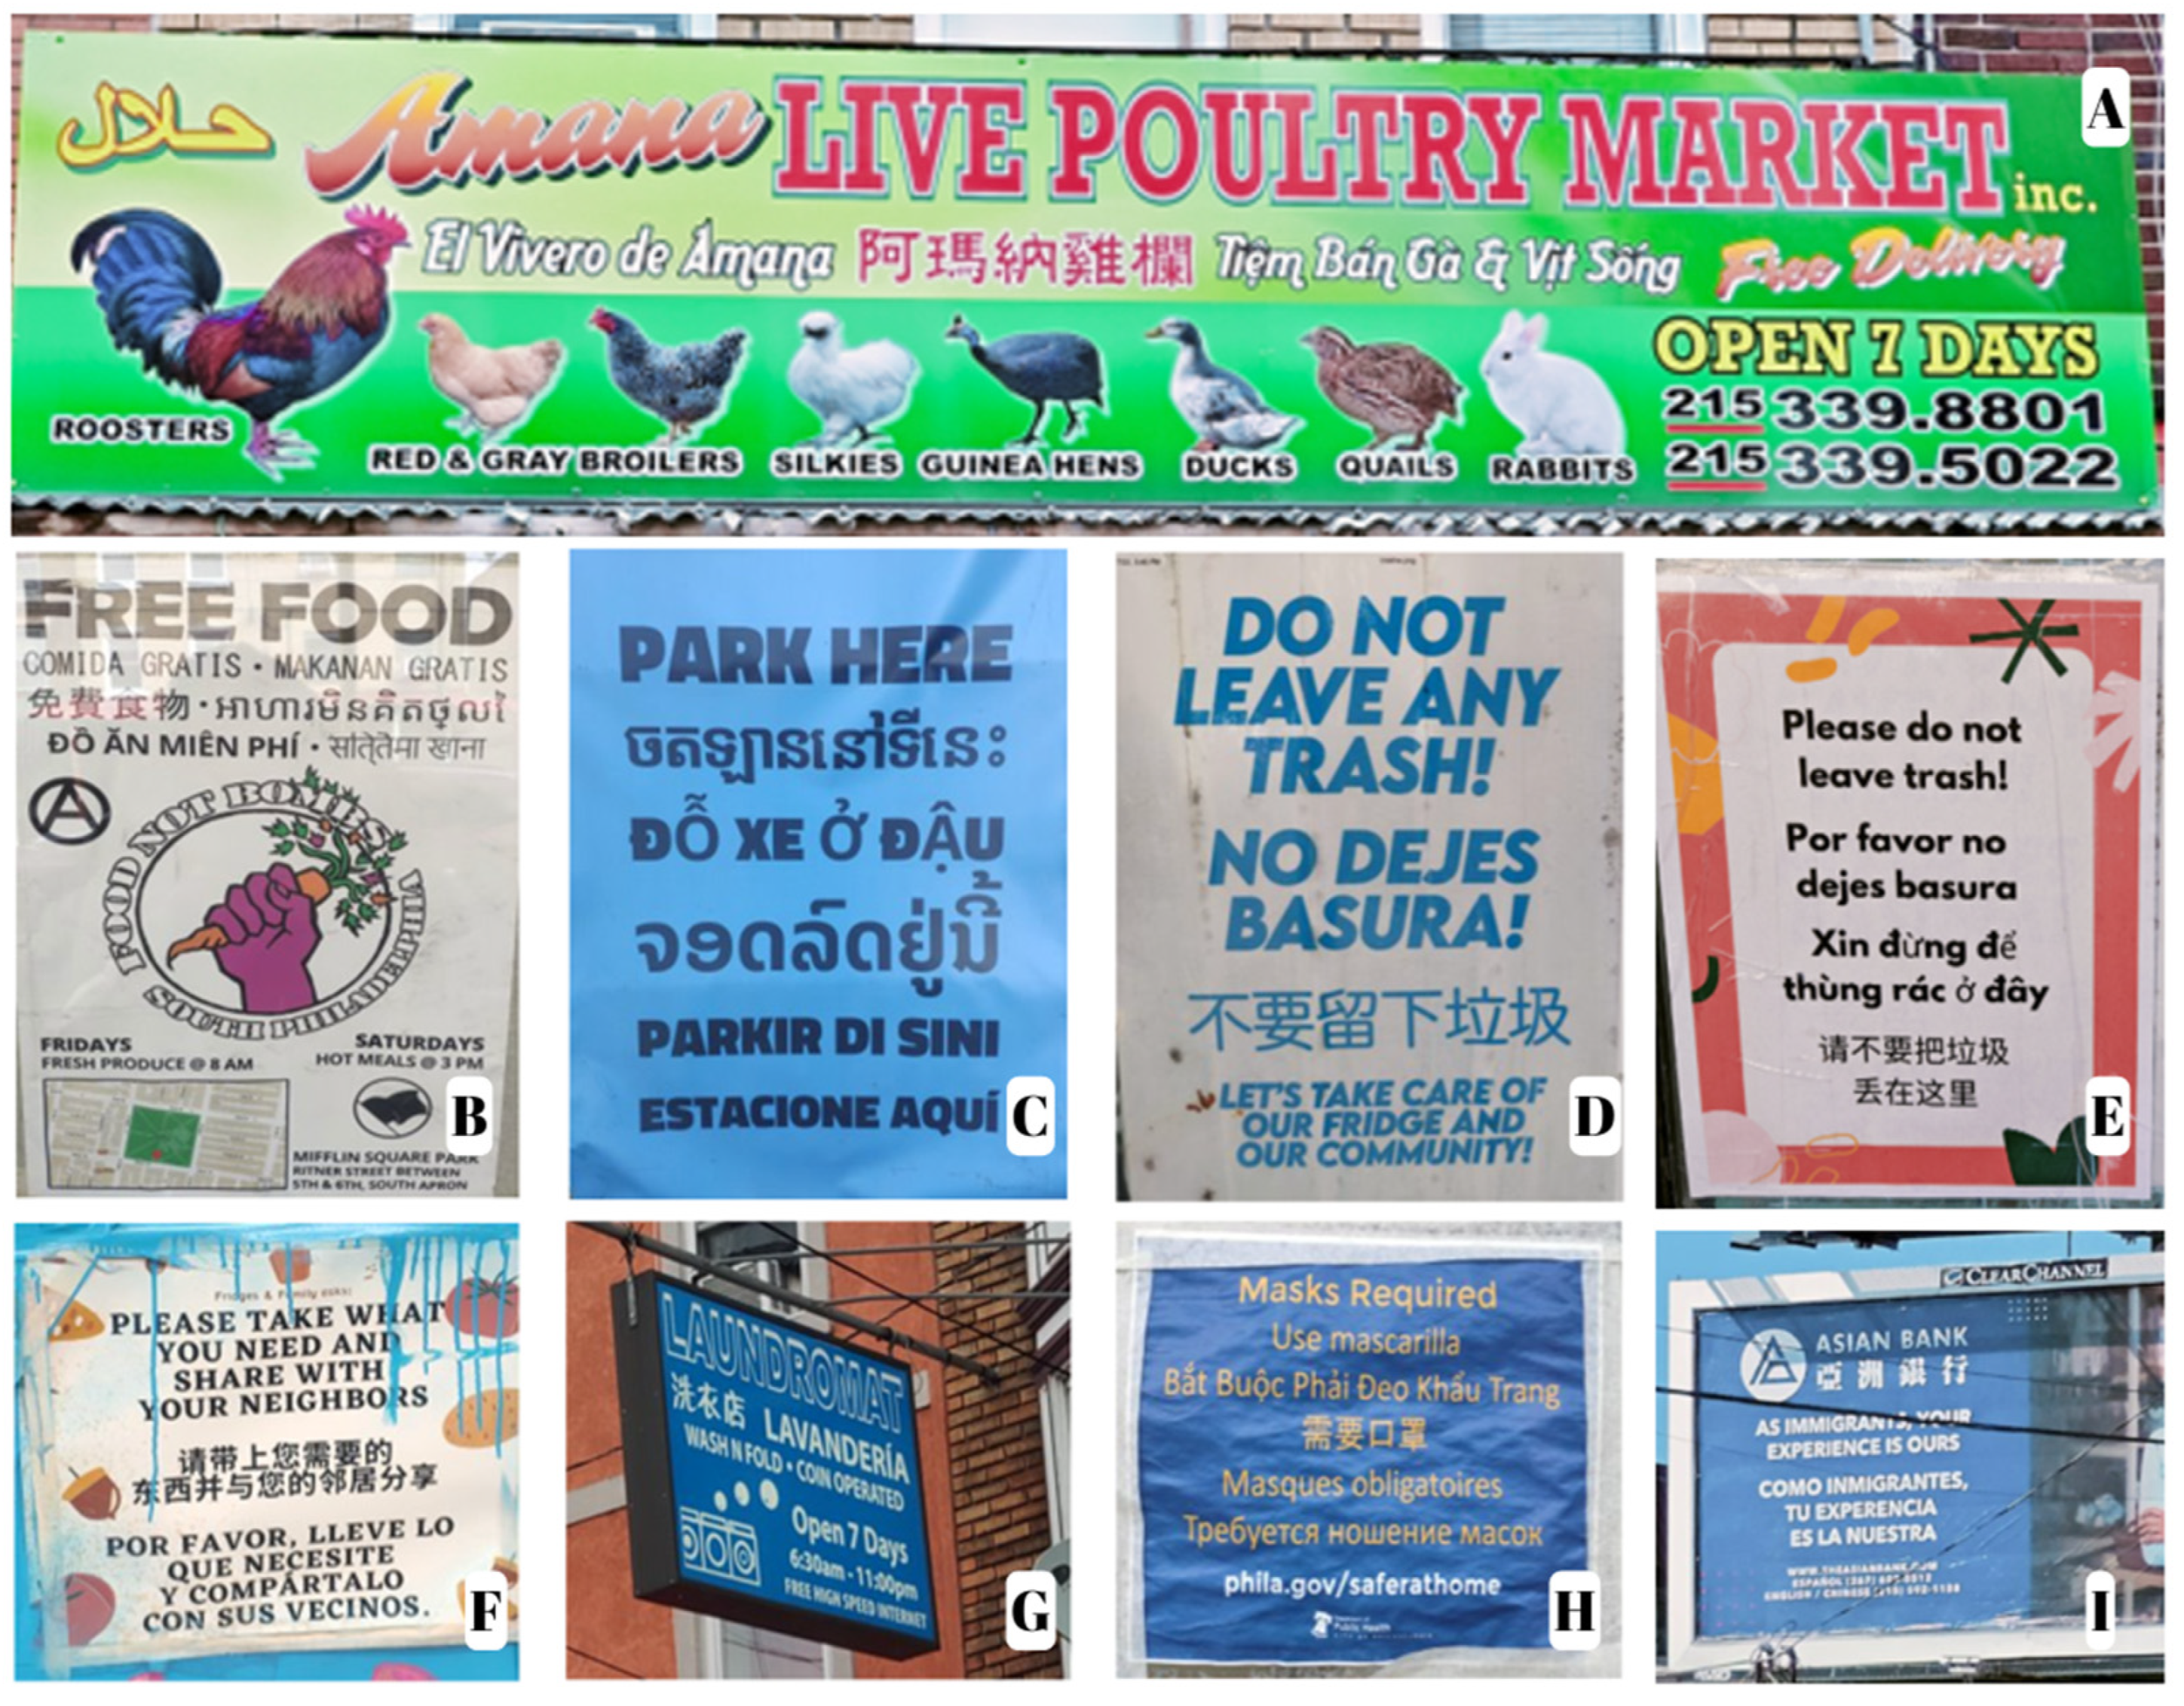
Figure 3. The following is a sample of this rising multilingualism.
The multilingualism present in the city (see
Figure 8) provides support for
Gorter’s (
2006) notion that the use of multiple languages serves as a representation of linguistic identities and cultural globalization, while also serving as a tool for the revitalization of minority languages. It is worth noting that this multilingualism extends to
top-down signs. Picture
H in
Figure 8 displays a multilingual sign created by the Philadelphia Government to inform people about the use of face masks during the COVID-19 pandemic.
In addition to the increase in multilingual signs, the findings suggest that
location plays a significant role in
language use in the LL, indicating that Spanish and the Hispanic communities are increasingly moving throughout the city. The first wave of Latinos arrived in Philadelphia during the 1890s, drawn by various employment opportunities in the city or nearby factories in Camden, NJ (
Vázquez-Hernández 2005). However, the largest wave of Latino migration to Philadelphia occurred after World War II (
Jensen et al. 2020;
Whalen 2001). Despite facing resistance and, at times, violence from predominantly white residents (
Wilson 2003, p. 19), the Hispanic population, mostly Puerto Rican (
Ribeiro 2013), settled in North Philadelphia on what is now known as the Golden Block.
Over time, the Golden Block has transitioned into a neighborhood of primarily first- and second-generation residents. While there are still Hispanic families and businesses, this does not guarantee that Spanish is the dominant language of communication. As
Carr (
2021, p. 262) mentions, the LL will never provide a perfect mirror image of the linguistic population due to changes in the population over time, language loss, and the dynamic nature of signs affected by factors such as aging, weather, graffiti, and other environmental elements. According to
Escobar and Potowski (
2015), the use of Spanish in the United States decreases with each generation, with English becoming the favored language. This language shift, along with changes in migration patterns, has impacted the linguistic landscape of the city. As
Geldof (
2018) observes, increasing ethnic diversity in our societies is part of a demographic transition resulting from accelerated migration, leading to the emergence of majority-minority neighborhoods with commonplace diversity.
The decrease in monolingual Spanish signs in the Golden Block, as shown in
Figure 4, reflects the emergence of new communities spreading across the city, breaking down the divisive “us vs. them” mentality promoted by movements like
English-Only (see
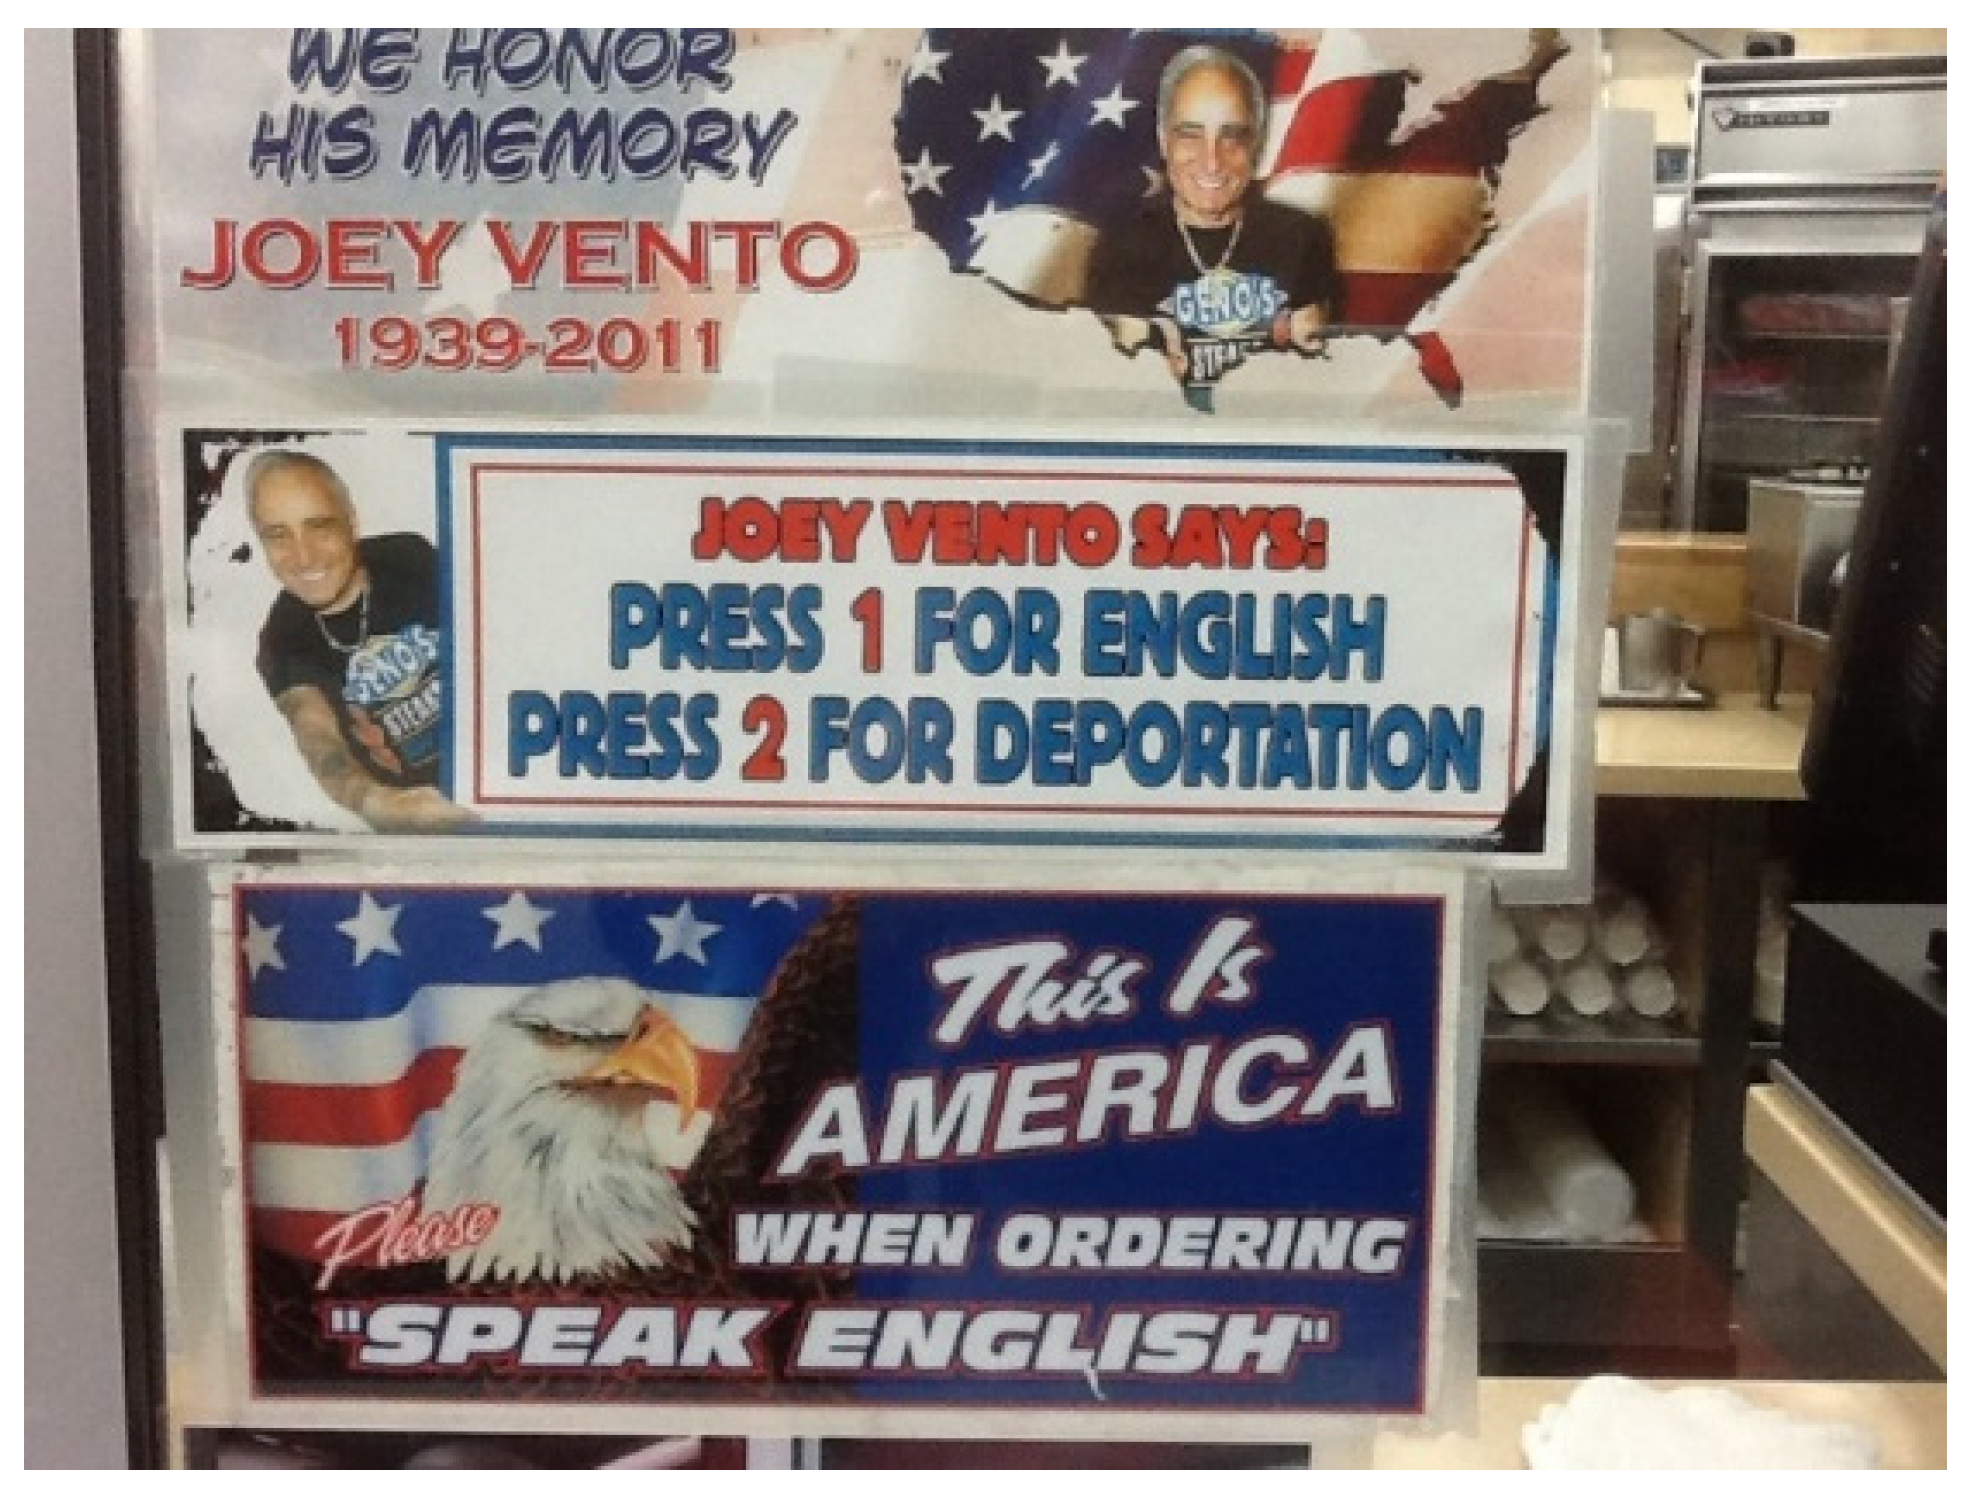
Baran 2017 for an overview of the term). These ideologies have manifested in the city’s linguistic landscape, as exemplified in
Figure 9, where a sign at a renowned cheesesteak shop in South Philadelphia encouraged patrons to use English when ordering, asserting that “this is America”, and only English must be used. The sign was posted when the Mexican community started to grow in what is known as the “Italian Market”—where this research was conducted; it was taken down in 2016. Despite these influences and ideologies, communities in Philadelphia have forged their linguistic identities through written signs in public spaces, enriching the city’s landscape while building their community through the usage of different multilingual practices.
Besides the Golden Block, Olney and South Philadelphia’s linguistic landscapes have been impacted by these new patterns of mobility. Olney, located in Upper North Philadelphia, presents a mix of cultures and languages that are visible in the LL. Along with English, signs in Spanish and bilingual signs written in English and Spanish and English and Korean are all over the place. Culturally speaking, Olney represents the highest number of the Colombian diaspora whose first substantial wave of migrants arrived in Philadelphia between the late 1970s and the mid-1980s, and “by the late 1980s, Colombiana/o/xs were the second largest foreign-born group in Philadelphia and the second largest Latina/o/x group after Puerto Ricans” (
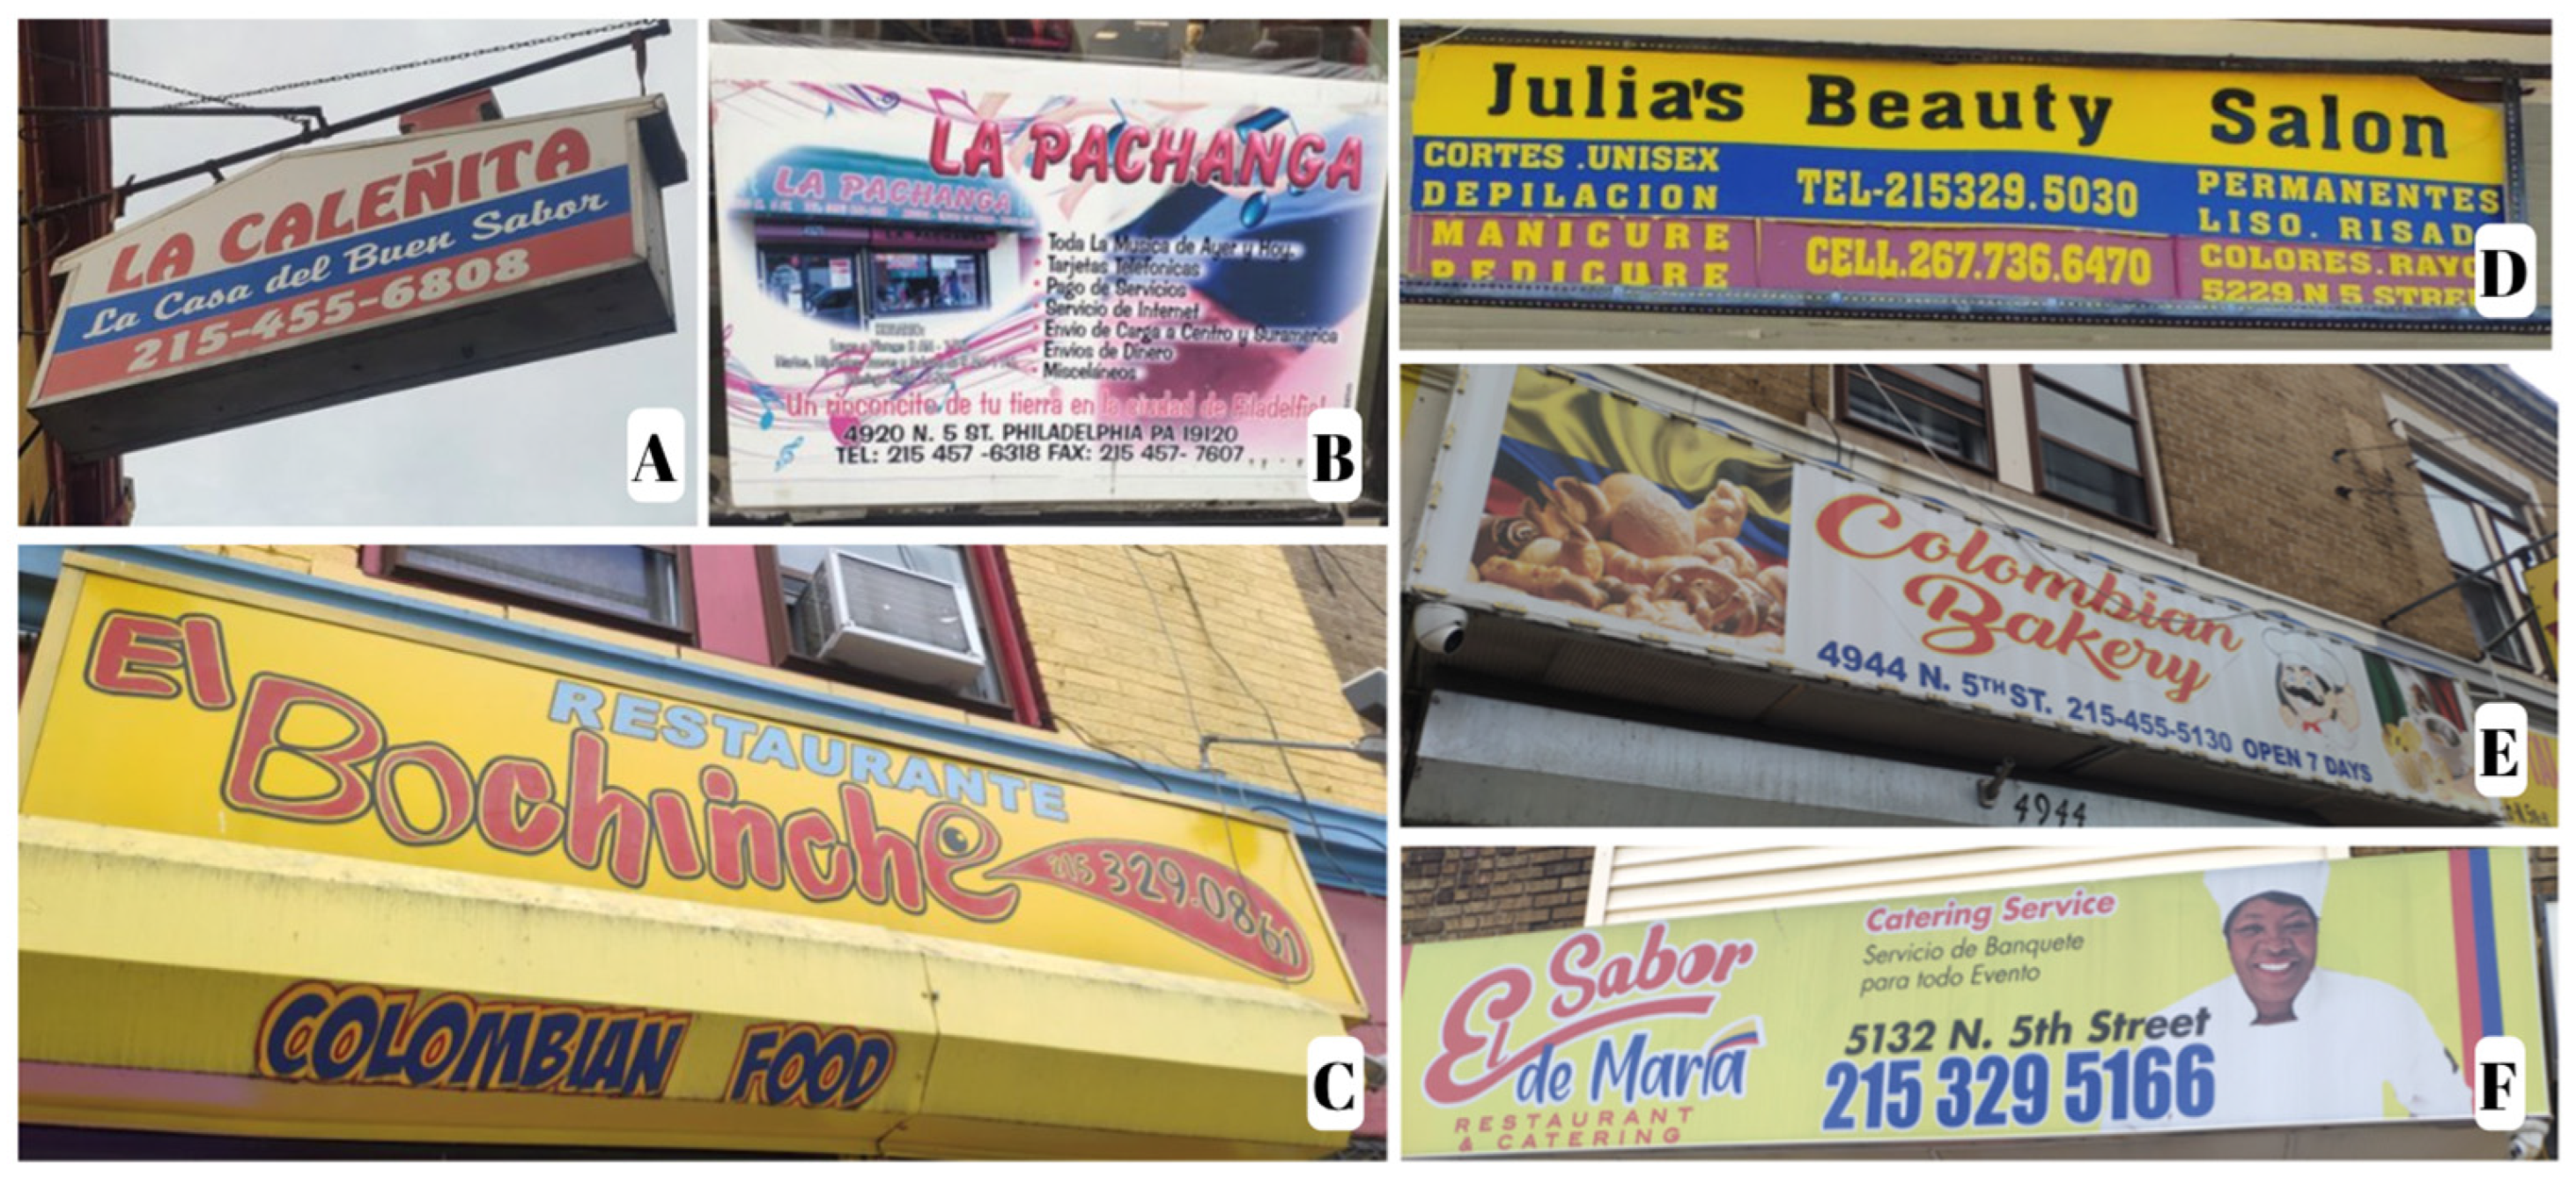
Garbow 2020, p. 370). Although demographics have changed and Colombians no longer represent the second-largest Hispanic community in the city, Olney still reflects their legacy as it is illustrated in
Figure 10.
Similarly, the LL of South Philadelphia, an area that “is thought of as the city’s Little Italy” (
Saverino 2010, p. 57) reflects a linguistic change. The data presented in
Figure 5 illustrate the increase in Spanish-language signs and the decline in monolingual English signs. Furthermore, the data show a rise in bilingual and multilingual signs. This shift can be attributed to the settlement of new communities in South Philadelphia, such as Cambodians (
Skilton-Sylvester and Chea-Young 2010) and Mexicans, whose population in Philadelphia has increased rapidly over the past two decades and is now considered “the second largest Latino immigrant group after Puerto Ricans” (
Atlas 2010, p. 178).
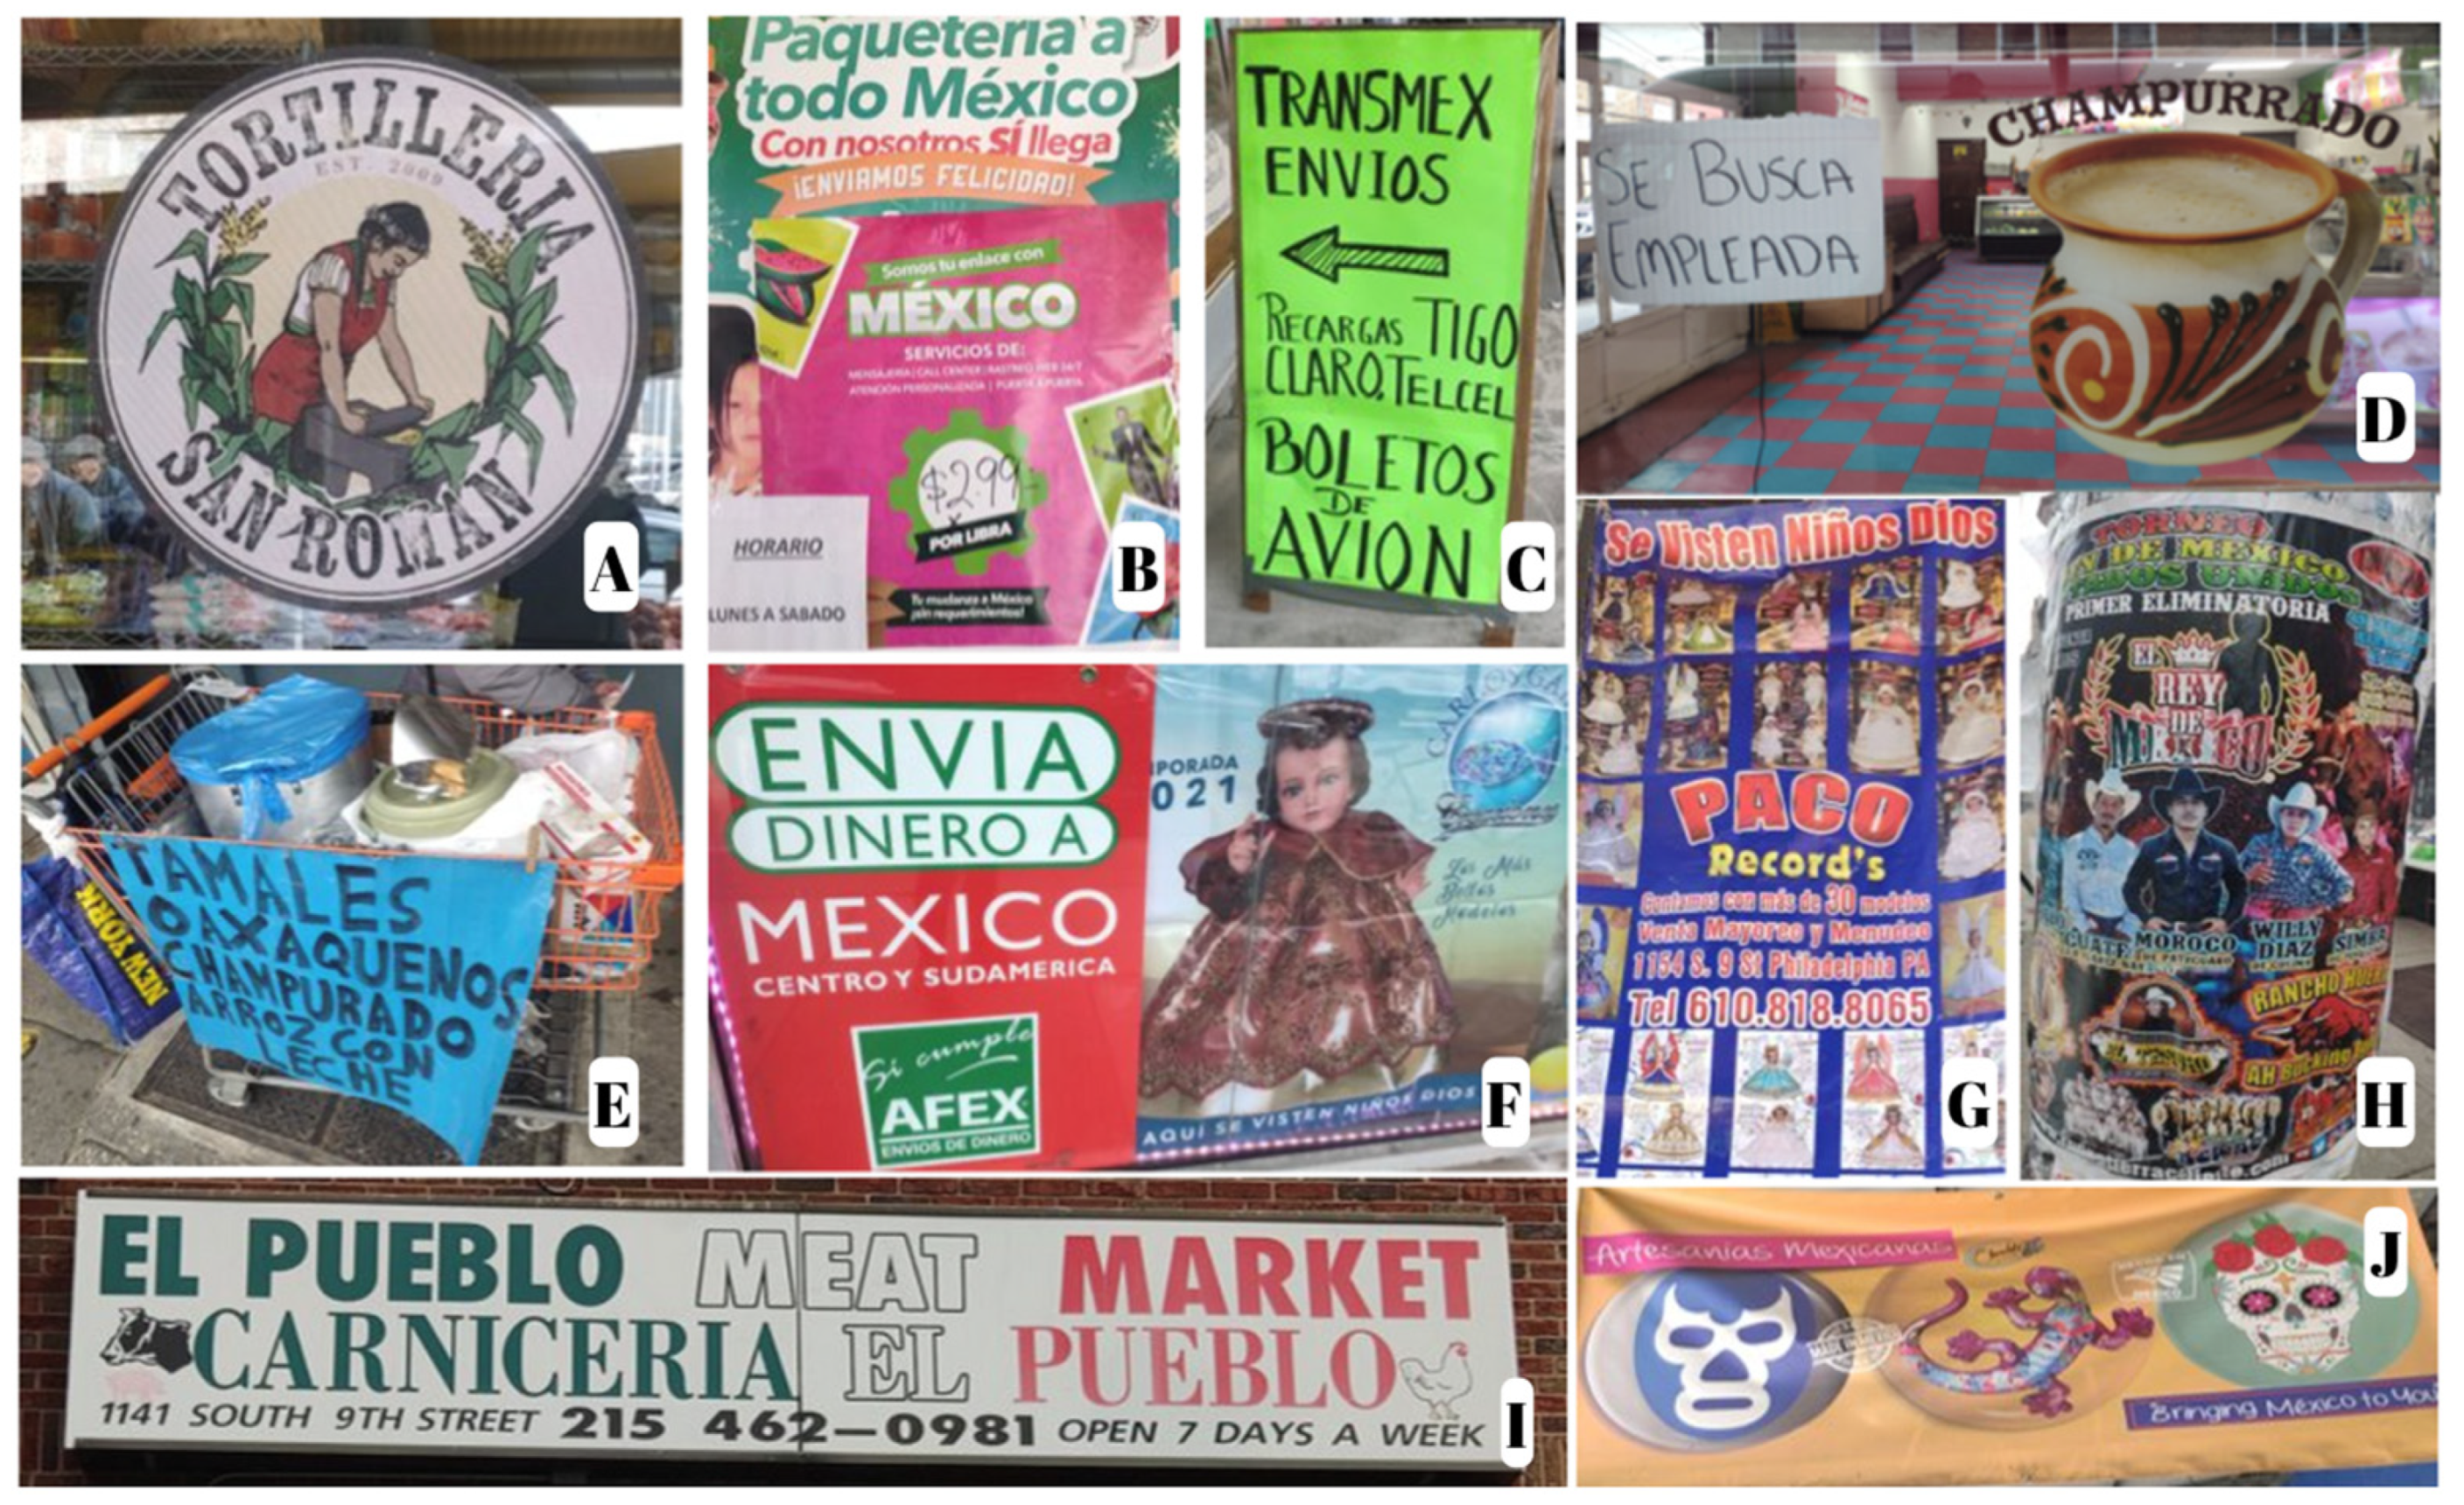
The increase in monolingual signs in Spanish, as well as Mexican-owned businesses, illustrates how South Philadelphia has experienced a “semiotic convergence of the neighborhood” (
Niedt 2020, p. 81), where Spanish replaced Italian and, as shown in
Figure 5, is slowly replacing English.
Figure 11 provides an illustrative example of these signs.
Something important to mention is the impact of COVID-19 on the LL. Besides the increase in multilingual
top-down signs informing people about the importance of proper mask wearing, more monolingual signs in Spanish appeared with the resumption of public events in late 2022 and 2023. In South Philadelphia, poles were prominently adorned with flyers promoting Latino concerts and coleo shows, akin to a rodeo (e.g., picture H in
Figure 11). Given their targeted appeal to Hispanic communities, these promotional materials were predominantly monolingually in Spanish.
Figure 10 and
Figure 11 are examples of how different communities are using public space to create a linguistic identity and symbolic construction of their community. In addition to tracking linguistic vitality, linguistic accommodation, and language behavior and change, signs serve two primary functions: informational and symbolic (
Landry and Bourhis 1997;
Spolsky 2009). Signs in public spaces serve as informational markers that communicate the symbolic power—or “the power to construct reality” (
Kramsch 2021, p. 45)—and the status of linguistic communities in a given area. According to
Spolsky (
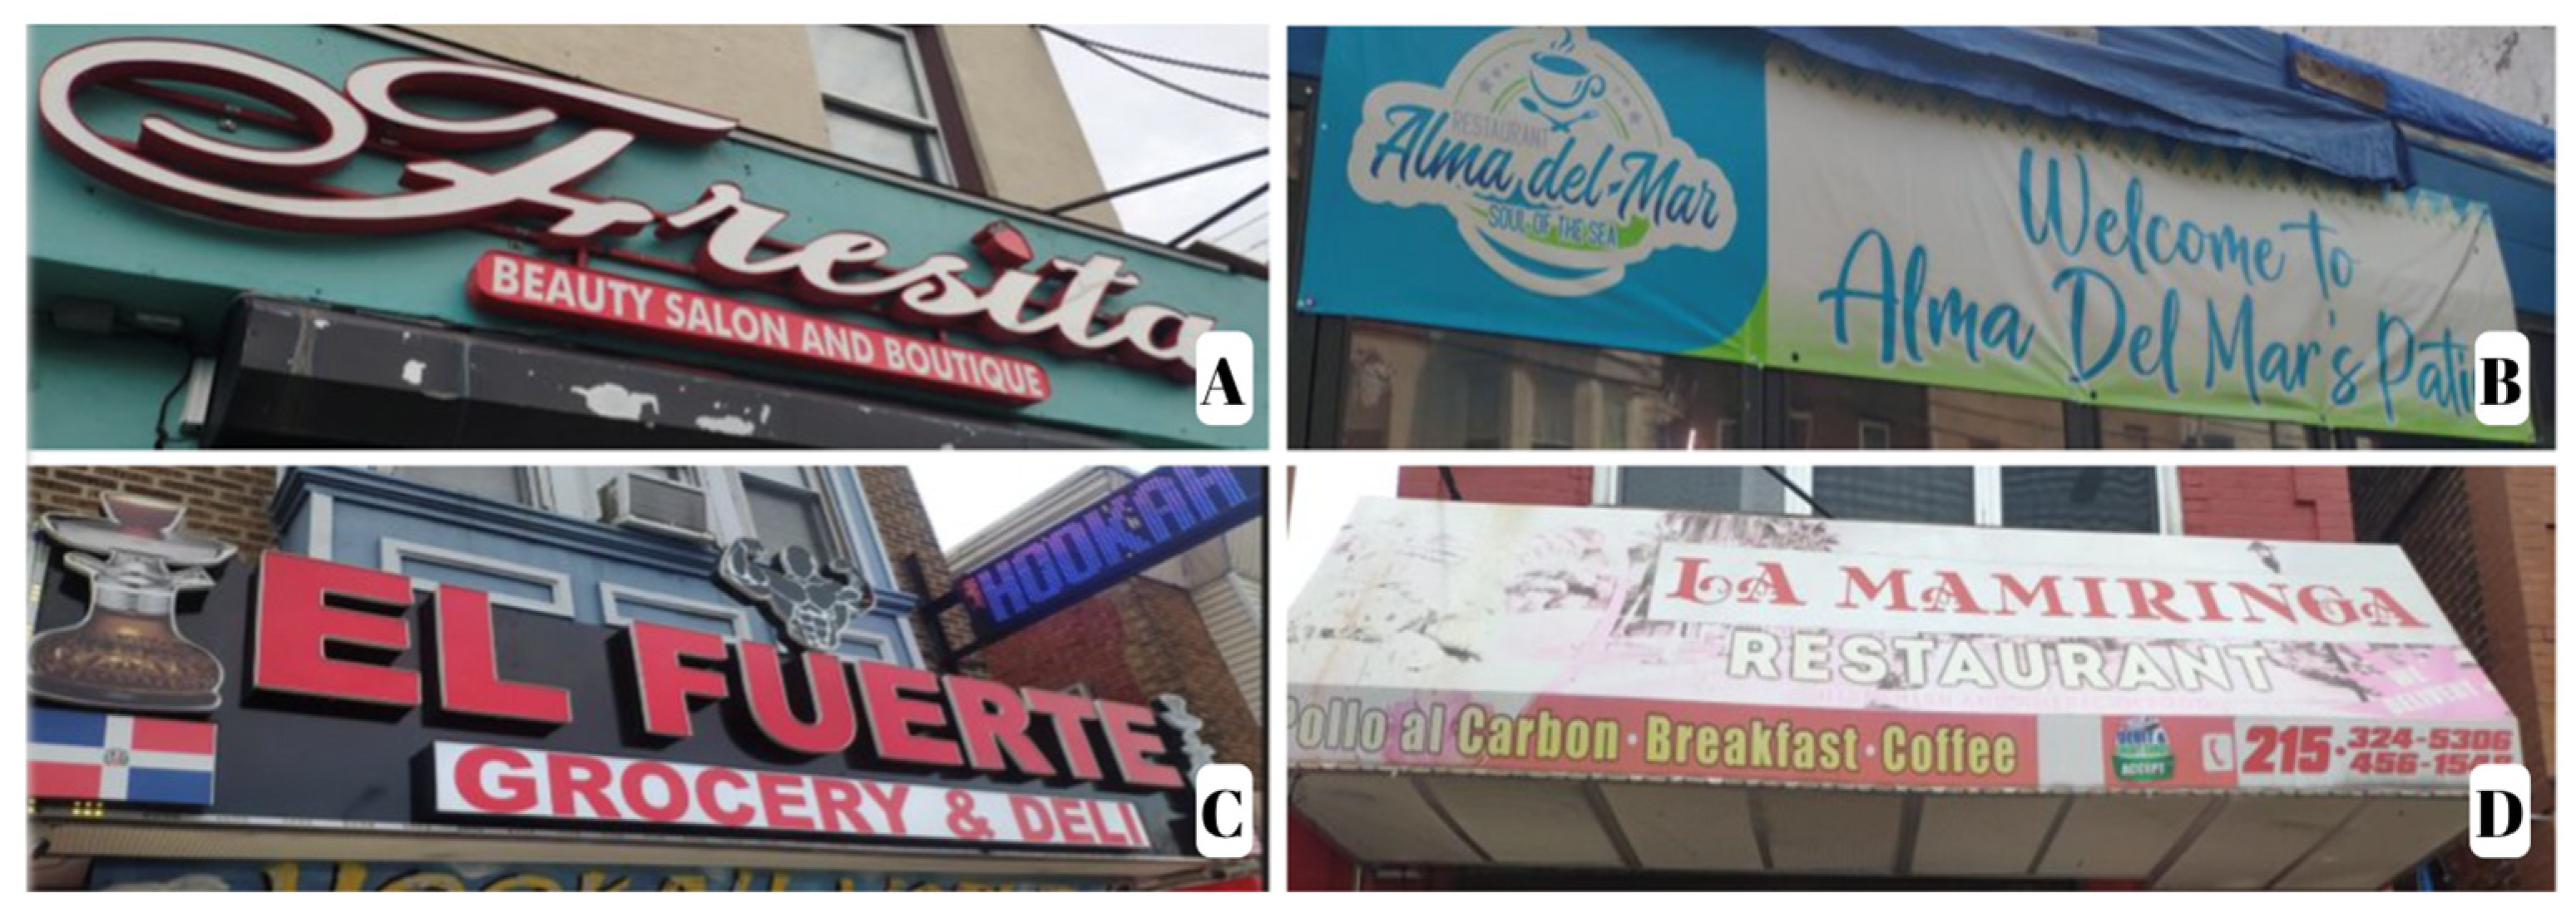
2009), informative signs communicate information through street names and traffic signs, while symbolic signs declare property and power. The symbolic function of signs represents the way in which someone, as a sign owner, wants to be perceived, either culturally, linguistically, or both. Therefore, when a new sign is created, its symbolic function plays a crucial role in representing the agency of the sign owner. Bilingual signs in Hispanic stores exemplify this dichotomy by naming stores in Spanish (symbolic representation of the Hispanic identity) while offering goods and services (information) in English, as illustrated in
Figure 12.
The Ethiopian community’s stores in Washington DC showed similar patterns, where English was primarily used for providing information while Amharic text was used to signify Ethiopian Habasha identity (
Woldemariam and Lanza 2015). This demonstrates how language serves not only as a means of communication but also as a tool for identity formation and community building. Similarly, the LL of Hispanic Philadelphia plays a crucial role in shaping its identity and sense of belonging. By examining the linguistic practices of diverse communities, we gain a deeper understanding of the complex ways in which language intersects with culture, identity, and social structures. But, as
Carr (
2021) mentions, the presence of minority languages in the informative section of signs suggests their utility in local communication. This means that the more a language is used in a sign with informative value, the stronger the community is. The use of language in everyday life is not simply a matter of communication, but also a reflection of historical, political, and cultural factors that shape the lived experiences of communities.
Previous studies regarding the Hispanic linguistic landscape of the United States have presented similar results.
Yanguas (
2009), in Washington DC, observed that signs exclusively in English persist irrespective of social or practical considerations. Conversely, bilingual signs indicate an adaptability to the immediate context of the Hispanic communities, being used in certain places such as libraries that are popular among the Latino community, reflecting a more responsive and situational approach to language. In a similar study conducted in New York City,
Hassa and Krajcik (
2016) concluded that the LL of Washington Heights mirrors power relations, social inequalities, and the prevalence of the English monolingual ideology in American cities. Moreover,
Pastor (
2021) concluded that in Oak Cliff (Dallas, TX, USA), Spanish is presented as a language of high prestige and utility for the Hispanic community, reflecting its high vitality and taking into account aspects such as local expressions and vernacular vocabulary.
Besides factors such as
time and
location, another important finding of the present research was the importance of the different establishments in determining language choice. The establishments where Spanish is likely to be found, according to the data presented in the heatmap (
Figure 7), are religious temples, pharmacies, service offices, and food trucks. These results are similar to the ones found by
Hassa and Krajcik (
2016) in New York, where Spanish is prevalent in low-cost services and ethnic food establishments, serving as a symbol of “authenticity”. Following the findings of the authors, advertisements emphasizing exclusivity and status tend to be presented in English, whereas Spanish (and other minority languages) are more commonly used in community businesses.
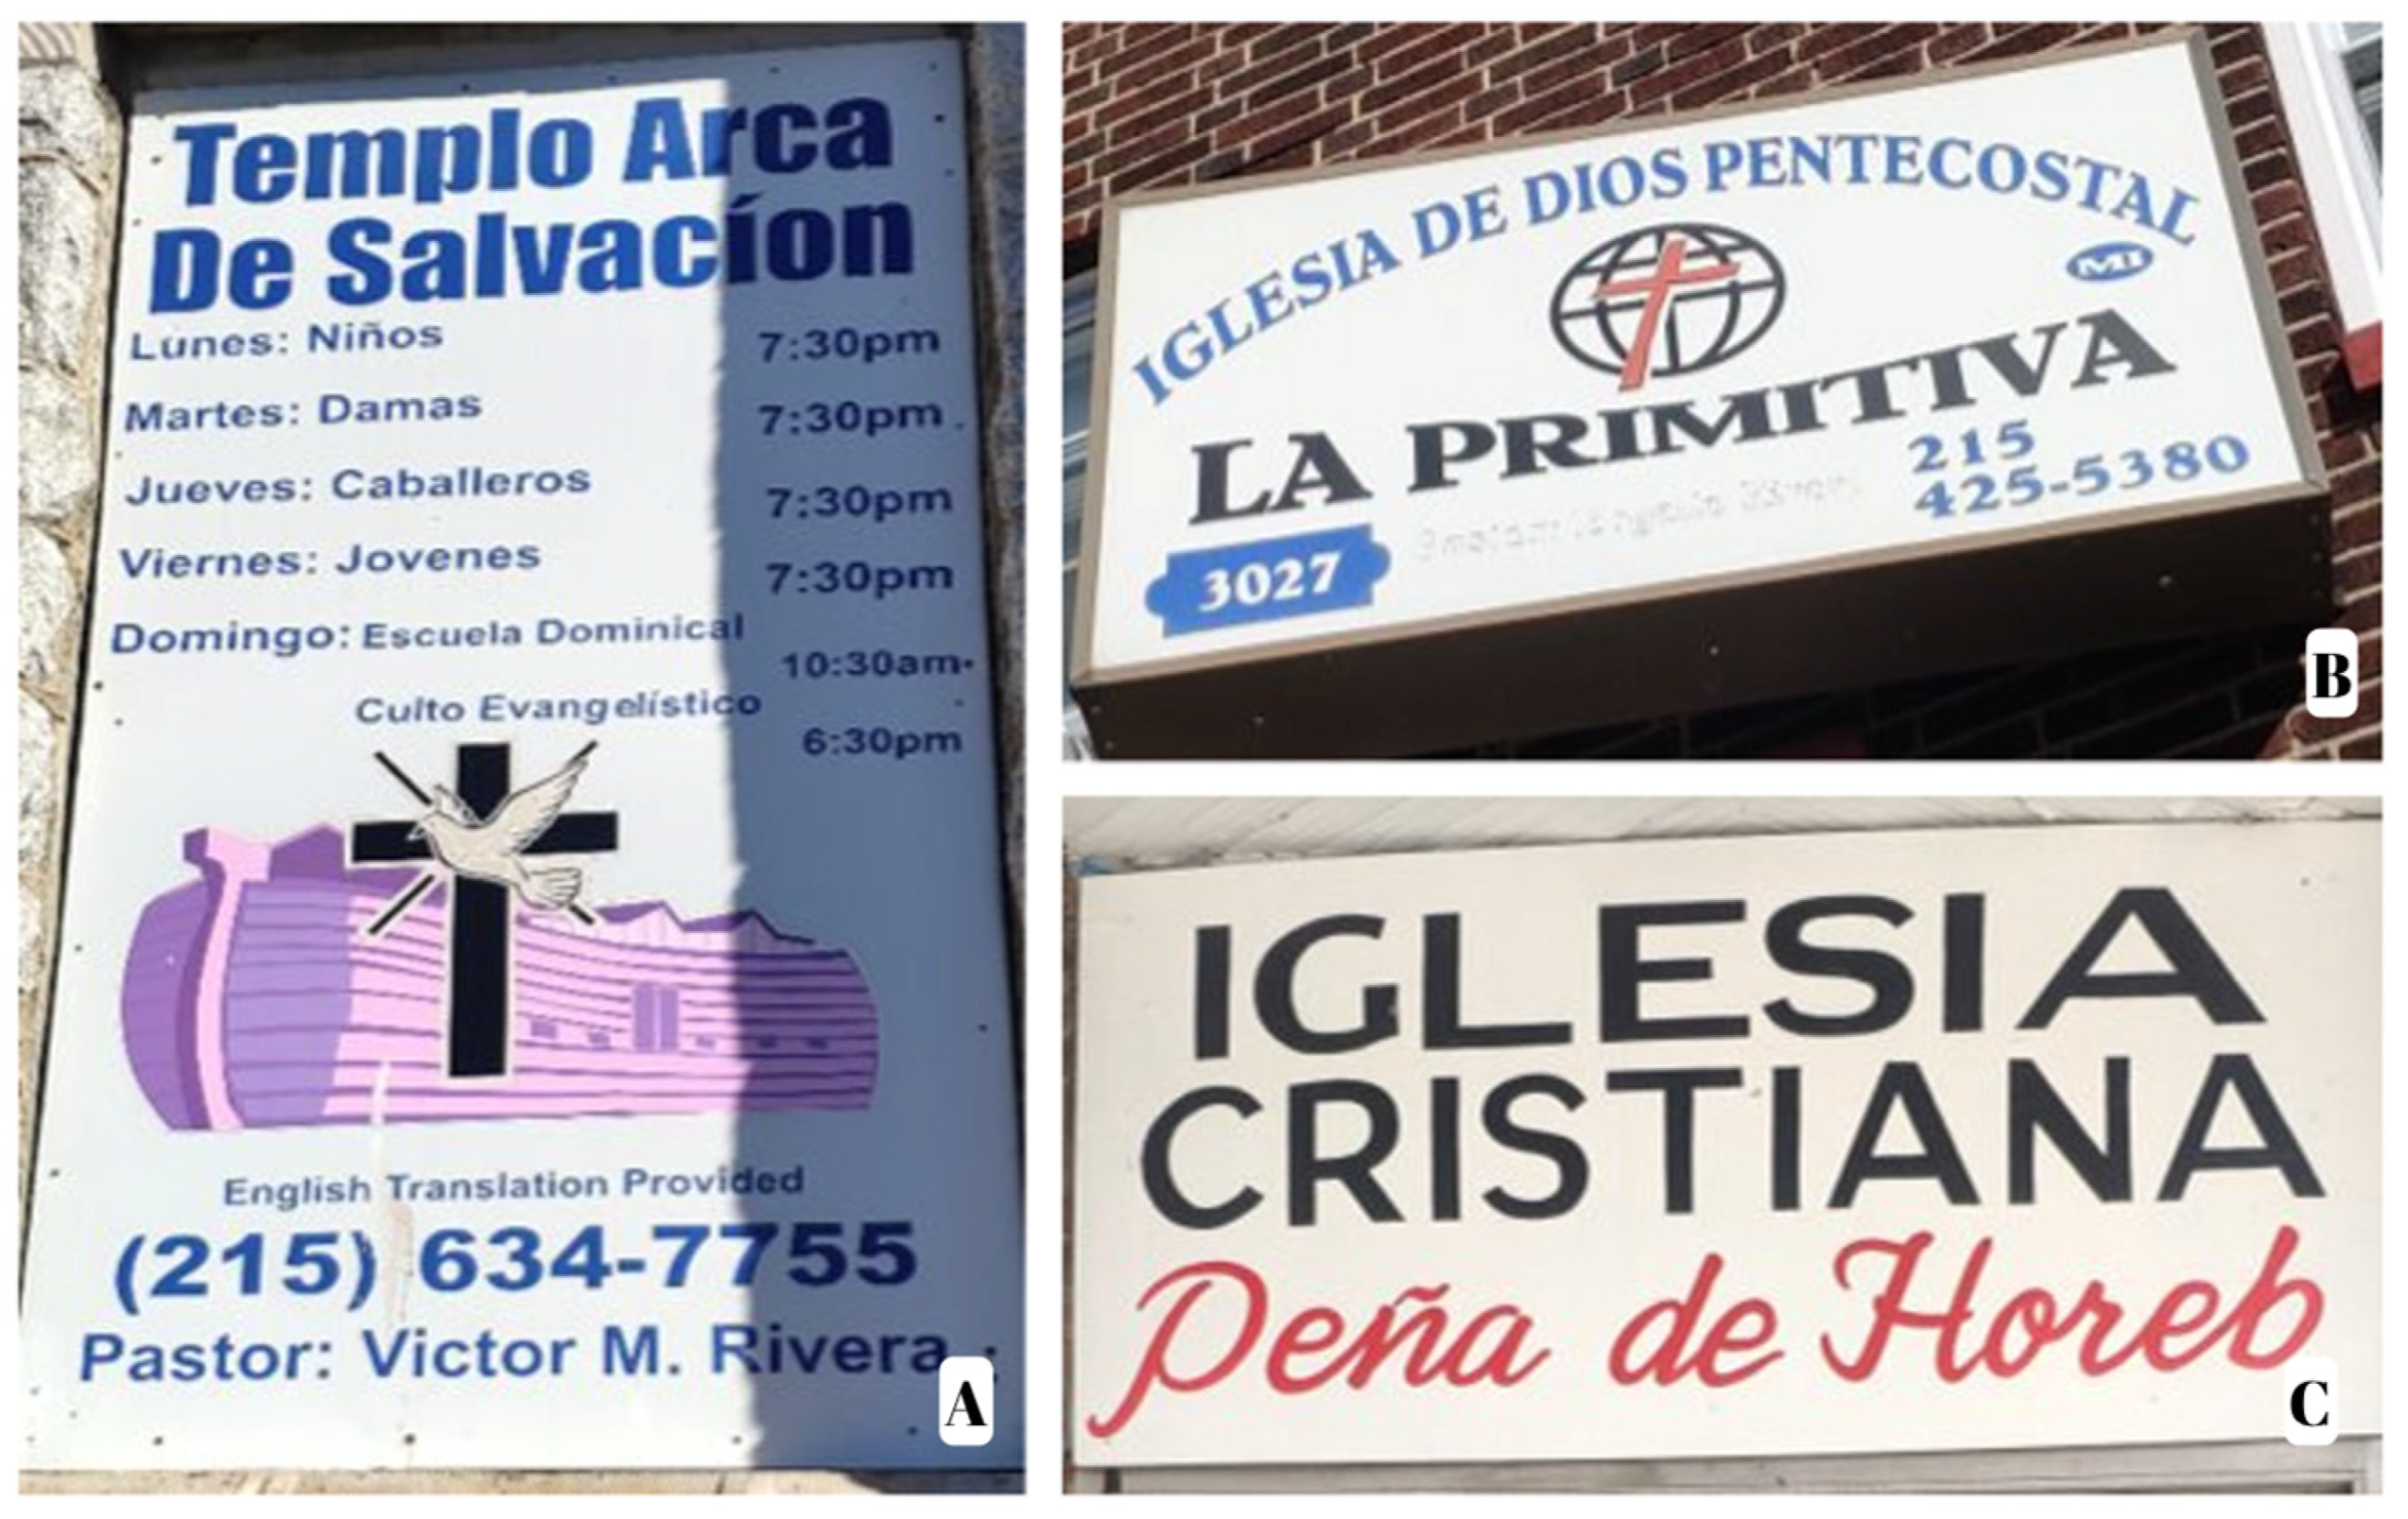
At the same time, findings from the present ethnographic fieldwork reveal the significant role of churches and religious organizations in Hispanic communities. Churches have not only been a place of worship but also of engagement for the Hispanic communities in Philadelphia. As early as the 1920s, the Chapel of Our Lady of the Miraculous Medal “La Milagrosa” played an essential role in the development of the Puerto Rican community in the city (
Aponte 1998;
Whalen 2001). Nowadays, when exploring the linguistic landscape of these communities, bilingual and monolingual signs in Spanish are more visible in churches or religious organizations, which are “significant in conditioning immigrants’ identities, patterns of interaction, and their access to jobs, housing, services, and more” (
Vertovec 2022, p. 28).
Similar findings were reported by
Blommaert (
2013), who concluded that although the presence of churches may not drastically change the appearance of a neighborhood, it does have a profound impact on “the neighborhood’s functions and sociolinguistic landscape” (97). Religious organizations in Hispanic areas still provide services for new immigrants and function as spaces for community engagement, as can be observed in
Figure 13.
This highlights the important role that religious organizations play in the lives of Hispanic communities, serving not only as places of worship but also as key community hubs. The linguistic landscape of the Hispanic communities of Philadelphia, thus, provides an insightful glimpse into how language shapes the lived experiences of individuals and communities and the importance of considering these factors when examining the socio-cultural dynamics of a given area.
5. Conclusions and Limitations
This study explored the linguistic landscape of three Hispanic areas of Philadelphia, PA. Its main objectives were to measure the presence of Spanish in public spaces and to investigate the impact of time, location, and type of establishment on language use. Specifically, this research studied how language choice varied from 2021 to 2023 and identified how different locations as well as different establishments affect language use in the linguistic landscape in the Hispanic neighborhoods in Philadelphia, including the Golden Block in North Philadelphia, Olney in Upper North Philadelphia, and the Italian Market corridor in South Philadelphia. The results of the research shed light on the linguistic vitality of Spanish in the United States and provide valuable insights into the dynamics of Hispanic communities of the city by documenting the distribution of languages used in the public space.
The study collected a total of 3437 signs from the designated
locations in the city, 1125 tokens collected in 2021, 1073 in 2022, and 1239 in 2023, as shown in
Table 1. In order to enhance the efficiency of the analysis and maintain precision (by minimizing degrees of freedom), adjustments were applied to the
language variable. More specifically, the chi-squared test was conducted exclusively on tokens that included signs written in English, Spanish, a combination of both (bilingual), or multilingual content. Within this specified subset, the total count of tokens amounted to 3356 instances. The omitted signs primarily included various languages such as Italian, Korean, Vietnamese, and Mandarin, as well as bilingual signs in English and other languages. Due to their infrequent occurrence, they were not included in the analysis as they would not yield statistically significant results.
The use of contingency tables and chi-squared tests allowed for a robust analysis of the impact of time and location on language use. To analyze the use of languages in different establishments, variables were combined into clusters in a heatmap. In general, this research aimed to provide a comprehensive understanding of the linguistic landscape of Hispanic Philadelphia and to bring important implications for the study of language use in urban contexts as well as for the status of Spanish in the United States.
Regarding language use, it was observed that English is the predominant language, being displayed in 61.65% of the linguistic landscape, while Spanish is second, being displayed in 24.16% of the LL. Regarding time, the chi-squared test (χ2 (6, n = 3356) = 63.911, p < 0.001, φ = 0.098) conducted in this study confirms that it impacts language use in the LL. Bilingual signs were statistically significant in 2022 and 2023, and monolingual Spanish signs were more prevalent than expected in 2023. This suggests that over time, bilingual and monolingual Spanish signs are increasing, while monolingual English signs are decreasing. This fluctuation in monolingual English signs suggests a potential adaptive response to changing sociocultural dynamics. Despite English being the most prevalent language in the linguistic landscape of Hispanic Philadelphia, its usage lacks stability, and it does not exhibit a continuous growth or decline in these three locations. Conversely, the rise of monolingual signs in Spanish suggests a reinforcement of cultural identity or demographic transformations within the Hispanic community, potentially reflective of a community’s concerted effort to assert its linguistic and cultural distinctiveness.
The growth of bilingual signs, on the other hand, suggests a sustained bilingual communication trend within the Hispanic neighborhoods, bringing implications for inclusivity and linguistic diversity, while showcasing a community that embraces bilingualism in its public spaces, as a manifestation of its language as symbolic power. Similarly, multilingualism in the LL raises questions about the evolving nature of multilingual communication within the community. This increase may signify a greater recognition and representation of linguistic diversity, fostering a multilingual ethos in public spaces and a sense of linguistic welcoming to new immigrant communities, in addition to Latinos, in Hispanic areas.
As language is a powerful tool for shaping people’s perceptions of themselves and the world (
Kramsch 2021), analyzing the LL can provide insight into the superdiversity of a complex contemporary society that is constantly fluctuating and accommodating. Following
Matras (
2024), language is “a dynamic, emerging pattern of practices” (336), so when analyzing the written language of a community in the public space, the linguistic landscape serves as an indicator of a city’s dialect continuum, demonstrating the vitality and coexistence of different languages within a given territory.
This study also highlights the significant role of location in shaping the linguistic landscape and reflecting the emergence of superdiverse neighborhoods, where multiple languages and cultures coexist. The linguistic shifts and changes in the linguistic landscape reflect the dynamism and complexity of urban spaces, where language is both a tool for communication and a means of expressing identity and belonging. The results of the chi-squared test (χ2 (6, n = 3356) = 109.454, p < 0.001, φ = 0.128) indicate that location significantly impacts language use in the linguistic landscape of Philadelphia.
The Golden Block, widely recognized as the primary Hispanic neighborhood in the city, shows a prevalence of bilingual signs. This is likely due to the area being settled by Latino immigrants who have now moved on to other neighborhoods, resulting in English becoming the predominant language for second- and third-generation Spanish-speaking communities (
Escobar and Potowski 2015;
Otheguy 2019). While this area remains important in terms of sociocultural aspects, it does not necessarily represent the linguistic vitality of Hispanic communities. Spanish is a mobile language in the city, as Hispanic communities move and bring along their cultures and linguistic variations.
In Olney, a neighborhood renowned for its diverse culinary offerings, particularly Colombian-owned goods, signs tend to mix English with other languages such as Spanish and Korean. In contrast, in South Philadelphia’s Italian Market area, where the Mexican community has been established since the 1990s, signs in Spanish are more common. This area shows a prevalence of bilingual signs mixing English with other languages such as Vietnamese, and multilingual signs featuring English, Spanish, Mandarin, Vietnamese, and Khmer. These findings suggest that language use in the linguistic landscape of Philadelphia is heavily influenced by the cultural and linguistic diversity of the communities residing in specific locations within the city.
By identifying the specific locations where certain languages are more prevalent, policymakers and community leaders can better understand the linguistic diversity of the city and develop strategies to support and celebrate this diversity. Understanding the impact of location on the linguistic landscape of Philadelphia is crucial for fostering an inclusive and respectful city that values and honors the linguistic and cultural diversity of its communities.
Finally, it is important to note some limitations of this study. Firstly, while this study focused on the language use of the Hispanic community in Philadelphia, there are other areas in the city where different communities have recently settled, such as North-east Philadelphia along Castor Avenue. A future study could focus on language use in other Hispanic communities in the city, expanding the scope of this research.
Additionally, there are other variables and criteria for sign analysis that should be considered when studying linguistic landscapes, which were not included in this study. For example, factors such as signs’ size, authorship, mobile versus static signs, and sign materiality can all impact
language use in public spaces (
Amos and Soukup 2020;
Franco Rodríguez 2018;
Carr 2021). Furthermore, the visible salience and visual hierarchy of signs are criteria for analyzing
language choice in signs (
Carr 2021). While this study focused solely on language function as a criterion of analysis and examined only three variables (
time,
location, and
establishment) that were found to impact
language use in Hispanic Philadelphia’s linguistic landscape, future studies could consider these additional factors.
Another limitation of this study is that it only counted
bottom-up signs, meaning signs created by individuals and businesses rather than official signs put up by the city. According to
Kramsch (
2021, p. 52), an individual’s symbolic authority is essentially borrowed from institutions and often operates behind the scenes, despite the individual (in this case the Hispanic community) appearing to possess it independently. This means that, despite the significant number of Spanish-monolingual and multilingual signs, it is important to remember this limitation, since
bottom-up signs might give us an idea of local communities, but not of the current status of the city’s linguistic policies. While this made sense for the focus of this study, an exploration of
top-down signs in the city (such as street names and official signs in parks, hospitals, and other state buildings) could provide further insights into multilingualism, language planning, and linguistic policies in Philadelphia.
Despite these limitations, the study highlights the increasing presence of Spanish and other minority languages in the city’s LL, reflecting the growing diversity of the population and the impact of migration patterns over time. The findings of this research also have practical implications for policymakers and educators, highlighting the need to recognize the value of multilingualism and to support the revitalization of minority languages. In conclusion, this study demonstrates the richness and diversity of language use in urban spaces and the complex interplay of linguistic, cultural, and social factors that shape the linguistic landscape. As cities continue to grow and change, it is essential to continue exploring and documenting the LL to better understand the dynamics of language use and its relationship with identity, culture, and power in urban spaces.


