Article

(Heritage) Russian Case Marking: Variation and Paths of Change

Department of Linguistics, University of Toronto, Toronto, ON M5S 3G3, Canada
*
Author to whom correspondence should be addressed.
Languages 2024, 9(3), 100; https://doi.org/10.3390/languages9030100
Submission received: 26 October 2023 / Revised: 1 March 2024 / Accepted: 2 March 2024 / Published: 18 March 2024
(This article belongs to the Special Issue Heritage Russian Bilingualism across the Lifespan)

Abstract

:
Russian’s six cases and multiple noun classes make case marking potentially challenging ground for heritage speakers. Indeed, morphological levelling, “probably the best-described feature of language loss”, has been substantiated. One study from 2006 showed that Heritage Russian speakers in the USA produced canonical or prescribed markers for only 13% of preposition+nominal sequences. Conversely, another study from 2020 found that Heritage Russian speakers in Toronto produce a 94% canonical case marker rate in conversational speech. To explore the effects of methodological differences across several studies, the current paper circumscribes the context to preposition+nominal sequences in Heritage Russian speech from the same Toronto corpus as used by the 2020 study but mirroring the domain investigated by Polinsky and including a Homeland comparison to consider changes in both the rates of use of canonical case marking and distributional patterns of non-canonical use. Regression models show more canonical case marking in more frequent words, an independent effect of slightly more mismatch by later generations, but less morphological levelling than reported by Polinsky. Lexicon size does not predict case marking rates as strongly as language usage patterns do, but generation, since immigration, is the best-fitting social predictor. We confirm (small) rate changes in Heritage (vs. Homeland) Russian canonical case marking but not in patterns of levelling.

1. Introduction

Heritage speakers of a language are defined as those “who acquired a L1 grammar (to some degree of success) of a language that is not the socially dominant language in a given geographical area” (Putnam and Sanchez 2013, p. 478). Though these speakers are often classified as having not acquired their heritage language (HL) completely (Laskowski 2009; Montrul 2008), heritage speakers of a language can provide a greater understanding of the mechanisms underlying sociolinguistic variation through expanding our research context beyond the monolingual setting. For instance, studies incorporating heritage speakers can provide insight into how an ongoing change in a language can continue through generations after speakers leave the country in which the language is primarily spoken, as well as how language contact affects particular aspects of a language (cf. Cristiano 2022; Nagy and Celata 2022; Umbal 2023; Umbal and Nagy 2021).
This paper uses data from the Heritage Language Variation and Change project (HLVC; Nagy 2009, 2011, 2024), which has the goal of expanding variationist sociolinguistics outside of the monolingual field of study. The current study contributes to the HLVC project by adopting its goal of expanding the understanding of variation in a multilingual context, as well as by treating Heritage Russian as its own variety of Russian (following Polinsky 2006) and comparing a heritage variety of Russian directly to a homeland variety. We consider what this synchronic comparison can tell us about the path of (potential) change in the case-marking system of Heritage Russian. For this purpose, we compare the performance of four groups of speakers, as defined in (1).
(1)Generation categories in the HLVC project and HerLD corpus.
Homeland: born and reside in the homeland (for this study, Moscow, Russia)
Generation 1 (Gen1): born in Moscow or St. Petersburg, moved to Toronto after age 18, and have been residing in Toronto for at least 20 years.
Generation 2 (Gen2): born in Toronto or arrived from Moscow or St. Petersburg before age 6 to parents or guardians who qualify as Generation 1 speakers.
Generation 3 (Gen3): born in Toronto to parents or guardians who qualify as Generation 2 speakers.

1.1. Russian Case Marking and Levelling

In Russian’s complex morphological marking system, all nouns and pronouns (as well as some other parts of speech not considered here) require case marking. There are six cases and multiple noun classes. Nouns are sometimes categorized into four main classes (cf. Corbett 1982) but sometimes as many as 82 (Parker and Sims 2020, based on data in Zaliznjak 1977). This more detailed classification differentiates groups of nouns according to affix forms, stem changes, stress patterns, and defectiveness (forms missing from the paradigm). In Russian, different cases are homophonous in different noun classes1 and speakers must develop an awareness of the patterns for each class as well as for pronouns. This complexity makes case marking potentially challenging ground for Heritage Russian speakers. Indeed, case marking has been pointed to as an area of vulnerability for heritage speakers. For example, case mismatches were among the most common types of errors found in the English-to-Russian translation task examined by Isurin and Ivanova-Sullivan (2008).
Indeed, morphological levelling, “probably the best-described feature of language loss”, has been substantiated among heritage speakers. In a study comparing American Russian to Full (or Homeland) Russian, Polinsky (2006, p. 250) showed that Heritage Russian speakers living in the USA produced prescribed or canonical2 case markers for only 13% of prepositional nominals in a short narrative task. She refers to these speakers as Reduced Russian or American Russian speakers. For Polinsky’s study, American Russian speakers were defined as those who moved from Russia to the USA before age 12. They were adults in their twenties and thirties at the time of data collection (Polinsky 2006, p. 207). Participants who scored higher than 90% on a vocabulary test were excluded as “too fluent”.
The prepositional nominal context examined by Polinsky (2006) and in the present paper is defined as nouns or pronouns which are the object of a preposition and which prescriptively require accusative, dative, genitive, instrumental, or locative case marking. Examples of each, from the HLVC corpus, are given in (2)–(6). For GEN (4a,b) and LOC (6a,b), pairs of examples are given in the following: similar sentences, one with a match and one with a mismatch. The speaker code and timestamp for each example are provided. Speaker codes are explained at https://ngn.artsci.utoronto.ca/HLVC/1_4_corpus.php (accessed on 1 March 2024).
(2)Accusative prescribed and produced
cherezcerkov’,cherezraznyekul’turnyeorganizaciimozhetbyt’
чepeзцepкoвь,чepeзpaзныeкyльтypныeopгaнизaциимoжeтбыть
throughchurch.ACCthroughvarious.ACC.PLcultural.ACC.PLorganization.ACC.PLmaybe.INF
‘through the church, through various cultural organizations maybe’ (R3M56A; 12:18)
(3)Dative prescribed and produced
lezlimypojetojtrube
лeзлимыпoэтoйтpyбe
climb.PST.3PL3PL.NOMupthis.DATpipe.DAT
‘We climbed up this pipe’ (R1M80B; 12:12)
(4a)Genitive prescribed and produced
sostornymamy,otec,mamarusskaja,izGatchiny
cocтopoнымaмы,oтeц,мaмapyccкaя,изГaтчины
onside.GENmother.GENfather.NOMmother.NOMRussian.FEMfromGatchina.GEN
‘On my mother’s side, my father, my mother is Russian, from Gatchina’ (R3M56A; 12:13)
(4b)Genitive prescribed but ACC/NOM produced
Oniskazhemizvostochnyeevropejskijrajon
oниcкaжeмиз вocтoчныйeвpoпeйcкийpaйoн
3PLsay.3PL.FUTfromEastern.ACC/NOMEuropean.ACC/NOMarea.ACC/NOM
‘… let’s say they are from an eastern European area’; (R3F25A, 14:46)
(5)Instrumental prescribed and produced
cherezdvadcat’schem-toletimprishlos’tozhe
чepeздвaдцaтьcчeм-тoлeтимпpишлocьтoжe
aftertwenty.ACCwithsomething.INSTRyear.PL.ACC3PL.DAThave.to.IMPERFtoo
‘after twenty something years they had to too’ (R3M56A; 12:12)
(6a)Locative prescribed and produced
chtozavernulimy,myvlagerenashlisuxielist’ja
чтoзaвepнyлимы,мывлaгepeнaшлиcyxиeлиcтья
whatwrap.PST.3PL3PL.NOM3PL.NOMincamp.LOCfind.PST.3PLdryleaf.PL
‘What did they wrap? We, we found dry leaves in the camp’ (R1M80B; 12:14)
(6b)Locative prescribed but ACC produced
ja naxozhus’ vstranu kotoryj
я нaxoжycьв cтpaнyкoтopый
1SGlocate.1SG.PRESincountry.ACCwhich.MASC

1.2. Previous Studies of Russian Case Marking

In contrast to Polinsky’s American Russian speakers, the Toronto second- and third-generation Heritage Russian speakers examined by Łyskawa and Nagy (2020) displayed 94% use of canonical case markers in conversational speech but in a study of a wider range of contexts. A total of 98% was the corresponding rate for their first-generation (immigrant) speakers. Isurin and Ivanova-Sullivan (2008) found a similarly high match rate for seven adult speakers who moved to the USA. before age ten or who were born in the USA into a Russian-speaking household: these speakers produced the prescribed case 97.6% of the time. This is higher than the rate they measured for L2 learners but lower than monolingual speakers of Russian. Nagy (2015) outlines several possible accounts for stark differences between outcomes of the variationist sociolinguistic analyses she reported and experimental elicitation tasks examining the same aspects of language, such as how a heritage speaker of a language is defined and differing data collection and analysis methods. Nagy (2015) was not able to pinpoint which difference(s) best account for the different outcomes—that is one goal of this paper.
As illustrated in Table 1, studies of Heritage Russian case marking differ in the populations studied, the sampling methods, and the methods used for elicitation and analysis. For the 16 speakers studied by Polinsky, Russian was their first language, but English became their primary (preferred) language after immigrating to the USA at a young age (from 3 to 11 years old) (Polinsky 2006, pp. 195, 204). In contrast, in the Łyskawa and Nagy (2020) study, the speakers either moved to Toronto after the age of 18 or grew up in Toronto and no selection criteria required either a lower or upper bound on how well or how often they spoke Russian nor which language they preferred. As part of the recruitment process, however, speakers agreed that they were comfortable speaking in Russian for about an hour. This willingness to participate implies a lower bound on proficiency.
Speakers in both the Polinsky (2006) and the Łyskawa and Nagy (2020) studies grew up with parents and/or grandparents who spoke Russian. Toronto is a city in which English is (just barely, at 56%) the majority language spoken at home (Statistics Canada 2017). The location of the American Russians in Polinsky’s study is not specified, but English likely plays a larger role in their communities.
The methods of elicitation differed between the studies. Polinsky (2006) asked speakers to retell the plot of a book or movie and also recorded conversations between Russian speakers without the presence of the investigator. The HLVC speakers examined in Łyskawa and Nagy (2020) were interviewed, for about an hour, about their life experiences by a fellow Heritage Russian speaker.
We also consider two other existing studies of Heritage Russian. In the Isurin and Ivanova-Sullivan (2008) study, heritage speakers were compared to monolingual Russian speakers, as well as advanced learners of Russian in a task eliciting unrehearsed narrations of a children’s picture book. These speakers either moved from the former USSR to the USA before the age of 10 or were born to Russian-speaking parents in the USA. Kagan (2005), the earliest of the studies, used a written translation task to assess university students whose immigration history would classify them as Gen2 speakers. Table 1 summarizes key differences in four studies of Heritage Russian case.

1.3. The Goals of This Paper

This paper improves comparability across studies to better understand how case marking changes diachronically (from one generation of speakers to the next) and how methodological differences impact outcomes. First, for better comparability, we circumscribe the context more tightly than Łyskawa and Nagy (2020) and Isurin and Ivanova-Sullivan (2008), focussing on prepositional nominals in Heritage Russian speech, thus mirroring the domain of investigation reported in Polinsky (2006). This allows us to draw more robust conclusions from direct comparison of both rates and distributional patterns of mismatch (replacement by a non-canonical choice of case marking) in order to better understand the path of change in the case-marking system of Heritage Russian.
Second, we compare the rate of canonical case use of Heritage Russian speakers to Homeland Russian speakers using conversational data from the Russian National Corpus (2003) to offer another level of comparison necessary for describing the path of evolution of the case system. This comparison between homeland and heritage speakers allows us to trace differences in the variation patterns in monolingual and multilingual speakers. From what is described about the rate of use and comfort in using Russian for Polinsky’s American Russian speakers, the Toronto heritage speakers sit between them and homeland speakers. We predict a system of case markings that are intermediary between homeland norms (Polinksy’s assumed Full Russian patterns and our observations from the Russian National Corpus) and American or Reduced Russian norms both in terms of the rate of use of canonical forms and the patterns of replacement by other forms.
Following Łyskawa and Nagy (2020), the majority form for each context (as defined by the linguistic factors introduced in Section 2.3) is empirically determined and defined as the canonical form for that context. In our data, the majority form always conforms to prescriptions in Gruszczyński’s (2002) reference grammar, as well as the intuitions of the native-speaker university students who coded the data.
Third, this paper adds the role of lexical frequency to other factors, aiming to disentangle whether differences in morphological marking are tied to the heritage speakers’ lexicon size. It is widely agreed that heritage speakers generally have smaller vocabularies (within their heritage language) than monolinguals (cf. Montrul and Mason 2020). As speakers with smaller vocabularies are expected to rely more heavily on more common words, the related effects of the lexicon size of the participants and the lexical frequency of the tokens they produce are examined.

1.4. Background on Russian Case

As noted, in Homeland Russian, all nouns and pronouns (as well as some other categories not examined here) receive a case marking, indicating their role in the sentence. Polinsky (1996, p. 42) proposes a direction of evolution, specifically simplification leading to the loss of the case-marking system for Reduced Russian, illustrated in (7) for noun phrases which are arguments to verbs and (8) for noun phrases which are adjuncts. This is based on her American Russian speaker data. Those speakers commonly replaced the prescribed case marking with the nominative form of a noun. If that observation is indicative of an ongoing change in the case-marking system, it suggests that, in this study, we should expect to see more forms replaced with the nominative form in speech from later generations since immigration. Looking at her claims in more detail in (7) and (8), we predict the replacement of ACC by DAT in verb arguments, along with the replacement of ACC arguments and all non-arguments by NOM. While we have not coded our data for argument vs. non-argument status, the trends can be expected to emerge as they are similar in the two contexts.
(7)Argument case shift:
Dative > Accusative > Nominative
(8)Adjunct case shift:
{Dative, Accusative, Genitive, Instrumental, Locative} > Nominative
This pattern is reflected in the scale of case retention (Polinsky 1995, 1996; and discussed in Łyskawa and Nagy 2020) in (9), which suggests that, for a given speaker or speaker group, case knowledge is most accurately displayed for nominatives and least accurately for datives (where “accuracy” means selection of the prescribed case marker used in homeland speech). The scale in (9) also introduces the abbreviations for the cases that will be discussed.
(9)(intact) NOM > ACC > GEN > INS > LOC > DAT (virtually gone)
nominative > accusative > genitive > instrumental > locative > dative
Isurin and Ivanova-Sullivan (2008) note the use of ACC as a replacement for INS as a common mismatch for nouns and that DAT replaces INS on personal pronouns. They also report the substitution of DAT for ACC. They additionally report the use of prepositional cases or DAT for GEN and the use of INS for prepositional cases. These trends do not exactly conform to the patterns in (7–9).
This paper therefore examines the differences and similarities between the case-marking system in different populations classified as Heritage Russian speakers with the aim of emphasizing and disentangling the nuances of the case system and of the categorization of heritage speakers. It seeks to explain the patterns of case markings by drawing on a variety of contextual factors, both linguistic and social, to better understand the path(s) of change in this part of the grammar. We predict that Toronto heritage speakers will illustrate a pattern that is intermediate between the American Russian speakers examined in (Polinsky 2006), who have very limited use of Russian as adults, and the Homeland patterns, which should resemble Polinsky’s (assumed) Full Russian forms.

2. Materials and Methods

To best understand how language is used for communicative purposes, as opposed to experimental tasks, where the participant is not actually communicating new information to a listener, and what types of variation are present and available to speakers, we rely on spontaneous speech from a range of speakers who vary widely in how frequently they hear and speak Russian, their attitudes toward the language and culture, and the types of input they have received. Variationist sociolinguistic methods (cf. Labov 1984), augmented by further information necessary to understand what influences speech variation in multilingual contexts, are applied, as described in this section. The goal is to describe both the 
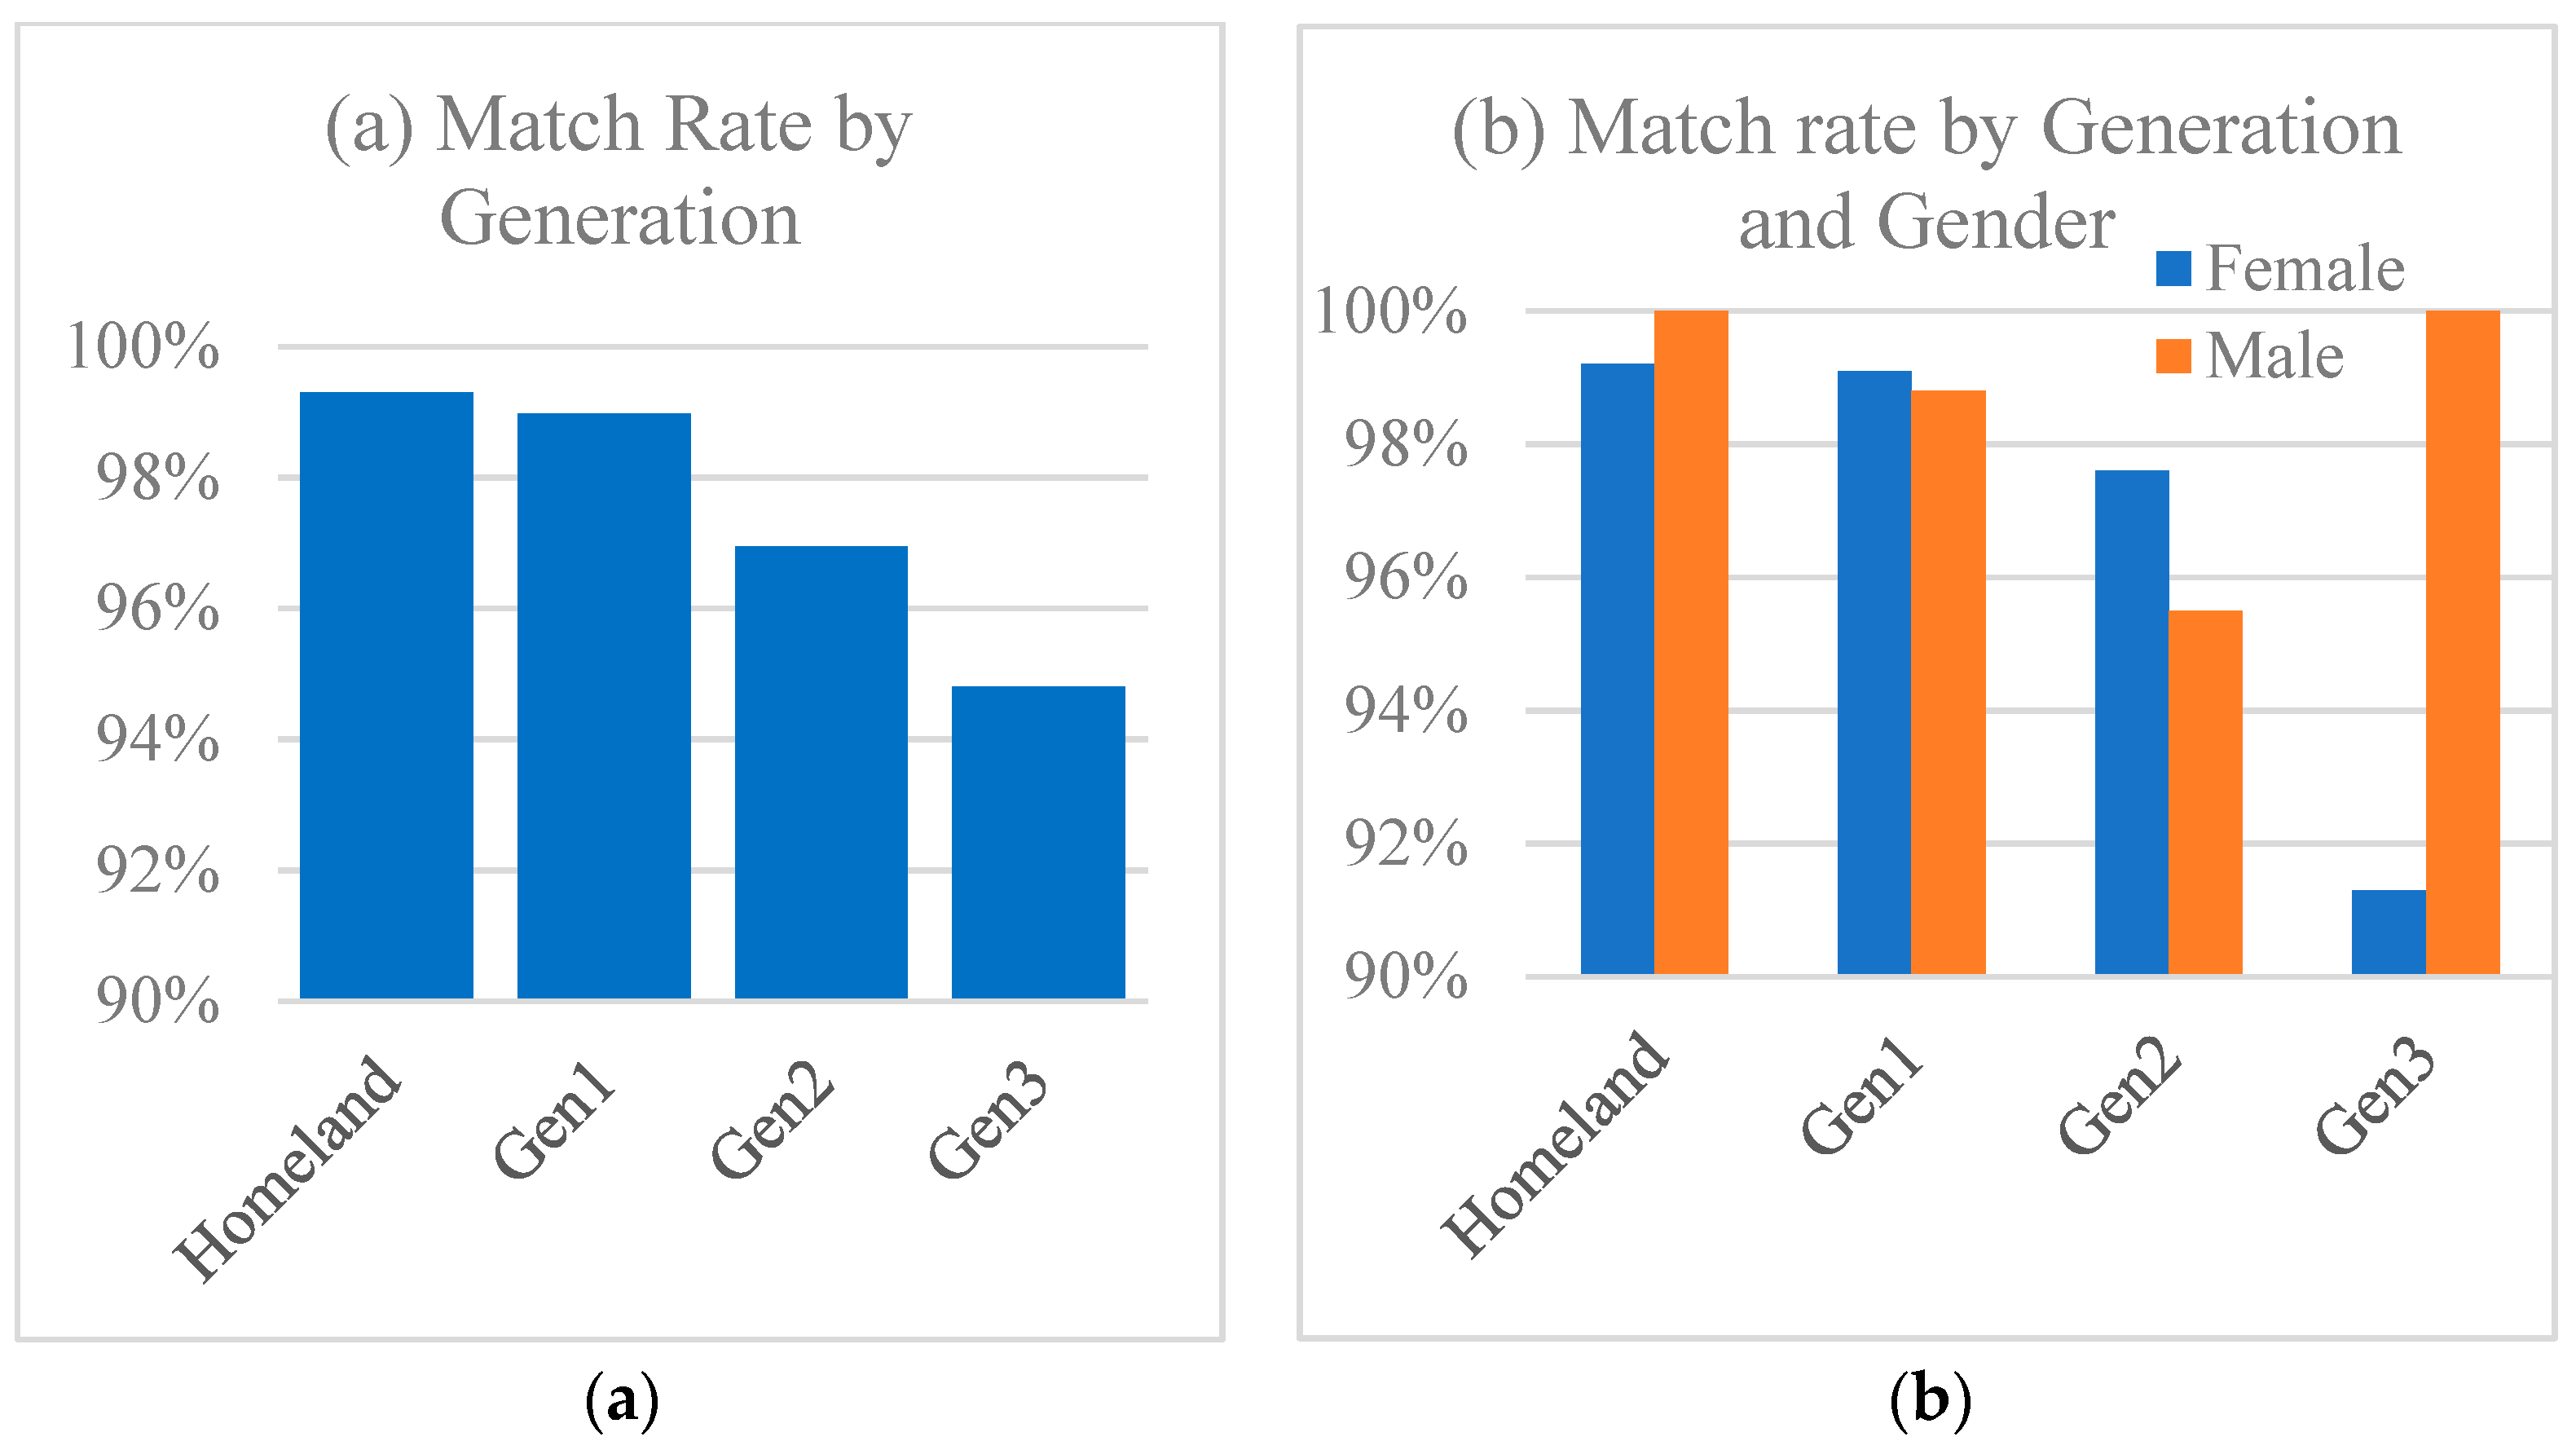
rates of match (canonical case-marking choice vs. non-canonical choice) and the patterns of contexts in which matches occur most frequently, and how these change from one generation of speakers to the next.

2.1. Participants

We analyzed data from 30 speakers, of whom 24 heritage speakers have been recorded as part of the Heritage Language Documentation Corpus (HerLD) (Nagy 2011). Our heritage speaker sample included 12 first-generation speakers, nine second-generation speakers, and three third-generation speakers, all of whom reside in Toronto. These generation categories are defined in (1). The details of the speaker sample are provided in Appendix A.
To determine whether morphological levelling is evident through the synchronic evidence afforded by comparison across generations, comparison to homeland speakers is useful. The homeland comparison data comes from six speakers recorded for the Russian National Corpus (2003). Our sample is stratified by gender and generation, as demonstrated in Table 2 and Appendix A. Age ranges are provided, making it clear that age and generation are collinear, due in part to the limitations stemming from the definitions provided in (1) and in part to the availability of participants.

2.2. Data Collection

The speech samples from the heritage speakers are from the HerLD corpus (Nagy 2009) and are extracted from sociolinguistic interviews, each approximately an hour in length, conducted in Russian. Sociolinguistic interviews, as defined in Labov (1984), are conversational samples over a wide range of topics.3 These interviews were conducted by Heritage Russian-speaking student investigators who suggested topics and facilitated the conversation to elicit the largest amount of vernacular speech, basing the conversation on the HLVC interview protocol.4 Speakers were also asked to complete a short picture description task and an Ethnic Orientation Questionnaire.5 From the Ethnic Orientation Questionnaire, responses were scored on a scale indicating preferences for Russian or for English/Canadian language and cultural practices in various contexts. A Principal Components Analysis reduced the responses for 37 questions to two independent axes, one focusing on the speaker’s language use and preference (EO_Language) and one describing the speaker’s family’s language and cultural preferences (EO_Family). Interestingly, the speaker’s own ethnic identification (Russian, mixed, or Canadian) did not load strongly onto either axis and is thus not considered further in this paper. Ranges for ethnic orientation (EO) scores, shown in Table 2, indicate that these, like age, are collinear with generation.
The homeland data, part of the Russian National Corpus (2003), consisted of short, unscripted conversations of various types between the speaker and one or additional participants whose speech remained unanalyzed. The speakers were Moscow residents.
Table 2. Distribution of 30 speakers.
GenerationFemaleMaleEO_ LanguageEO_ Family
nage range (years)nage range (years)rangerange
Homeland5unknown, but younger1unknownNANA
Gen1840–82 447–80 −2.5–−0.6−1.3–2.8
Gen2612–68 312–56 −2.0–3.7−1.6–3.7
Gen3225–37 156 2.9−0.2
Interviews were transcribed orthographically in ELAN, a program for time-aligned transcription and annotation (Sloetjes and Wittenburg 2008; Wittenburg et al. 2006). A transliteration into Latin script was used and non-standard elements of a speaker’s speech were transcribed as produced. This provides search and retrieval of instances of, for example, non-canonical case productions. Additional information on these tasks and methodology can be found in Nagy (2024, Chap. 4).

2.3. Variables and Coding

The dependent variable in our analyses was the choice of case marker. It was coded as binary: canonical vs. non-canonical selection of case marker, as determined by native Russian-speaking research assistants. To make this determination, each noun or pronoun in the selected portion of each interview was annotated in ELAN for both observed and prescribed cases, excluding those that are prescriptively NOM or categorically produced as match.6 Briefly, this consisted of categorizing tokens by the context in which they appear (according to prescribed case and part of speech, that is, noun or pronoun), described in further detail below, and then calculating the majority form produced in heritage and homeland data for each context. These majority forms matched the normative forms in Gruszczyński’s (2002) grammar, as well as the RAs’ intuitions, and are thus labelled as canonical forms. In this way, the dependent variable is a binary choice, either match (the token produced has the prescribed form) or mismatch (the token produced does not have the prescribed form). An example from the data of a mismatch is in (10), a clause produced by a Gen2 speaker in which the object of the preposition в ‘in’ is in the nominative or accusative form (nachalo) rather than the prescribed locative form (nachale). The target nouns are bolded. In contrast, (11) demonstrates an instance of a match token, where the object of the preposition ‘in’ is in the locative form, as is prescribed.
(10) vnachalonojabre
внaчaлoнoябpe
Inbeginning.NOM/ACCNovember.LOC
‘In the beginning of November’ (R2F68C, 00:00:59)
(11) jabylaunixvdome
ябылayниxвдoмe
1SG.NOMbe.AGR.PERFat3PL.LOCinhouse.LOC
‘I have been in their house’ (R0F20B, 00:27:15)
Errors in marking animacy, gender, and number were not included in our analysis (and have not yet been examined in this corpus). In cases where it was not possible to determine whether the lack of match to the canonical form should be attributed to selecting the wrong case or selecting the wrong animacy, gender, or number, we coded the tokens as a mismatch. For example, if a masculine noun was produced with the feminine form of the prescribed case, it was marked as a mismatch.
Coding of tokens began 15 min into each interview or conversation recording, allowing a period of adjustment to the context and thus using data that more closely approximates the speakers’ vernacular. In ELAN, approximately 100 noun phrases were selected and annotated for a match between the prescribed and produced case (the dependent variable) for each of the 30 speakers. If fewer than 100 tokens for a speaker were found throughout this portion of the interview, then the first 15 min of the file was coded as well. This limit of 100 tokens allows for a representative sample of how each speaker talks while conserving scarce resources required to process the data, particularly the time available to heritage-language-speaking student researchers. It also avoids skewing the data if any particularly garrulous or particularly reticent speakers have different patterns from others.7 As our focus here is an examination of nominals that are the objects of prepositions (the context studied in Polinsky 2006), tokens were extracted from a larger data set previously coded for the work published in Łyskawa and Nagy (2020): tokens are included in this analysis only if they were a noun or pronoun object of a preposition with a prescribed or canonical case of ACC, DAT, GEN, INS, or LOC. Thus, of the original 3000 coded tokens (30 speakers × 100 tokens), we examine 1454 preposition + noun tokens here.
For this study, four independent linguistic variables were also coded for each token, following the method described by Łyskawa and Nagy (2020) who operationalized the variationist study of Slavic case systems. These are nominal form (noun or pronoun), canonical case (ACC, DAT, GEN, INS or LOC), observed case (ACC, DAT, GEN, INS, LOC or NOM), and lexical frequency of the nominal form. Factors and their levels are listed in Table 3.
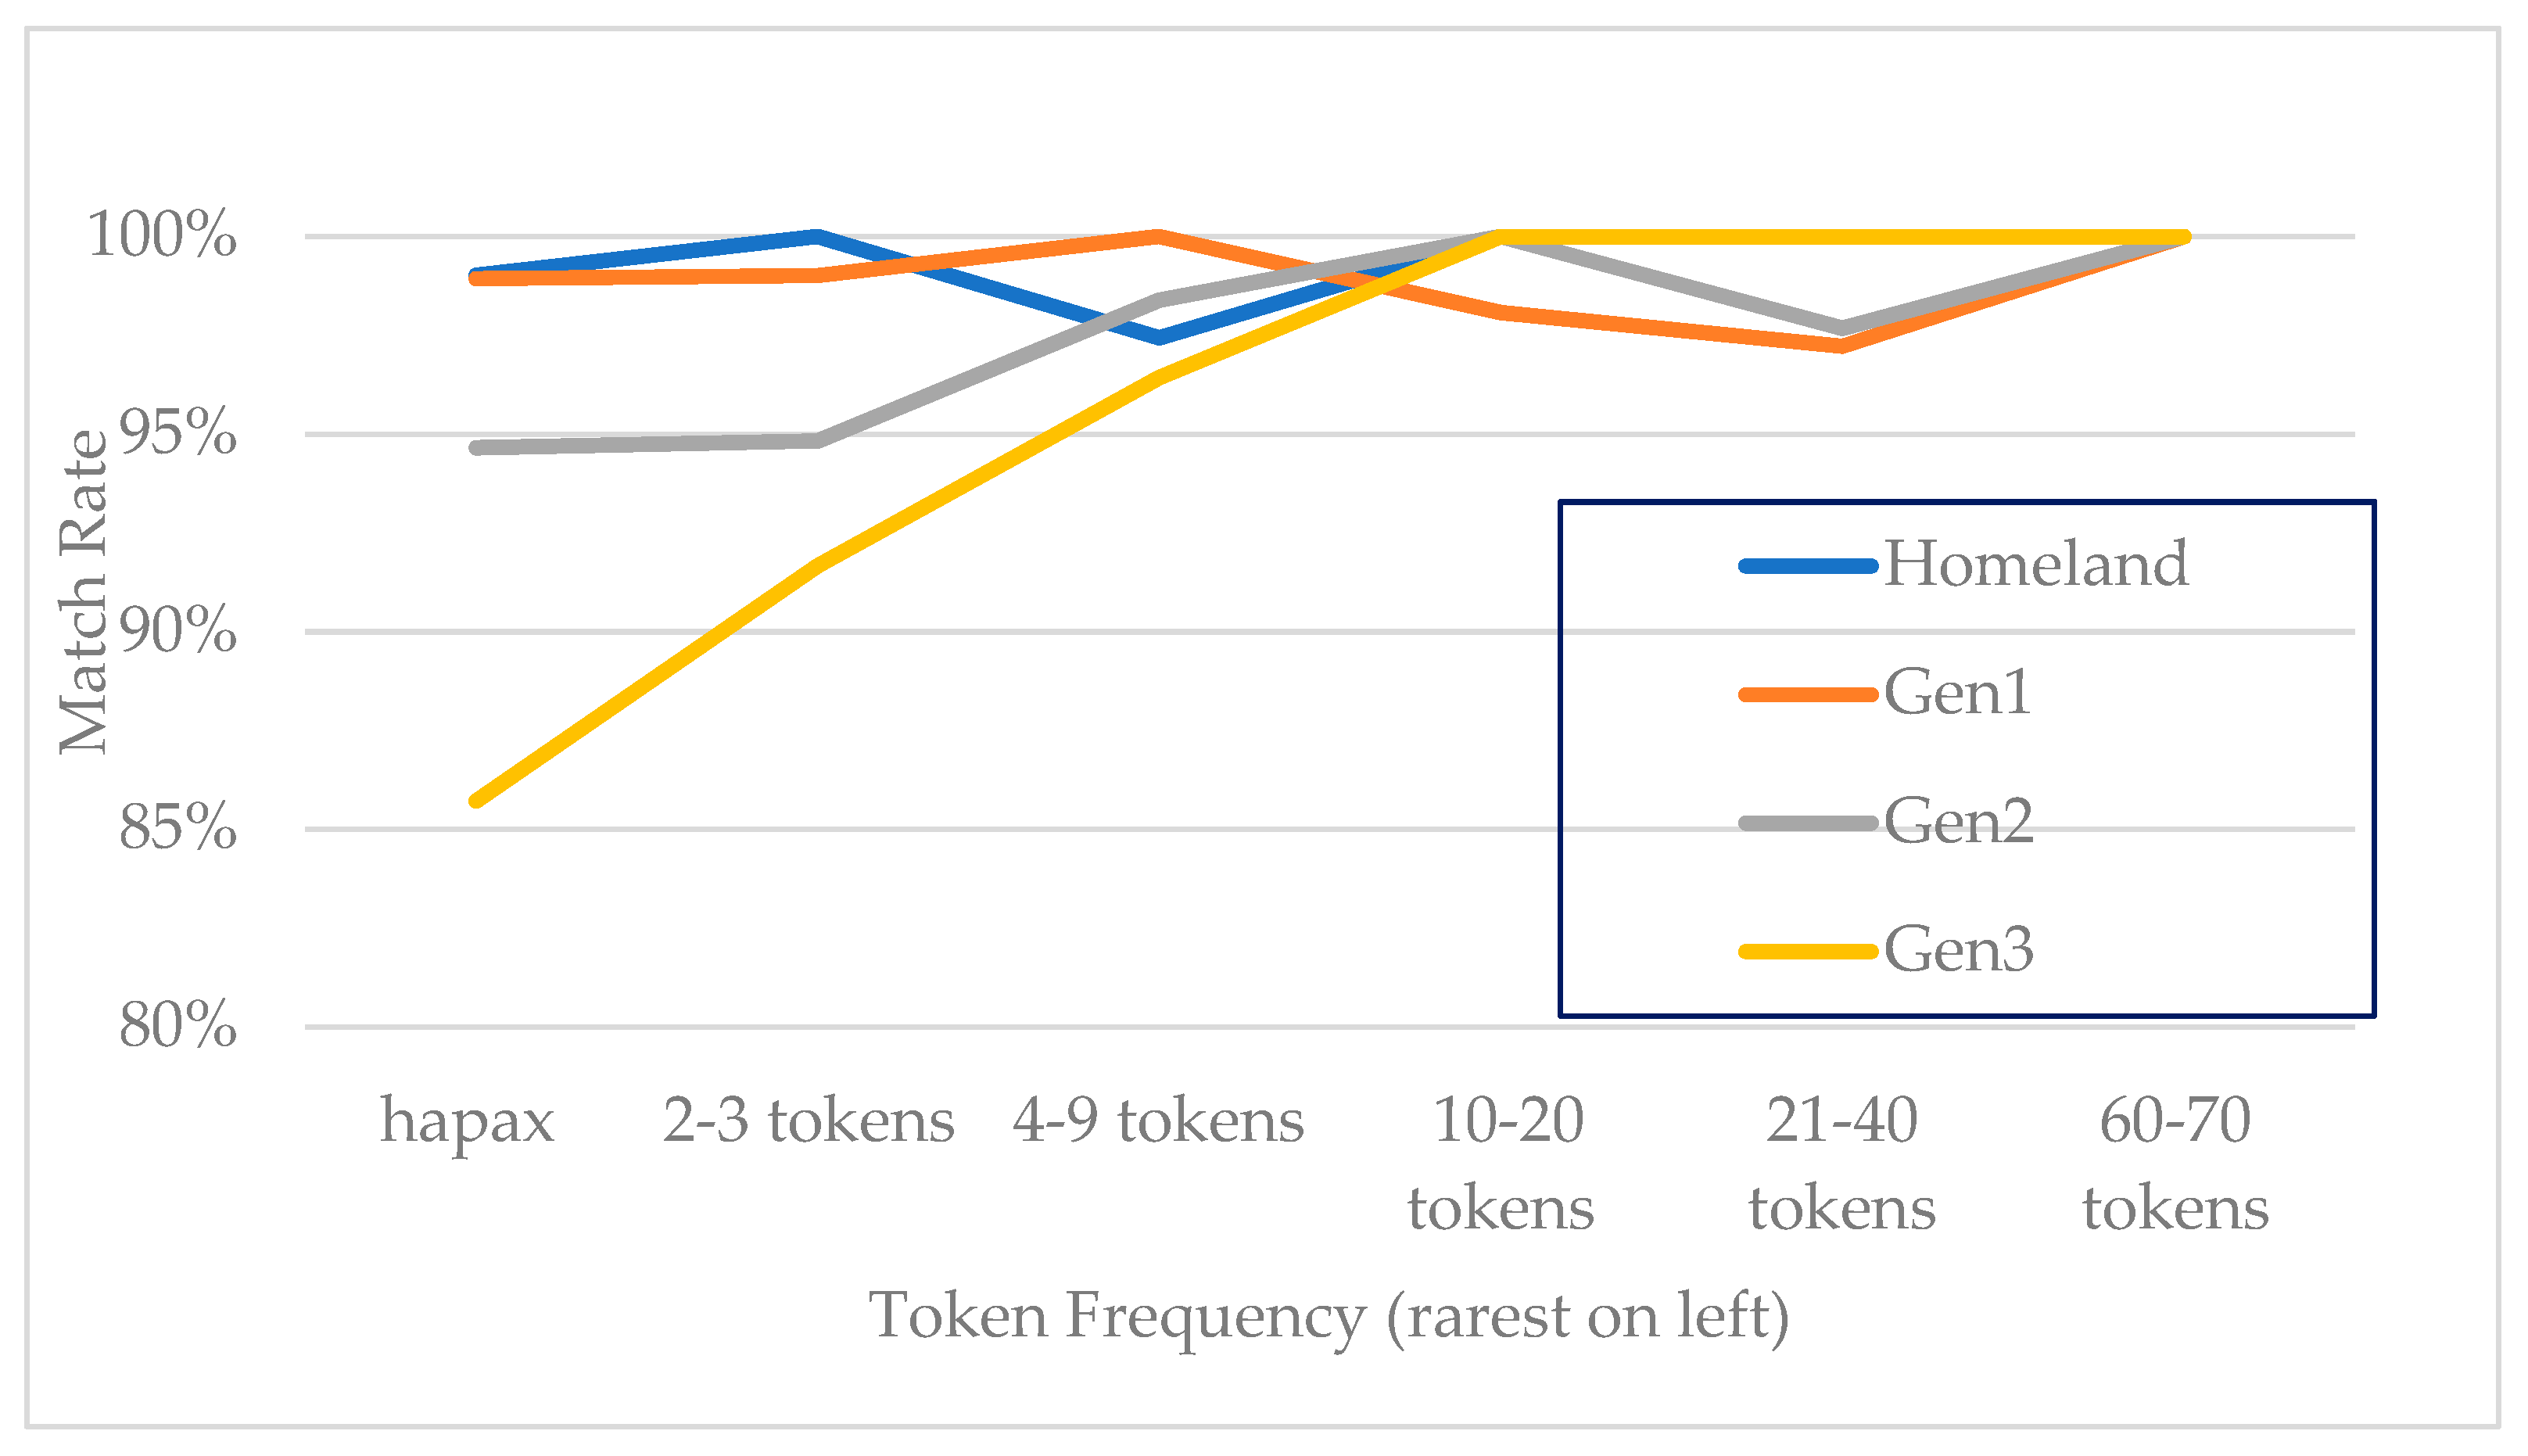
Lexical frequency was determined by counting the number of appearances of each form (not lemmatized) in the token list. Thus, it is a very local frequency. We operationalized lexical frequency in two ways, as a binned and as a continuous measure. To create the binned measure, we coded hapax legomena (single occurrences in the dataset) as the rarest category and two frequent pronouns (мeня ‘me’ and нac ‘us’) as the most common category. The remaining words were divided into four categories (see Table 3). We compare models with each measure and find that the continuous measure produces a model that better fits the data. We also coded each token as a noun or pronoun and determined that this did not interact with the lexical frequency measure, except that the two most frequent tokens were both pronouns (мeня ‘me’ and нac ‘us’). This was meant to control for the difference in complexity of case marking on nouns compared to pronouns (Polinsky 2006, pp. 214–17).
Finally, each token was coded according to the social characteristics of the speaker who produced it: generation, sex, age, EO_Language, EO_Family. The levels of all factors are shown in Table 3.
Based on these factors, Table 4 demonstrates how the example in (10) was coded. Items in the first four rows are coded for each token in ELAN. In another tier, tokens are automatically coded as match or mismatch, depending on whether the canonical and observed cases are the same. In this example, the dependent variable is entered as a mismatch because the canonical and observed cases do not match. Codes for each social factor (generation, sex, age, EO_Language, EO_Family) are added to each token after exporting the full token set from ELAN to a spreadsheet for statistical analysis (methodology described in Nagy and Meyerhoff 2015).
Narrowing down to the context of prepositional nominals with a prescribed case other than NOM and excluding the invariant (in the dataset) nominal classes (see endnote 6), we examine 1454 tokens, each coded in ELAN for the linguistic factors.

2.4. Analysis Methods

We first examined the distribution of tokens in intersecting contexts, considering both linguistic and social factors. Since speakers will not have the same number of tokens produced in each context, given the spontaneous nature of the speech data used, and because we have an imbalance in the number of speakers representing certain categories of our three social factors, we then conducted multivariate regression analyses to show which predictors significantly affect the match rates. Logistic regression models were constructed from the dataset using Rbrul (Johnson 2009), a package for R (R Development Core Team 2008). Rbrul supports multivariate analyses by asking the user to select modelling methods appropriate to the data, avoiding the need for writing code. As is standard in the field of sociolinguistics, factors with a p-value less than 0.05 were considered significant.
We compared multiple models to determine the combination of factors which best account for the patterning of our data. Models were compared through the reported AICc score (corrected Akaike Information Criterion, used for model averaging, Burnham and Anderson 2004) to determine which combination of factors best accounts for the data distribution. The size and distribution of the dataset precludes the inclusion of Speaker or Word as random intercepts. Because ethnic orientation is collinear with generation, it is excluded from the regression models and examined subsequently. Two speakers’ data had to be excluded from the models because these speakers exhaustively represent Homeland Males and Gen3 Males, respectively, and they exhibited no variation. Categorical levels cannot be entered in logistic regression models. Thus, in the multivariate analyses in Section 3.2, we model patterns for 29 of the 31 speakers considered in Section 3.1.
For our examination of the effects of lexical frequency, we also calculated type/token ratios for each generation and each speaker, based on the distinct forms produced and included as tokens in the above analysis. For type/token ratios, the larger the number, the more different the words or the larger the vocabulary a group exhibits. We compare (Pearson’s) correlations of this type/token ratio, match rate, and ethnic orientation scores across speakers.

3. Results

3.1. Distributional Analysis

The two graphs in Figure 1 show the high rate of accuracy, or choice of canonical case markers, for all groups analyzed. The match rates for each generation range from 94% to 99% accuracy, as shown in Figure 1a. The slight decrease in accuracy for each successive generation since immigration is supported by the statistical analysis shown later in Table 6, including the interaction between generation and gender, as shown in Figure 1b. The small samples from Gen3 differ quite a bit in the match rate between males (100%, n = 62) and females (91%, n = 92) but mirror the homeland pattern of more matches for males than females. The reverse is seen in the earlier heritage generations (Gen1, Gen2), where data are more plentiful, and the gender differences are smaller. Token counts for each speaker group are provided in Table 6.
We next look at the distribution of mismatched tokens—the tokens where the observed form does not match the prescribed form. Table 5 lists the prescribed cases in rows, with a separate section for each generation. The columns indicate the number of tokens produced with each observed case in that context. The shaded bars indicate matches, so the unshaded values (except totals) are counts of mismatches produced in each generation. In the header rows indicating generation, the total count of tokens produced in each observed case is given. This confusion matrix indicates that the occasional substitution of ACC for GEN and vice versa, found in the Homeland data, is not replicated in any heritage generation. Rather, the only frequent (more than two instances) mismatches are LOC marking on three prescribed ACC tokens for Gen2, and NOM marking in LOC contexts in Gen 2 (n = 3) and Gen 3 (n = 3).
To clarify further, Figure 2 shows the distribution of mismatches across the prescribed contexts. That is, of the 31 mismatched tokens, 39% of them occur in prescribed LOC contexts and just 3% occur in prescribed DAT contexts. This figure also provides the count of tokens occurring in each prescribed case context. LOC is the most frequent of the prescribed cases in this dataset, with 509 tokens, partially accounting, perhaps, for it having the biggest share of mismatches. In contrast, however, GEN is the next most frequent prescribed case context (n = 407) and only 16% of the mismatches occur there, the same portion as in the much less common INS context (n = 174). Thus, the frequency of the prescribed case does not account for mismatch rates.
More importantly, Figure 2 shows that the path of change from Homeland-like patterns toward the American Russian pattern for argument case marking that is reported in Polinsky (2006) and summarized in (7) and (8) does not show its origins among heritage speakers: we do not see the greatest erosion in the DAT context. Rather, prescribed DAT contexts claim the smallest portion of errors (though this may well be due to it being the rarest context). Additionally, the prescribed DAT mismatches are never caused by replacement with ACC or NOM. We also never see ACC contexts being filled with NOM marking, the other prediction for argument nominals in Polinsky (2006). This distribution of errors also does not replicate trends reported in Isurin and Ivanova-Sullivan (2008). That is, as shown in Table 5, we do not find DAT replacing ACC, GEN, or LOC; nor INS replacing LOC.
Another interesting pattern emerges when we consider the interaction between lexical frequency and generation. One might expect an effect on the case markings to emerge because homeland speakers and earlier heritage generations might have larger vocabularies and use more rare words, while later-generation speakers might limit their conversations to the use of more common words. What effect does this have on match rates? Not exactly what we might expect, as illustrated in Figure 3. There is a clear effect of lexical frequency for Gen3 speakers: they only have mismatches when using rarer words, showing, incidentally, that they do use rarer words. Gen2 follows this pattern, to a smaller extent. However, it is interesting to note that this is also the case for Homeland speakers, while Gen1 speakers’ mismatches are concentrated among the more frequent tokens. Figure 3 also illustrates the complete accuracy in case markings for all generations in the most frequent set of words, those forms which occur 60–70 times. These, as noted, are just the two first-person pronouns, мeня ‘me’ and нac ‘us’. Because of this coincidence that the very most frequent tokens are pronouns, while most of the rare tokens are not, it is not easy to say whether it is the frequency of exposure to particular words or the frequency of exposure to types (pronouns vs. nouns) or even the fact that English may play some role for heritage speakers’ Russian case markings if they mirror the need to attend to a case for the English pronoun system (e.g., I, me, my) but not for English nouns (except some possessive forms). We turn next to multivariate analysis to better understand the patterns and separate the effects of frequency and part of speech.

3.2. Multivariate Analysis

We constructed and compared three logistic regression models: one with lexical frequency binned as in Figure 3, one with a continuous measure of lexical frequency and one with nominal type (noun vs. pronoun), in order to see which of these collinear factors best account for the distribution of match vs. non-match tokens in our data. Each model included an interaction factor for generation * sex (because the sexes behave differently across the generations, as suggested in Figure 1b). The models with this interaction of social factors fit the data better than models with generation and sex separated (or either excluded), clarifying this interaction as a real effect rather than a spurious distributional effect.
A model with log(token frequency) produced a better fit than models with the binned token frequency or the nominal type factor, according to a comparison of AICc scores, see Table 6. Thus, the most complete account of the data requires reference to both internal (linguistic) and external (social) factors. When token frequency is included, adding the nominal type factor does not improve the model. In this best-fitting model, the highest match rates are for Homeland and then Gen1 speakers, with Gen2 and then Gen3 following. Tokens from Homeland males and Gen3 males were not included in this model because they are categorically matched, but these groups are included in Table 6 for comparability. Note that these groups provided relatively few tokens. The positive logodds (and centered factor weights) for log(token frequency) show that the more frequent a word, the more likely it is to have a canonical case marked on it.
This multivariate analysis illustrates a slightly larger mismatch rate for prepositional nominals by second and third-generations than for homeland and first-generation speakers, but this intergenerational difference is far less than the difference reported between Full Russian and Reduced Russian speakers in Polinsky (2006). The subtle cross-generational trend that is observed is expected based on previous studies of cross-generational patterns among Toronto speakers. (For an overview of cross-generational investigations in the HLVC project, see Ch. 5 of Nagy 2024) In generations with ample data from both males and females, females exhibited slightly higher match rates (but the opposite is true in groups where males produced fewer tokens).
The predictor prescribed case was also tested in a model alongside the factors shown in Table 6. The Prescribed case factor did not emerge as a significant predictor and models that include it fit the data less well than the model in Table 6. The range of match rates across the prescribed cases and across the nominal types is reported in Table 7 for completeness.
Models with age and models with generation, two collinear factors, were compared to see which best accounted for the data. AICc score comparison always showed generation to produce a better fit, so age is not further discussed.
To summarize, the logistic regression model showing which factors best predict whether a particular token will exhibit a match or mismatch for case includes only (log)lexical frequency and the interaction of generation and sex. They show that the closer (in terms of family migration patterns) to Homeland speakers a speaker is, the higher their match rate. Within two generations (Homeland and Gen3), males have a higher match rate than females and in the other two groups, females have a higher match rate than males. Additionally, and independently, the more frequent a word is, the more likely it is to be produced as a match (canonical case marking).

3.3. Ethnic Orientation and Vocabulary Size Effects

Because ethnic orientation is collinear with generation in the HLVC sample, it could not be included in the models tested in the previous section. We now turn to its examination. We refer to the first component from the Principal Components Analysis of ethnic orientation scores as the EO_Language score. A Pearson correlation test shows that this EO_Language score correlates with the match rate (r = −0.63, p <<0.01): the more a speaker orients toward Heritage Russian, the lower their match rate (in general). While this might seem counter to expectation, given the generational effect (see Table 6), a comparison of models with either generation or EO_Language shows that generation provides a better fit to the data. The categorical match rate of the one Gen3 male might be best understood as due to his strong orientation to his heritage language (his EO_Language score is 1.46), in spite of a low EO_Family score (−0.37).
EO_Language correlates, but less strongly, with Type/Token Ratio (Pearson’s r = −0.54, p = 0.02): the negative correlation between preference for using Heritage Russian and vocabulary size shows that speakers who prefer to use Russian more have smaller vocabularies. Both effects are understandable given that our Gen1 speakers have lower ethnic orientation scores than Gen2 and Gen3. Interestingly, there is not a significant correlation between match rate and Type/Token Ratio (Pearson’s r = 0.07, p = 0.43.)
The second component from the Principal Components Analysis, EO_Family, shows little spread among our speakers and no correlation with any linguistic measures. That is, the scores of the speakers included in this sample are too similar to each other to account for different linguistic performance.

3.4. More on Lexical Frequency Effects

Although the continuous frequency measure produced the best-fit model, examining the pattern for the binned frequency (excerpted from a parallel model with generation*sex) is illustrative, and shown in Table 8. The two most frequent categories of tokens are at the top of the range (with the categorical most frequent category (63–70 tokens, just of the two first-person pronouns) above them but not actually included in the model), with similar match rates and centered factor weights for 10–20 and 21–40 occurrences. From there, all measures decrease in line with decreasing frequency. This shows the orderly nature of data: irregularities could have been smoothed over by the continuous measure, but we see that there are few.
The important outcome of this investigation is that both the social factors and lexical frequency are significant. This indicates that the generational differences in match rate are not due simply to different vocabulary choices, but rather that lexical frequency plays a role within each generation’s patterns. Importantly, the many words that appear only a few (0–3) times in the token list, have a match rate of 97%, whereas increasingly more common tokens have higher match rates.
We also compared vocabulary sizes across generations. Because of the different number of words produced by speakers in each generation, we use type/token ratios as a measure of the vocabulary used (as tokens) for each generation. Table 9 shows, more or less, the expected direction of difference but quite small differences between generations, indicating that lexicon size is not the only reason for cross-generational differences. While this correlation is interesting, there is further investigation to be performed as, at an individual level, we did not find a clear relationship between match rate and lexicon size (see Section 3.3). This is in striking contrast to Polinsky’s (2006, p. 252) finding that
since structural attrition and lexical proficiency are correlated, the lexical proficiency scores can serve as a basis for the characterization and ranking of incomplete learners in terms of a continuum model.
In spite of differences in methods of calculating lexical proficiency and speaker types examined, this difference is surprising. Polinsky’s speakers were selected to satisfy a criterion that their preference was to use English over Russian. In this, they resemble our Gen1 speakers, who have very low EO_Language scores, indicating the same preference.

3.5. Direction of Evolution

Though there were only 31 mismatch tokens (of 1454) within the context investigated in this study, we examined the observed case across these tokens to seek trends about which case(s) commonly replace(s) the canonical case. Polinsky (2006, p. 60) reported that all cases were being replaced with a nominative, or the ‘unmarked’ case in American Russian (plus a path of DAT > ACC > NOM for arguments). Figure 4 illustrates that, although nominative (or unmarked) was the most frequent choice (about one-third of the mismatches), it was not the only choice in our sample—LOC and ACC were also frequently selected (about 20% of the mismatches each). The numbers above each bar indicate the number of times each case was observed (with the large majority of these being matches, and so not represented in this graph). The data are too sparse to investigate inter-generational differences within this distribution inferentially, but we can note that homeland speakers, as a group, never had more than one token mismatched to any one case (mismatches only between ACC and GEN), out of their 287 tokens. In contrast, Gen2 and Gen3 produced a total of 10 tokens mismatched to NOM, out of their 154 tokens. Thus, overall, the evolutionary expectation of increasing replacement by NOM seems to be met, although the rate of replacement by NOM is slightly higher for Gen2 (43%, 6 of 14 tokens) than Gen3 (40%, 4 of 10 mismatches). However, we have already shown that the distribution according to the prescribed case context, in Figure 2, does not correspond to the path described for Reduced Russian. So, while we see an extension of the NOM (or unmarked) form as the most common trend, these extensions do not necessarily come from the contexts most predicted to provide them (according to the hierarchies in (6–8). Furthermore, other trends, e.g., extension to ACC and LOC, are also frequent and, as they are not cases of prescribed DAT becoming ACC (see Table 5), these do not follow the predictions for Reduced Russian.

4. Discussion

A significant intergenerational difference in the rate of canonical form production in the preposition+noun context, with later generations having slightly lower match rates, suggests some morphological levelling. However, the extent of levelling found here is far less than that reported by Polinsky (2006) for American Russian speakers, though in line with the rate reported by Isurin and Ivanova-Sullivan (2008) given the similarity in immigration biographies.8 The paths of levelling differ as well. In this section, we further consider why these differences might exist.

4.1. Paths of Change

We proposed, based on previous work, that there is a cline from Homeland, or Full, Russian through different categories of heritage speakers. These categories differ in terms of how often they use their heritage language and can be expected to roughly correspond to generations since immigration. Therefore, we would expect the three generations of heritage speakers examined here to show rates and patterns of mismatch intermediary between homeland speakers and the Reduced Russian speakers examined in Polinsky (2006) and to become successively more like the Reduced Russian patterns. Based on the age of immigration, we would expect our Gen2 speakers to be most similar to those Reduced Russian speakers and the speakers examined in Isurin and Ivanova-Sullivan (2008). However, as we have noted, our Toronto speakers are more likely to use Russian than those American heritage speakers. This constellation of similarities and differences in the language use and linguistic biography of the speakers in the three studies results in match rates that are more similar to Isurin and Ivanova-Sullivan’s (2008) speakers than to Polinsky’s (2006) speakers and mismatch patterns that differ from both. The lack of a gradual path toward the replacement clines shown in (7) and (8) leaves us without strong qualitative evidence to support an intermediate pattern of mismatch between Full and Reduced Russian by our socially-intermediary speakers. The (slight) drop in match rates from one generation to the next, however, does provide quantitative evidence that mismatches increase as speakers become less (socially) connected to the homeland. Although this increase involves the predicted increase in the use of NOM forms (which may, in some cases, be auditorily indistinguishable from unmarked forms), the fact that only a third of the mismatches are produced with NOM forms may serve as counterevidence to morphological levelling through this path. Furthermore, we are unable to pinpoint a pattern within the remaining 20 mismatches that could suggest a specific direction of levelling. Perhaps the lack of stronger evidence of continuity from Homeland or Full to Heritage to Reduced Russian can be attributed to methodological differences across the studies compared.

4.2. Comparison of Methods

While shrinking lexicons corresponded to evolution of the case system for the Reduced Russian speakers examined in Polinsky (2006), we must seek a different reason for the variable match rates of these Toronto heritage speakers. As we compare tokens from the same grammatical context as those in the Polinsky study, we suggest that the difference in canonical case use (match rate) may be due to differences in the classification or recruitment of heritage speakers. There is likely a discrepancy between the proficiency of the speakers in the two studies. While proficiency is not measured directly, Polinsky (2006, p. 199) notes that due to the early childhood interruption of the acquisition of Russian of her speakers, it is difficult to elicit much speech from them at all. In contrast, speakers contributing to the HerLD corpus (Nagy 2009) met the criterion of feeling comfortable enough to speak in Russian for an hour, although the Gen1 speakers, as a group, preferred using English to Russian. Interestingly, there was more preference for Russian in Gen2 and Gen3 than in Gen1. Thus, our Gen1 speakers are the most comparable to Polinsky’s, in terms of language use (EO_Language scores), yet the most distinct, in terms of match rate. In addition, many speakers in Polinsky’s study (2006, p. 204) would not have met the criterion for participation in our study based on the generation categories outlined in (1) as they had not been living in the USA for the 20-year minimum, disqualifying them for Gen1, and arrived older than age 5, disqualifying them for Gen2.
Another difference between the two studies may emerge in speech collection methods between the two studies. While both studies elicited spontaneous speech, the context in Polinsky (1996, 2006) was more controlled and monologic, with one task being the retelling of a book or movie plot and another being explicit judgments about language forms. The collection of the data for our study was conducted via free-flowing dialogue with the heritage-speaker interviewer facilitating speech by asking the speakers questions designed to trigger their interest. Many variationist sociolinguistic studies of English show different rates of vernacular vs. standard forms in narratives as opposed to conversational events (cf. Labov 1984), and divergence from vernacular patterns when paying attention to language explicitly (Labov 1972a, 1972b). We may assume this to be true in Heritage Russian as well.
Kagan’s (2005) study compared five Heritage Russian-speaking university students to five second-language learners, rather than to homeland speakers. That study used different methods (written translation) and a different population (university students). Kagan reported that Heritage Russian speakers made non-significantly fewer errors in case marking than homeland speakers, a finding similar to that reported here, in spite of the use of different methods.
Finally, Isurin and Ivanova-Sullivan (2008) examined a different but similar group of university students, eliciting speech through an unrehearsed narration task. They found similar results to those reported here: 97.6% match rate, with five of the seven speakers producing some case mismatches.
These comparisons place the performance of Toronto Heritage Russian speakers and Isurin and Ivanova-Sullivan’s students between Polinsky’s and Kagan’s speakers. These comparisons suggest that it is not the linguistic ecology of “America” versus “Canada” that accounts for the difference between Łyskawa and Nagy’s results and Polinsky’s, nor is it the elicitation method, but rather the sampling or recruitment method, tied to different goals of the studies.
Another important methodological difference across the studies in Table 1 is the way the data are analyzed. Only (Łyskawa and Nagy 2020) report a multivariate analysis in which the effects of linguistic and social factors are considered for their possible effects on match rates in different contexts and different (groups of) speakers. The current analysis also uses this analysis method, showing that both lexical frequency and (an interaction of sex and) generation influence match rates.

4.3. Lexical Frequency Effects

The effect of lexical frequency reported here indicates that one other important difference between studies using more- and less-controlled methods of elicitation is in the vocabulary available for use by participants. Thus, we next discuss what we have found regarding the related issues of lexical frequency and vocabulary size. With the common perception of heritage speakers not fully acquiring the language (cf., Laskowski 2009; Montrul 2008), one may be tempted to attribute the (slight) intergenerational differences to a smaller lexicon size. However, the 39 lexical classes used by the heritage speakers in the HerLD Corpus cover ~97% of the ~100,000 Russian nouns in Zaliznjak (1977), alleviating the concern that heritage speakers suffer from a reduced vocabulary or select only “easy” nouns in conversation (Pechkina and Nagy 2017). Furthermore, the similarity of type/token ratios (estimating vocabulary size) across generations (see Table 9) indicates the relative stability of the lexicon. When participants control the topics of conversation, as in a sociolinguistic interview, they may well remain more often in their comfort zone, using vocabulary they are comfortable with, in contrast to the choices they must make when an investigator regulates topics, as in the other studies compared here. We do not have a direct way of comparing the frequency of lexical items used across these studies, but we have shown that match rates are higher for words that speakers use more frequently. This may further account for some cross-study differences.

4.4. Limitations

As demonstrated in Table 2, there is an imbalance of data across speaker groups. Due to shorter recordings in the Russian National Corpus sample, we have less data in the homeland sample. Also, there are no speakers for certain combinations of generation, age group, and gender, e.g., no young Gen1 speakers, by definition, see (1), and unknown ages for several homeland speakers. Such gaps in (information about) the speaker sample mean that we are unable to make strong claims regarding the effects of age and gender, factors which are common sociolinguistic tools for describing change in apparent time. In addition, the homeland sample from the Russian National Corpus was collected through methods that are not identical to the sociolinguistic interviews method of data collection used for the HerLD Corpus (Nagy 2009). Rather, it includes excerpts from “public and spontaneous spoken Russian” movie transcripts (see http://ruscorpora.ru/en/corpus/spoken (accessed on 1 March 2024)). However, the assumed effect of this on the strength of our findings is small, given that the data from the Russian National Corpus includes conversations.

5. Conclusions

This paper reported a study of case marking in nouns and pronouns, which are objects of prepositions in the context of Toronto Heritage Russian and Moscow Homeland Russian, in order to investigate morphological levelling patterns. We compare our findings to those in several other studies, particularly Polinsky’s (2006) important description of case markings in American, or Reduced, Russian. As noted, available studies of Heritage Russian case markings differ in several ways, each of which may contribute to the differences in outcomes. These include the dimensions of the samples, the populations from which they are drawn, and the methods of elicitation and analysis. No one of these seems uniquely to account for differences in the outcomes, though both show how much the vocabulary is controlled by the method of elicitation and by the definitions of “heritage speaker” that are applied in recruiting participants. Both seem to contribute to differences in outcomes.
As in previous studies, we found evidence of morphological levelling, with later generations having a slightly lower match rate (using non-canonical forms slightly more frequently), though not as low as reported by Polinsky (2006). In contrast, match rates for the speakers examined here are very similar to those of American Russian speakers examined in Isurin and Ivanova-Sullivan (2008). Unfortunately, match rates are not provided in Kagan (2005), so we cannot compare outcomes in our spontaneous speech to those from her translation task. Because one might attribute the relatively high rate of canonical case marking in later generations to their selecting a smaller range of core vocabulary words in spontaneous speech, we also considered vocabulary size and effects of lexical frequency. Thus, we are able to further report that the relatively high match rate in later generations is not due to a smaller lexicon size or to choosing only common words.
Our data suggest that, quantitatively, there is a path of decreasing match rates from Homeland (or Full Russian) speakers through each generation of Toronto Heritage Russian speakers (and Isurin and Ivanova-Sullivan’s 2008 American Russian speakers) and then on to Polinsky’s (2006) American Russian speakers. Our data does not, however, confirm the proposed path of levelling reported in Polinsky—our 31 tokens do not strongly support a process of preposition+noun case marking being replaced with a nominative case, as 20 of these 31 mismatch tokens select a form other than nominative. Furthermore, there is no evidence for the levelling patterns proposed for American Russian—we do not find that it is primarily DAT and ACC tokens that level to NOM (or unmarked) forms in Toronto Heritage Russian.
This comparison of match rates and patterns of case markings between sets of speakers contributes to an understanding of the nuances of studying the speech and variation of heritage speakers. Our analysis revealed the surprising finding that the EO_Language score correlates negatively with match rate: our Gen1 speakers prefer to use English over Russian, compared to the later generations included in our sample, but have slightly higher match rates than the later generations. Further studies with different combinations of methods of elicitation and recruitment to fill gaps left in the current comparison are needed to complete our understanding of the paths of evolution for Slavic case marking in heritage contexts. For these comparisons, it will be important to consider the influence of methods of recruitment, elicitation, and analysis and to simultaneously consider the effects of the linguistic context and the social characteristics of the speakers.

Author Contributions

Conceptualization, N.N. and J.P.; data curation, J.P.; formal analysis, N.N. and J.P.; funding acquisition, N.N.; investigation, N.N.; methodology, N.N.; project administration, N.N.; resources, N.N.; supervision, N.N.; visualization, N.N.; writing—original draft, J.P.; writing—review & editing, N.N. All authors have read and agreed to the published version of the manuscript.

Funding

This research was funded by The Social Sciences and Humanities Research Council of Canada, grant number 410-2009-2330 and 435-2016-1430.

Institutional Review Board Statement

The study was conducted in accordance with the Declaration of Helsinki, and approved by the Research Ethics Board of the University of Toronto (protocol 24041, approved annually since 2009).

Informed Consent Statement

Informed consent was obtained from all subjects involved in the study.

Data Availability Statement

The data presented in this study are available, with conditions, on request from the corresponding author. The data are not publicly available due to conditions of privacy and anonymity of the participants.

Acknowledgments

The authors gratefully acknowledge the generosity of our participants and the hard work and dedication of the research assistants in the Heritage Language Variation and Change Project. They are recognized at https://ngn.artsci.utoronto.ca/HLVC/3_2_active_ra.php and https://ngn.artsci.utoronto.ca/HLVC/3_3_former_ra.php, both accessed 1 March 2024.

Conflicts of Interest

The authors declare no conflicts of interest.

Appendix A

Table A1. Speaker sample with match rate and lexicon size (by Type/token ratio).
SpeakerGenerationSexAge# Tokens# TypesType/Token Ratio% Match
R0F20AHomelandFemale2029430.67100%
R0F20BHomelandFemale2040500.9398%
R0FxxAHomelandFemaleDK43481.0098%
R0FxxBHomelandFemaleDK45551.05100%
R0FxxKHomelandFemaleDK35450.81100%
R0MxxEHomelandMaleDK34460.79100%
R1F40BGen1Female4035390.8197%
R1F47AGen1Female4727320.63100%
R1F47BGen1Female4727290.63100%
R1F50AGen1Female5054671.26100%
R1F54AGen1Female5430380.70100%
R1F55BGen1Female5521260.49100%
R1F81AGen1Female8137520.8696%
R1F82AGen1Female8232400.74100%
R1M47AGen1Male4731490.7298%
R1M56AGen1Male5634400.79100%
R1M62DGen1Male6220240.47100%
R1M80BGen1Male8047511.0998%
R2F12AGen2Female1225450.58100%
R2F17AGen2Female1738550.8896%
R2F20AGen2Female2039540.91100%
R2F31AGen2Female318110.19100%
R2F53AGen2Female5319250.4488%
R2F68CGen2Female681091822.5398%
R2M12AGen2Male1243641.0093%
R2M13AGen2Male1333410.77100%
R2M56BGen2Male5633490.7794%
R3F25AGen3Female2527470.6391%
R3F37AGen3Female3729450.6786%
R3M56AGen3Male5644621.02100%

Notes

1
For example, many inanimate nouns exhibit syncretism across NOM and ACC in the singular, while many animate nouns are syncretic across ACC and GEN.
2
As sociolinguists, we are sensitive to the possibility of different forms being viewed as correct or standard, depending on the language variety and degree of access to other varieties. We therefore avoid using these terms in our description of heritage speech. We use prescribed and canonical interchangeably and code our data according to whether surface forms match the canonical form, as described in Section 2.3.
3
In addition to re-examining the relevant subset of tokens from the 16 speakers studied by Łyskawa and Nagy (2020), we add eight additional heritage speakers.
4
5
6
We excluded tokens from rare nominal categories that did not exhibit any variability in terms of match vs. mismatch: two tokens of third declension plurals, one demonstrative pronoun, and 10 mixed-declension nouns.
7
This last concern would be moot in a dataset large enough to apply mixed-effects models with speaker as a random effect.
8
We remind readers that the diverging rates shown for Gen 3 in Figure 1b are based on a small sample from three speakers.

References

  1. Burnham, Kenneth P., and David R. Anderson. 2004. Multimodel Inference: Understanding AIC and BIC in Model Selection. Sociological Methods and Research 33: 261–304. [Google Scholar] [CrossRef]
  2. Corbett, Greville. G. 1982. Gender in Russian: An account of gender specification and its relationship to declension. Russian Linguistics 6: 197–232. [Google Scholar] [CrossRef]
  3. Cristiano, Angela. 2022. (r) in Heritage Calabrese Italian: Cross-Generational Nativeness. Master’s thesis, Università di Bologna, Bologna, Italy. [Google Scholar]
  4. Gruszczyński, Włodzimierz. 2002. Słownik gramatyki języka polskiego. Edited by Jerzy Bralczyk. Warszawa: Wydawnictwa Szkolne i Pedagogiczne S.A. [Google Scholar]
  5. Isurin, Ludmila, and Tanya Ivanova-Sullivan. 2008. Lost in between: The case of Russian heritage speakers. Heritage Language Journal 6: 72–103. [Google Scholar] [CrossRef]
  6. Johnson, Daniel E. 2009. Getting off the GoldVarb standard: Introducing Rbrul for mixed-effects variable rule analysis. Language and Linguistic Compass 3: 359–83. [Google Scholar] [CrossRef]
  7. Kagan, Olga. 2005. In Support of a Proficiency-based Definition of Heritage Language Learners: The Case of Russian. International Journal of Bilingual Education and Bilingualism 8: 213–21. [Google Scholar] [CrossRef]
  8. Labov, William. 1972a. Sociolinguistic Patterns. Philadelphia: University of Pennsylvania Press. [Google Scholar]
  9. Labov, William. 1972b. Some principles of linguistic methodology. Language in Society 1: 97–120. [Google Scholar] [CrossRef]
  10. Labov, Willliam. 1984. Field Methods of the Project on Linguistic Change and Variation. In Language in Use: Readings in Sociolinguistics. Edited by John Baugh and Joel Sherzer. Englewood Cliffs: Prentice Hall, pp. 28–66. [Google Scholar]
  11. Laskowski, Roman. 2009. Język w zagrożeniu: Przyswajanie języka polskiego w warunkach polsko-szwedzkiego bilingwizmu [Language in Danger: Acquiring Polish under Conditions of Polish-Swedish Bilingualism]. Kraków: Towarzystwo Autorów i Wydawców Prac Naukowych Universitas. [Google Scholar]
  12. Łyskawa, Paulina, and Naomi Nagy. 2020. Case marking variation in heritage Slavic languages in Toronto: Not so different. Language Learning 70: 122–56. [Google Scholar] [CrossRef]
  13. Montrul, Silvina, and Sara Ann Mason. 2020. Smaller vocabularies lead to morphological overregularization in heritage language grammars. Bilingualism: Language and Cognition 23: 35–36. [Google Scholar] [CrossRef]
  14. Montrul, Silvina. 2008. Incomplete Acquisition in Bilingualism. Re-Examining the Age Factor. Amsterdam: John Benjamins. [Google Scholar] [CrossRef]
  15. Nagy, Naomi, and Chiara Celata. 2022. Un corpus per lo studio della variazione sociolinguistica dell’italiano in contesto migratorio. In Atti SLI del Congresso “Corpora e Studi Linguistici”. Edited by Emanuela Cresti and Massimo Moneglia. Milano: Officinaventuno, pp. 223–37. [Google Scholar] [CrossRef]
  16. Nagy, Naomi, and Miriam Meyerhoff. 2015. Extending ELAN into Variationist Sociolinguistics. Linguistic Vanguard 1: 271–81. [Google Scholar] [CrossRef]
  17. Nagy, Naomi. 2009. The HLVC Project. Available online: https://ngn.artsci.utoronto.ca/HLVC/ (accessed on 1 March 2024).
  18. Nagy, Naomi. 2011. A multilingual corpus to explore geographic variation. Rassegna Italiana di Linguistica Applicata 43: 65–84. [Google Scholar]
  19. Nagy, Naomi. 2015. A sociolinguistic view of null subjects and VOT in Toronto heritage languages. Lingua 164: 309–27. [Google Scholar] [CrossRef]
  20. Nagy, Naomi. 2024. Heritage Languages: Extending Variationist Approaches. Cambridge: Cambridge University Press, in press. [Google Scholar]
  21. Parker, Jeff, and Andrea D. Sims. 2020. Irregularity, paradigmatic layers, and the complexity of inflection class systems: A study of Russian nouns. In The Complexities of Morphology. Edited by Peter Arkadiev and Francesco Gardani. Oxford: Oxford University Press, pp. 23–51. [Google Scholar]
  22. Pechkina, Anya, and Naomi Nagy. 2017. Heritage Russian Speakers’ Use of Noun Cases in Relation to Frequency and Entropy of Noun Class. ROP 299 manuscript. Toronto: University of Toronto. [Google Scholar]
  23. Polinsky, Maria. 1995. Cross-linguistic parallels in language loss. Southwest Journal of Linguistics 14: 87–123. [Google Scholar]
  24. Polinsky, Maria. 1996. American Russian: An Endangered Language. Manuscript. Ms. 53. La Jolla: University of Southern California-UCSD. [Google Scholar]
  25. Polinsky, Maria. 2006. Incomplete acquisition: American Russian. Journal of Slavic Linguistics 14: 191–262. [Google Scholar]
  26. Putnam, Michael T., and Liliana Sanchez. 2013. What’s so incomplete about incomplete acquisition? A prolegomenon to modeling heritage language grammars. Linguistic Approaches to Bilingualism 3: 478–508. [Google Scholar] [CrossRef]
  27. R Development Core Team. 2008. R: A Language and Environment for Statistical Computing. Vienna: R Foundation for Statistical Computing. [Google Scholar]
  28. Russian National Corpus. 2003. Institute of Russian Language, Russian Academy of Sciences. Available online: http://ruscorpora.ru (accessed on 1 March 2024).
  29. Sloetjes, Han, and Peter Wittenburg. 2008. Annotation by category—ELAN and ISO DCR. Proceedings of the 6th International Conference on Language Resources and Evaluation. Available online: https://hdl.handle.net/11858/00-001M-0000-0013-1F92-C (accessed on 1 March 2024).
  30. Statistics Canada. 2017. Census Profile. 2016 Census. Statistics Canada Catalogue no. 98-316-X2016001. Ottawa. Released November 29. Available online: http://www12.statcan.gc.ca/census-recensement/2016/dp-pd/prof/index.cfm?Lang=E (accessed on 20 March 2023).
  31. Umbal, Pocholo, and Naomi Nagy. 2021. Heritage Tagalog phonology and a variationist framework of language contact. Languages 6: 201. [Google Scholar] [CrossRef]
  32. Umbal, Pocholo. 2023. A Comparative Variationist Analysis of Phonetic Variation and Change in Toronto Heritage Tagalog. Ph.D. dissertation, University of Toronto, Toronto, ON, Canada. Available online: https://tspace.library.utoronto.ca/handle/1807/130519 (accessed on 1 March 2024).
  33. Wittenburg, Peter, Hennie Brugman, Albert Russel, Alex Klassmann, and Han Sloetjes. 2006. Elan: A professional framework for multimodality research. Paper presented at Fifth International Conference on Language Resources and Evaluation, Genoa, Italy, May 22–28; pp. 1556–59. [Google Scholar]
  34. Zaliznjak, Andrej Anatol’evič. 1977. Grammatičeskij slovar’ russkogo jazyka. Moscow: Russkij jazyk. [Google Scholar]
Figure 1. Match rate (count of canonically marked tokens/count of tokens) (a) by generation and (b) by generation and gender (n = 1454).
Languages 09 00100 g001
Figure 2. Mismatches distributed across the prescribed cases (n = 31).
Languages 09 00100 g002
Figure 3. Match rate by Token Frequency and generation (n = 1454).
Languages 09 00100 g003
Figure 4. Mismatches distributed across the observed cases (n = 31).
Languages 09 00100 g004
Table 1. Comparison of methods and outcomes of four studies of case marking in Heritage Russian.
StudyKagan (2005)Polinsky (2006) Isurin and Ivanova-Sullivan (2008)Łyskawa and Nagy (2020)
Elicitation MethodsTranslate English paragraph to RussianRecounting movie/book plot, conversationsFrog Story (unrehearsed narration)Sociolinguistic interview
LocationUniversity class (homework assignment)USAOhio State University, extra credit in a language courseHomes in Toronto, Canada
Speakers5 UCLA students (“who emigrated at a preschool age or who were born in the USA”)People who immigrated at age 9 (average) and had been in the USA for 17 years (on average) People who immigrated before age 10 or were born in the USA. to Russian-speaking parentsSpeakers in Toronto (contrasting those born there and immigrants)
Heritage speaker sample516762
Statistical analysis methodComparison of mean ratios Percentage of contexts/speaker Percentage of contexts/speakerMixed-effect logistic regression analyses, comparing generations, n = 1451
Rate of canonical case useNot provided13%97.6%;
5 of 7 speakers produced errors
Gen1 98%
Gen2 and 3 94%
Table 3. Analysis factors (predictors) and their levels.
Factor Levels
Canonical caseLocative
Dative
Genitive
Instrumental
Accusative
Observed caseNominative
Locative
Dative
Genitive
Instrumental
Accusative
Ambiguous (between canonical and any non-canonical form)
Lexical frequency, binnedHapax legomenon (rarest, single occurrence)
2–3 tokens
4–9 tokens
10–20 tokens
21–40 tokens
60–70 tokens (commonest)
(only мeня “me” and нac “us”)
Log
(lexical frequency)
Continuous measure of frequency, ranging from one to 68 tokens
Nominal formNoun
Pronoun
GenerationHomeland
Gen1
Gen2
Gen3
SexFemale
Male
AgeContinuous (age 12–82)
EO_LanguageContinuous (−1.3–2.9, higher is more Russian-oriented)
EO_FamilyContinuous (−0.2–3.7, higher is more Russian-oriented)
Table 4. Coding of ‘V nachalo nojabre’ (R2F68C, 00:00:59) example.
Canonical caseLocative
Observed caseNominative/Accusative
Lexical frequency, binnedHapax legomenon (one occurrence)
Type of tokenNoun
GenerationGen2
SexFemale
Age68
EO_Language2.10
EO_Family3.72
Table 5. Confusion matrix between canonical and observed case, by Generation. Matches are highlighted and generation subtotals are italicized. Outlined cells indicate all three instances of greater than two mismatch tokens of a single type within a speaker group.
Observed Case
ACCDATGENINSLOCNOMambig.n
Prescribed caseHomeland5747036120 287
ACC56 1 57
DAT 4 4
GEN1 69 70
INS 36 36
LOC 120 120
Gen1137361014916211487
ACC135 1 136
DAT 36 36
GEN 101 1102
INS1 49 1 51
LOC1 161 162
Gen290241647017161526
ACC88 23 93
DAT 24 1 25
GEN 163 11165
INS 68 2 70
LOC2 1 1673 173
Gen311270165041154
ACC10 1 11
DAT 2 2
GEN 69 1 70
INS 16 117
LOC1 1 493 54
Total295664051715031131454
Table 6. Best-fitting model of Russian case marking, n = 1346, AICc = 272, r2 = 0.27.
LogoddsTokens% MatchFactor Weight
Generation * Sex (p = 0.003)
 Homeland MaleNA46100%NA
 Homeland Female1.1224199%0.75
 Gen1 Female0.9632399%0.72
 Gen1 Male0.8216499%0.69
 Gen2 Female−0.2037298%0.45
 Gen2 Male−0.7915496%0.31
 Gen3 MaleNA62100%NA
 Gen3 Female−1.919291%0.13
log(Token frequency) (p << 0.01)
 continuous logodds +10.62
Speaker (random effect)
 Standard deviation0
Table 7. Match rate by prescribed case and nominal type.
Prescribed casenMatch rate
 DAT6498%
 GEN37299%
 LOC46997%
 INS16197%
 ACC28097%
Nominal type
 Noun96997%
 Pronoun 25898%
Table 8. Rate of match by lexical frequency (binned), n = 1227.
Binned Lexical FrequencyLogoddsnMatch RateFactor Weight
63–70 tokensNA119100%NA
21–40 tokens0.5211998%0.63
10–20 tokens0.8812999%0.71
4–9 tokens0.2626799%0.56
2–3 tokens−0.7529197%0.32
Hapax legomena−0.9142196%0.29
Table 9. Type/token ratio (vocabulary size estimate) by generation, n = 1454.
HomelandGen1Gen2Gen3All Speakers
Type count18030426484663
Token count2874875261541454
Type/Token ratio0.630.620.500.550.46
Disclaimer/Publisher’s Note: The statements, opinions and data contained in all publications are solely those of the individual author(s) and contributor(s) and not of MDPI and/or the editor(s). MDPI and/or the editor(s) disclaim responsibility for any injury to people or property resulting from any ideas, methods, instructions or products referred to in the content.

