Abstract
The supercritical carbon dioxide (SCO2) Brayton cycle presents a promising alternative to the traditional steam Rankine cycle, owing to its superior thermal efficiency, high power density, and compact design. As a key component governing system performance, the heat exchanger requires a highly compact and efficient design. This study proposes a novel additively manufactured (AM) wavy microchannel heat exchanger that achieves a compactness of 1670 m2/m3. The design incorporates adaptive flow channels to accommodate SCO2’s density variation, along with wavy patterns and ribs to enhance thermal performance. A comprehensive fluid–thermal–mechanical coupling numerical analysis was conducted to evaluate its thermal–hydraulic and mechanical performance. Within the Reynolds number range of about 900–6000, the wavy structures improve the heat transfer rate by 21–58%, compared with the straight channel. The maximum effectiveness (ε = 0.66) occurs at a Reynolds number of 900. Compared with other heat exchangers used in the SCO2 cycle, the overall performance of the hot and cold channels has improved by 12–44% and 3–89%, respectively. Structural analysis confirms that the average total stress under operating conditions remains below the yield strength of the Inconel 617 material, with thermal stress being the dominant contributor. This work underscores the potential of the proposed AM heat exchanger to deliver a superior combination of compactness, thermal–hydraulic performance, and structural integrity for advanced SCO2 power cycles.
1. Introduction
In pursuit of enhanced energy efficiency and reduced carbon emissions, the optimization of thermodynamic cycles in thermal power-generating units has become increasingly imperative [1]. Among promising alternatives, the SCO2 Brayton cycle has attracted significant interest owing to its potential for high thermal efficiency, large power density, enhanced compactness, and simplified turbomachinery [2]. A key factor underpinning this performance is the favorable thermophysical properties of CO2 near the critical point—specifically, its high density and low compressibility—which lead to a substantial reduction in compression work [3]. Consequently, the SCO2 Brayton cycle demonstrates superior cycle efficiency compared to both the steam Rankine cycle at temperatures exceeding 450 °C and the nominal helium Brayton recuperated cycle utilizing a single turbine and compressor across the entire operating temperature range [4]. These advantages make it a competitive candidate for a wide spectrum of applications, including nuclear reactors [5], solar–thermal systems [6], gas turbine waste heat recovery [7], and energy storage systems [8,9].
As illustrated in Figure 1, a typical SCO2 power system incorporates three primary types of heat exchangers: the heater, the recuperator, and the pre-cooler [10]. Among these, the recuperator plays a critical role in cycle efficiency by facilitating internal heat recovery. This key function imposes demanding requirements for high thermal effectiveness and low pressure drop within a minimal volume. This attribute is particularly advantageous for weight- and space-constrained aerospace power systems [11]. The relevance of SCO2 cycles to aerospace applications is increasingly recognized. In aircraft propulsion, SCO2 bottoming cycles can recover exhaust waste heat to achieve fuel burn reductions of up to 1.9% compared to advanced turbofans [12]. For space power systems, SCO2 cycles offer the high power density essential for lunar, Martian, and deep-space missions, where recuperator performance plays a critical role in maximizing system-level power density [13]. Additionally, SCO2 closed Brayton cycles have been proposed for integrated thermal management and power generation in hypersonic vehicles, addressing the extreme thermal challenges of ultra-high-speed flight [14]. These emerging aerospace applications share common requirements for compact, lightweight, and high-performance heat exchangers.
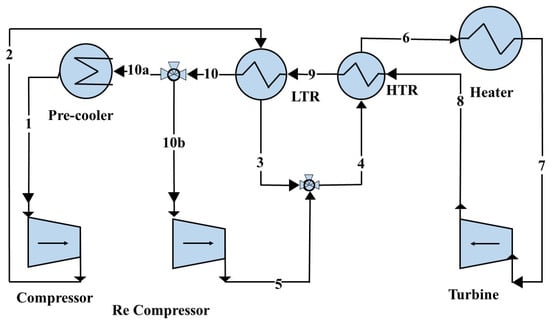
Figure 1.
The configuration of the recompression SCO2 cycle (the figure is reproduced from [10] under a Creative Commons Attribution (CC BY) license). The arrows indicate the flow direction. The numbers 1–10, 10a and 10b represent the key state points.
Moreover, the heat exchangers in the SCO2 cycle must maintain structural integrity and thermal efficiency under extreme operating conditions, typically involving high temperatures (e.g., 500 °C) and high pressures (e.g., 20 MPa) [15]. Consequently, the overall performance and reliability of the SCO2 cycle are critically dependent on the compactness, thermal–hydraulic performance, and mechanical reliability of its heat exchangers. A rational design, informed by a comprehensive understanding of multi-physics coupling effects under such demanding environments, is therefore essential for advancing SCO2 power cycle technology.
To meet these demanding requirements, three principal types of compact heat exchangers have emerged as the primary focus of research and development for SCO2 cycles: the printed circuit heat exchanger (PCHE), the micro shell and tube heat exchanger (MSTE), and the additive manufacturing heat exchanger (AMHE). The following sections critically evaluate the characteristics and limitations of each type to assess their suitability for advanced SCO2 power systems. The PCHE has been widely adopted in SCO2 cycles due to its compact design, high-pressure resistance, and superior heat transfer efficiency [16]. Specifically, the PCHE can achieve up to 85% reduction in volume compared to an equivalent conventional shell-and-tube heat exchanger and withstand pressures up to 50 MPa and temperatures from cryogenic conditions to approximately 800 °C [17]. The standard design of PCHE is shown in Figure 2, which is mainly fabricated by chemical etching and diffusion welding technology; this process typically creates semi-circular flow channels with diameters of 1–4 mm but imposes practical limits on the core size, with maximum plate dimensions of approximately 600 mm in width and height and 1200 mm in length [18]. The thermal–hydraulic performance of PCHEs is heavily influenced by their channel geometry, which can be classified into continuous and discontinuous types. The continuous microchannel includes straight channels, zigzag channels, and wavy channels. The investigations of Chu et al. on straight-channel PCHEs have confirmed SCO2’s superior heat transfer capability compared to conventional fluids [19]. Zigzag channels have superior heat transfer performance compared to straight channels for enhanced heat transfer area and boundary layer growth inhibition, while the zigzag configuration causes a corresponding increase in pressure loss for the secondary flow and boundary layer separation at the bend. An optimal bend angle for zigzag channels has been identified between 110° and 130° [20]. Extensive experimental correlations have been developed for both straight and zigzag channels using SCO2 as the working fluid [21]. In comparison, wavy channels demonstrated up to a 67% enhancement in comprehensive performance relative to zigzag channels by mitigating pressure loss [22]. Subsequent studies have further optimized the amplitude and wavelength parameters of sinusoidal channels [23,24]. Discontinuous channels featuring S-shaped and airfoil fins were introduced to enhance the fouling tolerance of PCHEs, as their interrupted design mitigates flow blockage by enabling cross-flow between channels. S-shaped fins can reduce the pressure drop by up to 80% while maintaining heat transfer performance comparable to zigzag channels [25]. Optimization via genetic algorithms has yielded enhanced overall performance of 16–21% [26]. Airfoil fins represent a more significant advancement, achieving pressure drop reductions of up to 95% without sacrificing heat transfer [27]. Nevertheless, the limited contact area in the discontinuous designs complicates diffusion bonding, making them challenging to manufacture while maintaining a low pressure drop. While the various channel geometries discussed aim to optimize PCHE performance, this type of heat exchanger still suffers from several inherent drawbacks at the system level. Their core-to-header fully welded, monolithic structure complicates internal inspection and damage detection, and poses significant challenges for cleaning, necessitating operation in clean fluids with minimal fouling potential. Furthermore, the reliance on heavy alloys and a limited flow area per unit volume can lead to a large footprint and high material consumption under high mass flow rates, which conversely undermines the system-level compactness and flexibility expected of SCO2 cycles. Finally, the integral block construction renders PCHEs susceptible to high cyclic thermal stresses and dynamic stresses, necessitating comprehensive structural and fatigue analysis during the design phase [28].
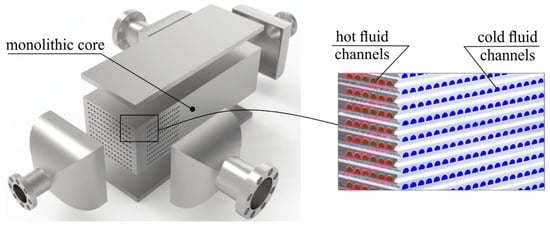
Figure 2.
Standard design of printed circuit heat exchangers (the figure is reproduced from [29] under Creative Commons Attribution (CC BY) license).
In addition to mainstream PCHEs, micro shell and tube heat exchangers are investigated for SCO2 cycles, benefiting from their mechanical simplicity and the high compactness (up to 4500 m2/m3) achieved with tube diameters on the order of 1 mm. As recuperators, MSTEs can achieve a faster dynamic response compared to PCHEs, primarily attributable to their lower metal mass and higher heat transfer coefficients [30]. Fundamental research by Cai et al. [31] highlighted the significant influence of buoyancy forces on heat transfer at low Reynolds numbers. Krishna et al. [32,33] subsequently developed key flow and heat transfer correlations and a predictive 2D numerical model. The experimental work of Jin et al. [34] later validated these models, reporting an average deviation within 10%, which supports their use for design optimization and scaling. Despite these promising attributes, MSTEs suffer from several inherent limitations. Achieving high compactness necessitates extremely small tube diameters, which complicates fabrication, especially for tube sheets and joints with potential risk for leaks, raising reliability concerns. Moreover, the substantial pressure differentials in SCO2 recuperators would require thick tube walls, counteracting the goal of compactness and increasing weight and cost. Additionally, the tubes face mechanical integrity issues, such as tube buckling in long tubes and high-amplitude vibrations excited by turbulent flow.
Additive manufacturing (AM) enables the fabrication of complex geometries previously unattainable with conventional techniques. This method provides rapid, customizable solutions through the simple modification of an original CAD file and eliminates the need for welding or brazing at joints, resulting in improved structural integrity and resistance to high temperatures and pressures. Consequently, AM is particularly suited for developing advanced, compact microchannel heat exchangers for SCO2 cycles [35]. Rasouli et al. [36] developed a rib-enhanced, counter-current primary heat exchanger with a thermal effectiveness of 0.77–0.87. Robey et al. [37] reported an optimized plate pin fin(PPF) design that achieved a specific material consumption of 0.216 kg/kW and a pressure drop of only 20% the design target value. Li et al. [38] incorporated triply periodic minimal surface (TPMS) structures, improving comprehensive performance by 15–100% over conventional PCHEs. Ding et al. [39] introduced an adaptive-flow heat exchanger with progressively spaced S-shaped ribs, reducing pressure loss by 69% while increasing heat transfer efficiency by 2% relative to ordinary S-shaped fins PCHEs. Zhao et al. [40] further investigated flow orientation in this design, recommending a downward flow for the cold side to maximize performance. Although additive manufacturing technology has expanded design freedom for heat exchanger production, several challenges remain to be addressed. Due to the size limitations of 3D printers, large-scale heat exchangers typically employ a modular design approach, with different modules joined into an integrated geometry via diffusion bonding. Diffusion bonding is a solid-state joining process that relies on atomic diffusion across mating surfaces under high temperature and pressure. This technique imposes stringent requirements on surface quality—the contacting surfaces must be extremely clean, smooth, and free of contaminants to achieve complete bonding. The prolonged thermal cycles required for large-area bonding reduce production efficiency, while maintaining bond integrity and suppressing void formation become increasingly challenging as the bonding area scales up. These challenges must be carefully addressed to ensure reliable fabrication of large-scale heat exchangers.
In summary, each of these options—PCHEs, MSTEs, and AMHEs—has persistent limitations. To simultaneously achieve high thermal efficiency, superior structural integrity, ease of maintenance, and full exploitation of the design freedom offered by additive manufacturing, it is essential to explore novel heat exchanger architectures. Building upon our prior experimental and numerical work with an annular wavy-microchannel heat exchanger for the micro gas turbine using air as working flow [41], this study presents a modified design optimized for SCO2 cycles. The high thermal capacity and energy density of SCO2 enable a more compact design, resulting in a reduced heat exchanger height. To maintain the required heat transfer capacity within this constrained height, the radial dimension of the annular channel was strategically increased. A fluid–thermal–mechanical coupled numerical analysis was conducted to simulate its behavior under actual operating conditions, investigating the effects of key parameters like mass flow rate, inlet pressure, and temperature. The proposed heat exchanger offers several advantages for SCO2 applications. The variable cross-section channels mitigate the adverse effects of sharp thermophysical property variations of SCO2. The channel design allows for cross-flow between hydraulic channels, reducing susceptibility to clogging. The modular processing approach also facilitates maintenance and cleaning. Integrated fins improve fluid distribution and structural rigidity, while the wavy geometry increases the heat transfer area and enhances fluid mixing. Compared to the PCHE, the design offers greater compactness, lower weight, and reduced metal consumption. Furthermore, the additive manufacturing approach simplifies fabrication compared to MSTEs while providing improved structural stability. This proposed innovative design is particularly advantageous for use as the recuperator in small to medium-capacity SCO2 cycle power generation systems. For larger power systems, the modular design of the proposed heat exchanger offers inherent scalability. Capacity expansion can be achieved through increasing the core height to accommodate more channels within a single unit and parallel integration of multiple cores, which leverages the modularity to meet the demands of larger-scale systems.
2. Numerical Setup
2.1. Model Design
An annular heat exchanger architecture was conceived to mitigate the adverse effects of drastic thermophysical property variations in SCO2, particularly the substantial change in specific volume. As illustrated in Figure 3a, the core model features an inner diameter of 100 mm and an outer diameter of 200 mm. To facilitate additive manufacturing by reducing fabrication time and improving printing accuracy, a modular design strategy was employed. The annular heat exchanger comprises 20 identical modular units, each spanning a central angle of 18°. These modular units are assembled into a complete annulus via diffusion bonding along their adjacent interfaces.
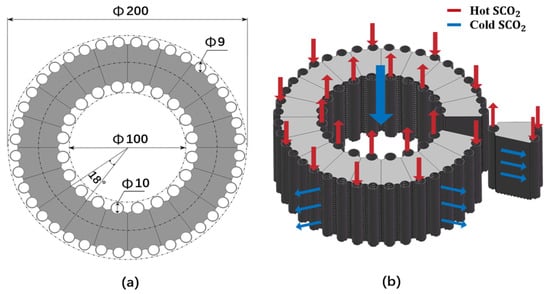
Figure 3.
Model of additively manufactured heat exchanger: (a) annular model and (b) flow paths.
The flow paths for the hot and cold SCO2 streams are depicted in Figure 3b. As the temperature of SCO2 increases, its density decreases and its volume expands, leading to opposing volumetric trends between the hot and cold streams. The hot SCO2 flows from the outer ring toward the inner ring through a flow area that progressively decreases, matching the fluid’s contraction during cooling. It enters via 40 collector tubes (9 mm inner diameter) at the outer ring, passes through the wavy microchannels where heat exchange occurs, and exits through 20 inner collector tubes (10 mm inner diameter). In contrast, the cold SCO2 flows from the inner to outer rings, through an expanding flow area, accommodating its volumetric expansion upon heating. It enters through inlets on both sides of the inner collector tubes and exits via outlets on both sides of the outer collector tubes. All collector tubes have a wall thickness of 0.5 mm. This flow arrangement not only mitigates the performance degradation associated with sharp property variations but also promotes an efficient counter-current flow pattern, enhancing the overall heat transfer efficiency.
The internal structure of a single modular unit is detailed in Figure 4. The cold and hot channels are alternately distributed along the axial direction. To ensure uniform fluid distribution and enhance heat transfer, an array of 0.3 mm thick ribs is incorporated within both the cold and hot channels. These ribs are spaced every 2° in the inner ring and every 1.5° in the outer ring. A radial gap of 1 mm is maintained to enhance fluid mixing and prevent blockages. Furthermore, the ribs located near the inlet and outlet feature an arced design with semicircular ends to guide fluid distribution and reduce resistance. This rib arrangement effectively creates a variable hydraulic diameter, which provides additional design flexibility to counteract the negative impact of property changes.
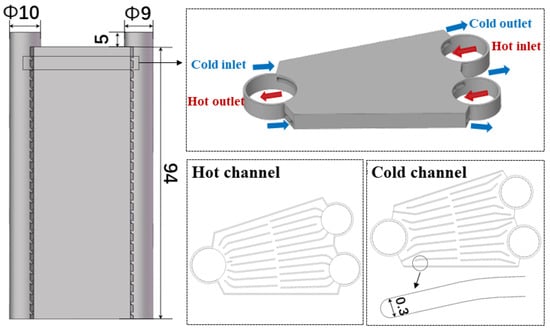
Figure 4.
Internal structure of heat exchanger modular unit.
To achieve further heat transfer enhancement, the baseline straight channels were replaced with a wavy profile. As illustrated in Figure 5, the wavy structure enhances heat transfer by increasing the heat transfer area within the same volume and promoting fluid disturbance. The separating walls between channels are shaped into a continuous wavy structure with a wavelength of 3.2 mm. The profile consists of quarter-circular peaks and valleys with a radius of 0.5 mm, interconnected by straight segments measuring 1.26 mm in length.
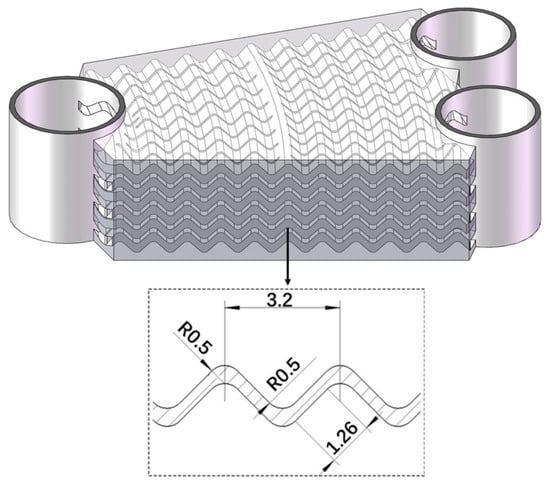
Figure 5.
Internal structure of wavy channel.
The heat exchanger core was fabricated via selective laser melting (SLM), employing a laser power of 200 W, a laser beam diameter of 60–90 μm, and a layer thickness of 30 μm. Although AM provides extensive design freedom, it inevitably increases surface roughness, which is extremely important to the thermal–hydraulic performance of the heat exchanger. To quantify this effect, surface roughness was measured on the as-built surface using the VK-X3000 3D Surface Profiler (Keyence Corporation, Osaka, Japan) with a resolution of 0.1 nm. An average roughness of 33.345 μm was recorded. After abrasive flow machining, the surface roughness can be reduced to the range of 0.2–0.4 µm. The surface roughness achieves an exceptionally high level of finish. The resulting relative roughness (approximately 0.02%) is extremely low, rendering its direct impact on the Nusselt number and pressure drop negligible for engineering purposes. Consequently, subsequent performance analyses can be conducted based on the smooth wall assumption.
2.2. Numerical Methodology and Boundary Conditions
The heat exchanger units consist of the staggered distribution of 26 cold and hot channels. To leverage the periodicity and symmetry of the structure, thereby simplifying the numerical model and reducing computational cost, a representative segment containing two contiguous pairs of cold and hot microchannels was extracted for simulation, as illustrated in Figure 6. To mitigate entrance effects and potential backflow disturbances at the outlets, the computational domains for both fluid streams were extended at their respective inlets and outlets. The solid domain of the model was defined as Inconel 617, a nickel-based alloy selected for its exceptional strength and resistance under high-temperature and high-pressure conditions, making it widely used for SCO2 heat exchangers [42,43]. The key properties of Inconel 617 are summarized in Table 1.
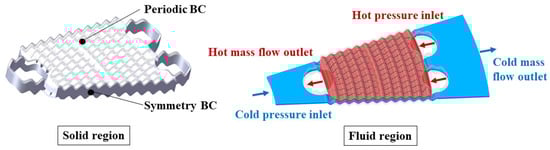
Figure 6.
Computational domain and boundary conditions.

Table 1.
Key thermal properties of Inconel 617.
The upper and lower walls of the solid domain were set as periodic boundaries, while the side walls were defined as symmetry boundaries. The extended sections of the fluid domain at the inlets and outlets were treated as adiabatic walls. The interfaces between the fluid and solid domains were set as coupled walls. The inlet for both cold and hot streams was specified as a pressure inlet boundary, and the outlet was defined as a mass flow outlet boundary. To reflect the actual operating parameters of a recuperator within an SCO2 cycle, the numerical conditions are detailed in Table 2, with the mass flow rates of the cold and hot fluids being equal and varied across the cases. The thermal–hydraulic performance was investigated using Fluent.
Table 2.
Numerical conditions for cold and hot channels.
The structural integrity of the heat exchanger was assessed using ANSYS 2024 R2 Static Structural. The temperature and pressure fields obtained from the Fluent simulation were imported as loading conditions for the subsequent stress analysis. This approach allows for the evaluation of both thermally induced stress, arising from temperature gradients, and mechanically induced stress from the pressure loading. The material properties employed for the structural analysis are presented in Table 3 [44].
Table 3.
Key mechanical properties of Inconel 617.
2.3. Turbulence Model and Governing Equations
The flow and heat transfer characteristics of SCO2 within the proposed heat exchanger were simulated by solving the Reynolds-Averaged Navier–Stokes (RANS) equations. The Shear Stress Transport (SST) - model was selected as the turbulence model, which combines the strengths of the - and - models and provides an accurate prediction of near-wall flow features such as separation under the conditions of aggressive pressure gradients. This model has been widely adopted in the simulation of SCO2 flows [20,26,31,38,42,45,46,47,48]. The governing equations of the numerical simulation are shown as follows:
Continuity equation:
Momentum equation:
In the equation, is the effective viscosity, and is calculated based on the dynamic viscosity and turbulence viscosity :
Energy equation:
In the equation, represents the viscous diffusion function.
For the solid domain, the energy equation is as follows:
Turbulent kinetic energy ():
Specific dissipation rate ():
where represents density; represents the component of velocity; represents the pressure; represents the thermal conductivity of the solid; denotes the generation of turbulent kinetic energy (); represents the generation of specific dissipation rate (); and represent the dissipation of and ; and represent the effective diffusivity of and ; and is the cross-diffusion term. Pressure–velocity coupling was resolved using the pressure-based coupled algorithm. A second-order upwind scheme was employed for the discretization of all convection terms to enhance solution accuracy. Convergence was deemed achieved when the residual of the energy equation dropped below 10−6, the residuals of other governing equations fell below 10−5, and the monitored values of outlet temperature and pressure exhibited negligible fluctuation.
2.4. Thermophysical Properties of CO2
In the supercritical state, the thermophysical properties of CO2, including density, thermal conductivity, specific heat capacity, and dynamic viscosity, undergo drastic variations, particularly in the vicinity of the critical point. These nonlinear changes influence the thermal–hydraulic performance of heat exchangers operating under supercritical conditions. Consequently, accurate simulation of the thermophysical properties of SCO2 is essential for reliably predicting the performance of the heat exchanger. In the simulation, the real gas properties (RGP) of SCO2 were implemented via a user-defined property file. This file contains high-fidelity tabulated data for all relevant thermophysical properties across a range of pressures and temperatures encompassing the operating conditions. During the iterative calculation process, Fluent determines the instantaneous fluid properties at each cell through high-order interpolation of this pre-defined data table. To accurately capture the steep gradients while avoiding convergence difficulties, the temperature and pressure steps between consecutive data points need to be kept sufficiently small. The accuracy of this interpolation method against the reference data from the NIST REFPROP database has been rigorously validated by Saeed et al. [46], ensuring the fidelity of the property representation in our model.
The operating temperatures investigated in this study (400–630 K) lie above the pseudo-critical region where the most severe property variations occur. Within this range, the thermophysical properties exhibit considerably milder variations than those in transcritical regimes, further reducing the sensitivity of the simulation results to potential interpolation errors. Nevertheless, other sources of numerical uncertainty inherent in CFD—such as discretization errors and turbulence model limitations—may still exist. Their potential influence has been carefully assessed and controlled through the rigorous grid independence study and model validation performed in this work, ensuring that the results are grid-independent and the model predictions are reliable.
2.5. Parameter Definition
Since the viscosity of cold SCO2 is higher than that of hot SCO2, the Reynolds number of cold SCO2 is slightly lower than that of hot SCO2 at the same mass flow rate. The Reynolds number is defined as follows:
In the equation, represents the mass flow rate of the fluid, is the average flow cross-sectional area of the channel, is the average dynamic viscosity, and is the hydraulic diameter of the microchannel heat exchanger, which is defined as follows:
In the equation, represents the flow volume and is the wetted surface area. The heat transfer coefficients () and Nusselt number () for hot and cold side fluids are defined as follows:
In the equation, represents the surface heat flux of the fluid, while , and denote the volume-weighted average temperature of the fluid, the area-weighted average wall temperature, and the average thermal conductivity of SCO2, respectively.
Since the density of SCO2 is much higher than that of other gases, the volumes of the components in the cycle are relatively small. Therefore, the compactness of heat exchangers is a core parameter, and it is defined as follows:
where is the heat transfer area of the heat exchanger, and is the actual occupied volume of the heat exchanger. The performance of the heat exchanger is measured using the heat transfer efficiency, which is defined as follows:
In the equation, represents the enthalpy of SCO2, denotes the pressure of SCO2, and the subscripts and refer to the hot and cold fluids, respectively, while and indicate the inlet and outlet.
Common dimensionless factors are used as reference indicators, with the Colburn heat transfer factor measuring heat transfer performance and the Fanning friction factor assessing flow performance. They are defined as follows:
In the equation, is the pressure difference between the inlet and outlet, is the average velocity of the fluid, is the average density of the fluid, and is the length of the fluid channel. Meanwhile, the definition of the Prandtl number () is as follows:
In the equation, is the average specific heat capacity. Since the and of cold SCO2 are both greater than those of hot SCO2, the of the cold SCO2 is also greater.
The JF factor is used to evaluate the thermal–hydraulic performance of the heat exchanger, defined as follows:
The Performance Evaluation Criterion () factor is also a dimensionless parameter used to assess the thermal–hydraulic performance of heat exchangers under the same pumping power conditions. In the study, the factor is utilized to assess the thermal–hydraulic performance of straight-channel and wavy-channel AM heat exchangers.
In the equation, and are the Colburn heat transfer and Fanning friction factors of the straight channel, while and correspond to those of the wavy channel.
The Von-Mises Equivalent Stress is a scalar stress value used to evaluate whether a material undergoes plastic yielding (permanent deformation) under multiaxial stress states, defined as follows:
In the equation, , , and are the first, second, and third principal stresses, respectively. The Von Mises equivalent stress can clearly show high-stress regions induced by stress concentration.
3. Mesh Independence Verification and Model Validation
To ensure the accuracy and reliability of the simulation results, mesh independence verification and model validation were performed. This section details the grid independence studies conducted for the fluid–thermal and mechanical simulations separately, followed by the validation of both models against established experimental and numerical data from the literature.
3.1. Mesh Independence Check
The computational domain was discretized using high-quality polyhedral elements generated with Fluent Meshing. The mesh was constructed with radial refinement towards the wall. The meshes were refined in the radial direction towards the wall. The first layer height was set to 0.002 mm to ensure that y+ at the first node near the wall was less than 1, and multiple meshes were generated in the viscous sublayer to ensure that the flow features near the wall were properly resolved. The resulting mesh division is shown in Figure 7.
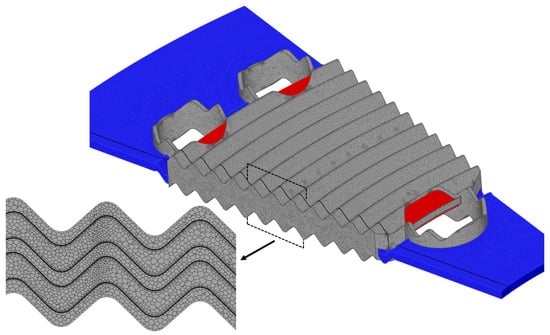
Figure 7.
Mesh details of the computational domain. Red and blue colors indicate the hot and cold fluid domains, respectively.
For the fluid–thermal simulation, the convective heat transfer coefficient of the hot channel was selected as the key parameter for grid independence verification. The results for five systematically refined mesh systems are presented in Figure 8. The relative error between the results obtained with 5.48 million and 6.32 million elements is merely 0.01%. Therefore, the mesh system with 5.48 million elements was deemed sufficient for achieving mesh-independent solutions and was consequently adopted for all subsequent fluid-thermal simulations. In the structural mechanical simulation grid independence verification, the average stresses are selected as the monitoring criteria. As shown in Figure 9, the predicted stresses exhibit minimal sensitivity to further mesh refinement beyond 1.66 million elements, indicating that the structural response is adequately captured at this resolution. To conserve computational resources, a mesh consisting of 1.66 million elements was selected for all structural simulations.
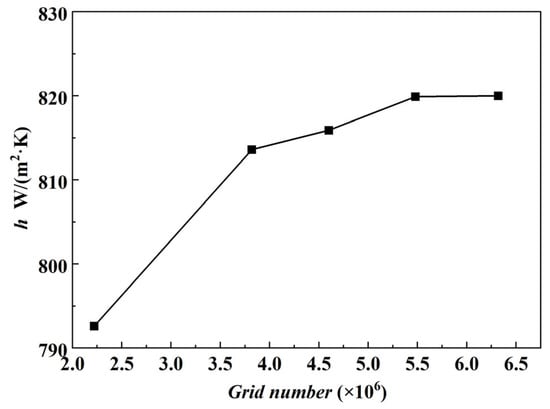
Figure 8.
Grid independence verification for the fluid–thermal simulation.
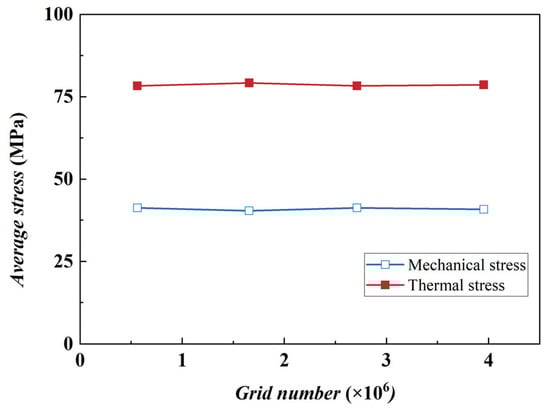
Figure 9.
Grid independence verification for the structural mechanical simulation.
3.2. Fluid–Thermal Model Validation
To validate the accuracy of the numerical model in predicting flow and heat transfer within complex internal geometries, simulations of the proposed wavy microchannel heat exchanger were first performed using air as the working fluid. The numerical results for the convective heat transfer coefficient were compared against the experimental data of Rao et al. [41] over a Reynolds number range of 230–620. As shown in Figure 10, the simulation results exhibit excellent agreement with the experimental measurements, with a maximum deviation of 10%.
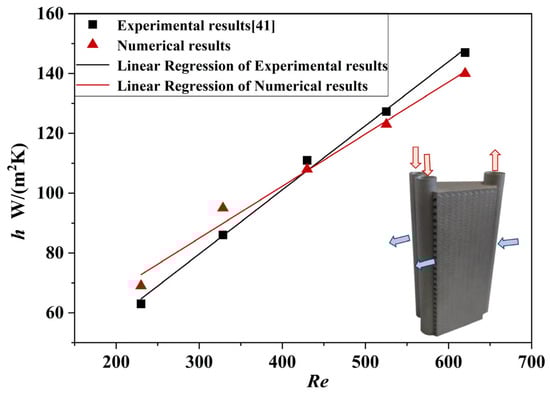
Figure 10.
Comparison of experimental and numerical results for the proposed heat exchanger using air as the working fluid. The red and blue arrows indicate the flow directions of the hot and cold fluids, respectively.
To further validate the accuracy of the model in simulating the performance of the heat exchanger using SCO2 as the working fluid, the numerical results were validated using the findings of Meshram [43] and Ishizuka et al. [49]. The boundary conditions in Meshram et al. are exactly the same as those in this study. A straight-channel PCHE matching their geometry was modeled, and the comparisons of streamwise fluid temperature and inlet-referenced pressure drop are presented in Figure 11. The results agree well with the simulation data from Meshram et al., with relative errors in both temperature and pressure loss distributions within 0.5%. Due to the scarcity of experimental data on SCO2 pressure and temperature distributions along the flow direction, further validation was performed against the experimental study of Ishizuka et al. A PCHE model that has a similar geometry to Ishizuka et al. is built, which has two hot channels and a cold channel. The upper and lower walls of the solid domain are set as periodic boundaries. The comparison of experimental results and numerical results is shown in Figure 12. Within the total mass flow rate of the entire PCHE range from 45 to 75 kg/h, the deviation ranges from 0.54% to 5.65% for the averaged heat load. Collectively, these comparisons demonstrate that the adopted numerical methodology is robust and capable of delivering accurate predictions for the flow and heat transfer analysis in SCO2 systems.
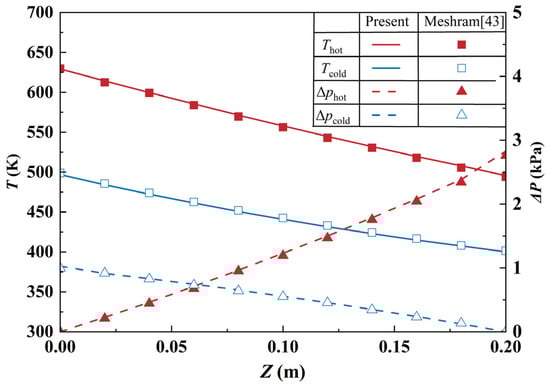
Figure 11.
Comparison of simulated and referenced temperature and pressure drop profiles in a straight PCHE.
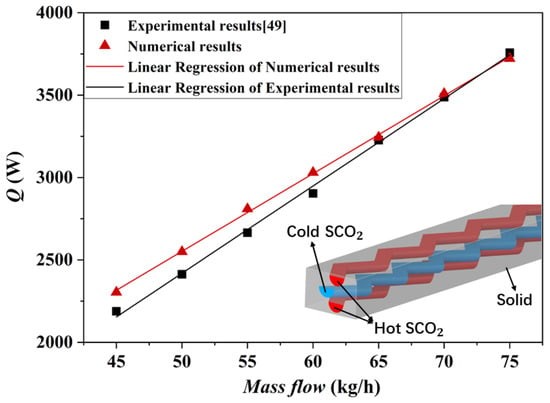
Figure 12.
Comparison of experimental and numerical results for the PCHE.
3.3. Structural Mechanical Model Validation
Direct experimental stress intensity data for individual microchannels within heat exchangers are scarce in the literature, precluding direct experimental validation of the structural mechanical model. As an alternative, the numerical model was validated against the published numerical results of Hou et al. [50] for a rectangular-channel PCHE configuration. As shown in Figure 13, the average difference is 7.8% for the thermal stress and 3.2% for the total stress. This favorable agreement confirms the effectiveness of the employed structural mechanical model for subsequent stress analysis.
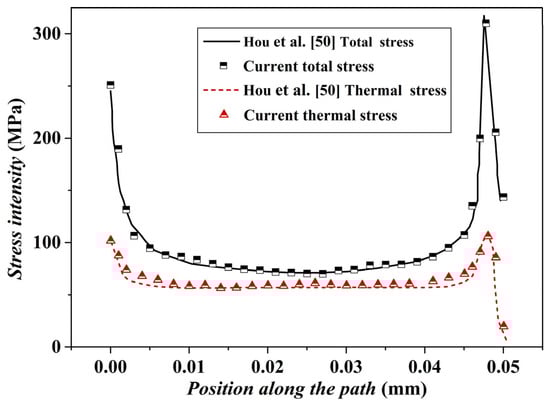
Figure 13.
Comparison of stress intensity along the PCHE channel wall.
4. Results and Discussion
This section presents a comprehensive analysis of the proposed heat exchanger’s performance. It begins with a comparative investigation of the flow and heat transfer characteristics between straight- and wavy-channel configurations. Subsequently, the performance of the wavy-channel heat exchanger under varying operating conditions (inlet mass flow rate, pressure, and temperature) is examined. The overall thermal–hydraulic performance is then benchmarked against other heat exchangers utilized in SCO2 cycles. Finally, the structural integrity under operational loads is assessed through stress distribution analysis.
4.1. Comparison of Flow and Heat Transfer Performance in Straight and Wavy Channels
To elucidate the local heat transfer characteristics, Figure 14 compares the heat flux distribution on the hot channel walls and ribs for both configurations. In the straight channel, as shown in Figure 14a, the high heat flux regions are predominantly localized near the leading edges of the ribs, where flow impingement and boundary layer disruption locally enhance thermal performance. Along the flow direction, progressive boundary layer development leads to a corresponding reduction in heat flux. In the wavy channel, the observed enhancement in mean heat flux is primarily attributed to flow separation and the generation of secondary flows induced by the wavy geometry. Specifically, as shown in Figure 14b, the high heat flux zones are predominantly localized on the leeward side, while the low heat flux zones are observed on the windward side. The distinct heat flux patterns are direct consequences of fundamental flow structures. As shown in Figure 15, on the windward side, the direct fluid impingement creates a high-shear region, but the high-velocity mainstream flow suppresses transverse fluid mixing. In contrast, the leeward side experiences flow separation, giving rise to recirculation vortices that continuously entrain and mix fluid from the mainstream. This process significantly enhances radial mass and heat transfer. Furthermore, transverse secondary flows, generated at the curvature transitions of peaks and valleys, as revealed in the enlarged sections of Figure 15, persistently scour the leeward surface, effectively disrupting the thermal boundary layer. Consequently, the leeward side demonstrates superior heat transfer performance compared to the windward side. This phenomenon is particularly pronounced in SCO2 heat exchangers due to the abrupt Prandtl number variation near the critical point, which further amplifies the leeward-side advantage. Moreover, enhanced fluid mixing through the fan-shaped sector promotes more uniform flow and heat flux distributions in downstream regions.
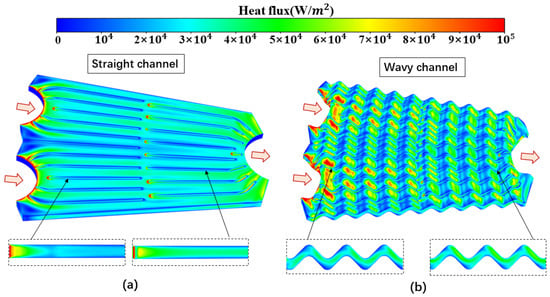
Figure 14.
Heat flux distribution on hot channel and ribs for (a) straight and (b) wavy channels at mass flow rate of 0.5 g/s. The arrows indicate the flow direction.
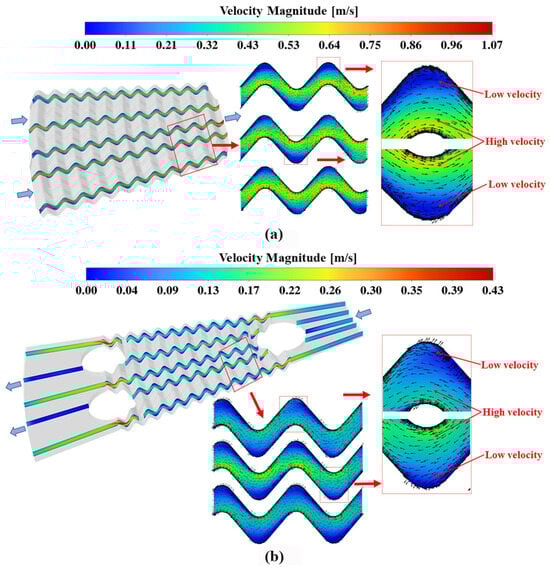
Figure 15.
Velocity contours at different cross-sections in (a) the hot and (b) cold channels at a mass flow rate of 0.5 g/s. The blue arrows indicate the flow direction.
In addition to its thermal–hydraulic benefits, the proposed wavy-channel design offers enhanced compactness and reduced metal consumption. The additively manufactured wavy-channel heat exchanger achieves a compactness of 1670 m2/m3, representing a significant enhancement of 18.7% over a straight channel AM design (1409 m2/m3) and 29% over a PCHE (1289 m2/m3 [30]). This increase in compactness directly contributes to a smaller system volumetric footprint and lower overall weight. Furthermore, the use of additive manufacturing eliminates the need for chemical etching steps and minimizes material waste during fabrication, offering additional advantages over conventional PCHE production routes.
The improved local heat transfer and larger heat transfer area directly enhance overall thermal performance. As shown in Figure 16, the wavy channel achieves a 21–58% enhancement in heat transfer capacity within the Reynolds number range of 900–6000. The nonlinear relationship between heat transfer enhancement and surface area expansion confirms that the superior thermal performance of wavy channels cannot be solely attributed to increased surface area. The secondary flows and vortex structures in wavy channels also significantly contribute to the heat transfer intensification.
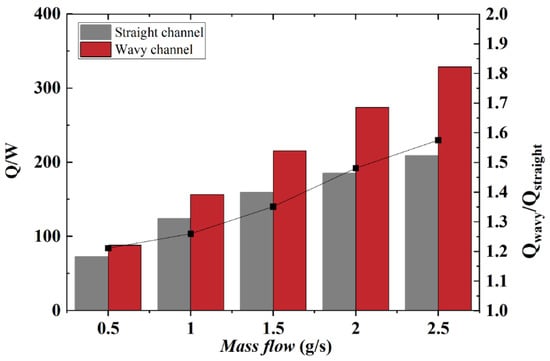
Figure 16.
Comparison of the heat transfer capacity between the straight and wavy channels.
This enhanced heat transfer capacity translates into higher thermal efficiency. On average, the wavy-channel configuration exhibits approximately a 0.11–0.18 efficiency improvement. As shown in Figure 17, the thermal efficiency for both designs demonstrates a consistent decreasing trend with increasing mass flow rate, resulting from the compact flow path design limiting sufficient thermal exchange between fluids at higher flow rates. Peak efficiencies of 0.54 (straight channel) and 0.66 (wavy channel) are achieved at the lowest mass flow rate of 0.5 g/s (Re ≈ 900).
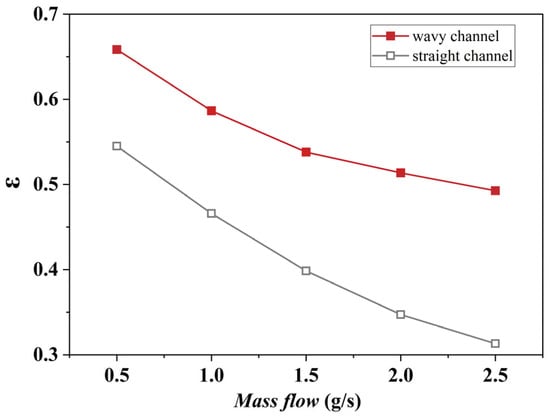
Figure 17.
Thermal efficiency of straight- and wavy-channel configurations.
The PEC was used to assess the overall thermal–hydraulic performance under identical pumping power constraints. As illustrated in Figure 18, the PEC values for hot and cold channels consistently exceeded 1.0 across the tested range, demonstrating the superior comprehensive performance of the wavy design. Notably, the cold channel exhibits higher PEC values than the hot channel. This can be attributed to more pronounced pressure loss augmentation in the hot channel, where the higher flow velocity leads to greater friction. A decreasing trend in PEC with increasing mass flow rate is observed for both streams, with peak values of 1.8 (cold side) and 1.1 (hot side) achieved at the lowest mass flow rate of 0.5 g/s (Re ≈ 900), indicating the most significant performance gain at lower flow rates.
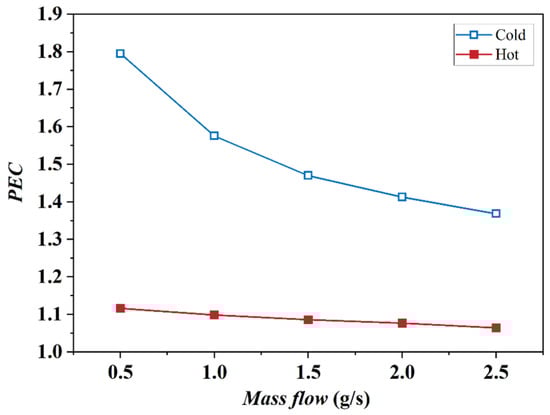
Figure 18.
Variation in PEC with mass flow rate for hot and cold channels.
The average temperature distribution of radial cross-sections in the wavy channel is presented in Figure 19 to evaluate thermal uniformity. The temperature gradient in the hot channel is slightly steeper than that in the cold channel, a result of the higher specific heat capacity of the cold SCO2. The near-linear temperature progression in both channels ensures a nearly uniform temperature difference across the entire heat exchanger, validating the efficiency of the counter-flow design. This profile prevents localized insufficient heat exchange and minimizes the risk of thermal stress concentration, thereby confirming the rationality of the wavy microchannel’s internal structural design.
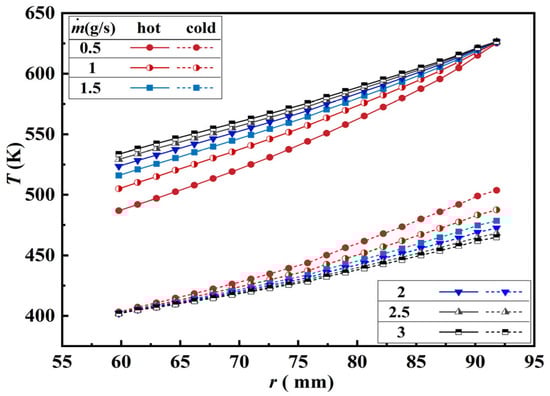
Figure 19.
Average temperature variation of cold and hot SCO2 along radial cross-section.
4.2. Influence of Operating Conditions
4.2.1. Influence of Mass Flow Rate Variation
The influence of mass flow rate on the Nusselt number (Nu), pressure drop (ΔP), and heat transfer efficiency (ε) is depicted in Figure 20 for the range of 0.5–3.0 g/s, corresponding to Reynolds numbers between approximately 900 and 6000. A significant enhancement in heat transfer is observed with increasing flow rate, as the Nu increases by 181% and 129% for the hot and cold channels, respectively. This improvement, however, is accompanied by a substantial hydraulic penalty, with the ΔP surging by more than twentyfold for both streams. As shown in Figure 20a, the cold SCO2 channel consistently exhibits a higher Nu than the hot channel, attributable to its larger Prandtl (Pr) and Reynolds (Re) numbers under the given conditions. The pressure drop in the hot channel is, on average, twice that in the cold channel, as seen in Figure 20b. This discrepancy stems from the flow resistance in the turbulent regime being dominated by inertial forces, which are proportional to fluid density and exhibit a quadratic dependence on velocity. The hot SCO2, with its significantly higher velocity at the same mass flow rate, therefore experiences a greater pressure loss. The thermal efficiency, plotted in Figure 20c, peaks at 0.66 for the lowest mass flow rate of 0.5 g/s. The decrease in the ε underscores the importance of constraining the operating mass flow rate to maintain high heat exchanger efficiency.
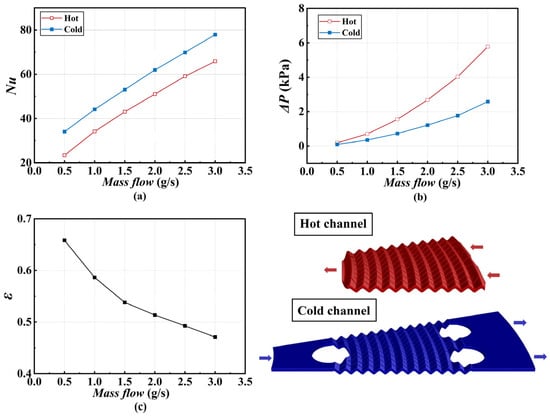
Figure 20.
Variation in (a) Nu, (b) ΔP, and (c) ε with mass flow rate. The arrows indicate the flow direction.
4.2.2. Influence of Inlet Pressure Variation
The effect of inlet pressure was investigated at a constant mass flow rate of 0.5 g/s. The cold channel inlet pressure was varied from 21.5 to 23.5 MPa, while the hot channel inlet pressure was varied from 8 to 10 MPa, with all other parameters held constant. Figure 21a shows the effect of cold SCO2 inlet pressure. An increase in cold-side pressure leads to a slight reduction in its own Nu (0.9%) and ΔP (8.6%), while the hot stream parameters remain virtually constant. The elevated pressure increases the density of the cold SCO2, which in turn lowers its mean velocity. This velocity reduction results in a thicker thermal boundary layer, slightly diminishing Nu, and directly lowers the frictional pressure drop. The thermal–hydraulic performance of the hot stream remains stable because the overall heat transfer is not significantly altered. Consequently, the thermal efficiency shows a negligible maximum improvement of 0.008. The effect of varying the hot stream inlet pressure is shown in Figure 21b. A pressure increase from 8 to 10 MPa causes a 19.8% reduction in the hot channel’s ΔP, again primarily due to the associated decrease in flow velocity from increased density. Interestingly, the Nu of the hot SCO2 does not follow the decreasing trend of velocity. This is because the pressure increase also raises the fluid’s average Prandtl number, which has a compensating, positive effect on heat transfer. The cold channel’s performance remains stable due to consistent heat load. The thermal efficiency in this scenario shows a slight reduction of 0.013.
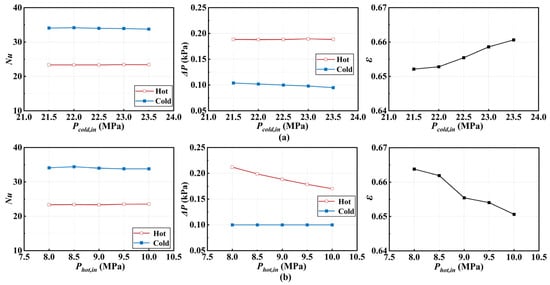
Figure 21.
Variation in Nu, ΔP, and ε with (a) cold SCO2 inlet pressure and (b) hot SCO2 inlet pressure.
4.2.3. Influence of Inlet Temperature Variation
As the cold inlet temperature rises (Figure 22a), the ΔP increases by 16.7% and 46.2% for the hot and cold channels, respectively. This is caused by the reduction in fluid density at higher temperatures, which elevates the mean flow velocity. The Nu of the cold SCO2 increases slightly, while the hot SCO2 Nu shows a slight decrease. This contrasting behavior is a trade-off between two competing effects: the velocity increase, which thins the boundary layer and enhances heat transfer, and the decrease in the Prandtl number, which diminishes it. For the cold stream, the velocity effect dominates; for the hot stream, the Pr reduction effect is stronger. The net result is a maximum 0.023 reduction in efficiency, influenced by the changing mean temperature difference and fluid properties.
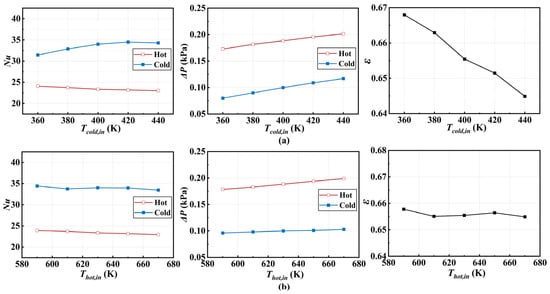
Figure 22.
Variation in Nu, ΔP, and ε with (a) cold SCO2 inlet temperature and (b) hot SCO2 inlet temperature.
Increasing the hot inlet temperature (Figure 22b) leads to a 11.6% and 7.3% rise in ΔP for the hot and cold channels, respectively, again due to the velocity increase from thermal expansion. In this case, the Nu for both channels decreases slightly, indicating that the negative influence of the declining Prandtl number outweighs the positive effect of the higher velocity. The thermal efficiency remains largely unchanged. This is because the driving force for heat transfer, the log-mean temperature difference, increases with the hot inlet temperature, which tends to improve ε. However, this is counterbalanced by a decrease in the specific heat capacity () of the cold SCO2, reducing its heat absorption capacity. These two opposing effects result in a negligible net change in efficiency.
4.3. Overall Thermal–Hydraulic Performance
To holistically evaluate the trade-off between heat transfer and pressure drop, Figure 23 compares the JF factor of the proposed design with various heat exchangers from the literature across a broad Reynolds number range (870–32,000), and the detailed data are provided in Appendix A. A consistent trend of decreasing JF factor with increasing Re is observed across all studies, which is typical as pressure drop penalties tend to become more significant at higher flow rates. Within the Re range of 900–6000, the proposed configuration shows superior performance. Compared to the adaptive heat exchanger [40], it achieves approximately 89% and 44% higher JF factors on the cold and hot sides, respectively. It is noteworthy that the benchmark design from Zhao et al. itself represents a significant advancement, reported to reduce pressure loss by 69% while increasing heat transfer effectiveness by nearly 2% compared to a conventional S-shaped fin recuperator. Furthermore, at an Re of approximately 5000, the proposed heat exchanger outperforms the straight-channel PCHE studied by Meshram et al. [43] by about 3% (cold side) and 12% (hot side). Under the same conditions, it also surpasses the zigzag-channel PCHE (based on correlations from Meshram et al. [43]) by approximately 38% (cold side) and 26% (hot side). In conclusion, the additively manufactured wavy-channel heat exchanger exhibits superior overall thermal–hydraulic performance, effectively leveraging the synergistic benefits of its innovative architecture and the advantageous properties of the SCO2 working fluid.
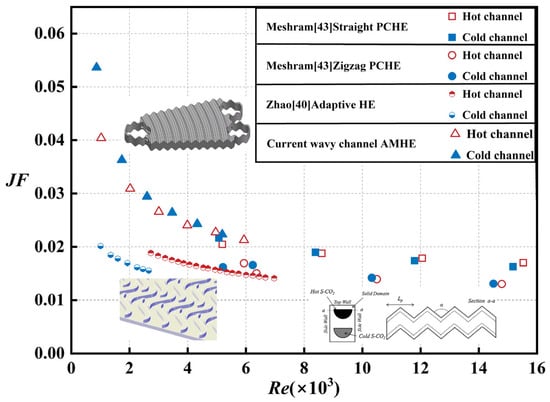
Figure 23.
Comparisons of the JF factor from different studies within the Re of 870–32,000.
4.4. Structural Mechanical Analysis
The heat exchanger operates under high-temperature and high-pressure conditions, coupled with significant temperature gradients and pressure differentials between the cold and hot streams. A comprehensive evaluation of both thermal stress (arising from temperature gradients) and mechanical stress (resulting from pressure loading) is essential to guarantee the operation stability and safety of the heat exchanger.
4.4.1. Thermal Stress Analysis
The wall boundary condition setting in ANSYS-Mechanical is consistent with the setting of the boundary conditions for Fluent to ensure consistency between the structural and fluid domains. The resultant thermal stress distribution at a mass flow rate of 0.5 g/s is presented in Figure 24. The region situated farthest from both the inner and outer boundaries shows minor thermal stress, primarily driven by experiencing the least structural constraint. The average stress was 78.34 MPa, which is below the yield strength of Inconel 617 at the investigated temperature. However, a local maximum stress of 584.28 MPa was identified at the fin root. This concentration arises from a combination of geometric discontinuity and the pronounced temperature difference between the fin and the main substrate. While this peak stress remains below the material’s ultimate tensile strength, it has the potential to initiate localized plastic deformation over prolonged cycles.
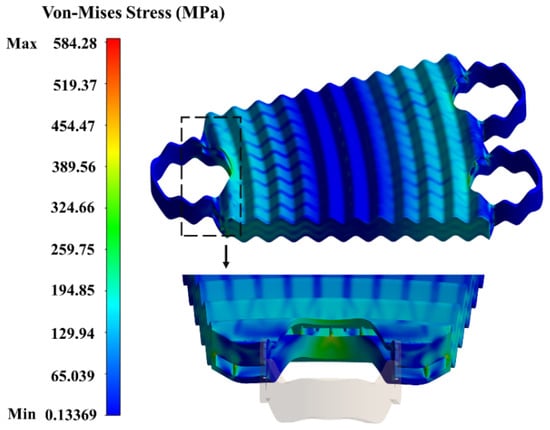
Figure 24.
Thermal stress distribution of computational domain.
4.4.2. Mechanical Stress Analysis
The mechanical stress distribution resulting from pressure loading is shown in Figure 25. In contrast to the thermal stress, the mechanical stress is more uniformly distributed, a consequence of the relatively constant pressure differential applied across the channel walls. Owing to the significantly higher operating pressure of the cold SCO2 stream, the mechanical stress on the cold channel walls and ribs is 47.6% higher than on the hot channel. The stress exhibits a radially periodic pattern, with local concentrations occurring at the peak regions of the wavy channels. At the design pressure, the average mechanical stress is 41.27 MPa, with a local maximum of 424.64 MPa observed at the root of a cold-side fin.
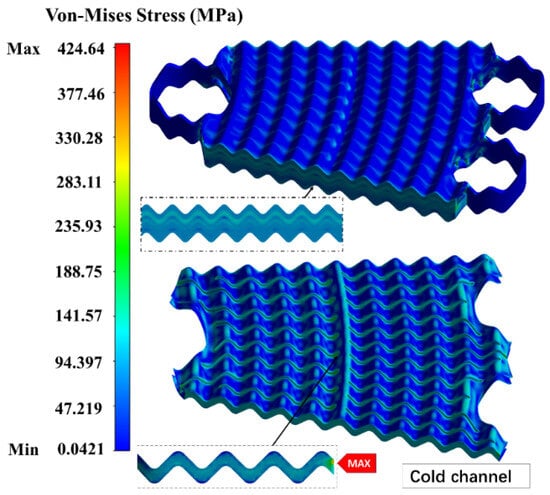
Figure 25.
Mechanical stress distribution of computational domain.
4.4.3. Total Stress Analysis
The total stress distribution under combined thermal and mechanical loads is presented in Figure 26. The results indicate that the total stress distribution is similar to the thermal stress distribution from the temperature load alone, both characterized by higher stress levels at the inner and outer regions and lower stress in the intermediate zone. The primary stress concentration zones remain at the fin roots and at the sharp corners of the heat exchanger. Under the operating conditions of a 0.5 g/s mass flow rate and 22.5 MPa pressure, the average thermal stress is 90.37 MPa, which remains below the yield strength of Inconel 617. A comparison of the average equivalent stress and deformation under individual and combined loads is presented in Figure 27. The thermal stress is approximately 1.9 times greater than the mechanical stress under the investigated conditions, and the overall deformation is also primarily attributable to thermal expansion. It follows that thermal stress is the critical factor governing total structural integrity. Furthermore, while the thermal stresses in the cold and hot channels are comparable, the cold channel is subjected to higher mechanical stress due to its higher operating pressure. Consequently, the cold channel constitutes a critical region for the overall structural stability of the heat exchanger in the SCO2 Brayton cycle, necessitating special attention during design.
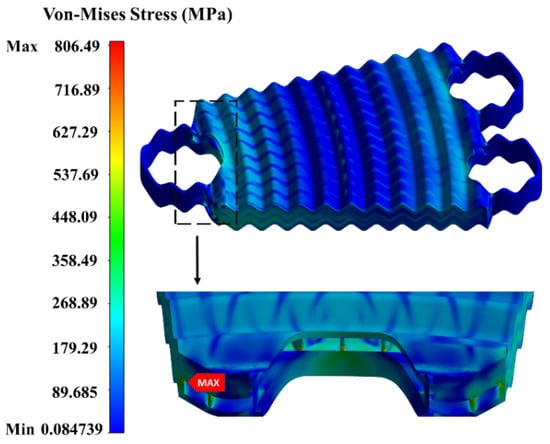
Figure 26.
Total stress distribution of computational domain.
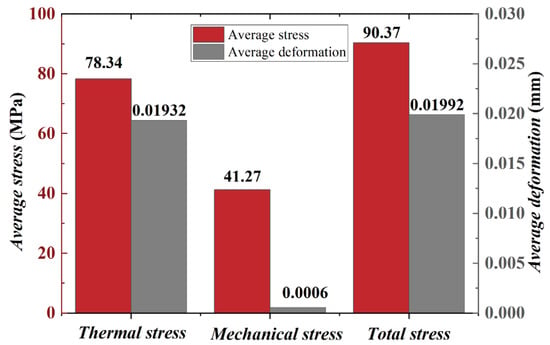
Figure 27.
Relationship between thermal stress, mechanical stress, and total stress.
4.5. Future Work
This study confirms adequate safety margins of the proposed design under steady-state conditions. However, several critical aspects warrant further investigation to advance this technology toward practical application. First, given that the recuperator in SCO2 Brayton cycles is subject to cyclic thermal–mechanical loading during start-up/shut-down and load-following transients, a comprehensive fatigue and durability assessment is essential to evaluate long-term service life. Second, direct experimental validation of the heat exchanger with SCO2 is a necessary step to corroborate the numerical findings and is planned as the next phase of this research. Furthermore, the proposed heat exchanger will also be integrated into a complete SCO2 cycle thermodynamic model for system-level and transient thermal–hydraulic analysis. Finally, targeted experimental investigations on fouling are planned to quantify the anti-fouling performance under realistic conditions, and systematic optimization of wavy geometry parameters will be pursued to further enhance thermal–hydraulic performance.
5. Conclusions
This study proposed and numerically investigated a novel additively manufactured annular heat exchanger incorporating wavy microchannels and rib structures. Through fluid–thermal–mechanical coupling numerical simulations, the thermal–hydraulic performance and mechanical integrity of the heat exchanger were systematically evaluated. The main findings are summarized as follows:
- (1)
- The wavy-channel configuration achieves a remarkable compactness of 1670 m2/m3, representing an improvement of 18.7% over a straight-channel AM design and 29% over a PCHE. The wavy geometry enhances heat transfer by up to 58% relative to straight channels, while also yielding a 0.11–0.18 improvement in thermal efficiency.
- (2)
- As the Reynolds number ranges from about 900 to 6000, the Nusselt number increases by 181% (hot channel) and 129% (cold channel), albeit at the cost of a twentyfold increase in pressure drop. Thermal effectiveness peaks (ε = 0.66) at the lowest mass flow rate of 0.5 g/s and declines with increasing flow rate. Compared to reference designs, including straight PCHE, adaptive flow path AM heat exchanger, and zigzag PCHE, the overall performance of the proposed design increases by 12–44% for the hot channel and 3–89% for the cold channel.
- (3)
- The structural analysis reveals that thermal stress is the dominant stress source, with a magnitude approximately 1.9 times that of the mechanical stress. The primary stress concentration zones are located at the fin roots and sharp corners. The cold channel, subjected to both significant thermal stress and higher mechanical stress from its elevated operating pressure, is identified as the critical region requiring careful attention in design.
Author Contributions
Conceptualization, Y.R.; methodology, X.W. and J.H.; software, X.W.; validation, X.W.; formal analysis, X.W.; investigation, J.H.; resources, K.Y.; data curation, X.W.; writing—original draft preparation, X.W.; writing—review and editing, Y.Z., K.Y. and Y.R.; visualization, J.H.; supervision, Y.R.; project administration, Y.R.; funding acquisition, Y.R. All authors have read and agreed to the published version of the manuscript.
Funding
The authors acknowledge the support from the National Natural Science Foundation of China (No. W2433143 and No. 11972230), the Science and Technology Commission of Shanghai Municipality Project (No. 24110712700), and the Shanghai Municipal Commission of Economy and Informatization (GYQJ-2023-1-06).
Data Availability Statement
The original contributions presented in this study are included in the article. Further inquiries can be directed to the corresponding author.
Acknowledgments
The author, Yu Rao, thanks the support from the Shandong Provincial Industrial Leading Talents Project.
Conflicts of Interest
Author Jun Hu was employed by the SPIC China United Gas Turbine Technology Co., Ltd. The remaining authors declare that the research was conducted in the absence of any commercial or financial relationships that could be construed as a potential conflict of interest.
Abbreviations
| Nomenclature | |||
| Constant-pressure specific heat, J/(kg·K) | Greek letters | ||
| Pressure, Pa | Density, kg/m3 | ||
| Velocity, m/s | Dynamic viscosity, Pa·s | ||
| Mass flow rate, kg/s | Thermal conductivity, W/(m·K) | ||
| Average flow cross-sectional area, m2 | Heat transfer efficiency | ||
| Hydraulic diameter, m | Subscripts | ||
| Flow volume, m3 | Solid | ||
| Wetted surface area, m2 | Hot fluid | ||
| Convective heat transfer coefficient, W/(m2·K) | Cold fluid | ||
| Inlet | |||
| Heat flux density, W/m2 | Outlet | ||
| Volume-weighted average temperature, K | Straight channel | ||
| Area-weighted average wall temperature, K | Von-Mises equivalent stress | ||
| Heat transfer area, m2 | |||
| Actual occupied volume, m3 | Non-dimensional parameters | ||
| Enthalpy, J | Nusselt number | ||
| Length of the fluid channel, m | Reynolds number | ||
| Q | Total heat exchange, W | Prandtl number | |
| Sv | Heat exchanger compactness, m2/m3 | Colburn heat transfer factor | |
| Pressure loss, Pa | Fanning friction factor | ||
| Overall performance factor | |||
| Performance evaluation criterion | |||
Appendix A
Table A1.
Comparison of key performance metrics with referenced heat exchanger designs.
Table A1.
Comparison of key performance metrics with referenced heat exchanger designs.
| Heat Exchanger Type | Re | Compactness [m2/m3] | JF Factor (Hot) | JF Factor (Cold) | Thermal Efficiency |
|---|---|---|---|---|---|
| Straight PCHE [43] | 5000–26,000 | 1285 | 0.016–0.020 | 0.015–0.022 | 0.59 |
| Zigzag PCHE [43] | 5000–32,000 | 1484 | 0.011–0.015 | 0.010–0.017 | 0.74 |
| Adaptive-flow S-fin [40] | 1000–7000 | - | 0.014–0.019 | 0.016–0.020 | 0.79–0.86 |
| Straight AM | 900–6000 | 1409 | 0.021–0.036 | 0.018-0.030 | 0.31–0.55 |
| Current wavy AM | 900–6000 | 1670 | 0.021-0.040 | 0.022-0.054 | 0.49–0.66 |
References
- Ploumen, P.; Stienstra, G.; Kamphuis, H. Reduction of CO2 emissions of coal fired power plants by optimizing steam water cycle. Energy Procedia 2011, 4, 2074–2081. [Google Scholar] [CrossRef]
- Feher, E.G. The supercritical thermodynamic power cycle. Energy Convers. 1968, 8, 85–90. [Google Scholar] [CrossRef]
- Ahn, Y.; Bae, S.J.; Kim, M.; Cho, S.K.; Baik, S.; Lee, J.I.; Cha, J.E. Review of supercritical CO2 power cycle technology and current status of research and development. Nucl. Eng. Technol. 2015, 47, 647–661. [Google Scholar] [CrossRef]
- Wright, S.A.; Parma, J.; Suo-Anttila, A.J.; Al Rashdan, A.; Tsvetkov, P.V.; Vernon, M.E.; Fleming, D.D.; Rochau, G.E. Supercritical CO2 Direct Cycle Gas Fast Reactor (SC-GFR) Concept; Sandia National Laboratories (SNL): Albuquerque, NM, USA; Livermore, CA, USA, 2011. [Google Scholar]
- Dostal, V.; Hejzlar, P.; Driscoll, M.J. High-Performance Supercritical Carbon Dioxide Cycle for Next-Generation Nuclear Reactors. Nucl. Technol. 2006, 154, 265–282. [Google Scholar] [CrossRef]
- Iverson, B.D.; Conboy, T.M.; Pasch, J.J.; Kruizenga, A.M. Supercritical CO2 Brayton cycles for solar-thermal energy. Appl. Energy 2013, 111, 957–970. [Google Scholar] [CrossRef]
- Wang, D.; Wang, X.; Xue, M.; Lu, S.; Chen, C. Research progress of supercritical CO2 power cycle in gas turbine waste heat recovery. Int. J. Heat Fluid Flow 2025, 115, 109874. [Google Scholar] [CrossRef]
- Wan, Y.; Wu, C.; Liu, Y.; Liu, C.; Li, H.; Wang, J. A technical feasibility study of a liquid carbon dioxide energy storage system: Integrated component design and off-design performance analysis. Appl. Energy 2023, 350, 121797. [Google Scholar] [CrossRef]
- Liu, H.; Zhang, Y.; Xu, Q.; Han, W.; Shen, J. A Carnot battery system integrating Ca(OH)2/CaO thermochemical energy storage and supercritical CO2 cycles for long-term energy storage and residential heat supply. Appl. Energy 2025, 377, 124535. [Google Scholar] [CrossRef]
- Saeed, M.; Alawadi, K.; Kim, S.C. Performance of Supercritical CO2 Power Cycle and Its Turbomachinery with the Printed Circuit Heat Exchanger with Straight and Zigzag Channels. Energies 2020, 14, 62. [Google Scholar] [CrossRef]
- Kwon, J.S.; Son, S.; Heo, J.Y.; Lee, J.I. Compact heat exchangers for supercritical CO2 power cycle application. Energy Convers. Manag. 2020, 209, 112666. [Google Scholar] [CrossRef]
- Jacob, F.; Rolt, A.; Sebastiampillai, J.; Sethi, V.; Belmonte, M.; Cobas, P. Performance of a Supercritical CO2 Bottoming Cycle for Aero Applications. Appl. Sci. 2017, 7, 255. [Google Scholar] [CrossRef]
- Yang, Y.; Shi, L.; Yao, Y.; Zhang, Y.; He, J.; Tian, H.; Pei, G.; Shu, G. Supercritical CO2 Brayton cycle for space exploration: New perspectives base on power density analysis. Energy 2024, 313, 133772. [Google Scholar] [CrossRef]
- Li, J.; Li, Y.; Li, X. Performance analysis and enhancement of onboard supercritical CO2 closed Brayton cycles for hypersonic vehicles. Int. J. Heat Fluid Flow 2025, 116, 109957. [Google Scholar] [CrossRef]
- Mecheri, M.; Le Moullec, Y. Supercritical CO2 Brayton cycles for coal-fired power plants. Energy 2016, 103, 758–771. [Google Scholar] [CrossRef]
- Chen, J.; Du, W.; Cheng, K.; Li, X.; Huai, X.; Guo, J.; Lv, P.; Dong, H. Advances in thermal–hydraulic performance and dynamic behavior of supercritical CO2 in printed circuit heat exchangers: Mechanisms, innovations, and future perspectives. Int. J. Heat Fluid Flow 2025, 116, 109953. [Google Scholar] [CrossRef]
- Johnston, T.; Levy, W.; Rumbold, S. Application of Printed Circuit Heat Exchanger Technology Within Heterogeneous Catalytic Reactors; American Institute of Chemical Engineers: New York, NY, USA, 2001. [Google Scholar]
- Kim, I.H. Experimental and Numerical Investigations of Thermal-Hydraulic Characteristics for the Design of a Printed Circuit Heat Exchanger (PCHE) in HTGRs. Doctoral Dissertation, Korea Advanced Institute of Science and Technology, Daejeon, Republic of Korea, 2012. [Google Scholar]
- Chu, W.; Li, X.; Ma, T.; Chen, Y.; Wang, Q. Experimental investigation on SCO2-water heat transfer characteristics in a printed circuit heat exchanger with straight channels. Int. J. Heat Mass Transf. 2017, 113, 184–194. [Google Scholar] [CrossRef]
- Zhang, H.; Guo, J.; Huai, X.; Cheng, K.; Cui, X. Studies on the thermal-hydraulic performance of zigzag channel with supercritical pressure CO2. J. Supercrit. Fluids 2019, 148, 104–115. [Google Scholar] [CrossRef]
- Zilio, G.; Moura, M.R.; Dos Santos, F.J.; Possamai, T.S.; Mortean, M.V.V. Nusselt number analysis of printed circuit heat exchangers with straight and zigzag channels. Int. J. Heat Fluid Flow 2024, 107, 109395. [Google Scholar] [CrossRef]
- Aneesh, A.M.; Sharma, A.; Srivastava, A.; Chaudhury, P. Effects of wavy channel configurations on thermal-hydraulic characteristics of Printed Circuit Heat Exchanger (PCHE). Int. J. Heat Mass Transf. 2018, 118, 304–315. [Google Scholar] [CrossRef]
- Khoshvaght-Aliabadi, M.; Ghodrati, P.; Mortazavi, H.; Kang, Y.T. Predicting heat transfer and flow features of supercritical CO2 in printed circuit heat exchangers with novel wavy minichannels. Int. J. Heat Mass Transf. 2022, 196, 123232. [Google Scholar] [CrossRef]
- Lei, Y.; Chen, Z. Cooling heat transfer and pressure drop of supercritical CO2 in wavy microchannels with consistent and opposite crests and troughs. Int. J. Refrig. 2020, 109, 64–81. [Google Scholar] [CrossRef]
- Tsuzuki, N.; Kato, Y.; Ishiduka, T. High performance printed circuit heat exchanger. Appl. Therm. Eng. 2007, 27, 1702–1707. [Google Scholar] [CrossRef]
- Saeed, M.; Kim, M.-H. Thermal-hydraulic analysis of sinusoidal fin-based printed circuit heat exchangers for supercritical CO2 Brayton cycle. Energy Convers. Manag. 2019, 193, 124–139. [Google Scholar] [CrossRef]
- Kim, D.E.; Kim, M.H.; Cha, J.E.; Kim, S.O. Numerical investigation on thermal–hydraulic performance of new printed circuit heat exchanger model. Nucl. Eng. Des. 2008, 238, 3269–3276. [Google Scholar] [CrossRef]
- Kimball, K.J.; Clementoni, E.M. Supercritical Carbon Dioxide Brayton Power Cycle Development Overview. In Proceedings of the ASME Turbo Expo 2012: Turbine Technical Conference and Exposition, Copenhagen, Denmark, 11–15 June 2012; Manufacturing Materials and Metallurgy; Marine; Microturbines and Small Turbomachinery; Supercritical CO2 Power Cycles. American Society of Mechanical Engineers: Copenhagen, Denmark, 2012; Volume 5, pp. 931–940. [Google Scholar]
- Dyga, R. Investigation of the Effectiveness of a Compact Heat Exchanger with Metal Foam in Supercritical Carbon Dioxide Cooling. Energies 2025, 18, 4736. [Google Scholar] [CrossRef]
- Jiang, Y.; Liese, E.; Zitney, S.E.; Bhattacharyya, D. Design and dynamic modeling of printed circuit heat exchangers for supercritical carbon dioxide Brayton power cycles. Appl. Energy 2018, 231, 1019–1032. [Google Scholar] [CrossRef]
- Cai, H.; Liang, S.; Guo, C.; Wang, T.; Zhu, Y.; Jiang, Y. Numerical investigation on heat transfer of supercritical carbon dioxide in the microtube heat exchanger at low reynolds numbers. Int. J. Heat Mass Transf. 2020, 151, 119448. [Google Scholar] [CrossRef]
- Krishna, A.B.; Jin, K.; Ayyaswamy, P.S.; Catton, I.; Fisher, T.S. Modeling of Supercritical CO2 Shell-and-Tube Heat Exchangers Under Extreme Conditions. Part I: Correlation Development. J. Heat Transf. 2022, 144, 051902. [Google Scholar] [CrossRef]
- Krishna, A.B.; Jin, K.; Ayyaswamy, P.S.; Catton, I.; Fisher, T.S. Modeling of Supercritical CO2 Shell-and-Tube Heat Exchangers Under Extreme Conditions: Part II: Heat Exchanger Model. J. Heat Transf. 2022, 144, 051903. [Google Scholar] [CrossRef]
- Jin, K.; Krishna, A.B.; Wong, Z.; Ayyaswamy, P.S.; Catton, I.; Fisher, T.S. Thermohydraulic experiments on a supercritical carbon dioxide–air microtube heat exchanger. Int. J. Heat Mass Transf. 2023, 203, 123840. [Google Scholar] [CrossRef]
- Zhao, H.; Guo, X.; Guo, W.; Yang, Y.; Lei, X. Experimental study on flow and heat transfer characteristics of supercritical carbon dioxide in 3D printed channels. Int. J. Heat Fluid Flow 2026, 117, 110014. [Google Scholar] [CrossRef]
- Rasouli, E.; Montgomery, C.; Stevens, M.; Rollett, A.D.; Subedi, S.; Mande, C.W.; Narayanan, V. Design and Performance Characterization of an Additively Manufactured Primary Heat Exchanger for sCO2 Waste Heat Recovery Cycles. In Proceedings of the 6th International Symposium on Supercritical CO2 Power Cycles, Pittsburgh, PA, USA, 27–29 March 2018. [Google Scholar]
- Robey, E.; Ramesh, S.; Sabau, A.S.; Abdoli, A.; Black, J.; Straub, D.; Yip, J. Design optimization of an additively manufactured prototype recuperator for supercritical CO2 power cycles. Energy 2022, 251, 123961. [Google Scholar] [CrossRef]
- Li, W.; Yu, G.; Yu, Z. Bioinspired heat exchangers based on triply periodic minimal surfaces for supercritical CO2 cycles. Appl. Therm. Eng. 2020, 179, 115686. [Google Scholar] [CrossRef]
- Ding, M.; Liu, J.; Cheng, W.-L.; Huang, W.-X.; Liu, Q.-N.; Yang, L.; Liu, S.-Y. An adaptive flow path regenerator used in supercritical carbon dioxide Brayton cycle. Appl. Therm. Eng. 2018, 138, 513–522. [Google Scholar] [CrossRef]
- Zhao, J.-W.; Zhao, R.; Nian, Y.-L.; Cheng, W.-L. Experimental study of supercritical CO2 in a vertical adaptive flow path heat exchanger. Appl. Therm. Eng. 2021, 188, 116597. [Google Scholar] [CrossRef]
- Rao, Y.; Zhang, Y.; Xiao, K. Experimental and Numerical Study of Thermal Performance of an Additively Manufactured Microchannel Heat Exchanger. Therm. Sci. Eng. Prog. 2024, 62, 103572. [Google Scholar] [CrossRef]
- Wen, Z.-X.; Lv, Y.-G.; Li, Q.; Zhou, P. Numerical study on heat transfer behavior of wavy channel supercritical CO2 printed circuit heat exchangers with different amplitude and wavelength parameters. Int. J. Heat Mass Transf. 2020, 147, 118922. [Google Scholar] [CrossRef]
- Meshram, A.; Jaiswal, A.K.; Khivsara, S.D.; Ortega, J.D.; Ho, C.; Bapat, R.; Dutta, P. Modeling and analysis of a printed circuit heat exchanger for supercritical CO2 power cycle applications. Appl. Therm. Eng. 2016, 109, 861–870. [Google Scholar] [CrossRef]
- Bennett, K.; Chen, Y. One-way coupled three-dimensional fluid-structure interaction analysis of zigzag-channel supercritical CO2 printed circuit heat exchangers. Nucl. Eng. Des. 2020, 358, 110434. [Google Scholar] [CrossRef]
- Cui, X.; Guo, J.; Huai, X.; Zhang, H.; Cheng, K.; Zhou, J. Numerical investigations on serpentine channel for supercritical CO2 recuperator. Energy 2019, 172, 517–530. [Google Scholar] [CrossRef]
- Saeed, M.; Kim, M.-H. Thermal and hydraulic performance of SCO2 PCHE with different fin configurations. Appl. Therm. Eng. 2017, 127, 975–985. [Google Scholar] [CrossRef]
- Ren, Z. Investigation on local convection heat transfer of supercritical CO2 during cooling in horizontal semicircular channels of printed circuit heat exchanger. Appl. Therm. Eng. 2019, 157, 113697. [Google Scholar] [CrossRef]
- Wang, J.; Yan, X.; Boersma, B.J.; Lu, M.; Liu, X. Numerical investigation on the Thermal-hydraulic performance of the modified channel supercritical CO2 printed circuit heat exchanger. Appl. Therm. Eng. 2023, 221, 119678. [Google Scholar] [CrossRef]
- Ishizuka, T.; Kato, Y.; Muto, Y.; Nikitin, K.; Lam, N. Thermal-hydraulic characteristics of a printed circuit heat exchanger in a supercritical CO2 loop. Bull. Res. Lab. Nucl. React. 2006, 30, 109–116. Available online: https://www.researchgate.net/publication/284890640 (accessed on 19 January 2026).
- Hou, Y.; Tang, G. Thermal-Hydraulic-Structural Analysis and Design Optimization for Micron-Sized Printed Circuit Heat Exchanger. J. Therm. Sci. 2019, 28, 252–261. [Google Scholar] [CrossRef]


Disclaimer/Publisher’s Note: The statements, opinions and data contained in all publications are solely those of the individual author(s) and contributor(s) and not of MDPI and/or the editor(s). MDPI and/or the editor(s) disclaim responsibility for any injury to people or property resulting from any ideas, methods, instructions or products referred to in the content. |
© 2026 by the authors. Licensee MDPI, Basel, Switzerland. This article is an open access article distributed under the terms and conditions of the Creative Commons Attribution (CC BY) license.