Article

Numerical and Experimental Investigation of Damage and Failure Analysis of Aero-Engine Electronic Controllers Under Thermal Shock

1
School of Energy and Power Engineering, Beihang University, Beijing 100191, China
2
AVIC China Aero-Polytechnology Establishment, Beijing 100028, China
3
School of Aerospace Engineering, Xiamen University, Xiamen 361102, China
*
Authors to whom correspondence should be addressed.
Aerospace 2025, 12(7), 636; https://doi.org/10.3390/aerospace12070636
Submission received: 3 June 2025 / Revised: 12 July 2025 / Accepted: 15 July 2025 / Published: 16 July 2025
(This article belongs to the Section Aeronautics)

Abstract

The Engine Electronic Controller (EEC), as the core component of an aircraft engine control system, is vulnerable to rapid failure when exposed to thermal shock during engine fire incidents, potentially leading to catastrophic aviation accidents. To address this issue, this study conducts both numerical simulations and experimental investigations to evaluate the thermal performance of the EEC under thermal shock conditions, exploring the weaknesses of the EEC chassis under high-temperature thermal shock and the damage to important internal electronic components. A three-dimensional finite element model of the EEC was established to simulate its behavior under a thermal shock of 1100 °C. Simulation results reveal that the aluminum alloy chassis wall cannot withstand the extreme thermal load, resulting in failure of the internal electronic components within the first 5 min of exposure, thereby rendering the EEC inoperative. In contrast, when the chassis wall is made of stainless steel, all components and internal electronics remain functional throughout the initial 5 min thermal shock period. Experimental results show that the temperature evolution and component failure patterns under both scenarios align well with the simulation outcomes, thus validating the model’s accuracy.

1. Introduction

With the rapid advancement of the aviation industry, aircraft engine control systems are becoming increasingly digitized and integrated. The Full Authority Digital Engine Control (FADEC) system has been widely adopted in most modern aircraft engines [1,2]. The Engine Electronic Controller (EEC), as the core component of the FADEC system, is responsible for receiving and processing signals from various sensors and switches. It employs advanced control algorithms to generate control commands and transmit them to the corresponding mechanical actuators [3,4].
The EEC typically operates in harsh environments characterized by extreme temperatures, vibrations, and electromagnetic interference [5,6,7]. The electronic components within the EEC are susceptible to failure, leading to equipment failure, with temperature being the primary factor responsible for damage, accounting for approximately 55% [8]. In the event of an aircraft engine fire, the EEC may be subjected to a high-temperature thermal shock environment, which can rapidly compromise its functionality. However, if the EEC can sustain critical functions, such as shutting off power and fuel lines and transmitting fire condition signals, within the first 5 min of the incident, catastrophic consequences such as explosions or structural failures occurring in the following 10 min due to fire propagation may be prevented [9]. Therefore, studying the thermal performance of the EEC under thermal shock conditions is essential for mitigating losses during aircraft engine fire scenarios.
Currently, extensive research has been conducted on the heat dissipation performance of airborne equipment. For example, Sanchez et al. [10] employed computational fluid dynamics to simulate the impact of cooling gas flow rate and equipment spacing on the thermal performance of aircraft avionics bays. To address the issue of temperature rise caused by the dense arrangement of electronic devices in aircraft cabins, Li et al. [11] developed a cabin temperature prediction model based on measured data and established thermal design requirements for airborne equipment. Pang et al. [12] proposed a transient thermal model for airborne electronic devices operating in high-altitude flight environments, enabling dynamic temperature predictions through both simulation and experimental approaches. Furthermore, to enhance the thermal management capability of airborne systems, Pang et al. [13] introduced a skin-type heat exchanger and investigated its thermal dissipation characteristics.
Given that airborne equipment frequently operates in extreme environments, recent studies have begun to explore thermal performance under such conditions. Xu et al. [14] examined the temperature distribution of airborne equipment using liquid cooling techniques in hypergravity environments, revealing that hypergravity significantly increases the risk of overheating. Patel et al. [15] investigated the effects of natural convection within sealed enclosures under low-pressure conditions and clarified the heat transfer behavior of airborne electronic housings in such scenarios. However, most existing research has concentrated on internal heat generation during normal operation, while limited attention has been paid to temperature rise caused by external thermal shock events.
This study focuses on the EEC and conducts both numerical simulations and experimental validations to evaluate its thermal performance under thermal shock conditions. By analyzing the complex heat flow distribution and component temperature cloud maps across various thermal shock scenarios, the study accurately identifies the vulnerabilities of the EEC and the damage sustained by critical internal electronic components during high-temperature thermal shocks. This research provides a theoretical foundation for the thermal structural design and performance optimization of the EEC, which is essential for reducing the risk of flight accidents caused by engine fires.

2. Theoretical Fundamentals

There are three fundamental modes of heat transfer: conduction, convection, and radiation [16]. Heat conduction refers to the transfer of thermal energy that occurs when objects at different temperatures are in direct physical contact. This process is described by Fourier’s law of heat conduction, which is expressed as follows:
Q F = k A Δ T Δ x
where QF is the heat flow rate; k is the thermal conductivity; A is the cross-sectional area perpendicular to the direction of heat flow; ∆T is the temperature difference; and ∆x is the thickness of the material.
Thermal convection refers to the process of heat transfer between a moving fluid and adjacent solid surfaces, driven by temperature gradients. The governing principle of convective heat transfer is described by Newton’s law of cooling:
Q N = h A ( T s T f )
where QN represents the convective heat transfer rate, h is the convective heat transfer coefficient, Ts is the temperature of the cooling wall surface, and Tf is the fluid temperature.
Thermal radiation refers to the process of heat exchange between objects above absolute zero through the emission and absorption of electromagnetic radiation. The governing principle of radiative heat transfer is described by the Stefan–Boltzmann law:
Q S = ε σ A ( T 4 T s u r r 4 )
where QS represents the radiation heat transfer rate; ε denotes the surface emissivity; σ = 5.67 × 10⁻⁸ W/(m2 k4) is the Stefan–Boltzmann constant; T is the absolute temperature of the radiating surface; and Tsurr is the absolute temperature of the surroundings.
Significant differences exist in the relative contributions of the three heat transfer modes depending on the cooling scheme employed in electronic devices [17,18]. In conventional systems utilizing forced air cooling, the effect of thermal radiation is typically minimal and subject to multiple influencing factors; hence, it is often disregarded in theoretical analyses [19,20]. However, under natural convection conditions, both thermal radiation and convection play substantial roles and must be considered simultaneously [21,22]. Although the EEC chassis primarily relies on forced air cooling, its sealed internal structure—housing the circuit board within an enclosed space—necessitates the inclusion of both convective and radiative heat transfer mechanisms in the thermal analysis.

3. Numerical Analysis

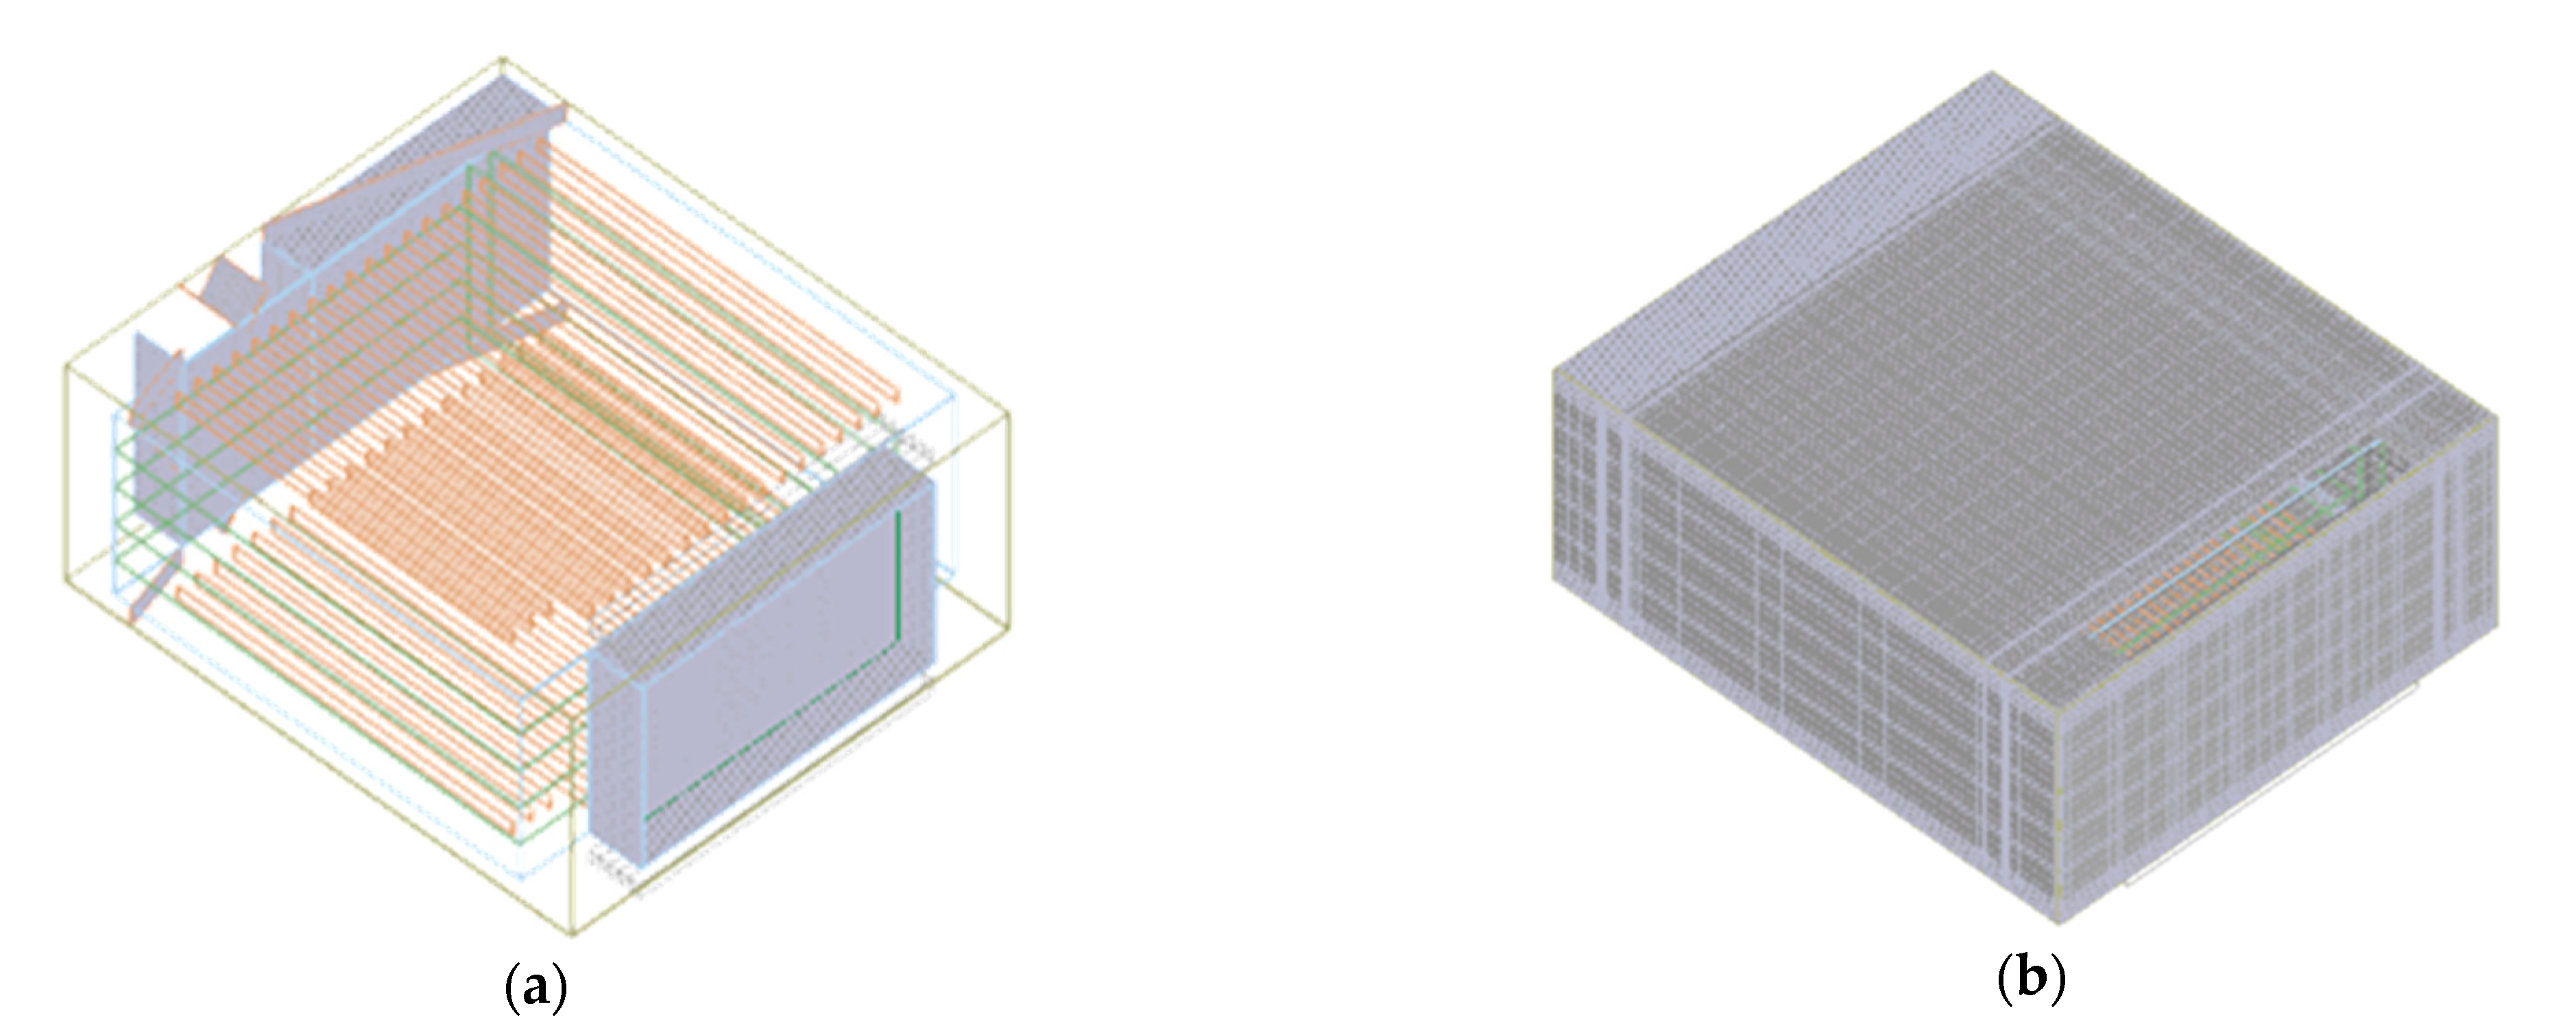
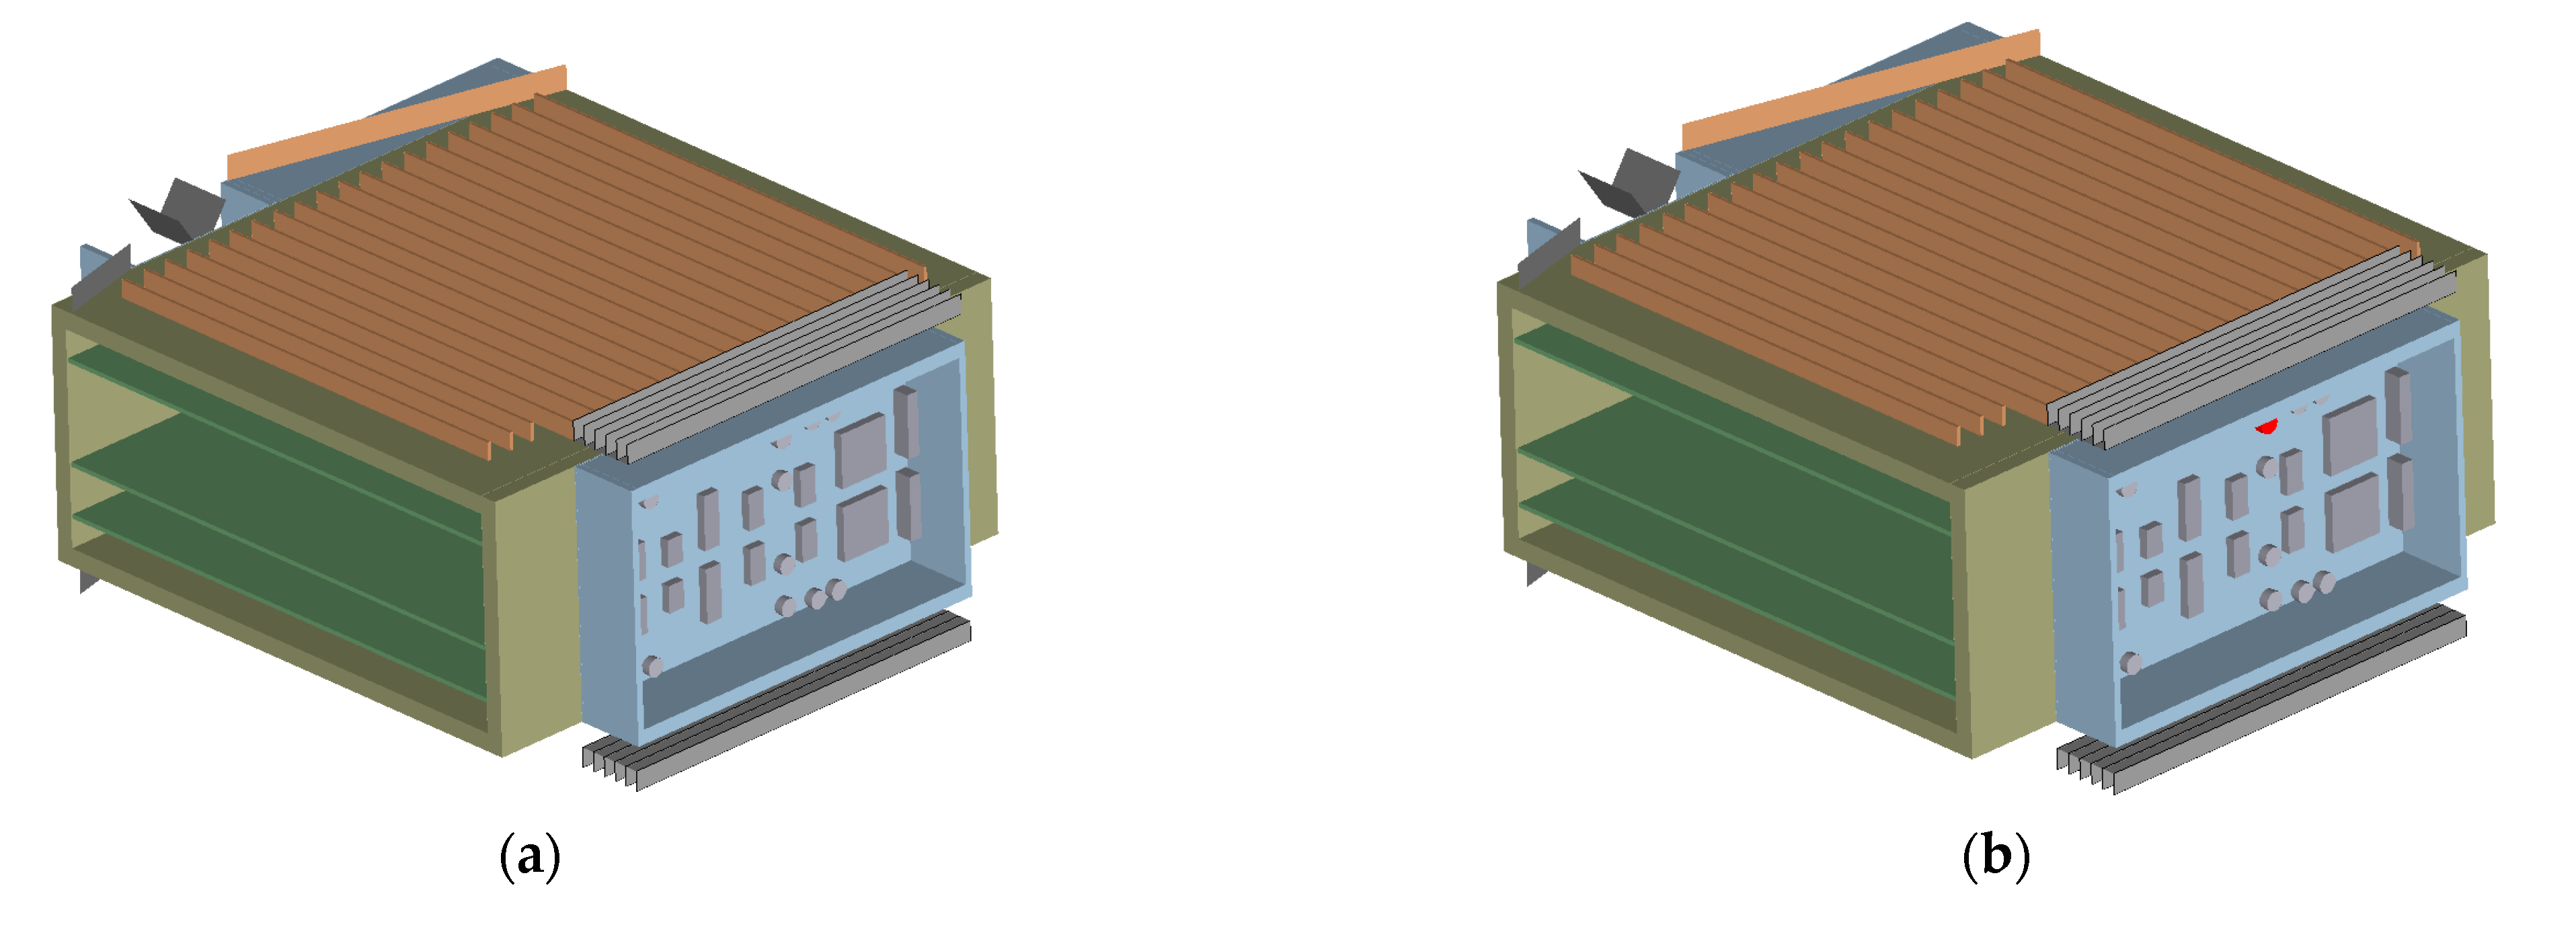
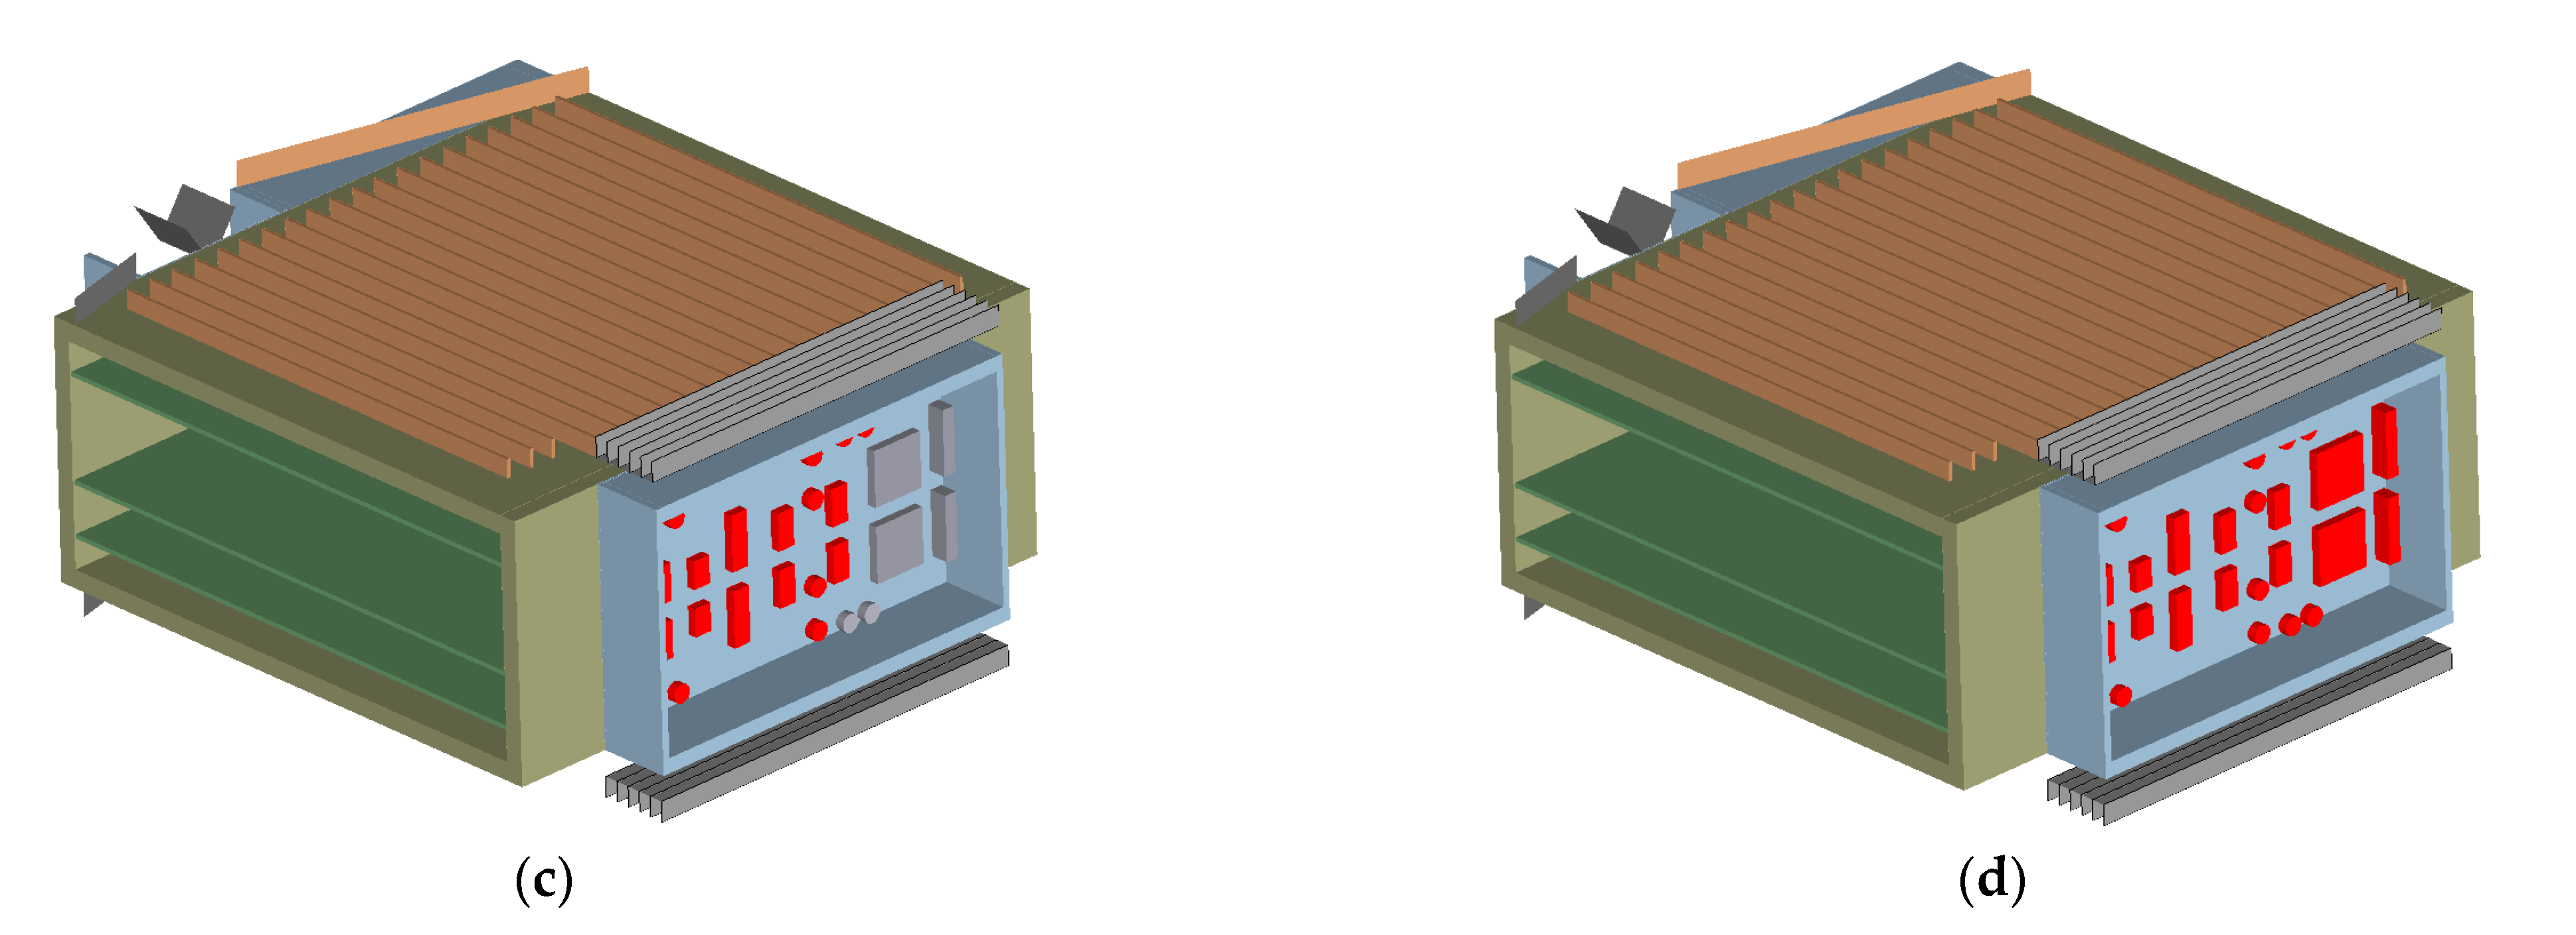
3.1. EEC 3D Model Construction

This study focuses on the EEC of a specific aircraft model, which comprises an external housing and an internal structural assembly. The EEC enclosure exhibits an irregular rectangular geometry, with approximate external dimensions of 390 × 337 × 168 mm, and is equipped with a 40 mm diameter air inlet to facilitate forced air cooling. The internal structure primarily consists of airflow channels and four components. A scaled model of the EEC housing was developed using SolidWorks 2021 3D modeling software, as illustrated in Figure 1. Due to the geometrical complexity of the EEC housing, incorporating all detailed features into the 3D model can lead to increased modeling difficulty, hinder mesh generation, and negatively affect convergence during numerical simulations. Therefore, model simplification is necessary. To ensure that the heat transfer performance of the model remains unaffected, it is essential to retain structures that significantly influence heat transfer, such as deflectors and gas flow channels. Conversely, intricate structures such as bolt patterns, chamfers, and cable arrangements have a minimal effect on the model’s heat transfer performance and can thus be simplified.
The circuit board components within the EEC are critical to its operational functionality. Therefore, accurate modeling of the circuit board is critical for assessing the thermal performance of the EEC under thermal shock conditions. The circuit board is primarily divided into three sections: circuit board 1 and circuit board 2 positioned on either side of the chassis, and circuit boards 3–5 located within component 3, as depicted in Figure 1d–f. Components 1 and 2 are closed structures that do not engage in direct thermal exchange with the cooling gas, whereas component 3 is a semi-closed structure that facilitates heat exchange with the cooling gas. Due to the small size of electronic components such as capacitors and resistors, their influence on the model is negligible. Consequently, these components are simplified in the thermal model, with only the core elements, such as integrated chips, retained to preserve modeling accuracy without introducing unnecessary complexity [23].

3.2. Modeling

The 3D model of the EEC, developed in Section 3.1, was imported into the Icepak 2020 simulation software for thermal shock analysis. Icepak employs the finite volume method (FVM) to solve the conservation laws of fluid flow and heat transfer, modeling the fluid using the continuity equation (Equation (4)), momentum equation (Equation (5)), and energy equation (Equation (6)) [24]:
𝛻 v = 0
𝜕 ( ρ v ) 𝜕 t + 𝛻 ( ρ v v ) = 𝛻 p + 𝛻 ( μ 𝛻 v ) + ρ g + F
𝜕 ( ρ h ) 𝜕 t + 𝛻 ( ρ v h ) = 𝛻 ( k 𝛻 T ) + S h
where ρ is density, t represents time, v is flow velocity, p is air pressure, μ represents dynamic viscosity, g is gravitational acceleration, F is momentum source term, h is enthalpy, k is thermal conductivity, and S h is energy source.
The upper and lower walls of the EEC chassis are constructed from 304 stainless steel to improve the corrosion and impact resistance of the EEC. The remaining components are made from 6061-T6 aluminum alloy to reduce the weight of the EEC, thereby meeting the weight restrictions of the aircraft. The thermophysical properties are detailed in Table 1. The thermophysical properties of 304 stainless steel exhibit significant variations with changes in temperature, as shown in Table 2. The electronic components mounted on the circuit board within the EEC are at least automotive-grade and are designed to operate at temperatures not exceeding approximately 120 °C.
The EEC adopts a forced air-cooling system, with air selected as the cooling medium based on actual operational conditions. The system operates at a gas flow rate of 125 m3/h, a gas temperature of 15.5 °C, an absolute gas pressure of 120 kPa, and a convective heat transfer coefficient of 35 W/(m2·K). The outlet boundary condition is set as pressure outlet, with a pressure value of 101 kPa. The Reynolds number, calculated using the Icepak software for the constructed EEC model, is 242,192, indicating that the fluid flow state during the simulation is turbulent [25]. According to the aviation fire protection test standard ISO 2685 [26], the thermal boundary condition for the thermal shock surface is set at 1100 °C. For the remaining surfaces, thermal boundary conditions are defined as radiative heat transfer at the same temperature, with surface emissivity set to 0.85 for the metallic enclosure. The heat generated by the electronic components within the EEC is negligible compared to the thermal shock and is therefore excluded from the simulation. The initial temperature is set at 20 °C, and the total simulation duration is 15 min, with temperature distribution results for each component of the EEC model collected at 15 s intervals. The specific boundary conditions are illustrated in Figure 2.
The Mesher-HD grid is utilized to mesh the regular components of the EEC model, while irregular structures, such as the guide plate and components on the circuit board, are treated as separate mesh entities using unstructured grids, as depicted in the gray area of Figure 3a. The meshing results are illustrated in Figure 3b, where the minimum alignment ratio of the mesh is 0.39 and the minimum skewness is 0.05. Consequently, the mesh quality of the constructed EEC model is relatively high and satisfies the convergence requirements for numerical simulation.

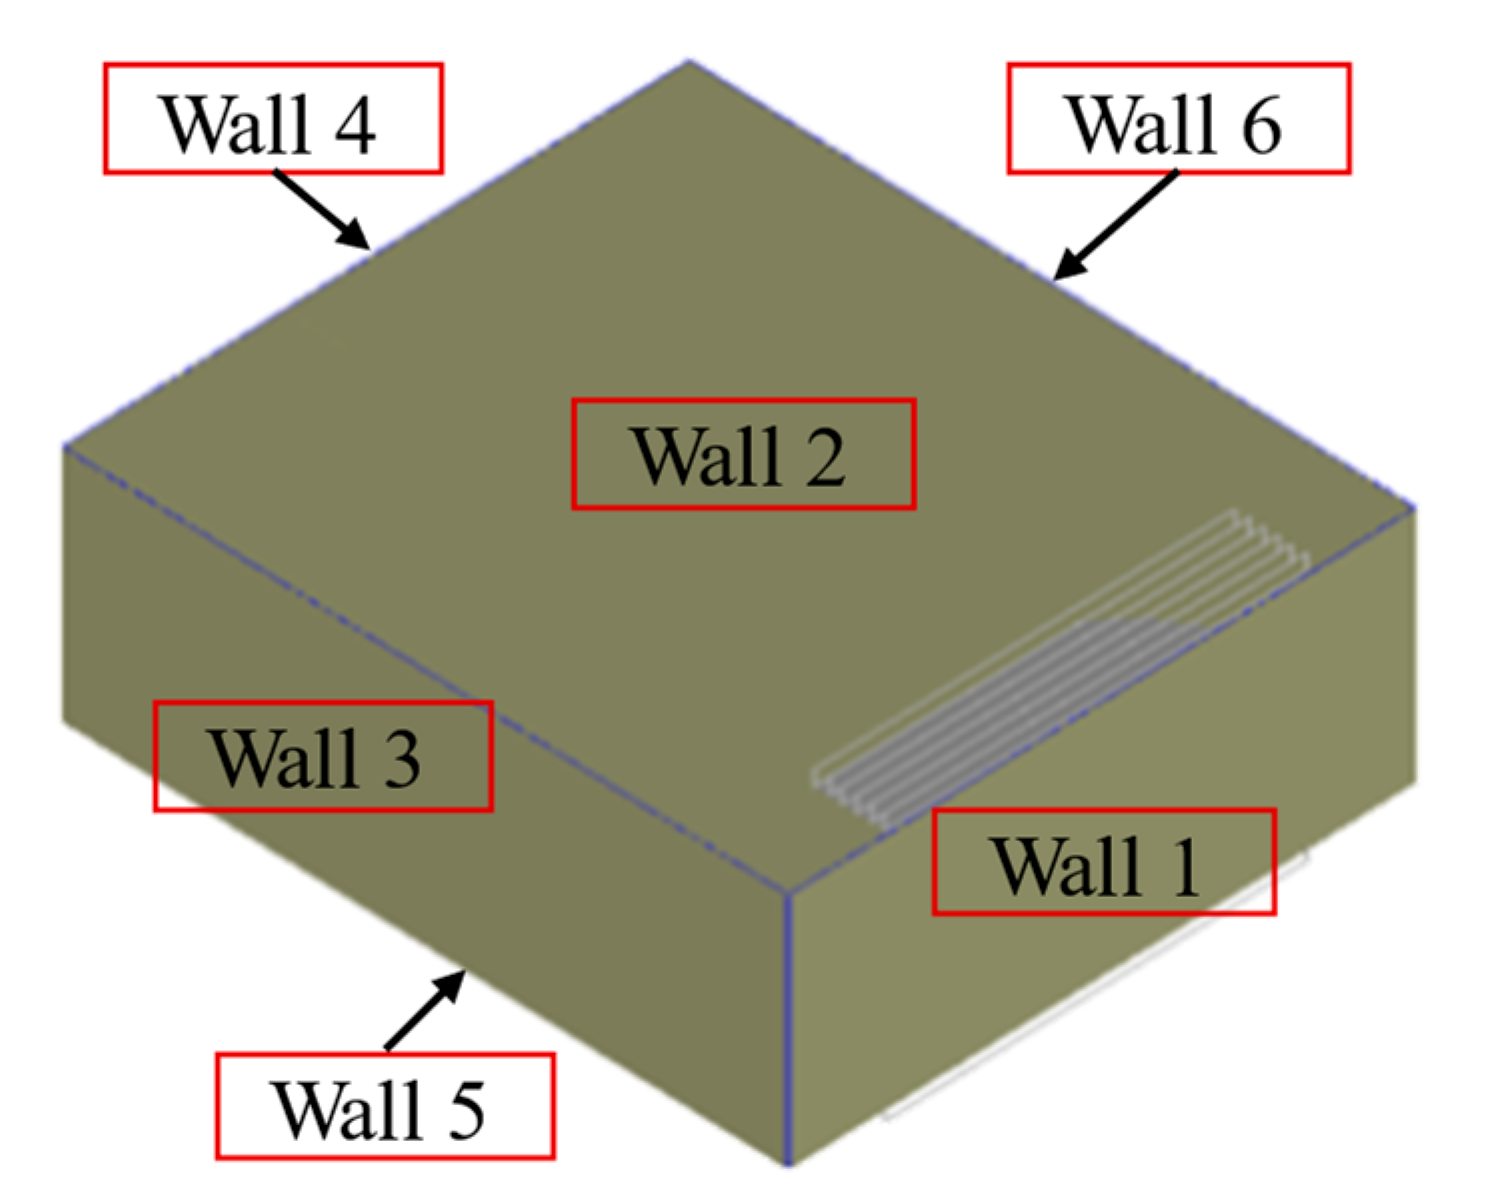
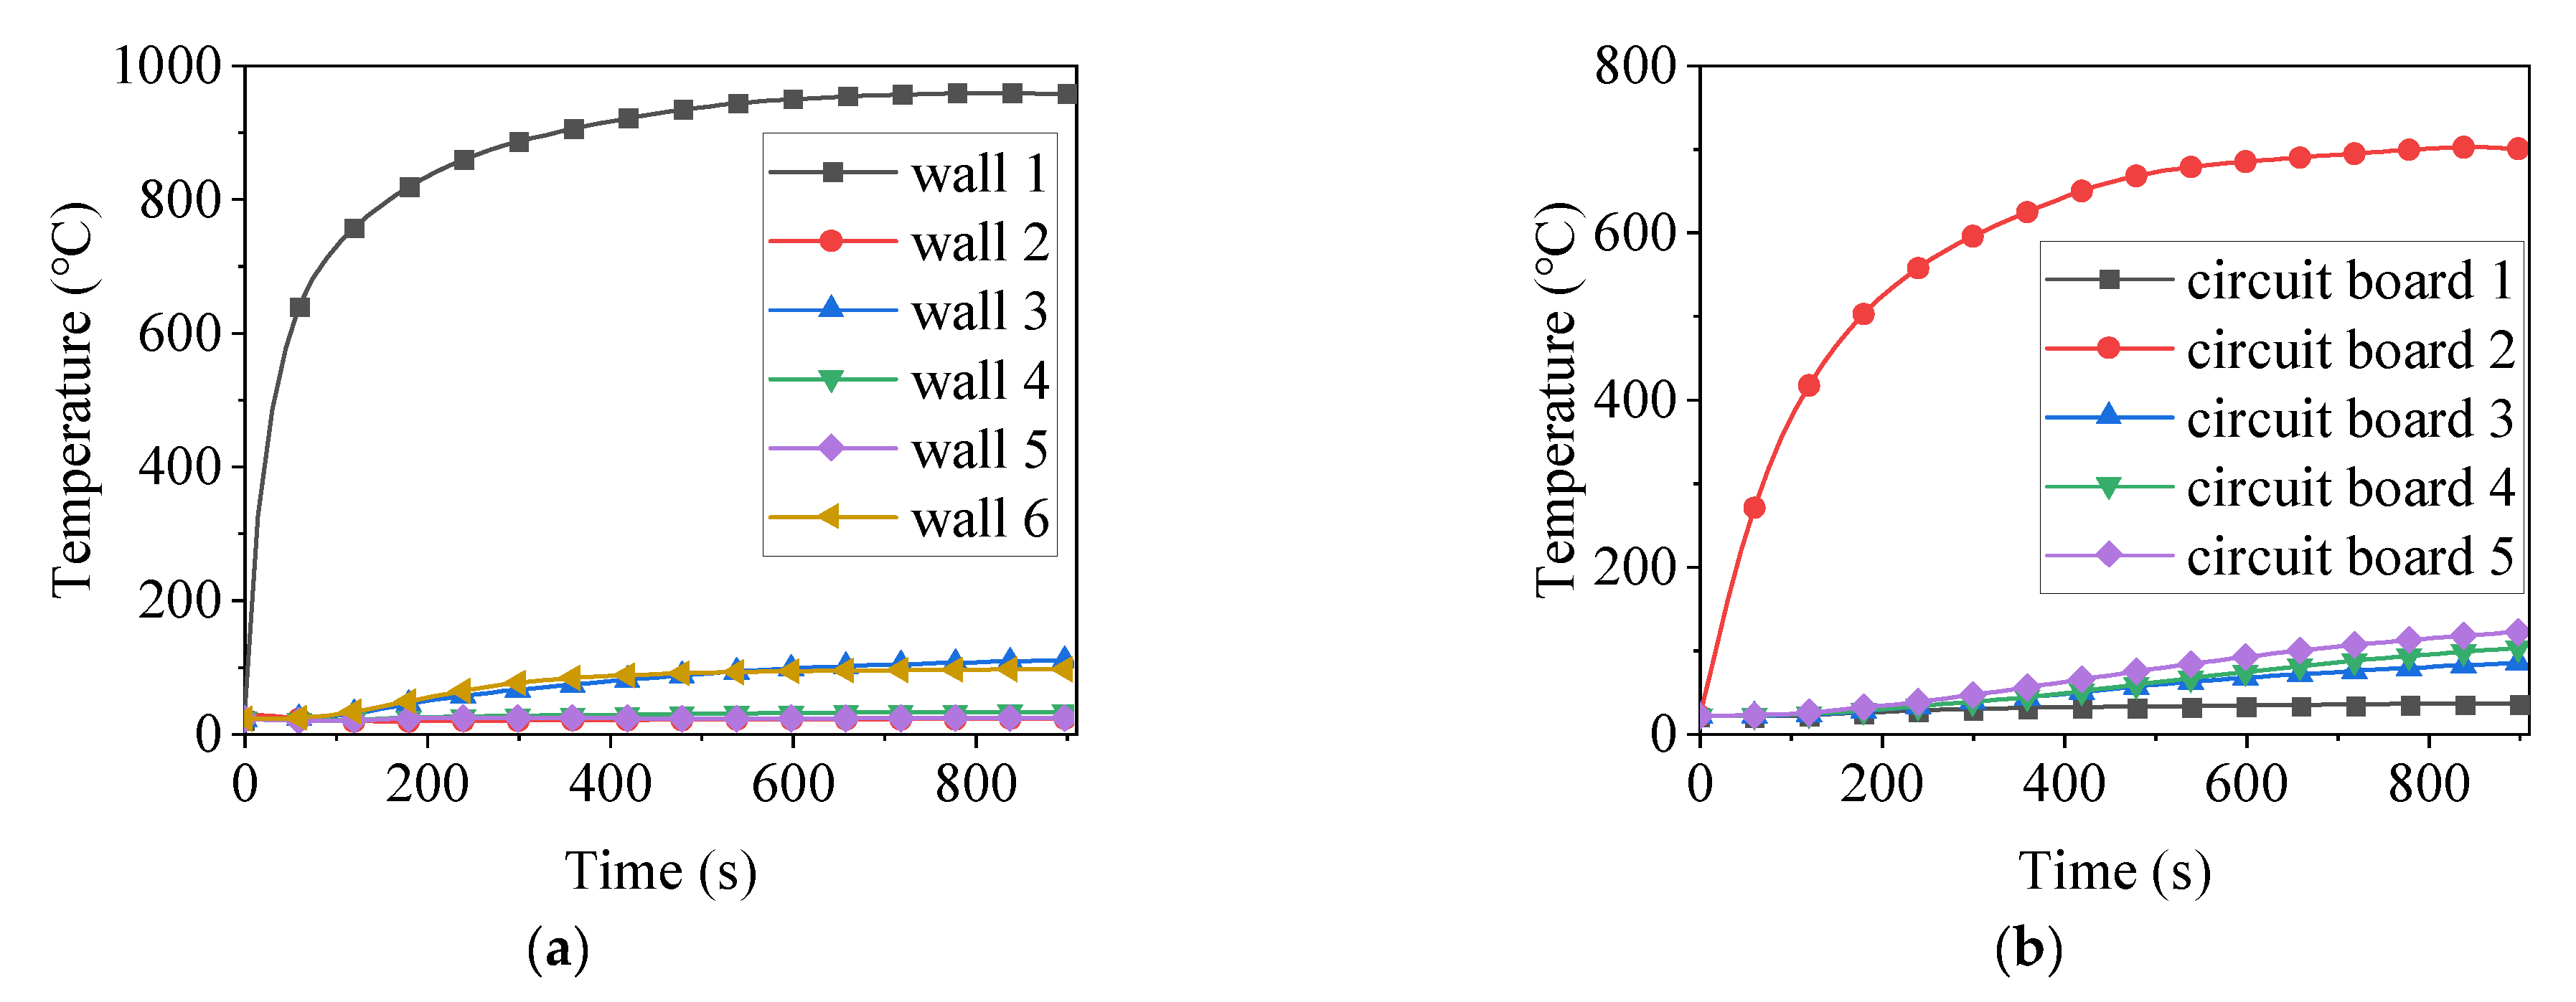
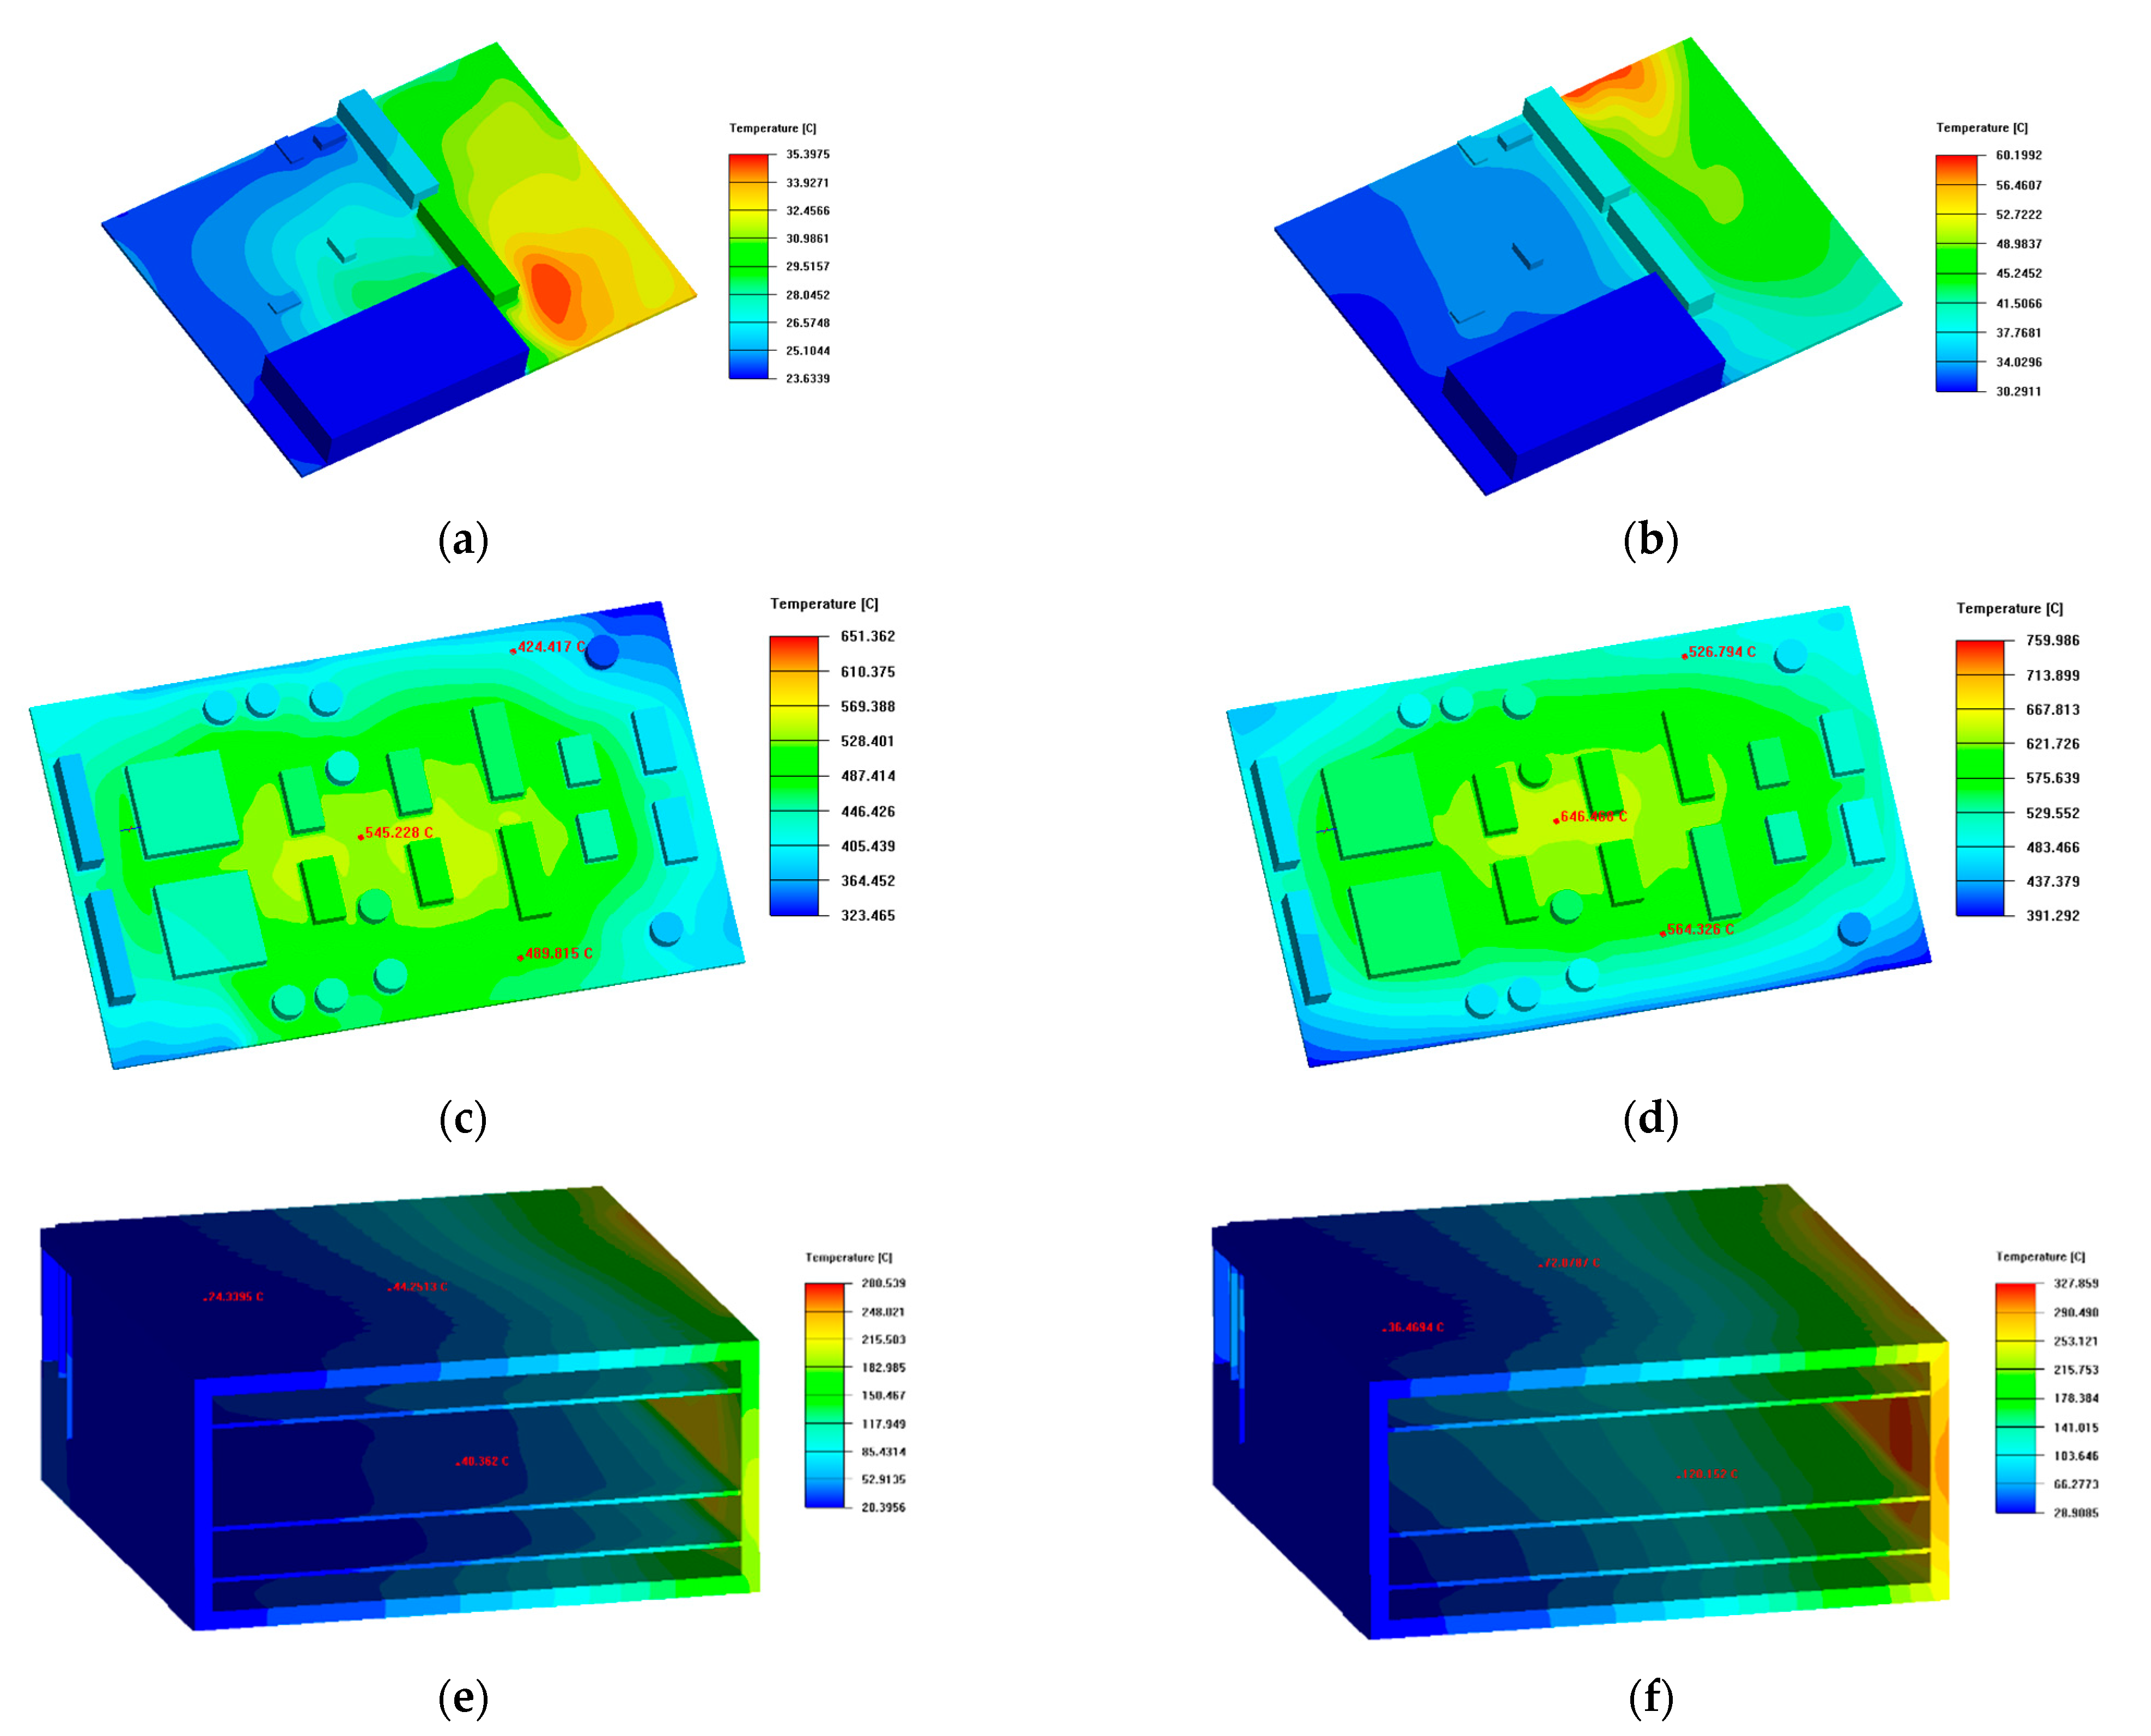
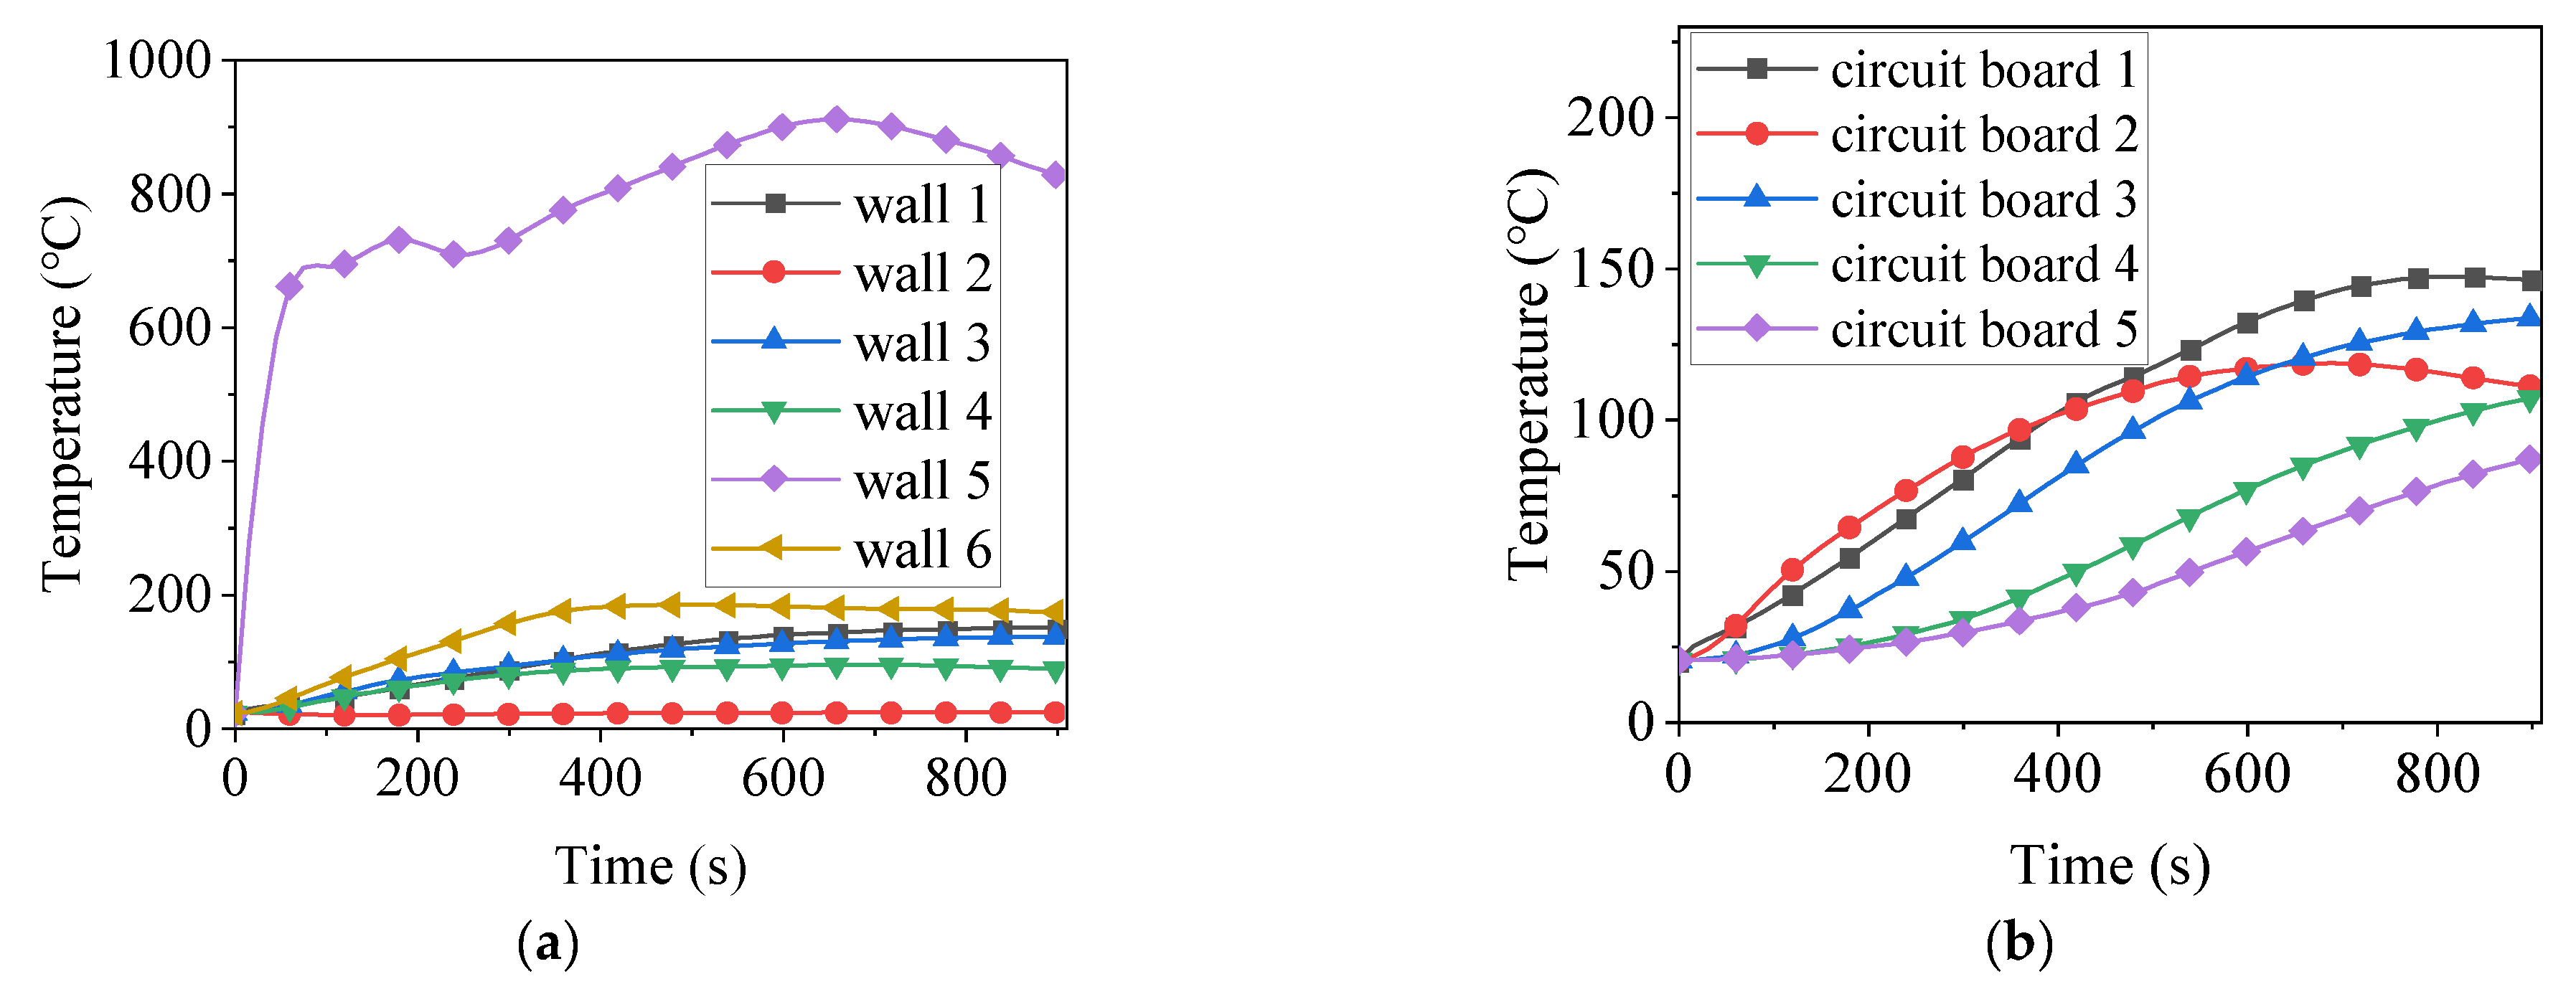
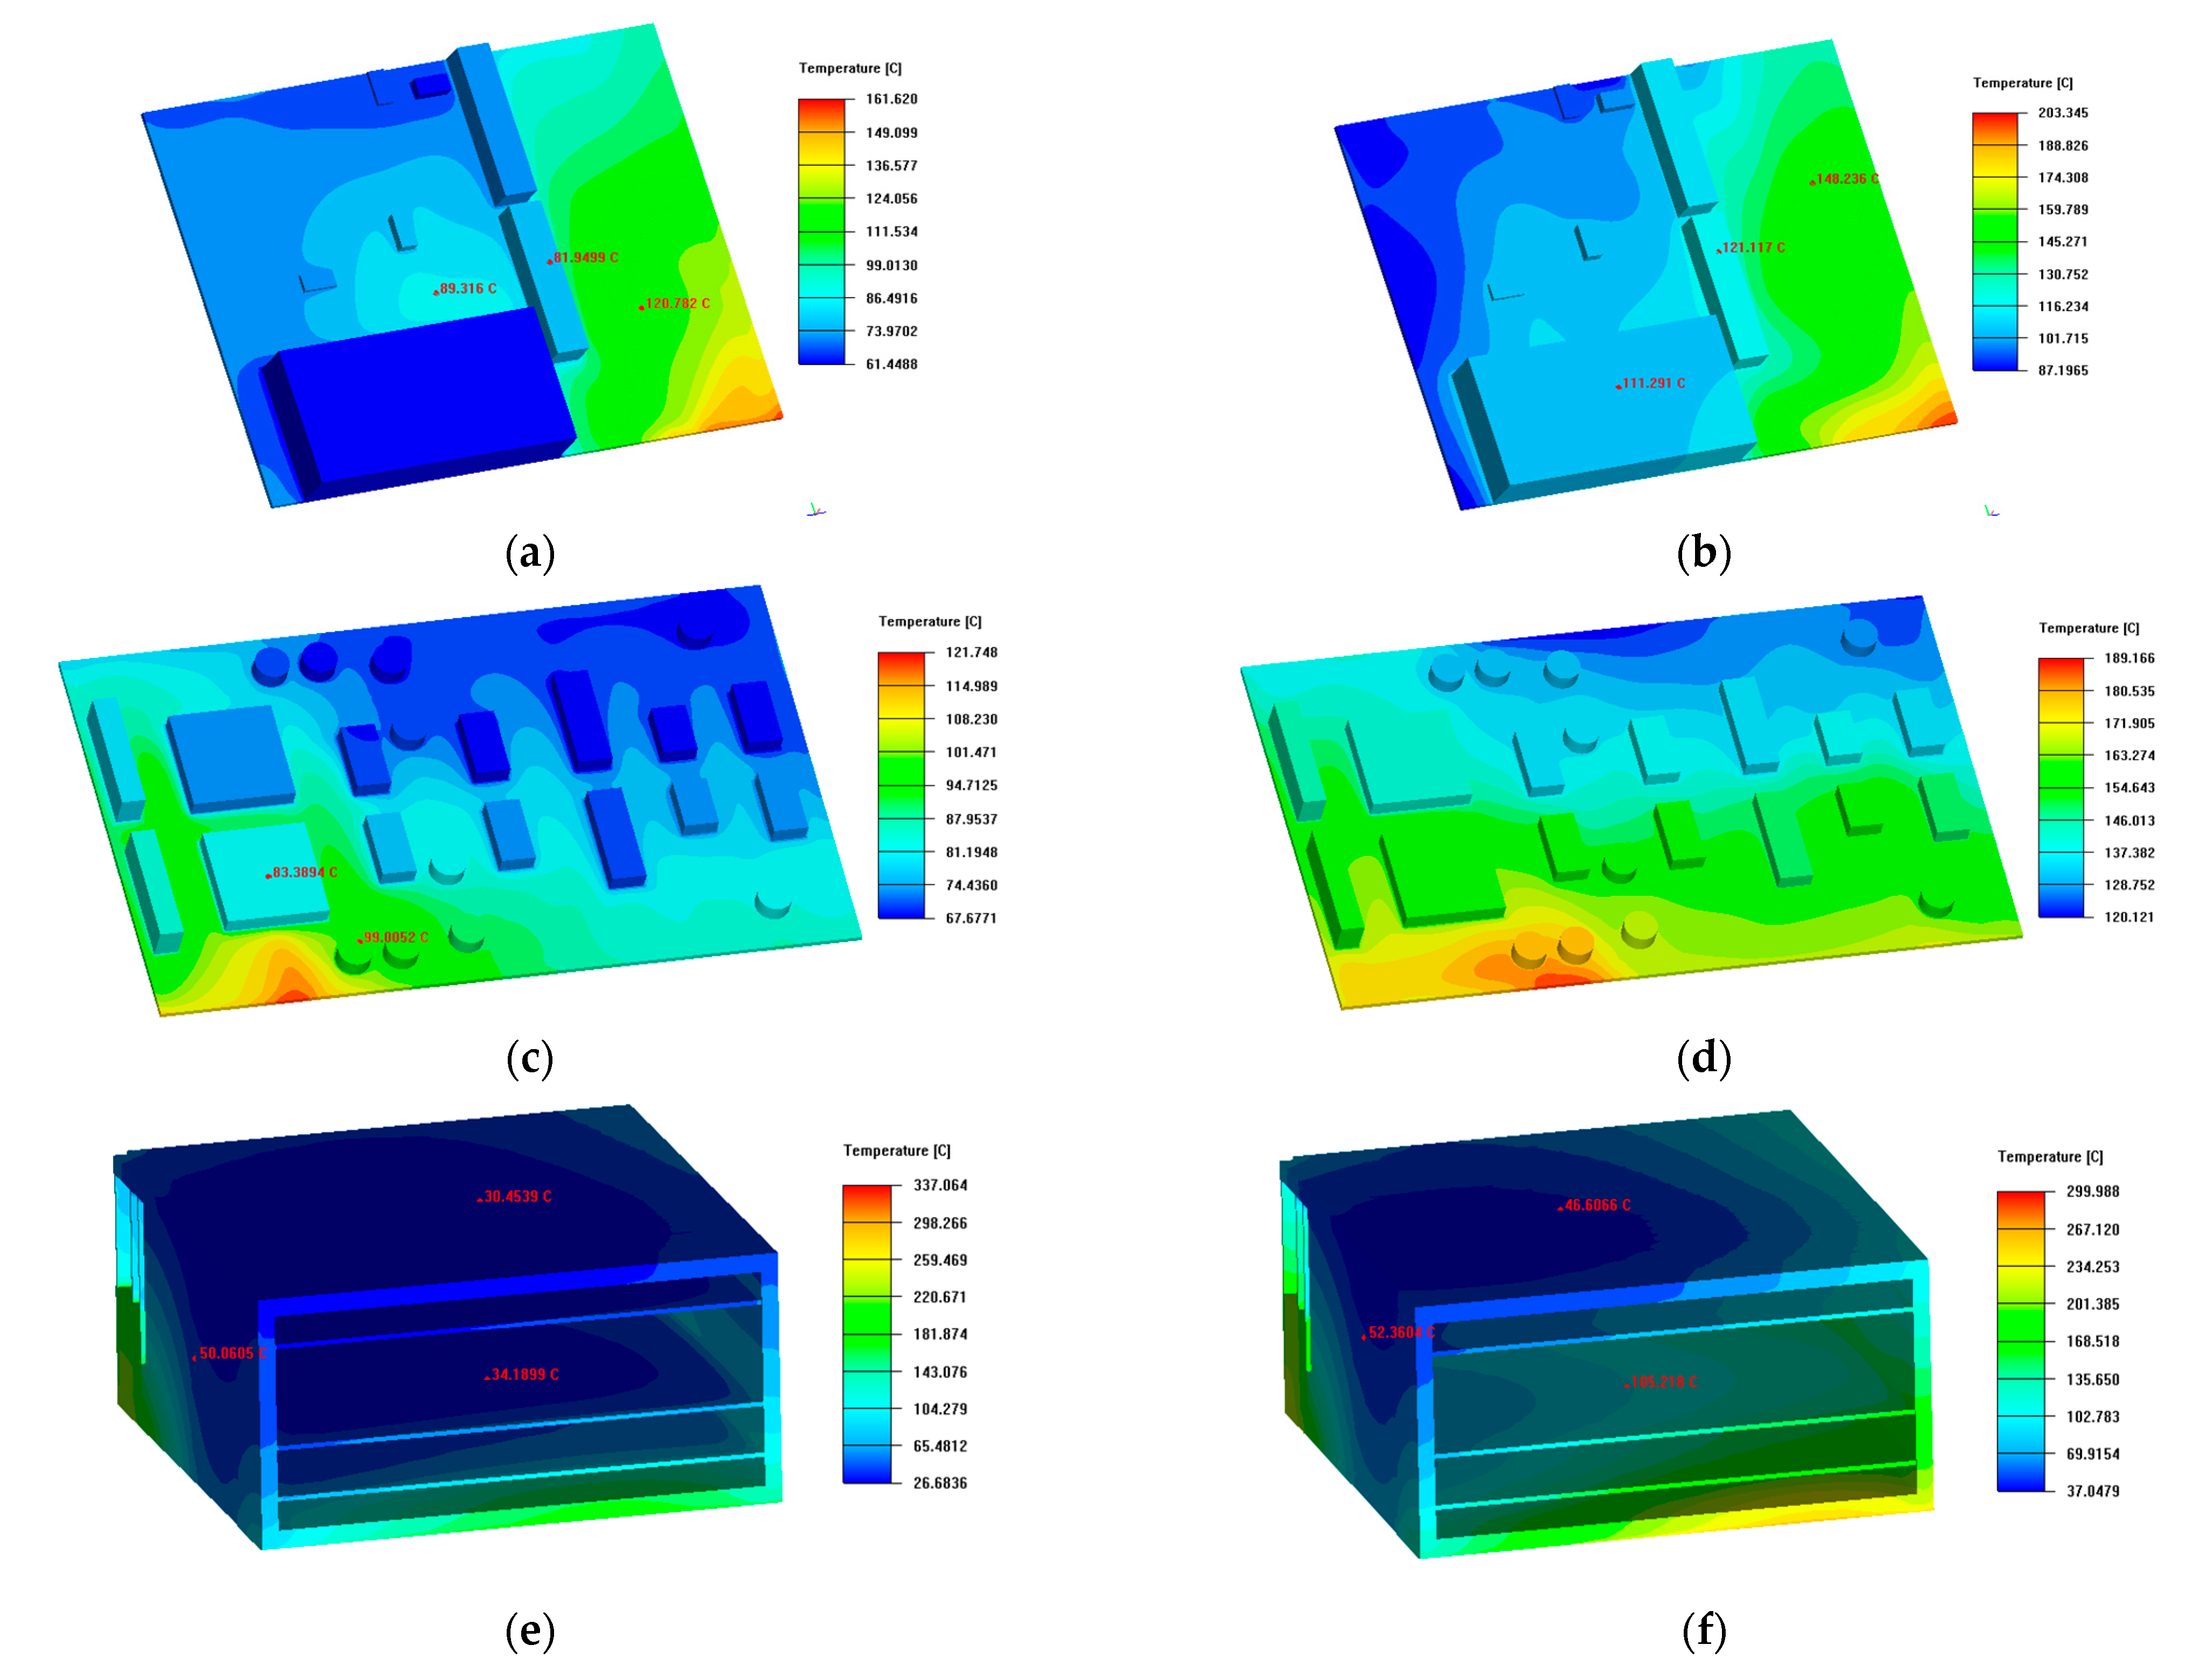
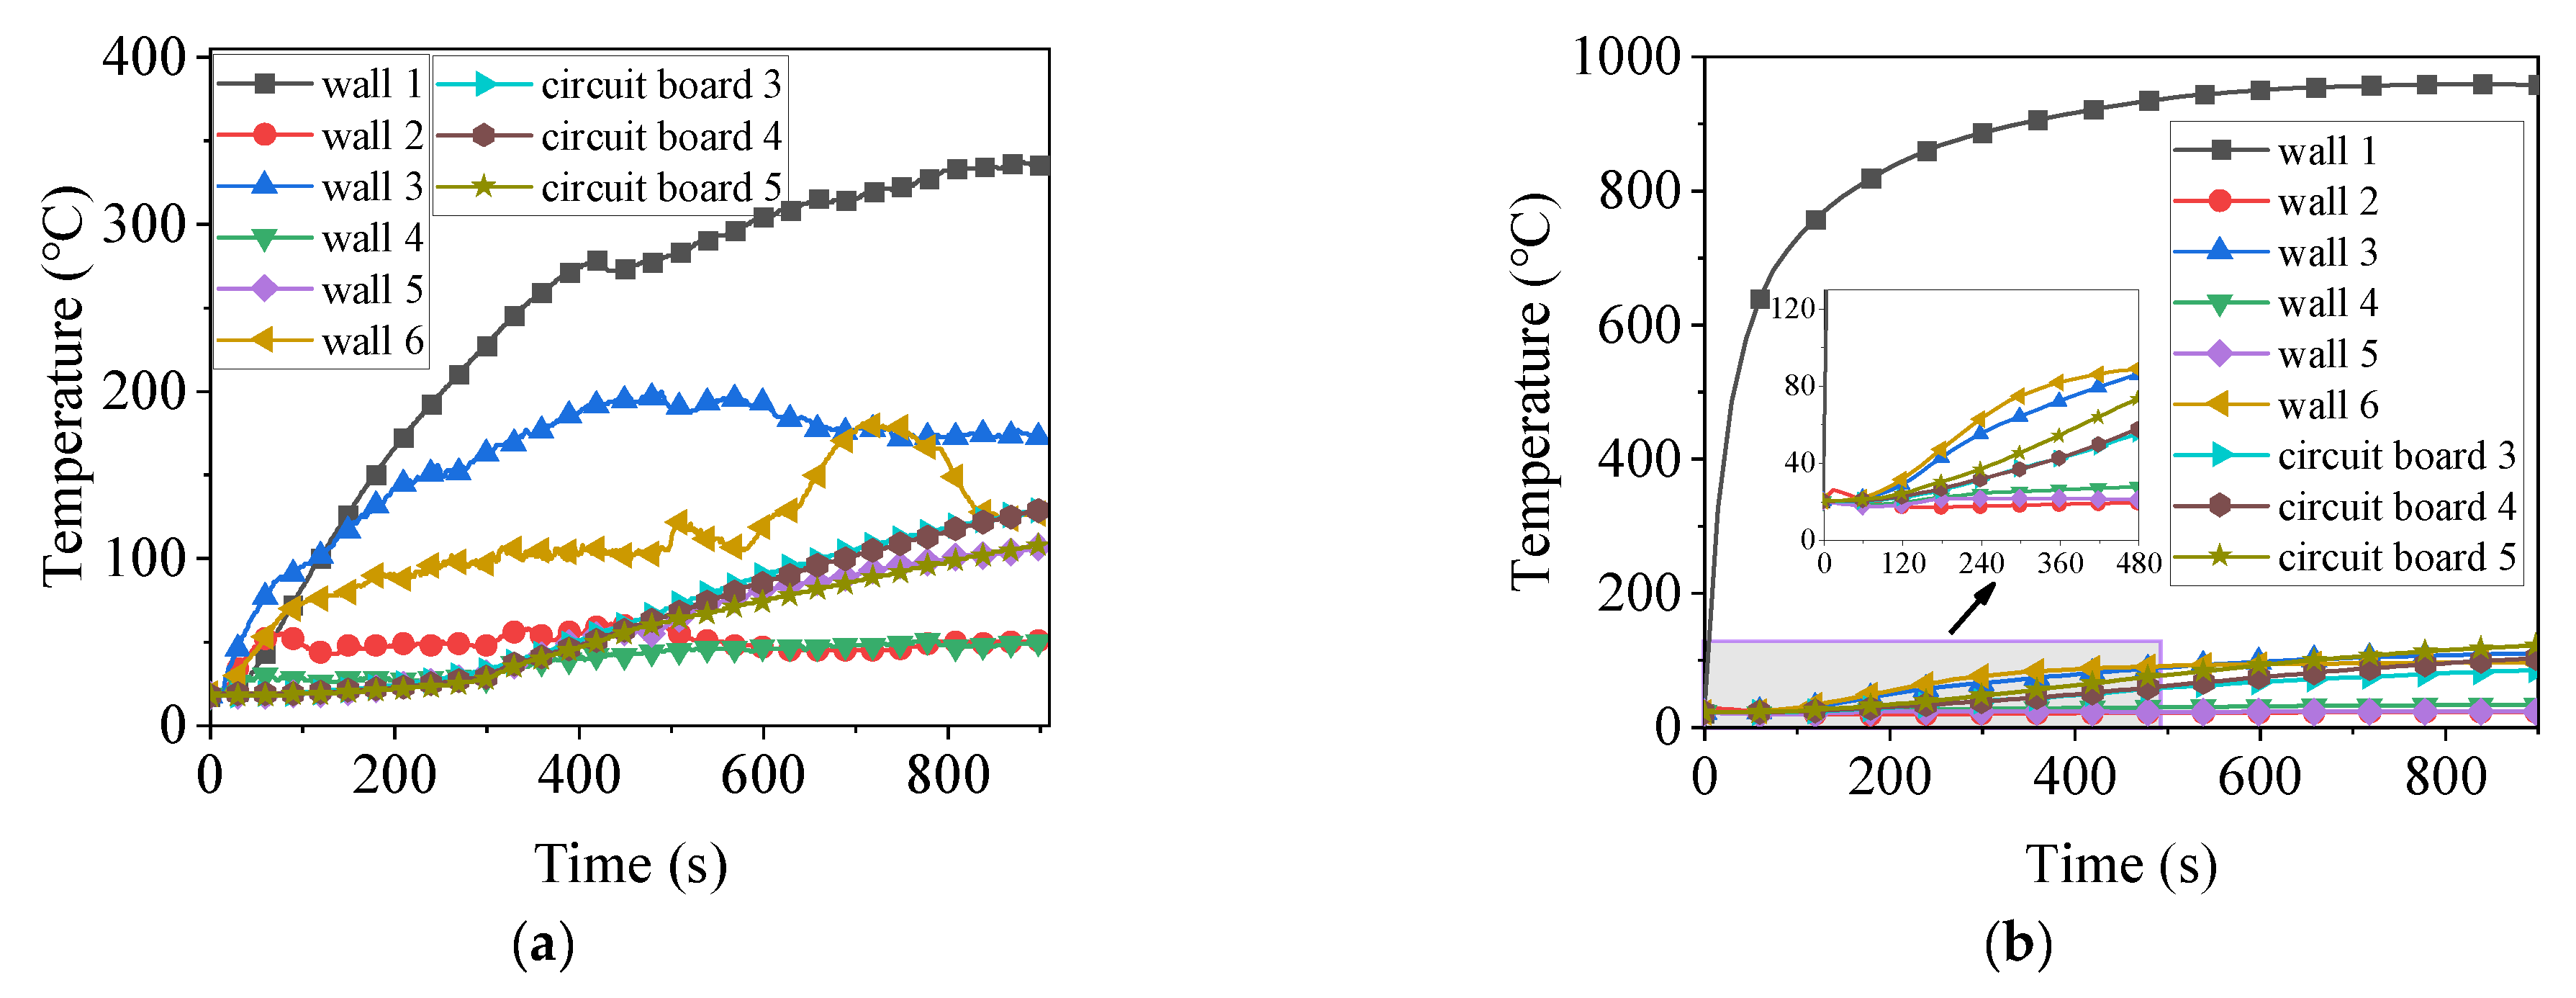
3.3. Simulation Results

To facilitate differentiation of the various walls of the EEC chassis, the walls are labeled as shown in Figure 4, where wall 1 is on the same plane as component 2 inside the chassis. This study simulates thermal shock conditions applied to wall 1 and wall 5 of the EEC chassis under two distinct scenarios. Wall 1 is located adjacent to component 2, a fully enclosed region with minimal convective cooling, and thus represents a worst-case scenario for thermal failure. On the other hand, wall 5 is situated near the air outlet and more ventilated regions, providing a scenario with improved heat dissipation. Additionally, the materials of wall 1 and wall 5 differ, and conducting separate thermal shock experiments on them allows comparison of the effects of different materials on the EEC’s thermal performance under thermal shock conditions.
As described in Section 3.2, a simulation of the thermal shock condition on wall 1 was conducted. The geometric centers of all components are designated as temperature monitoring points, and the temperature variation curves over time are illustrated in Figure 5. As shown in Figure 5a, the temperature of wall 1 significantly exceeds the melting point of the 6061-T6 aluminum alloy, rendering it susceptible to melting under thermal shock conditions. In contrast, the temperatures of the other walls remain below 200 °C, thereby avoiding the risk of thermal damage. Furthermore, Figure 5b demonstrates that as the duration of the thermal shock increases, the temperature of the circuit board gradually rises, with the temperature of circuit board 2 rapidly surpassing 120 °C, leading to the rapid failure of its electronic components.
To more clearly evaluate the damage sustained by each circuit board under thermal shock conditions, temperature distribution contour maps for all components were generated. The temperature states at the fifth and fifteenth minutes were selected for analysis based on the fire testing standard RTCA DO-160 [27]. The corresponding temperature distributions for each component are illustrated in Figure 6. Although circuit board 1 experiences a temperature rise during the 15 min thermal shock exposure, its maximum temperature remains within the acceptable operating range for electronic components. Therefore, circuit board 1 is able to maintain normal functionality throughout the thermal shock exposure on wall 1. In contrast, circuit board 2, located closer to the thermal shock surface, reaches a peak temperature of approximately 650 °C at the 5 min mark, significantly exceeding the maximum tolerable temperature for electronic devices. As a result, circuit board 2 sustains thermal damage before the 5 min mark. The temperature of the part of component 3 increases progressively as it approaches wall 1. As shown in Figure 6e, although the maximum temperature of component 3 reaches approximately 280 °C at the 5 min mark, the high-temperature region is primarily concentrated on the chassis wall, and the internal circuit board temperature remains below 120 °C. By the 15 min mark, the temperature of component 3 continues to rise, resulting in portions of the circuit board exceeding 120 °C. Therefore, under thermal shock conditions applied to wall 1, the electronic components of component 3 are capable of operating normally within the first 5 min. However, some damage occurs by the 15 min mark.
In summary, under thermal shock conditions applied to wall 1, circuit boards 1 and 3–5 remain undamaged within the first 5 min, thereby satisfying the requirements of the fire resistance test. In contrast, circuit board 2, which is situated on the same side as the thermally shocked wall 1, undergoes complete failure after 5 min. This failure is attributed to the fact that component 2 is a fully enclosed structure lacking circulating cooling gas. As shown in Figure 7, damage to the electronic components of circuit board 2 begins to manifest at approximately 45 s, with a significant portion of the components failing by 60 s and complete failure observed at 90 s.
Additionally, a simulation was conducted on the thermal shock conditions of wall 5, with the temperature variation curves at the central positions of each component illustrated in Figure 8. As shown in Figure 8a, the maximum temperature of wall 5 remains below the melting point of 304 stainless steel, while the temperatures of the remaining walls do not exceed 200 °C. Consequently, under these thermal shock conditions, the EEC chassis is not expected to undergo melting. Furthermore, Figure 8b indicates that as the duration of thermal shock increases, the temperature of the circuit board gradually rises; however, it remains within the maximum temperature tolerance of the electronic components. During the thermal shock process, a slight decrease in temperature occurs in certain components due to the dynamic balance between the thermal input from the thermal shock and the thermal dissipation facilitated by the forced air-cooling system. These localized variations do not significantly impact the overall thermal trend and remain within an acceptable range of numerical fluctuations.
To provide a clearer observation of the damage conditions of each circuit board under thermal shock environments, temperature distribution cloud maps for each component were plotted at the fifth and fifteenth minute marks, as illustrated in Figure 9. Figure 9a illustrates that the temperature in the lower right corner of circuit board 1 exceeds 120 °C at the 5 min mark; however, the temperature of the internal electronic components remains below this threshold, indicating that circuit board 1 can operate normally within the initial 5 min. This temperature distribution can be attributed to the proximity of the left half of circuit board 1 to the cooling air intake, which results in a slower rate of temperature increase. In contrast, the lower right corner, located farther from the cooling air intake and closer to the wall experiencing thermal shock, exhibits a rapid temperature rise due to concentrated thermal flow. As the thermal shock process continues to the 15 min mark, several electronic components of circuit board 1 exceed 120 °C and have sustained damage. Under the thermal shock condition at wall 5, the temperature distribution of circuit board 2 mirrors that of circuit board 1, with electronic components functioning normally within the first 5 min but suffering damage by the 15 min mark. The temperature distribution of component 3 is depicted in Figure 9e,f, where only the bottom of the chassis wall of component 3 exceeds 120 °C at the 5 min mark, while the temperature of the internal circuit board remains below this threshold. By the 15 min mark, the temperature of the circuit board of component 3 partially exceeds 120 °C. Consequently, under the thermal shock condition at wall 5, the electronic components of component 3 also function normally during the first 5 min, but some sustain damage by the 15 min mark.
In summary, under the conditions of thermal shock applied to wall 5, all circuit boards are expected to remain undamaged within a duration of 5 min, thereby satisfying the criteria established for fire resistance testing.

4. Experimental and Analytical Study on Thermal Shock

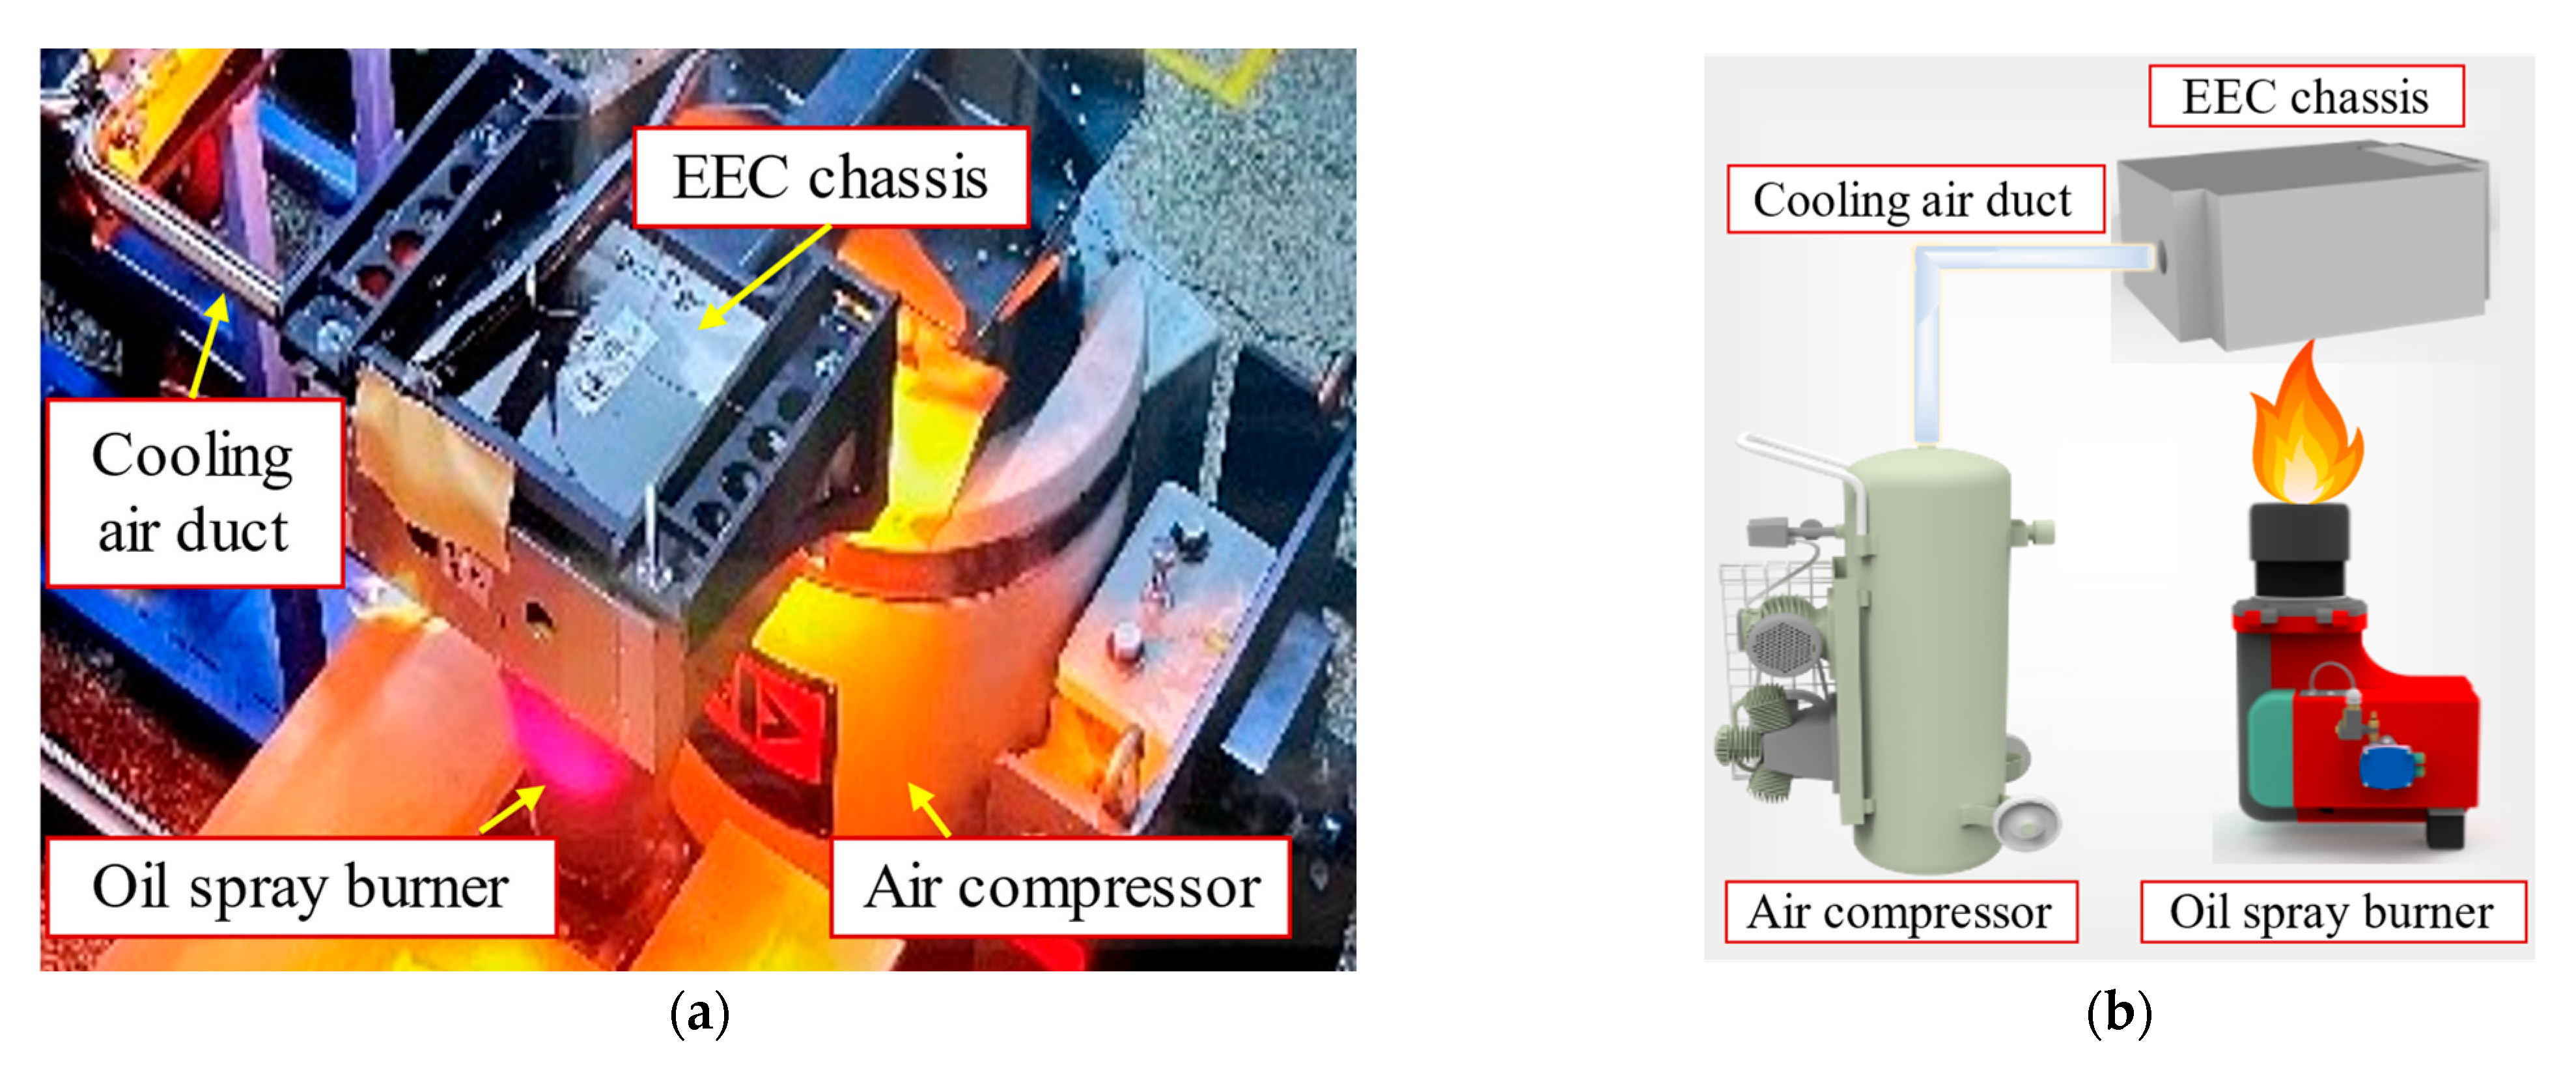
4.1. Experiment Setup

To validate the accuracy of the simulation results, thermal shock experiments were performed on the EEC. The experimental setup is shown in Figure 10, where the oil spray burner is firmly mounted on the loading platform, and the EEC chassis is positioned 100 mm above it. Thermal shock is applied to the EEC using the oil spray burner. Compressed air is supplied by an air compressor and introduced into the EEC chassis through a duct, thereby providing forced air cooling to enhance heat dissipation.
During the experiment, it is essential to maintain consistency between the experimental conditions and the simulation settings. The oil-air mixture ratio of the oil spray burner was adjusted to stabilize the flame temperature within the range of 1100 ± 80 °C. The flame reached the target temperature approximately 8 s after ignition, with a temperature rise rate of about 120 °C/s. The initial environmental temperature in the test chamber was 20 °C. The compressed air flow rate was set to 125 m3/h, with an absolute pressure of 120 kPa. K-type thermocouple sensors were utilized to monitor the temperature distribution within the EEC under thermal shock conditions. Due to the spatial limitations of the EEC chassis, thermocouple sensors were installed only at the center positions of the inner surfaces of the six walls of its casing, as well as at the center positions of circuit boards 3–5, resulting in a total of nine temperature measurement points. A 12-channel temperature acquisition instrument, model DH5916B, was employed to record the temperature changes inside the EEC chassis, with a data acquisition frequency of 1 Hz. Before each test, both the thermocouples and the temperature acquisition device underwent zero offset testing.

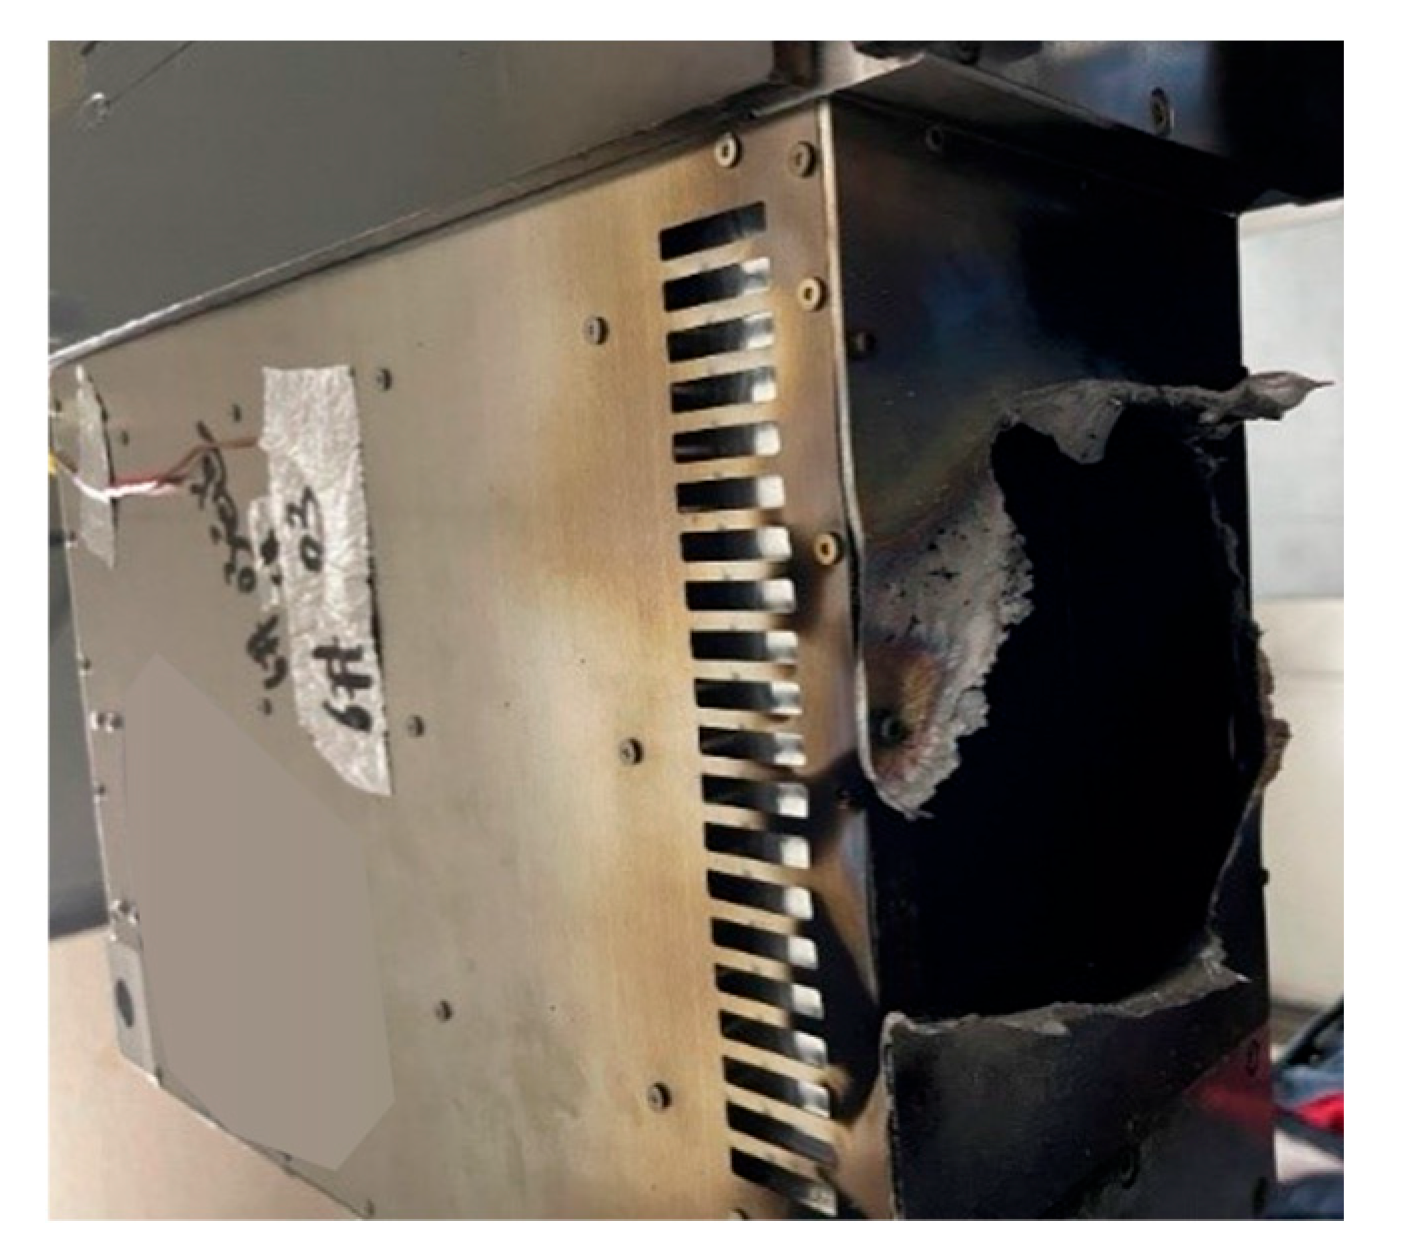
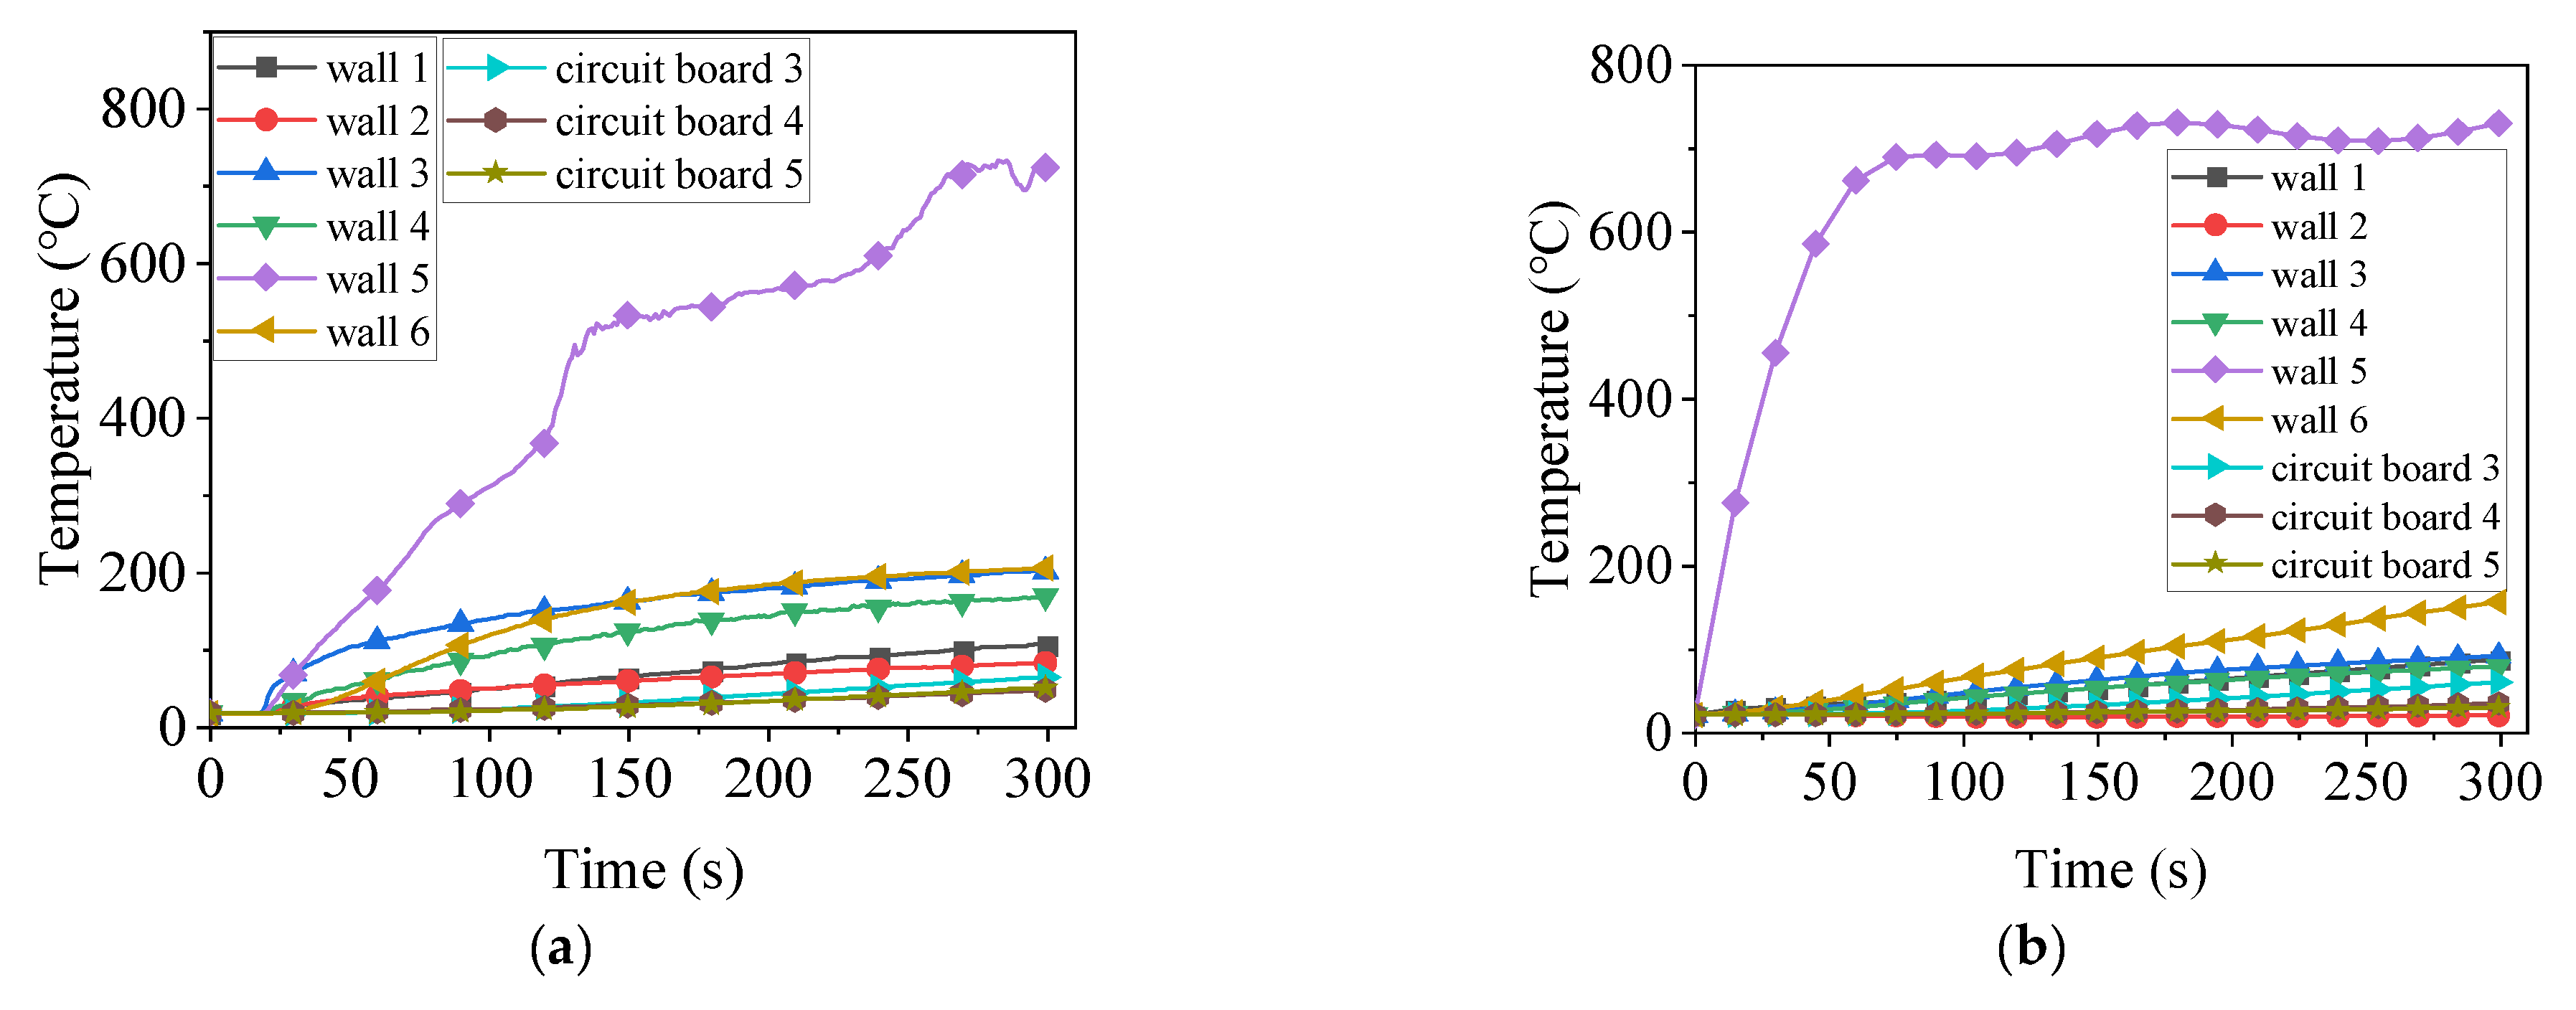
4.2. Results and Discussion

Two thermal shock experiments were conducted on wall 1 and wall 5 to validate the accuracy of the simulation results. A 15 min thermal shock test was performed on wall 1 of the EEC chassis, with the temperature variation illustrated in Figure 11a. Following the thermal shock experiment, it was observed that wall 1 of the EEC chassis sustained damage due to its inability to withstand high temperatures, as depicted in Figure 12. This observation aligns with the simulation results, thereby confirming their accuracy. During the experiment, the thermocouples were installed on the inner surface of the chassis to prevent damage from direct flame exposure. Additionally, it was not possible to simulate the melting condition of wall 1. Consequently, the temperature recorded for wall 1 during the experiment was lower than that observed in the simulation. As shown in Figure 11a, it was found that approximately 480 s into the thermal shock experiment, the temperature variation trend of the chassis changed, which was attributed to the melting of wall 1. A comparison between the experimental results in Figure 11a and the simulation results in Figure 11b indicates that the temperature variation trends of both the chassis wall and the circuit board were generally consistent before 480 s. It can be accurately concluded that the electronic components on circuit boards 3–5 would remain undamaged within the first 5 min of thermal shock. Since the simulation was unable to model conditions following the damage to the shell, the simulation data post-480 s cannot serve as a reliable reference. The inevitable misalignment between the temperature measurement points in the experiment and the simulation contributed to discrepancies in absolute temperature values. For circuit boards 3–5, the mean absolute errors (MAE) during the first 480 s were found to be 3.8 °C, 4.0 °C, and 5.9 °C, respectively. These errors are within an acceptable range.
A 5 min thermal shock experiment was conducted on wall 5 of the EEC chassis, with the temperature variation shown in Figure 13a. The maximum temperature of wall 5 reached approximately 700 °C, aligning well with the simulation results. It is noteworthy that the thermocouples were positioned on the inner surface of the chassis wall, resulting in a slower temperature increase for wall 5 during the experiment compared to the simulation predictions. The temperature variations observed in the other walls and on the circuit board throughout the experiment generally corresponded with the simulation outcomes. The MAE of the experimental and simulation results for circuit boards 3–5 in the first 5 min were 2.9 °C, 5.0 °C, and 4.7 °C, respectively. It can be accurately concluded that the electronic components located on circuit boards 3–5 remained undamaged during the initial 5 min of thermal shock experienced by wall 5.
The temperature measurements obtained from the thermal shock experiments conducted on wall 1 and wall 5 of the EEC chassis show deviations relative to the simulation results. This discrepancy may be attributed to differences in the placement of the thermocouples during the experiments compared to the probe positions in the simulations, as well as measurement errors associated with the thermocouples (accuracy: ±1.5 °C). Moreover, minor fluctuations in flame temperature could also contribute to small temperature deviations. To enhance the accuracy and reliability of the experimental validation, it is recommended to implement shielding structures around the burner to stabilize the thermal boundary conditions. Furthermore, directly integrating diagnostic sensors or fault indicators onto the circuit board could facilitate real-time monitoring of component degradation and failure under thermal shock, thus enabling more precise correlation between experimental observations and numerical predictions.
Overall, the thermal shock experiments conducted on walls 1 and 5 of the EEC chassis demonstrated that the observed temperature variations and component damage were consistent with the simulation results, thereby validating the accuracy and reliability of the EEC thermal shock simulation model. Consequently, this model can be effectively employed to predict the thermal response of the EEC under actual thermal shock conditions. Based on the findings from both simulations and experiments, several structural optimization measures are proposed: (1) replacing the aluminum alloy casing with a material possessing a higher melting point, and (2) introducing ventilation openings in the fully enclosed regions of the chassis to mitigate early damage to internal circuit boards.

5. Conclusions

This study investigates the temperature variations and damage conditions of various components and electronic devices of the EEC under fire conditions through simulation and experimental methods. The EEC structure was simplified from a heat transfer perspective to develop a rapid, effective, and accurate model, facilitating the simulation of the EEC during a fire in an aircraft engine. Thermal shock simulations conducted on the aluminum wall of the EEC indicate that the wall undergoes thermal failure due to excessive heat exposure, which leads to the rapid malfunction of adjacent circuit boards. Simulations performed on the stainless-steel wall demonstrate that neither the EEC base nor any circuit boards experienced thermal damage during this period, thus satisfying the fire resistance test requirements. Thermal shock experiments on both types of walls reveal that the aluminum wall experienced melting, resulting in significant discrepancies between experimental and simulated temperature measurements. In contrast, the experimental and simulated results for the stainless-steel wall under thermal shock conditions closely align. However, the MAE for the temperature measurements of the circuit boards under both thermal shock scenarios remains within 6 °C, thereby validating the accuracy of the developed model. This study provides a theoretical basis for the thermal structural design and performance optimization of the EEC under thermal shock conditions. Currently, the focus is solely on the health status of electronic devices in the EEC during the first five minutes of thermal shock; future research will extend the thermal shock duration and incorporate cyclic thermal loads to assess cumulative damage and the long-term reliability of the EEC under prolonged fire conditions. Furthermore, a multi-physics coupling model can be employed to simulate the damage patterns of electronic devices under thermal shock, thereby exploring the degradation of electronic device performance.

Author Contributions

Conceptualization, F.W. and J.W.; methodology, F.W.; validation, F.W., J.W. and J.J.; formal analysis, J.W.; investigation, F.W., J.W. and J.J.; resources, F.W.; data curation, J.W.; writing—original draft preparation, J.W.; writing—review and editing, F.W., J.W. and J.J.; supervision, F.W.; project administration, F.W. All authors have read and agreed to the published version of the manuscript.

Funding

This research was partially supported by the National Science and Technology Major Project (Grants Nos.: J2019-VIII-0010-0171).

Data Availability Statement

The data presented in this study are available from the corresponding author upon request.

Conflicts of Interest

The authors declare no conflicts of interest.

References

  1. Hlinka, J.; Kostial, R.; Horpatzka, M. Application of Enhanced Methods for Safety Assessment of FADEC. Eksploat. Niezawodn. 2021, 23, 63–73. [Google Scholar] [CrossRef]
  2. Esfahani, A.M.; Namazi, M.; Nikolaidis, T.; Jafari, S. Advanced Control Algorithm for FADEC Systems in the Next Generation of Turbofan Engines to Minimize Emission Levels. Mathematics 2022, 10, 1780. [Google Scholar] [CrossRef]
  3. Montazeri, G.M.; Abyaneh, S. Real-time Simulation of a Turbo-shaft Engine’s Electronic Control Unit. Mech. Ind. 2017, 18, 503. [Google Scholar] [CrossRef]
  4. Kho, S.; Park, H. Design of the Electronic Engine Control Unit Performance Test System of Aircraft. Aerospace 2021, 8, 158. [Google Scholar] [CrossRef]
  5. Wang, Y.; Kang, R.; Chen, Y. Reliability Assessment of Engine Electronic Controllers Based on Bayesian Deep Learning and Cloud Computing. Chin. J. Aeronaut. 2021, 34, 252–265. [Google Scholar] [CrossRef]
  6. Zhu, H.; Wu, X.; Lv, P.; Wang, Y.; Lin, H.; Liu, W.; Yue, Z. Optimization Design of a Two-stage Multidirectional Vibration Isolation System for Large Airborne Equipment. Multidiscip. Model. Mater. Struct. 2023, 20, 126–141. [Google Scholar] [CrossRef]
  7. Zhou, D.; Wei, M.-X.; Cao, J.; Shi, L.; Shen, J.; An, L. Simulation and Experimental Study of the Field Distribution of Engine for Electromagnetic Pulse. IEEE Access 2022, 10, 118475–118483. [Google Scholar] [CrossRef]
  8. He, Z.; Yan, Y.; Zhang, Z. Thermal Management and Temperature Uniformity Enhancement of Electronic Devices by Micro Heat Sinks: A Review. Energy 2021, 216, 119223. [Google Scholar] [CrossRef]
  9. Cui, J.J.; Ren, Z.Q.; Zhang, Z.L. Research on Fire Protection and Fire Resistance Testing of Military Aircraft Engines. Aeronaut. Stand. Qual. 2015, 5, 36–39. (In Chinese) [Google Scholar]
  10. Sanchez, F.; Liscouët-Hanke, S.; Bhise, T. Influence of Ventilation Flow Rate and Gap Distance on the Radiative Heat Transfer in Aircraft Avionics Bays. Aerospace 2022, 9, 806. [Google Scholar] [CrossRef]
  11. Li, H.; Zhang, J.; Cai, L.; Li, M.; Fu, Y.; Hao, Y. The Dynamic Prediction Method for Aircraft Cabin Temperatures Based on Flight Test Data. Aerospace 2024, 11, 755. [Google Scholar] [CrossRef]
  12. Pang, L.; Zhao, M.; Luo, K.; Yin, Y.; Yue, Z. Dynamic Temperature Prediction of Electronic Equipment Under High Altitude Long Endurance Conditions. Chin. J. Aeronaut. 2018, 31, 1189–1197. [Google Scholar] [CrossRef]
  13. Pang, L.P.; Dang, X.M.; Cheng, J. Study on Heat Transfer Performance of Skin Heat Exchanger. Exp. Heat Transf. 2014, 28, 317–327. [Google Scholar] [CrossRef]
  14. Xu, Y.; Wang, J.; Yan, Z. Experimental Investigation on Melting Heat Transfer Characteristics of a Phase Change Material Under Hypergravity. Int. J. Heat Mass Transf. 2021, 181, 122004. [Google Scholar] [CrossRef]
  15. Patel, A.; Ahmed, Z.; Singh, V.K. Natural Convection Within Enclosures for Thermal Management in Low-pressure Environments. Int. J. Heat Fluid Flow 2024, 106, 109307. [Google Scholar] [CrossRef]
  16. Benyahia, N.; Aksouh, M.; Mataoui, A.; Oztop, H.F. Coupling Turbulent Natural Convection-radiation-conduction in Differentially Heated Cavity with High Aspect Ratio. Int. J. Therm. Sci. 2020, 158, 106518. [Google Scholar] [CrossRef]
  17. Qu, P.; Cheng, J.; Chen, Y.; Li, Y.; Li, W.; Tao, H. Numerical and Experimental Investigation on Heat Transfer of Multi-heat Sources Mounted on A Fined Radiator Within Embedded Heat Pipes in An Electronic Cabinet. Int. J. Therm. Sci. 2023, 183, 107833. [Google Scholar] [CrossRef]
  18. Nakayama, W. Study on Heat Conduction in A Simulated Multicore Processor Chip—Part II: Case Studies. J. Electron. Packag. 2013, 135, 021003. [Google Scholar] [CrossRef]
  19. Adhikari, R.C.; Wood, D.H.; Pahlevani, M. An Experimental and Numerical Study of Forced Convection Heat Transfer from Rectangular Fins at Low Reynolds Numbers. Int. J. Heat Mass Transf. 2020, 163, 120418. [Google Scholar] [CrossRef]
  20. Vipin, N.; Anjana, B.; Anoop, M.B.; Indrajith, S.; Midhun, M.; Meenakshi, B.N. A Comprehensive Review of Air-cooled Heat Sinks for Thermal Management of Electronic Devices. Int. Commun. Heat Mass Transf. 2024, 159, 108055. [Google Scholar] [CrossRef]
  21. Huang, C.H.; Chen, W.Y. A Natural Convection Horizontal Straight-fin Heat Sink Design Problem to Enhance Heat Dissipation Performance. Int. J. Therm. Sci. 2022, 176, 107540. [Google Scholar] [CrossRef]
  22. Abbas, A.; Wang, C.C. Augmentation of Natural Convection Heat Sink Via Using Displacement Design. Int. J. Heat Mass Transf. 2020, 154, 119757. [Google Scholar] [CrossRef]
  23. Bovesecchi, G.; Corasaniti, S.; Costanza, G.; Piccotti, F.; Potenza, M.; Tata, M.E. Heat Conduction and Microconvection in Nanofluids: Comparison between Theoretical Models and Experimental Results. Aerospace 2022, 9, 608. [Google Scholar] [CrossRef]
  24. Zhang, X.; Ma, Y.; Lv, M.; Wang, X.; Shi, X. Performance-Enhanced Double Serpentine Minichannel Heat Sink for Phased-Array Radar High-Heat-Flux Chip Cooling. Electronies 2025, 14, 2246. [Google Scholar] [CrossRef]
  25. Gai, T.; Zeng, J.; Xia, Q.; Li, J.; Gong, J. Effects of Operating Conditions on Flow and Heat Transfer Characteristics of Mist Cooling in A Square Ribbed Channel. J. Mech. Sci. Technol. 2017, 31, 1517–1530. [Google Scholar] [CrossRef]
  26. ISO 2685:1998; Aircraft—Environmental Test Procedure for Airborne Equipment—Resistance to Fire in Designated Fire Zones. International Organization for Standardization: Geneva, Switzerland, 1998.
  27. RTCA DO-160G-2010; Environmental Conditions and Test Procedures for Airborne Equipment. Radio Technical Commission for Aeronautics: Washington, DC, USA, 2010.
Figure 1. Simplified EEC chassis model: (a) external housing for the EEC; (b) internal structure of the EEC; (c) component 1; (d) component 2; (e) component 3; (f) component 4.
Aerospace 12 00636 g001
Figure 2. Schematic diagram of boundary condition settings.
Aerospace 12 00636 g002
Figure 3. Mesh generation for the EEC model: (a) aggregates; (b) results.
Aerospace 12 00636 g003
Figure 4. Numbered diagram of EEC chassis wall components.
Aerospace 12 00636 g004
Figure 5. Temperature variations of EEC components when wall 1 is subjected to thermal shock: (a) walls; (b) circuit boards.
Aerospace 12 00636 g005
Figure 6. Thermal field evolution of EEC components when wall 1 is subjected to thermal shock: circuit board 1 at (a) 5 min and (b) 15 min; circuit board 2 at (c) 5 min and (d) 15 min; component 3 at (e) 5 min and (f) 15 min.
Aerospace 12 00636 g006
Figure 7. Damage distribution mapping of electronics of circuit board 2 when wall 1 is subjected to thermal shock: (a) at 30 s; (b) at 45 s; (c) at 60 s; (d) at 90 s.
Aerospace 12 00636 g007aAerospace 12 00636 g007b
Figure 8. Temperature variations of EEC components when wall 5 is subjected to thermal shock: (a) walls; (b) circuit boards.
Aerospace 12 00636 g008
Figure 9. Thermal field evolution of EEC components when wall 5 is subjected to thermal shock: circuit board 1 at (a) 5 min and (b) 15 min; circuit board 2 at (c) 5 min and (d) 15 min; component 3 at (e) 5 min and (f) 15 min.
Aerospace 12 00636 g009
Figure 10. Thermal shock test platform: (a) physical drawing; (b) schematic drawing.
Aerospace 12 00636 g010
Figure 11. Comparison of temperature variations of components when wall 1 is subjected to thermal shock: (a) experiment; (b) simulation.
Aerospace 12 00636 g011
Figure 12. Thermal shock damage to wall 1 of the EEC chassis.
Aerospace 12 00636 g012
Figure 13. Comparison of temperature variations of components when wall 5 is subjected to thermal shock: (a) experiment; (b) simulation.
Aerospace 12 00636 g013
Table 1. Thermophysical properties of the EEC chassis material.
Material304 Stainless Steel6061-T6 Aluminum Alloy
Thermal conductivity (W/(m K))14.986–31.580177
Specific heat capacity (J/(kg K))495–678897
Melting temperature (°C)1398–1454585
Density (g/cm3)7.932.7
Table 2. Temperature-dependent thermophysical properties of 304 stainless steel.
Temperature (°C)251003005007009001100
Specific heat capacity (J/(kg K))495506537569600631662
Thermal conductivity (W/(m K))14.98616.04618.87221.69824.52427.35030.176
Disclaimer/Publisher’s Note: The statements, opinions and data contained in all publications are solely those of the individual author(s) and contributor(s) and not of MDPI and/or the editor(s). MDPI and/or the editor(s) disclaim responsibility for any injury to people or property resulting from any ideas, methods, instructions or products referred to in the content.

