Article

Improved Space Object Detection Based on YOLO11

Research Institute of Intelligent Control and Systems, Harbin Institute of Technology, Harbin 150080, China
*
Author to whom correspondence should be addressed.
Aerospace 2025, 12(7), 568; https://doi.org/10.3390/aerospace12070568
Submission received: 25 March 2025 / Revised: 31 May 2025 / Accepted: 21 June 2025 / Published: 23 June 2025
(This article belongs to the Special Issue Intelligent Perception, Decision and Autonomous Control in Aerospace)

Abstract

Space object detection, as the foundation for ensuring the long-term safe and stable operation of spacecraft, is widely applied in a variety of close-proximity tasks such as non-cooperative target monitoring, space debris avoidance, and spacecraft mission planning. To strengthen the detection capabilities for non-cooperative spacecraft and space debris, a method based on You Only Look Once Version 11 (YOLO11) is proposed in this paper. On the one hand, to tackle the issues of noise and low contrast in images captured by spacecraft, bilateral filtering is applied to remove noise while preserving edge and texture details effectively, and image contrast is enhanced using the contrast-limited adaptive histogram equalization (CLAHE) technique. On the other hand, to address the challenge of small object detection in spacecraft, loss-guided online data augmentation is proposed, along with improvements to the YOLO11 network architecture, to boost detection capabilities for small objects. The experimental results show that the proposed method achieved 99.0 % mAP50 (mean Average Precision with an Intersection over Union threshold of 0.50) and 92.6 % mAP50-95 on the SPARK-2022 dataset, significantly outperforming the YOLO11 baseline, thereby validating the effectiveness of the proposed method.

1. Introduction

Space object detection is a fundamental task in supporting close-proximity operations involving non-cooperative spacecraft with known trajectories and clearly visible geometries. Such detection capabilities play a crucial role in monitoring non-cooperative spacecraft [1,2], preventing collisions with space debris [3,4], and supporting space mission planning [5,6]. First, in close-range scenarios, non-cooperative spacecraft, particularly those considered potentially adversarial, pose significant risks due to their unpredictable behavior and lack of communication with existing tracking infrastructure. In these contexts, visual detection systems enable real-time situational awareness, thereby supporting timely risk assessment and the formulation of effective response strategies. Such capabilities are critical for maintaining the safety and operational stability of space assets in increasingly congested and contested orbital environments. Moreover, the rapidly increasing amount of space debris poses a serious threat to the safety of spacecraft in orbit [7]. Avoiding collisions with space debris requires highly accurate detection systems capable of sensing debris, thereby providing guidance for subsequent threat avoidance measures. Furthermore, perception serves as a foundational element in the planning and execution of various close-range space operations, including autonomous docking, inspection, and servicing tasks [8,9]. Reliable detection systems contribute to the early identification of infeasible objectives or operational constraints, thereby improving mission efficiency and safety. In light of these considerations, this paper presents a robust and efficient space object detection method designed for close-proximity scenarios involving known targets under complex visual conditions. The proposed method aims to provide accurate object localization while maintaining real-time performance, offering a dependable visual perception foundation for autonomous navigation and mission planning in near-field space environments.
However, space object detection currently faces three major challenges. First, interference from other celestial bodies and sensor noise introduce substantial noise into the images, complicating the detection process and degrading the detection accuracy [10]. The low lighting conditions in space result in poor contrast between the spacecraft and their background in the images captured by cameras, making it difficult to extract meaningful features. Second, spacecraft are constrained by limited onboard resources, including computational power, energy, and storage capacity, yet there is a requirement for rapid response, which requires fast and accurate detection within the constraints of limited computational and storage resources. Achieving a balance between performance and resource efficiency remains a fundamental challenge for onboard detection technologies. Lastly, the vast operational space and large measurement scales lead to the frequent prevalence of small objects [11]. These small objects occupy only a tiny fraction of the entire image, often exhibiting low resolution and indistinct features, making them particularly challenging to detect. Addressing these challenges is essential for advancing space object detection capabilities and ensuring mission success in complex and dynamic orbital environments.
Spacecraft images are frequently contaminated with noise caused by background interference and sensor noise. Given the limited onboard resources, traditional image processing techniques, such as mean filtering, median filtering, and Gaussian filtering, are commonly employed for noise reduction due to their simplicity and low computational requirements. However, these methods often compromise critical edge and texture details, which are essential for accurate detection. To overcome this limitation, bilateral filtering [12,13] is considered as a more suitable approach, which can preserve edge and texture features for subsequent detection tasks while effectively removing noise.
Low-contrast images captured in space present significant challenges for space object detection, as inadequate lighting often obscures critical features [14]. Some enhancement techniques, such as linear transformation, Gamma correction, and histogram adjustment, can improve contrast but may struggle with uneven lighting or significant noise. Inspired by [15,16], contrast-limited adaptive histogram equalization (CLAHE) provides a more effective solution by enhancing local contrast while limiting noise amplification. By processing small image regions independently, CLAHE effectively highlights spacecraft features and improves overall image clarity, enabling more accurate detection.
Object detection algorithms can generally be classified into two categories based on whether explicit regions of interest are generated: two-stage and one-stage algorithms [17,18]. Two-stage algorithms, such as Region-based Convolutional Neural Networks (R-CNNs) [19], Faster Region-based Convolutional Neural Networks (Faster R-CNNs) [20], and Region-based Fully Convolutional Networks (R-FCNs) [21], first generate candidate regions and then classify them. In contrast, one-stage algorithms like You Only Look Once (YOLO) [22], Single Shot MultiBox Detector (SSD) [23], and RetinaNet [24] directly predict object locations and categories in a single step. One-stage algorithms typically require only a single forward pass to extract features, making them faster in detection and better suited for the real-time requirements of space object detection. The study in [25] shows that integrating EfficientDet with EfficientNet-v2 enhances space object detection and classification on the SPARK dataset, outperforming existing methods, while also highlighting the potential of YOLO-based detectors on this challenging dataset in this work. YOLO, as a representative of one-stage object detection algorithms, stands out for its efficiency and real-time processing capability, with its architecture evolving to improve accuracy, speed, and robustness from YOLOv1 [22] to YOLO11 [26]. The study in [3] employs YOLOv8 for space debris detection and achieves excellent performance on its synthetically generated images. The study in [
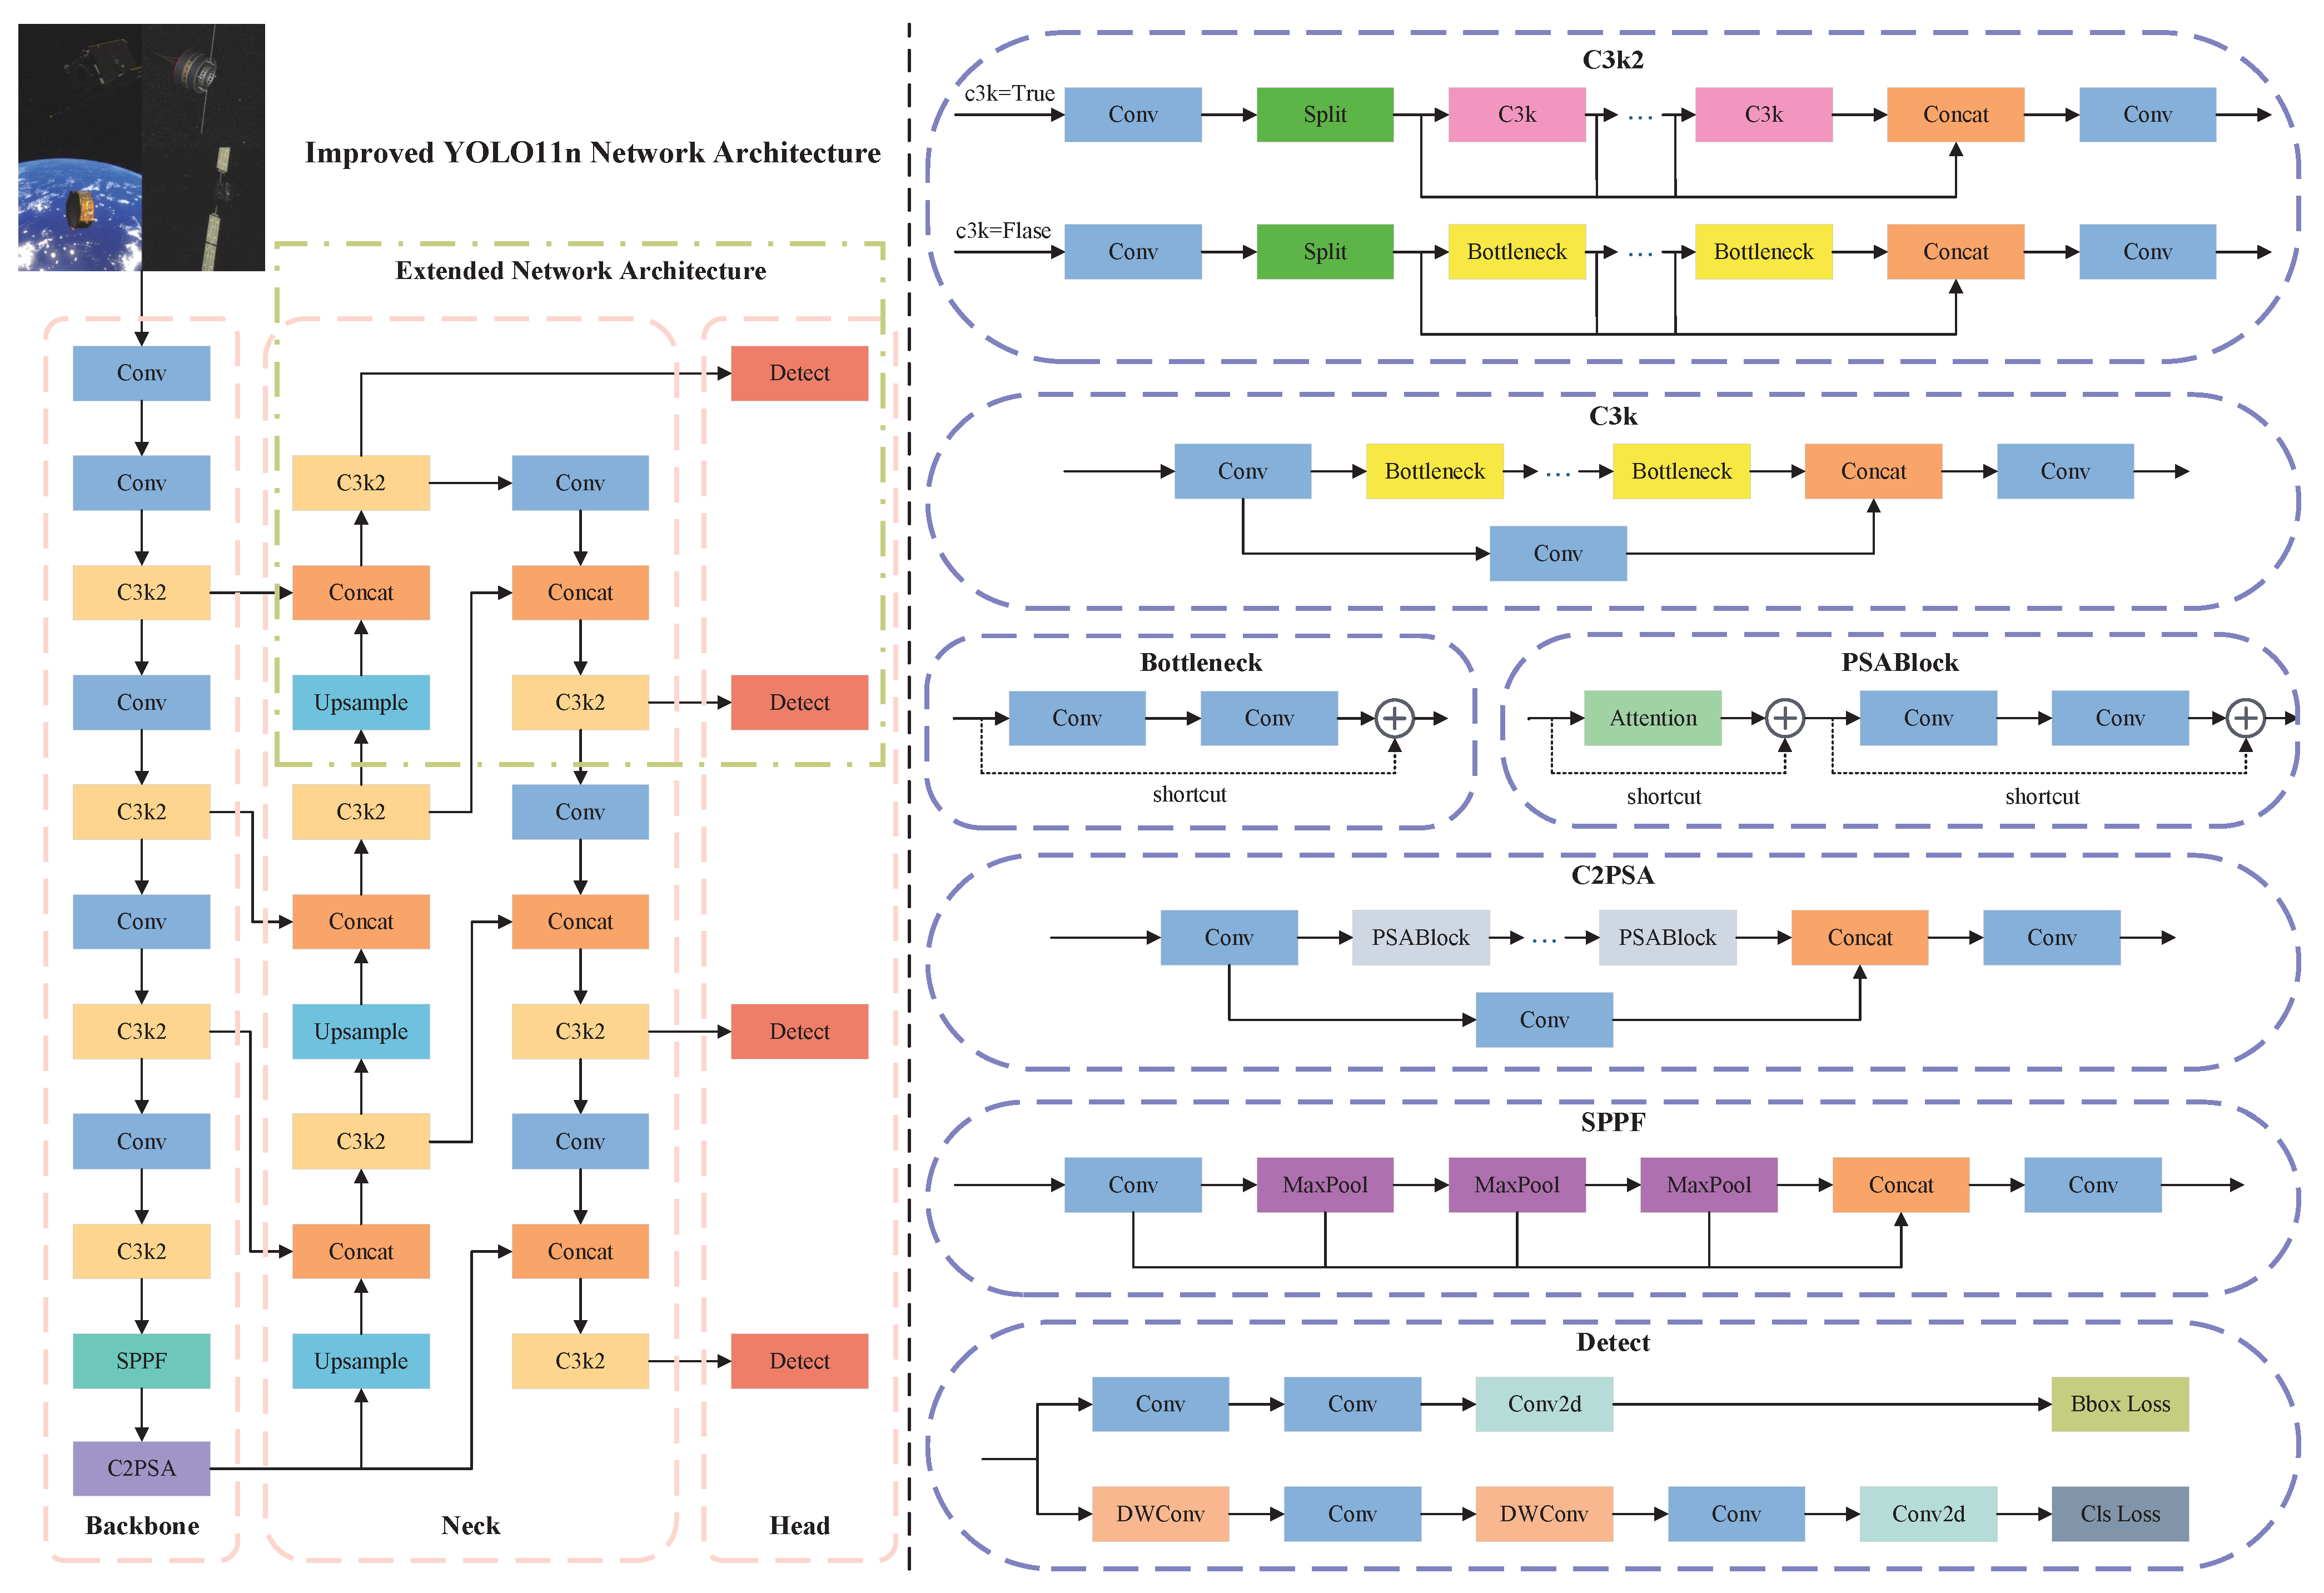
27] also builds upon YOLOv8, approaching the problem from the perspective of cross-scale feature fusion, and likewise achieves promising detection performance for space debris. Compared with these studies, the method used in this work is based on YOLO11, whose structural improvements over previous YOLO versions enhance detection performance. Additionally, further architectural modifications are made to the original YOLO11 to improve its ability to detect small objects, which frequently appear in space object detection tasks.
Small object detection remains a significant challenge in space object detection [28,29]. To tackle this issue, most typical approaches focus on network architecture and data augmentation [30]. In terms of network architecture, Feature Pyramid Networks (FPN) [31] and their variants [32] are commonly employed. These methods focus on efficient and effective feature fusion, enhancing the representation of small objects across different feature layers. Other approaches include various data augmentation techniques, and previous work has mainly concentrated on using handcrafted data augmentation strategies [
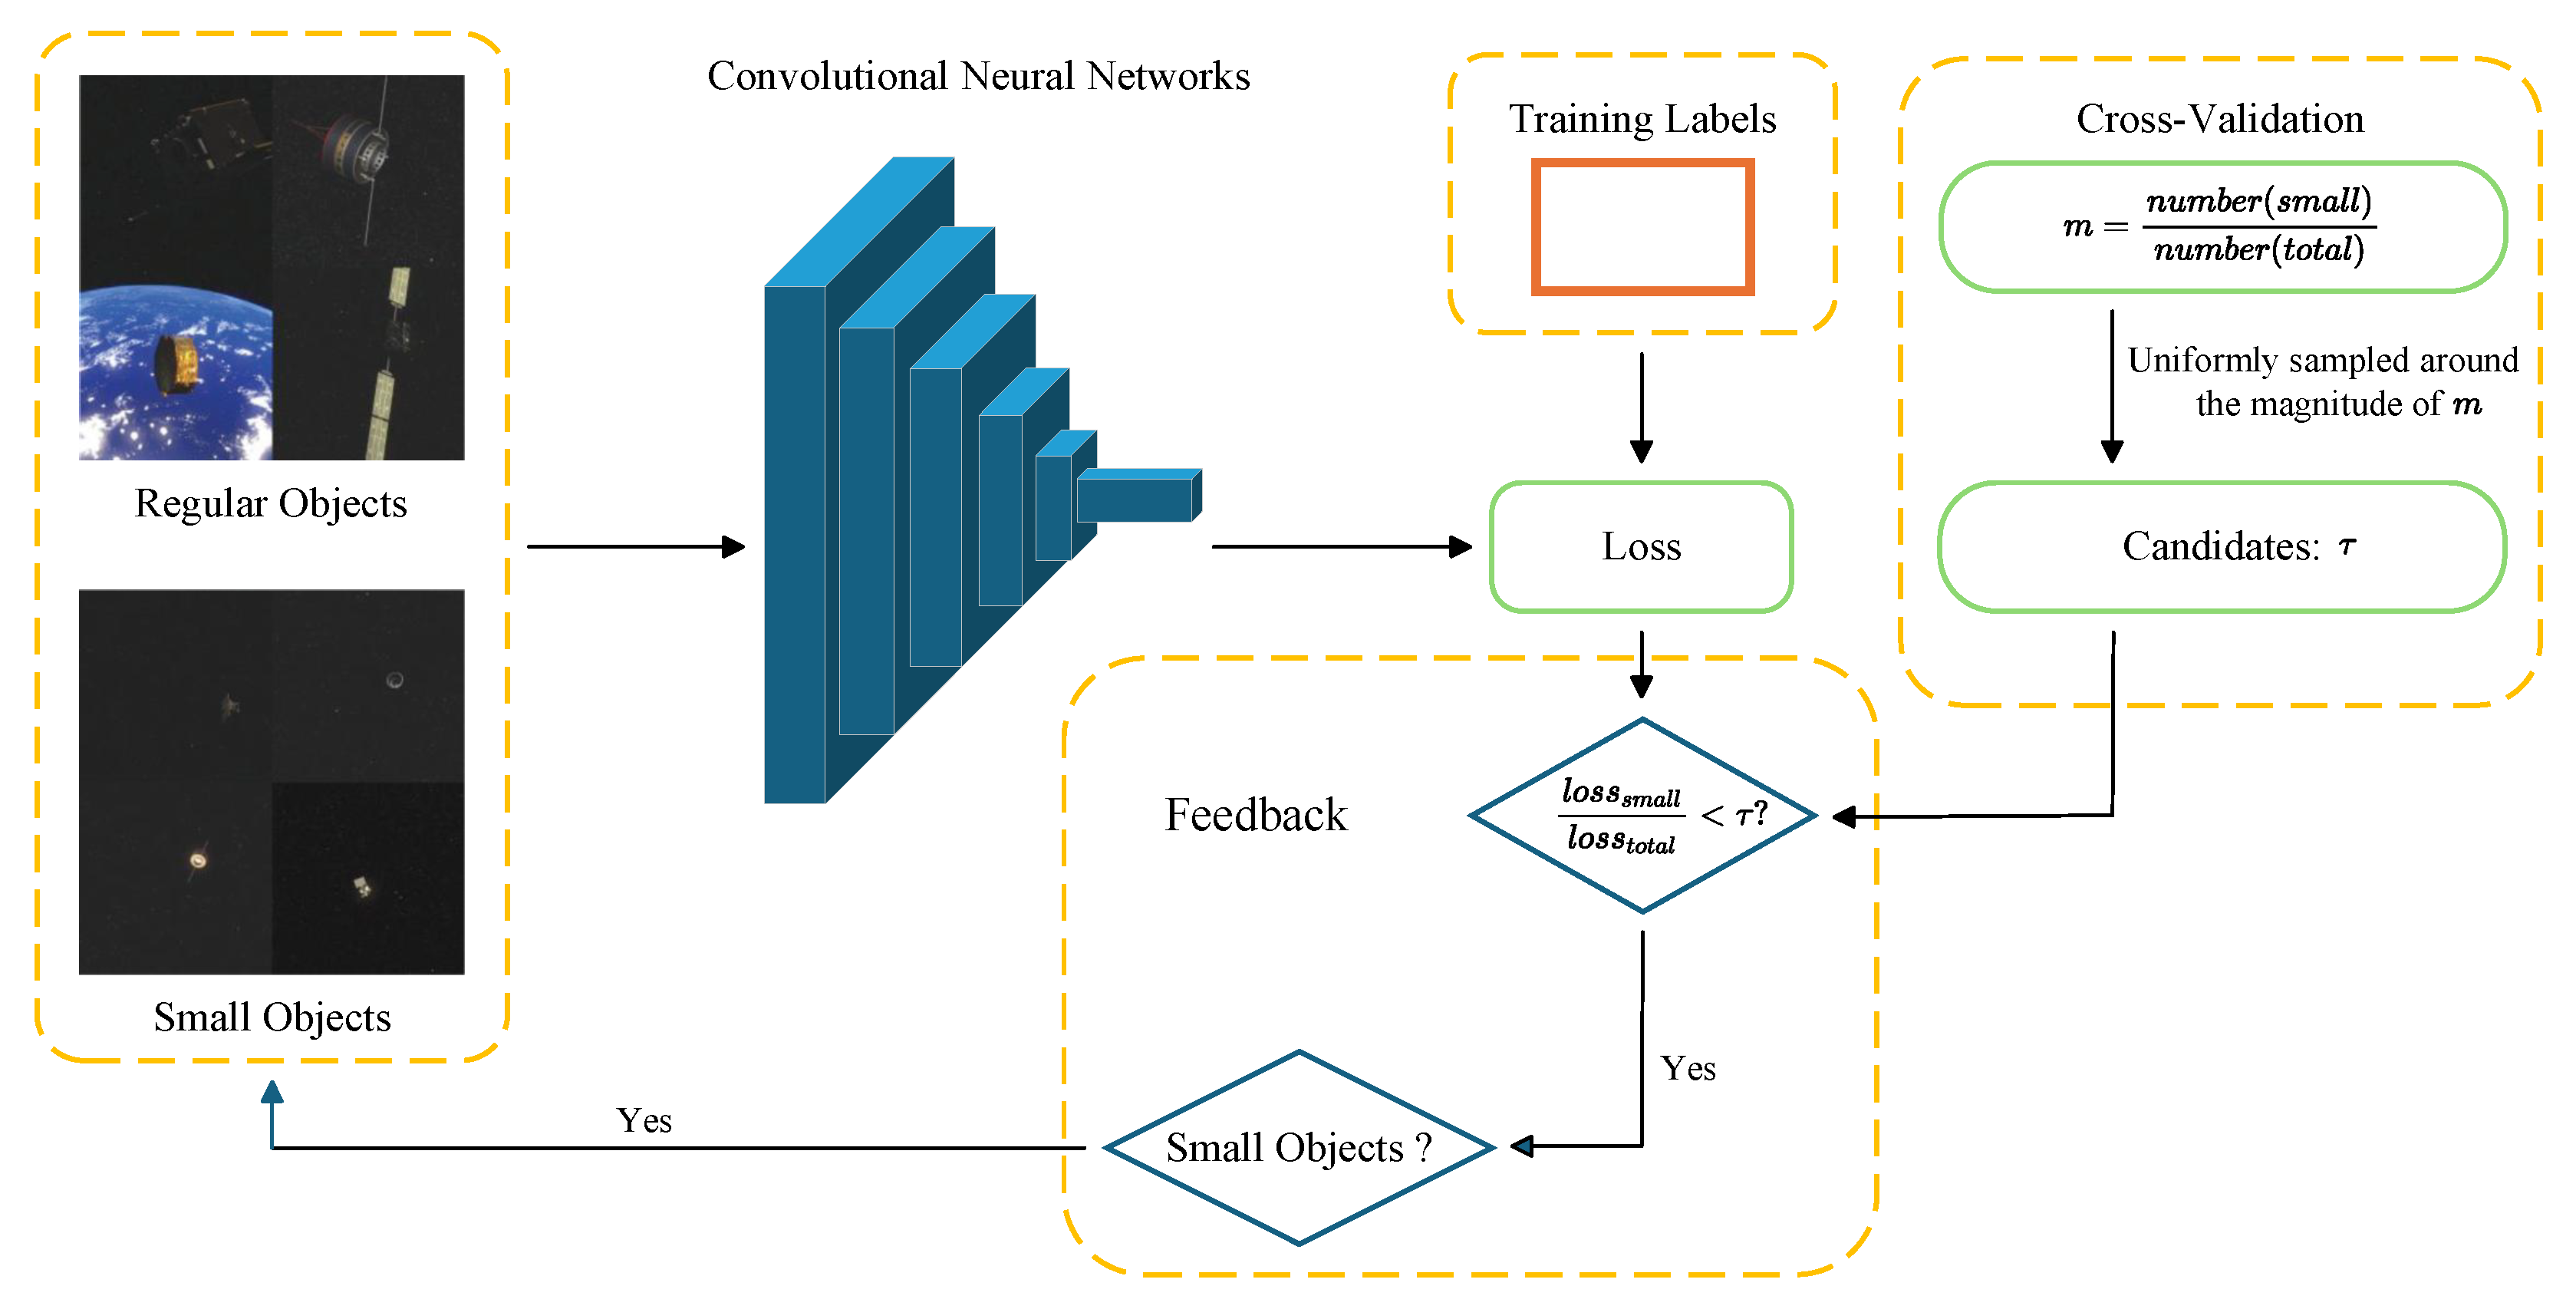
33] to enable the model to learn multi-scale features. In this work, to address the challenge of small object detection, targeted structural improvements are made to YOLO11, and a loss-guided online data augmentation method is proposed to further optimize the detection process for small objects.
Building on the insights discussed above, YOLO11 serves as the baseline, with several improvements introduced for the space object detection scenario. The main contributions of this paper can be summarized as follows:
  • A complete object detection framework tailored to the characteristics of space targets is proposed, encompassing image preprocessing, data augmentation, and network architecture enhancements. The experimental results demonstrate that the proposed algorithm effectively improves detection performance.
  • A loss-guided online data augmentation technique is proposed, along with improvements to the YOLO11 network structure, to address the challenge of small object detection in the dataset.
In the following, Section 2 introduces SPARK-2022, a space object detection dataset, highlighting its design and relevance to the field. Section 3 presents our proposed method, which integrates bilateral filtering, CLAHE, loss-guided online data augmentation, and architecture improvements to YOLO11. Experimental results and conclusions are discussed in Section 4 and Section 5, respectively.

2. SPARK-2022 Dataset

The SPARK-2022 dataset [34,35], developed by the University of Luxembourg for the Spark Challenge 2022, is specifically designed for space object detection. It consists of 88,000 RGB images with a resolution of 1024 × 1024, representing 10 classes of spacecraft and 1 class of space debris. The dataset is split into a training set of 66,000 images—a validation set of 11,000 images, and a test set of 11,000 images—with an equal distribution of each class across all subsets. The 10 spacecraft classes include smart_1, cheops, lisa_pathfinder, proba_3_ocs, proba_3_csc, soho, earth_observation_sat_1, proba_2, xmm_newton, and double_star, and the space debris includes components from the Space Shuttle’s external fuel tank, orbital docking systems, damaged communication dishes, thermal protection tiles, and connectors. The histograms of bounding box sizes in the training set of the dataset are presented in Figure 1. The horizontal axis represents the proportion of the bounding box area relative to the entire image, while the vertical axis indicates the corresponding frequency. It can be observed that small objects are widely present in the dataset.
To comprehensively simulate a wide range of space environmental conditions, the dataset leverages extensive domain randomization techniques and is generated within a highly realistic space simulation environment. This approach ensures the inclusion of data from diverse orbital scenarios, varying levels of background noise, and different sensor configurations. Moreover, the dataset encompasses a broad spectrum of sensing conditions, ranging from typical to extreme and challenging scenarios. These challenging conditions include low signal-to-noise ratios (SNR) and high image contrast, which are characteristic features of actual space imagery. This design philosophy enables the dataset to capture the complexities and variability inherent in real-world space environments. Notably, the Earth, placed at the center of all orbital scenario 3D environments, is represented by a realistic model composed of 16,000 polygons and high-resolution textures. Surrounding space textures are sourced from a detailed panoramic image of the Milky Way galaxy. The model also features intricate elements such as dynamic clouds, cloud shadows, and atmospheric scattering effects, contributing to a highly immersive visual effect. Figure 2 presents sample images from the dataset.

3. Method

3.1. Bilateral Filtering

Space images are often contaminated by noise, which can hinder the detection of spacecraft and space debris. Therefore, it is essential to apply denoising techniques before feeding the images into the detection network.
For spacecraft and space debris detection, edge and texture details are vital. Therefore, bilateral filtering [12,13,36] is selected as the denoising method, as it simultaneously considers both the spatial domain (geometric information) and the pixel value domain (intensity information), effectively preserving edge features while removing noise. The output of the bilateral filter I ( p ) for each pixel I ( p ) in the image can be calculated using the following formula:
I ( p ) = q Ω I ( q ) f s ( | | p q | | ) f r ( | | I ( p ) I ( q ) | | ) q Ω f s ( | | p q | | ) f r ( | | I ( p ) I ( q ) | | )
where p denotes the position of the current pixel, q represents a pixel position in the neighborhood, and  Ω indicates the range of the neighborhood. I ( p ) and I ( q ) are the values of the pixels p and q, respectively. | | p q | | is the spatial distance (Euclidean distance), and  | | I ( p ) I ( q ) | | is the difference in pixel values. f s is a spatial Gaussian function, controlling the spatial influence of the pixels, while f r is a pixel value Gaussian function, controlling the influence of pixel value differences. f s and f r can be written as Equation (2), where σ s and σ r are the standard deviations of the spatial and value domains, respectively, controlling the weights of spatial proximity and pixel value similarity.
f s ( | | p q | | ) = exp | | p q | | 2 2 σ s 2 f r ( | | I ( p ) I ( q ) | | ) = exp | | I ( p ) I ( q ) | | 2 2 σ r 2

3.2. Contrast-Limited Adaptive Histogram Equalization

In the space environment with low light intensity, most images tend to exhibit dark objects and background with low contrast, posing challenges for detection. To address this issue, CLAHE [15,16] is considered as a method to enhance the contrast between the spacecraft or space debris and the background.
Unlike the global processing method of traditional histogram equalization, CLAHE first divides the input images into multiple small blocks and calculates the histogram within each block. As the pixel values within certain small blocks are nearly equal, the histogram becomes highly concentrated, leading to the amplification of noise in nearly uniform regions. Therefore, CLAHE clips the histogram of each small block by setting a contrast limit threshold. If the frequency of a certain pixel value exceeds the threshold, it is clipped, and the excess part is smoothly redistributed to other pixel values. After clipping and normalizing the histogram of each small block, the cumulative distribution function (CDF) [37] of the k-th pixel value of the block is calculated, as shown in Equation (3).
C D F ( r k ) = i = 0 k n ( r i ) n
where r i represents the pixel value, n ( r i ) denotes the number of pixels corresponding to that pixel value, and n is the total number of pixels within the small block. For each pixel, its pixel value r k will be remapped to a new pixel value r k based on the CDF of the block, which can be expressed as:
r k = round [ C D F ( r k ) · ( L 1 ) + 0.5 ]
where L represents the maximum pixel level, and round[.] denotes the rounding operation. The equalized histogram can be determined based on the mapping relationship. After equalizing each small block, CLAHE stitches them together to form a complete image. During this process, noticeable seams (block effects) can occur at the boundaries, so bilinear interpolation is applied to smooth the transitions and avoid unnatural blocky edges, which can be written as:
P 1 ( x ) = x 2 x x 2 x 1 · P 11 + x x 1 x 2 x 1 · P 12 P 2 ( x ) = x 2 x x 2 x 1 · P 21 + x x 1 x 2 x 1 · P 22 P ( x , y ) = y 2 y y 2 y 1 · P 1 ( x ) + y y 1 y 2 y 1 · P 2 ( x )
where the target point for interpolation is given by the coordinates ( x , y ) , and  P ( x , y ) represents the interpolated value at that point. To perform the interpolation, we need to find the four nearest blocks surrounding ( x , y ) to form a rectangle. In this rectangle, P 11 , P 12 , P 21 , and P 22 are the pixel values at the four corners, where P 11 is at the top-left corner ( x 1 , y 1 ) , P 12 is at the top-right corner ( x 2 , y 1 ) , P 21 is at the bottom-left corner ( x 1 , y 2 ) , and  P 22 is at the bottom-right corner ( x 2 , y 2 ) .

3.3. Loss-Guided Online Data Augmentation

Small objects are prevalent in the SPARK-2022 dataset, where they are defined as objects smaller than 32 × 32 in absolute scale [38]. Generally, the performance of object detection varies with scale, with the detection of small objects being the least satisfactory. Previous work has mainly addressed this challenge by improving network architectures and using data augmentation techniques. Particularly, ref. [30] suggests that the poor performance of small object detection is attributed to the minimal contribution of small object losses to the total loss during most training iterations, which leads to an imbalance in the optimization process.
Inspired by this idea, we propose a loss-guided online data augmentation strategy to address the imbalance in optimization, to improve the detection performance of small objects. The essence of the strategy is to use the loss proportion as feedback to guide the optimization of small objects. When the loss contribution from small objects falls below a certain threshold τ , the number of small object samples in the training set is increased to ensure more thorough optimization. The algorithmic procedure and its corresponding schematic illustration are presented in Algorithm 1 and Figure 3, respectively, where τ is a hyperparameter representing the desired ratio between the small object loss and the total loss. The selection of the ratio τ is based on the distribution of small objects in the dataset. Specifically, the proportion m of small objects relative to the total number of objects is first computed. Ten candidate values are then selected around the order of magnitude of m, and a 10-fold cross-validation is conducted to determine the optimal value of τ . This procedure ensures that the parameter selection is both data-driven and empirically supported. In this study, the chosen value of τ is 0.4 based on experimental results.
Algorithm 1 Loss-Guided Online Data Augmentation for Small Object Detection in YOLO11
Require: 
A set of training images with corresponding annotations (including both regular and small objects), a YOLO11 detection model, loss ratio threshold τ , and total number of training iterations N.
Ensure: 
YOLO11 model optimized for improved detection performance of small objects.
  1:
Initialize the YOLO11 model parameters.
  2:
Preprocess the training dataset: categorize annotated objects into regular and small objects, where small objects are defined as those with bounding box areas less than 32 × 32 pixels.
  3:
for  i = 1 to N do
  4:
    Input the training images to the YOLO11 model
  5:
    Perform a forward pass to generate object detection predictions.
  6:
    Compute the total loss l o s s t o t a l between predictions and ground truth annotations.
  7:
    Compute the loss l o s s s m a l l specifically for small objects.
  8:
    Evaluate the relative contribution of small object loss:
  9:
    if  l o s s s m a l l l o s s t o t a l < τ  then
10:
        Reintroduce trained small object samples into the small object training subset.
11:
        Incorporate the trained small object samples into the next iteration.
12:
    end if
13:
    Update the YOLO11 model parameters via backpropagation.
14:
end for

3.4. YOLO11 Improvements for Small Object Detection

Compared to earlier versions, YOLO11 enhances the network architecture by integrating components such as C3k2 and C2PSA, achieving higher accuracy with fewer parameters. Considering the real-time requirements of spacecraft object detection, the YOLO11 Nano (YOLO11n) detection model is chosen as the baseline, with a parameter count of less than 3 M.
The architecture of YOLO11n can be primarily composed of three components: Backbone, Neck, and Head. The Backbone is responsible for extracting both shallow and deep features. The Neck performs the ordered fusion of multi-scale input features, and the Head uses the fused features to perform regression predictions for both object categories and location information.
Feature extraction in the Backbone is achieved through the alternating stacking of convolution modules and C3k2 modules, with a total of five downsampling operations. In the original YOLO11n, the feature map from the final downsampling is fed into Spatial Pyramid Pooling Fast (SPPF), an improved version of Spatial Pyramid Pooling (SPP), which transforms input feature maps of varying sizes into fixed-size output feature maps. Unlike the simple parallel structure in SPP, SPPF replaces max pooling with a hybrid structure combining both serial and parallel operations.
Feature fusion in the Neck is motivated by Path Aggregation Feature Pyramid Networks (PAFPNs) [32]. Compared to traditional Feature Pyramid Networks (FPNs), PAFPN enhances feature fusion by introducing path aggregation technology, which incorporates bottom-up information flow alongside the top-down process, enabling more effective integration of low-level and high-level features. Additionally, feature aggregation is performed through multiple horizontal paths, further enhancing the information flow across different levels.
The fused features are passed into the detection head for regression, where the loss function is composed of classification loss and bounding box loss. The classification loss uses Varifocal Loss (VFL) [39], which focuses on asymmetrically handling positive and negative samples by applying different weighting strategies, as described in Equation (6).
VFL = q ( q log p + ( 1 q ) log ( 1 p ) ) if q > 0 β p γ log ( 1 p ) if q = 0
where q is a label, which is set to the Intersection over Union (IoU) between the generated bounding box and the ground truth bounding box for positive samples, and 0 for negative samples. p represents the class prediction probability. β denotes a balancing factor, and γ denotes a modulation factor, both of which are hyperparameters used to control the weight distribution for easy and hard samples. The bounding box loss consists of Complete Intersection over Union Loss (CIoUL) [40] and Distribution Focal Loss (DFL) [41], which can be expressed as Equations (7) and (8), respectively.
CIoUL = 1 IoU + ρ 2 ( b , b g t ) d 2 + α v s . v s . = 4 π 2 arctan w g t h g t arctan w h 2 α = v ( 1 IoU ) + v
where α is the weight function, v is used to measure the aspect ratio similarity between the predicted and ground truth bounding boxes. w gt and h gt represent the width and height of the ground truth bounding box, while w and h are those of the predicted bounding box. c denotes the distance of the smallest enclosing diagonal, and ρ ( b , b g t ) refers to the distance between the centers of the two bounding boxes. The introduction of DFL is designed to complement the Anchor-Free mechanism in YOLO11. DFL optimizes the probabilities of the positions closest to the label y, including the left y i and right y i + 1 positions, in the form of cross-entropy. This enables the network to focus more efficiently on the target location and the distribution of nearby regions.
DFL = ( ( y i + 1 y ) log ( p i ) + ( y y i ) log ( p i + 1 ) )
where p i and p i + 1 represent the probabilities of the left and right positions output by the distribution function. The total loss is obtained by the weighted sum of these three loss components, which can be expressed as:
L = c 1 · VFL + c 2 · CIoUL + c 3 · DFL
where c 1 , c 2 , and c 3 are the weights, which are hyperparameters set before training.
Based on experimental observations, one reason for the poor performance of YOLO11 in small object detection is that small objects occupy a small portion of the entire image, while the large downsampling factor of the detection model makes it difficult to extract small object features from deeper feature maps. To address this, we extract features from shallower layers, which are then fused in the Neck using a PAFPN. Additionally, a dedicated detection head for small objects is added to the Head. The improved network structure is shown in Figure 4.
Figure 4. The network architecture of the improved YOLO11n and its submodules. The full names of the abbreviated module labels in the figure are provided in Table 1. Compared with the original YOLO11n, the Neck is enhanced by incorporating features from the shallowest C3k2 layer of the Backbone. Additionally, a dedicated detection head for small object detection is added to the Head. The modifications are described in the “Extended Network Architecture” above.
Aerospace 12 00568 g004
Table 1. The full names of the abbreviated module labels.
Abbreviated NameFull Name
ConvConvolution
Conv2dTwo-dimensional Convolution
C3kCross Stage Partial-based 3-layer Module with k Convolutions
C3k2Cross Stage Partial-based 3-layer Module with 2 Convolutions
C2PSACross Stage Partial-based 2-layer Module with Pixel-wise Spatial Attention
SPPFSpatial Pyramid Pooling Fast
BottleneckBottleneck Residual Block
PSABlockPixel-wise Spatial Attention Block
MaxPoolMax Pooling
DWConvDepthwise Convolution

4. Experiments and Results

4.1. Evaluation Metrics

The performance metrics used to evaluate object detection models include Precision P, Recall R, Average Precision A P , and mean Average Precision (mAP). True Positive T P , False Positive F P , and False Negative F N represent correctly predicted positive samples, incorrectly predicted positive samples, and missed positive samples, respectively, and Precision P and Recall R can be defined as:
P = T P T P + F P R = T P T P + F N
From the above definitions, it can be understood that Precision is the proportion of actual positive samples among all those predicted as positive, representing the accuracy of the model in positive predictions. Recall is the proportion of predicted positive samples among all actual positive samples, reflecting the ability of the model to recognize positive samples. A P is defined as the area under the Precision–Recall curve at a specific IoU threshold, which can be expressed as Equation (11), and mAP is the mean of the A P values for all C categories, which can be demonstrated as Equation (12).
A P = 0 1 P ( R ) d R
mAP = 1 C i = 1 C A P ( i )
mAP50 is the mAP calculated at an IoU threshold of 0.50, and mAP50-95 is the mAP averaged over IoU thresholds ranging from 0.50 to 0.95, with an increment of 0.05.

4.2. Experimental Results

The training process remains stable, with all training and validation metrics performing well, as shown in Figure 5. Notably, the abrupt decrease in training loss observed during the final 10 epochs can be attributed to the deactivation of Mosaic data augmentation during this phase. During the last phases of training, Mosaic data augmentation is disabled to reduce the interference introduced by augmented samples, enhance the ability of the model to fit the real dataset, and enable better convergence to the target distribution of the real dataset. All three loss functions for both training and validation exhibit a consistent downward and convergent trend, indicating a stable training process without signs of overfitting. Precision and Recall rise sharply during the initial training stages and eventually converge to values, reflecting strong performance in terms of both accuracy and completeness. Likewise, both mAP50 and mAP50-95 show rapid improvements early in training before reaching convergence, suggesting a steady enhancement in overall model accuracy throughout the training process.
The test set contains a total of 11,000 images, with 1000 images per class. The detection results are illustrated in Figure 6. As shown in Table 2, the improved YOLO11n achieved an overall mAP50 of 99.0 % and a mAP50-95 of 92.6 % , demonstrating excellent detection performance. Combined with the confusion matrix in Figure 7, it can be observed that the detection performance for each class is excellent, with all achieving an accuracy of over 88 % .

4.3. Ablation Studies

To validate the effectiveness of the proposed methods in this study, the ablation experiment is performed using the original YOLO11n as the baseline. The experiment investigates the effects of adding each method individually as well as applying all methods simultaneously. Furthermore, it is well established that data augmentation generally enhances performance by increasing the number of training iterations. To demonstrate the advantage of the proposed loss-guided data augmentation method, an additional experiment is conducted in which, for each training iteration, an equivalent number of samples are randomly drawn from the training dataset. The total number of training iterations is correspondingly increased to match that of the proposed method. The results of these experiments are presented in Table 3. It can be seen that the mAP50 increased by 2.6 % , and the mAP50-95 improved by 6.1 % , demonstrating the contributions of each enhancement to the overall performance. It can also be observed that the proposed loss-guided data augmentation method significantly improves detection performance compared to conventional data augmentation methods.
In addition, further investigation is conducted to assess whether the proposed loss-guided online data augmentation method and the network architecture modifications for small object detection are indeed effective. To this end, 4361 small object images are selected from the original 11,000 test images to form the test set for ablation experiments. The results of these experiments are presented in Table 4. As shown in Table 4, the mAP50 for small objects increased by 8.2 % , and the mAP50-95 improved by 9.9 % , validating the effectiveness of the proposed methods in enhancing small object detection performance. In particular, the loss-guided online data augmentation method contributed most significantly to the improvement in small object detection capabilities.
During training, an RTX 4090 GPU is used with a batch size set to 64. As shown in Figure 8, among more than 1000 iterations per epoch, small object images are reused only approximately 50 times on average. This indicates that the proposed loss-guided online data augmentation method does not introduce significant additional training costs, further demonstrating the efficiency and practicality of the approach.

4.4. Scaling Studies

In this experiment, the effectiveness of the proposed method across models of varying sizes is examined. Specifically, models of different sizes, including YOLO11n, YOLO11s, YOLO11m, YOLO11l, and YOLO11x, are compared to assess the impact of model complexity on detection accuracy. Here, the letters n, s, m, l, and x stand for nano, small, medium, large, and extra-large, respectively, indicating progressively larger models with increasing numbers of parameters. The corresponding parameter counts and Floating Point Operations (FLOPs) for each model are presented in Table 5, and the mAP achieved by each model is illustrated in Figure 9. The mAP exhibits a positive correlation with model size, validating the generalizability of the proposed method across architectures of varying scales.

4.5. Dataset Transfer

To further investigate the transferability of the proposed method across different datasets, an evaluation is conducted on the SPEED dataset (Spacecraft PosE Estimation Dataset) [42,43] to assess its robustness and generalization capability. SPEED is a benchmark dataset designed for training and evaluating pose estimation models of non-cooperative spacecraft. It comprises both real and synthetic images captured under high-fidelity lighting conditions and provides diverse and accurate pose annotations to address domain discrepancies between synthetic and real-world data.
A total of 10,000 images are manually annotated with bounding boxes and subsequently divided into training, validation, and testing sets following a 7:2:1 split. The detection results are illustrated in Figure 10. To validate the effectiveness of the proposed method, ablation studies were also conducted on the SPEED, with the corresponding results presented in Table 6. The performance shows a 1.8 % improvement in mAP50 and a 3.0 % improvement in mAP50-95.

5. Conclusions

To address the issues of noise, low contrast, and the widespread presence of small objects in space object detection, this paper proposes a framework for spacecraft and space debris detection. Firstly, bilateral filtering is used to address the issue of background noise, with the benefit of effectively removing noise while preserving edge features. Additionally, CLAHE is employed to enhance the contrast of dark backgrounds. Furthermore, a loss-guided online data augmentation is proposed to increase the contribution of small object loss to the total loss, enabling better optimization of small objects. Finally, the network architecture is further improved by leveraging shallower features to enhance the detection rate of small objects. Experimental results demonstrate that these methods significantly improve detection accuracy.
In this paper, the ablation study results indicate that data augmentation contributes more significantly to the improvement of small object detection accuracy than changes in the network architecture. Future research will focus on enhancing the network architecture from the perspective of feature fusion to further improve the abilities of small object detection in spacecraft applications.

Author Contributions

Conceptualization, Y.Z.; methodology, Y.Z. and T.Z.; software, Y.Z.; validation, Y.Z.; formal analysis, Y.Z.; investigation, Y.Z.; resources, Y.Z. and J.Q.; data curation, Y.Z.; writing—original draft preparation, Y.Z.; writing—review and editing, Y.Z., Z.L., T.Z. and J.Q.; visualization, Y.Z. and Z.L.; supervision, T.Z. and J.Q.; project administration, Y.Z. and J.Q.; funding acquisition, J.Q. All authors have read and agreed to the published version of the manuscript.

Funding

This work was supported by the National Natural Science Foundation of China (U21B6001, 62273121), and the Self-Planned Task of State Key Laboratory of Robotics and Systems of Harbin Institute of Technology (No. SKLRS202506B).

Data Availability Statement

The data presented in this study are available upon request from the corresponding author.

Conflicts of Interest

The authors declare no conflicts of interest.

References

  1. Park, T.H.; D’Amico, S. Robust Multi-Task Learning and Online Refinement for Spacecraft Pose Estimation Across Domain Gap. Adv. Space Res. 2024, 73, 5726–5740. [Google Scholar] [CrossRef]
  2. Piazza, M.; Maestrini, M.; Lizia, P.D. Monocular Relative Pose Estimation Pipeline for Uncooperative Resident Space Objects. J. Aerosp. Inf. Syst. 2022, 19, 613–632. [Google Scholar] [CrossRef]
  3. Rizzuto, S.S.; Cipollone, R.; De Vittori, A.; Di Lizia, P.; Massari, M. Object Detection on Space-Based Optical Images Leveraging Machine Learning Techniques. Neural Comput. Appl. 2025. [Google Scholar] [CrossRef]
  4. De Vittori, A.; Cipollone, R.; Di Lizia, P.; Massari, M. Real-Time Space Object Tracklet Extraction from Telescope Survey Images with Machine Learning. Astrodynamics 2022, 6, 205–218. [Google Scholar] [CrossRef]
  5. Chen, X.; Qiu, J.; Wang, T.; Li, M. Onboard Mission Planning for Autonomous Avoidance of Spacecraft Subject to Various Orbital Threats: An SMT-Based Approach. IEEE Trans. Aerosp. Electron. Syst. 2025, 61, 4866–4878. [Google Scholar] [CrossRef]
  6. Faraco, N.; Maestrini, M.; Di Lizia, P. Instance Segmentation for Feature Recognition on Noncooperative Resident Space Objects. J. Spacecr. Rocket. 2022, 59, 2160–2174. [Google Scholar] [CrossRef]
  7. European Space Agency. ESA Space Environment Report 2025; Technical Report Issue 9; ESA Space Debris Office: Darmstadt, Germany, 2025; Available online: https://www.sdo.esoc.esa.int/environment_report/Space_Environment_Report_latest.pdf (accessed on 20 May 2025).
  8. Pugliatti, M.; Maestrini, M. Small-Body Segmentation Based on Morphological Features with a U-Shaped Network Architecture. J. Spacecr. Rocket. 2022, 59, 1821–1835. [Google Scholar] [CrossRef]
  9. Pugliatti, M.; Franzese, V.; Topputo, F. Data-Driven Image Processing for Onboard Optical Navigation Around a Binary Asteroid. J. Spacecr. Rocket. 2022, 59, 943–959. [Google Scholar] [CrossRef]
  10. Dumitrescu, F.; Ceachi, B.; Truică, C.O.; Trăscău, M.; Florea, A.M. A Novel Deep Learning-Based Relabeling Architecture for Space Objects Detection from Partially Annotated Astronomical Images. Aerospace 2022, 9, 520. [Google Scholar] [CrossRef]
  11. Lin, B.; Wang, J.; Wang, H.; Zhong, L.; Yang, X.; Zhang, X. Small Space Target Detection Based on a Convolutional Neural Network and Guidance Information. Aerospace 2023, 10, 426. [Google Scholar] [CrossRef]
  12. Aurich, V.; Weule, J. Non-linear Gaussian Filters Performing Edge Preserving Diffusion. In Mustererkennung 1995: Verstehen Akustischer und Visueller Informationen; Springer: Berlin/Heidelberg, Germany, 1995; pp. 538–545. [Google Scholar]
  13. Tomasi, C.; Manduchi, R. Bilateral Filtering for Gray and Color Images. In Proceedings of the International Conference on Computer Vision (ICCV), Bombay, India, 7 January 1998; pp. 839–846. [Google Scholar]
  14. Li, Y.; Ma, P.; Huo, J. SFSNet: An Inherent Feature Segmentation Method for Ground Testing of Spacecraft. Aerospace 2023, 10, 877. [Google Scholar] [CrossRef]
  15. Musa, P.; Al Rafi, F.; Lamsani, M. A Review: Contrast-Limited Adaptive Histogram Equalization (CLAHE) Methods to Help the Application of Face Recognition. In Proceedings of the International Conference on Informatics and Computing (ICIC), Palembang, Indonesia, 17–18 October 2018; pp. 1–6. [Google Scholar]
  16. Reza, A.M. Realization of the Contrast Limited Adaptive Histogram Equalization (CLAHE) for Real-time Image Enhancement. J. VLSI Signal Process. Syst. Signal Image Video Technol. 2004, 38, 35–44. [Google Scholar] [CrossRef]
  17. Zou, Z.; Chen, K.; Shi, Z.; Guo, Y.; Ye, J. Object Detection in 20 Years: A Survey. Proc. IEEE 2023, 111, 257–276. [Google Scholar] [CrossRef]
  18. Zhao, Z.Q.; Zheng, P.; Xu, S.t.; Wu, X. Object Detection with Deep Learning: A Review. IEEE Trans. Neural Networks Learn. Syst. 2019, 30, 3212–3232. [Google Scholar] [CrossRef]
  19. Girshick, R.; Donahue, J.; Darrell, T.; Malik, J. Rich Feature Hierarchies for Accurate Object Detection and Semantic Segmentation. In Proceedings of the IEEE Conference on Computer Vision and Pattern Recognition (CVPR), Columbus, OH, USA, 23–28 June 2014; pp. 580–587. [Google Scholar]
  20. Ren, S.; He, K.; Girshick, R.; Sun, J. Faster R-CNN: Towards Real-Time Object Detection with Region Proposal Networks. IEEE Trans. Pattern Anal. Mach. Intell. 2016, 39, 1137–1149. [Google Scholar] [CrossRef]
  21. Dai, J.; Li, Y.; He, K.; Sun, J. R-FCN: Object Detection via Region-based Fully Convolutional Networks. In Proceedings of the 30th International Conference on Neural Information Processing Systems, Barcelona, Spain, 5–10 December 2016; Volume 29, pp. 379–387. [Google Scholar]
  22. Redmon, J.; Divvala, S.; Girshick, R.; Farhadi, A. You Only Look Once: Unified, Real-Time Object Detection. In Proceedings of the IEEE Conference on Computer Vision and Pattern Recognition (CVPR), Las Vegas, NV, USA, 27–30 June 2016; pp. 779–788. [Google Scholar]
  23. Liu, W.; Anguelov, D.; Erhan, D.; Szegedy, C.; Reed, S.; Fu, C.Y.; Berg, A.C. SSD: Single Shot MultiBox Detector. In Proceedings of the European Conference on Computer Vision (ECCV), Amsterdam, The Netherlands, 11–14 October 2016; Springer: Cham, Switzerland, 2016; pp. 21–37. [Google Scholar]
  24. Lin, T.Y.; Goyal, P.; Girshick, R.; He, K.; Dollár, P. Focal Loss for Dense Object Detection. IEEE Trans. Pattern Anal. Mach. Intell. 2020, 42, 318–327. [Google Scholar] [CrossRef]
  25. AlDahoul, N.; Karim, H.A.; De Castro, A.; Toledo Tan, M.J. Localization and Classification of Space Objects Using EfficientDet Detector for Space Situational Awareness. Sci. Rep. 2022, 12, 21896. [Google Scholar] [CrossRef]
  26. Jocher, G.; Qiu, J. Ultralytics YOLO11; Ultralytics: Frederick, MD, USA, 2024. [Google Scholar]
  27. Guo, Y.; Yin, X.; Xiao, Y.; Zhao, Z.; Yang, X.; Dai, C. Enhanced YOLOv8-based method for space debris detection using cross-scale feature fusion. Discov. Appl. Sci. 2025, 7, 95. [Google Scholar] [CrossRef]
  28. Liu, Y.; Sun, P.; Wergeles, N.; Shang, Y. A Survey and Performance Evaluation of Deep Learning Methods for Small Object Detection. Expert Syst. Appl. 2021, 172, 114602. [Google Scholar] [CrossRef]
  29. Cheng, G.; Yuan, X.; Yao, X.; Yan, K.; Zeng, Q.; Xie, X.; Han, J. Towards Large-scale Small Object Detection: Survey and Benchmarks. IEEE Trans. Pattern Anal. Mach. Intell. 2023, 45, 13467–13488. [Google Scholar] [CrossRef]
  30. Chen, Y.; Zhang, P.; Kong, T.; Li, Y.; Zhang, X.; Qi, L.; Sun, J.; Jia, J. Scale-aware Automatic Augmentations for Object Detection with Dynamic Training. IEEE Trans. Pattern Anal. Mach. Intell. 2022, 45, 2367–2383. [Google Scholar] [CrossRef] [PubMed]
  31. Lin, T.Y.; Dollar, P.; Girshick, R.; He, K.; Hariharan, B.; Belongie, S. Feature Pyramid Networks for Object Detection. In Proceedings of the IEEE Conference on Computer Vision and Pattern Recognition (CVPR), Honolulu, HI, USA, 21–26 July 2017; pp. 936–944. [Google Scholar]
  32. Liu, S.; Qi, L.; Qin, H.; Shi, J.; Jia, J. Path Aggregation Network for Instance Segmentation. In Proceedings of the IEEE/CVF Conference on Computer Vision and Pattern Recognition (CVPR), Salt Lake City, UT, USA, 18–23 June 2018; pp. 8759–8768. [Google Scholar]
  33. Singh, B.; Davis, L.S. An Analysis of Scale Invariance in Object Detection—SNIP. In Proceedings of the IEEE/CVF Conference on Computer Vision and Pattern Recognition (CVPR), Salt Lake City, UT, USA, 18–23 June 2018; pp. 3578–3587. [Google Scholar]
  34. Rathinam, A.; Gaudilliere, V.; Mohamed Ali, M.A.; Ortiz Del Castillo, M.; Pauly, L.; Aouada, D. SPARK 2022 Dataset: Spacecraft Detection and Trajectory Estimation, Zenodo, 2022. [CrossRef]
  35. Pauly, L.; Jamrozik, M.L.; del Castillo, M.O.; Borgue, O.; Singh, I.P.; Makhdoomi, M.R.; Christidi-Loumpasefski, O.O.; Gaudillière, V.; Martinez, C.; Rathinam, A.; et al. Lessons from a Space Lab: An Image Acquisition Perspective. Int. J. Aerosp. Eng. 2023, 2023, 9944614. [Google Scholar] [CrossRef]
  36. Gavaskar, R.G.; Chaudhury, K.N. Fast Adaptive Bilateral Filtering. IEEE Trans. Image Process. 2019, 28, 779–790. [Google Scholar] [CrossRef] [PubMed]
  37. Drew, J.H.; Glen, A.G.; Leemis, L.M. Computing the Cumulative Distribution Function of the Kolmogorov–Smirnov Statistic. Comput. Stat. Data Anal. 2000, 34, 1–15. [Google Scholar] [CrossRef]
  38. Tong, K.; Wu, Y.; Zhou, F. Recent advances in small object detection based on deep learning: A review. Image Vis. Comput. 2020, 97, 103910. [Google Scholar] [CrossRef]
  39. Zhang, H.; Wang, Y.; Dayoub, F.; Sünderhauf, N. VarifocalNet: An IoU-aware Dense Object Detector. In Proceedings of the IEEE/CVF Conference on Computer Vision and Pattern Recognition (CVPR), Nashville, TN, USA, 20–25 June 2021; pp. 8510–8519. [Google Scholar]
  40. Zheng, Z.; Wang, P.; Liu, W.; Li, J.; Ye, R.; Ren, D. Distance-IoU Loss: Faster and Better Learning for Bounding Box Regression. In Proceedings of the AAAI Conference on Artificial Intelligence, New York, NY, USA, 7–12 February 2020; Volume 34, pp. 12993–13000. [Google Scholar]
  41. Li, X.; Wang, W.; Wu, L.; Chen, S.; Hu, X.; Li, J.; Tang, J.; Yang, J. Generalized focal loss: Learning Qualified and Distributed Bounding Boxes for Dense Object Detection. In Proceedings of the 34th International Conference on Neural Information Processing Systems, Vancouver, BC, Canada, 6–12 December 2020; Volume 33, pp. 21002–21012. [Google Scholar]
  42. Sharma, S.; Park, T.H.; D’Amico, S. Spacecraft Pose Estimation Dataset (SPEED). Stanford Digital Repository. 2019. Available online: https://purl.stanford.edu/dz692fn7184 (accessed on 10 June 2025).
  43. Kisantal, M.; Sharma, S.; Park, T.H.; Izzo, D.; Märtens, M.; D’Amico, S. Satellite Pose Estimation Challenge: Dataset, Competition Design, and Results. IEEE Trans. Aerosp. Electron. Syst. 2020, 56, 4083–4098. [Google Scholar] [CrossRef]
Figure 1. Histogram of bounding box sizes in the SPARK-2022 training set.
Aerospace 12 00568 g001
Figure 2. Four spacecraft images in the SPARK-2022 dataset.
Aerospace 12 00568 g002
Figure 3. Loss-guided online data augmentation method.
Aerospace 12 00568 g003
Figure 5. Training and validation metrics.
Aerospace 12 00568 g005
Figure 6. Detection results of the improved YOLO11n on the SPARK-2022 dataset.
Aerospace 12 00568 g006
Figure 7. Confusion matrix of the improved YOLO11n.
Aerospace 12 00568 g007
Figure 8. The variation in small object sample re-use frequency across training.
Aerospace 12 00568 g008
Figure 9. Performance of the proposed method on models of different sizes. The horizontal axis labels n (nano), s (small), m (medium), l (large), and x (xlarge) represent models with different parameter scales.
Aerospace 12 00568 g009
Figure 10. Detection results of the improved YOLO11n on the SPEED.
Aerospace 12 00568 g010
Table 2. The mAP of each class.
ClassmAP50 (%)mAP50-95 (%)
smart_198.992.0
cheops99.595.8
lisa_pathfinder99.595.6
proba_3_ocs99.491.9
proba_3_csc99.393.5
soho99.393.1
earth_observation_sat_197.984.5
proba_299.597.0
xmm_newton97.284.8
double_star99.596.1
debris99.593.8
all99.092.6
Table 3. Ablation study results.
ModelmAP50 (%)mAP50-95 (%)
YOLO11n(Baseline)96.486.5
YOLO11n + Bilateral Filtering97.388.7
YOLO11n + CLAHE97.889.4
YOLO11n + Loss-Guided Data Augmentation98.691.5
YOLO11n + Conventional Data Augmentation97.088.9
YOLO11n + Architecture Improvements98.190.8
YOLO11n + Complete Improvements99.092.6
Table 4. Ablation study results of the small object.
ModelmAP50 (%)mAP50-95 (%)
YOLO11n(Baseline)90.178.6
YOLO11n + Loss-Guided Data Augmentation96.986.2
YOLO11n + Architecture Improvements94.583.8
YOLO11n + Complete Improvements98.388.5
Table 5. Performance metrics of models of different sizes.
ModelParameter Size (M)FLOPs (B)
YOLO11n2.66.5
YOLO11s9.421.5
YOLO11m20.168.0
YOLO11l25.386.9
YOLO11x56.9194.9
Table 6. Ablation study results on the SPEED.
ModelmAP50 (%)mAP50-95 (%)
YOLO11n(Baseline)97.790.5
YOLO11n + Bilateral Filtering98.090.9
YOLO11n + CLAHE98.792.4
YOLO11n + Loss-Guided Data Augmentation99.092.7
YOLO11n + Conventional Data Augmentation98.692.1
YOLO11n + Architecture Improvements98.491.8
YOLO11n + Complete Improvements99.593.5
Disclaimer/Publisher’s Note: The statements, opinions and data contained in all publications are solely those of the individual author(s) and contributor(s) and not of MDPI and/or the editor(s). MDPI and/or the editor(s) disclaim responsibility for any injury to people or property resulting from any ideas, methods, instructions or products referred to in the content.

