1. Introduction
Urban Air Mobility (UAM) integration within U-space is of great interest and is gaining increasing attention in the last decade. U-space comprises specific digital services and procedures which enable safe and efficient flight management for a large number of unmanned aircraft system (UASs) in Europe. Research topics comprise airspace separation, dynamic reconfiguration [
1,
2], U-space flight rules [
3], U-space design [
4,
5], vertiport design [
6,
7], vertiport operation on the ground [
8] and in the air [
9], social acceptance [
10], and demand studies [
11,
12]. In addition to the mentioned studies, several projects are founded by the EU within the research programme SESAR (Single European Sky ATM Research Programme) with the goal to identify requirements and investigate regulations for manned and unmanned aviation within U-space. Naming just one, within the SESAR project CORUS (Concept of Operations for European U-space Services) such concept of operations (ConOps) and necessary interfaces between associated stakeholders were developed [
13].
In the follow-up project CORUS-XUAM (Concept of Operations for European U-space Services—Extension for Urban Air Mobility, [
14]) the focus was on UAM. The project dealt—among other specific use-cases—with an airport shuttle service using airtaxis connecting the Frankfurt Airport with the Trade Fair in the city-center [
4,
15]. This study is based on a previous conference publication [
16] and revisits the airport airtaxi shuttle use-case utilizing more reliable data regarding the air traffic in the area of Frankfurt including the trajectories and the aircraft type. The air traffic data were bought from Flightradar24 [
17] and cover the complete air traffic over Germany in the year 2022. This study involves a simulation framework taking into account vertiport operations, predefined corridors within U-space, vehicle dynamics, and real air traffic data leading to airspace limitations, i.e., temporary blocking of the corridors, and a demand analysis for the vertiports at the airport and the Trade Fair. Addressing several research topics, e.g., vertiport operation as well as positioning and sizing, corridor design, conflict management, and UAM demand, while using more reliable traffic data, we achieve more realistic and more meaningful results compared to our previous studies [
4,
16].
The structure of this article is defined as follows: First, our previous work and part of the CORUS-XUAM project is recapitulated in
Section 2. In addition to the old simulation infrastructure, we introduce a vertiport simulator and a demand analysis for the specific airtaxi shuttle service in
Section 3. A combined simulation setup is outlined in
Section 4 and simulation results for different assumptions regarding the demand or market share and processing time at the vertiports are evaluated in
Section 5. We complete the article with
Section 6, where we draw conclusions and share further research ideas.
2. Previous Work: CORUS-XUAM and Further Studies
Our previous research within the CORUS-XUAM project dealt with a theoretical integration of an airport shuttle service between the Frankfurt Airport on the outskirts, and the Trade Fair in the city center using airtaxis [
4,
15]. Corridors within U-space connecting the two locations without any repercussions on the operation of the airport or any other flights, e.g., arriving and departing airplanes or medical and police helicopters throughout the city, have been designed. Furthermore, suitable vertiport locations were chosen, and the throughput potential of the corridors was tested in a fast-time simulation study considering the dynamics, e.g., translational and angular acceleration, turn rates, maximal bank angle etc., of the airtaxi and recorded air traffic data.
2.1. Vertiport Placement
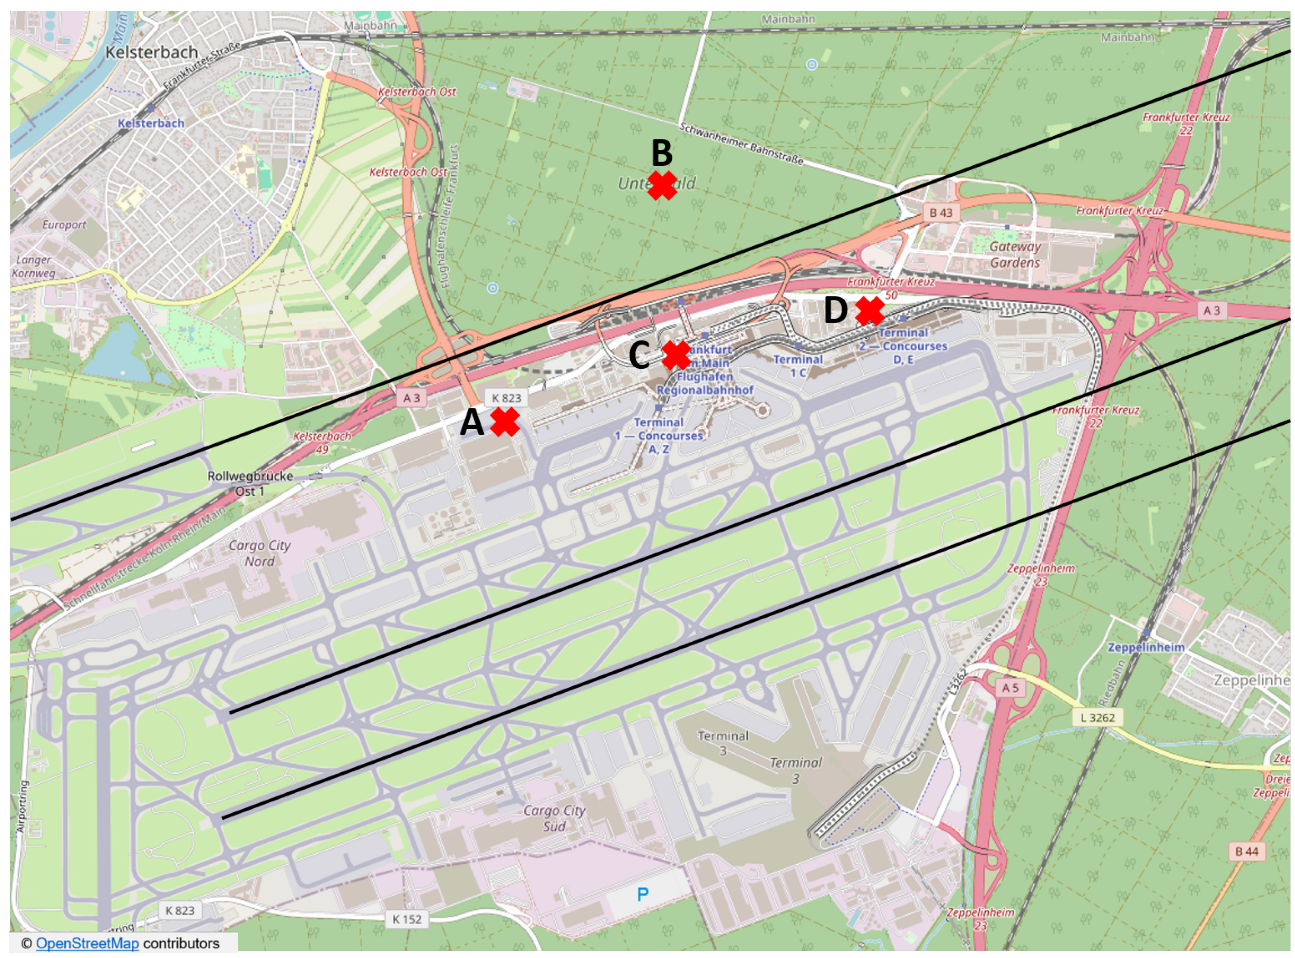
We identified four possible locations for the vertiport at the airport, see
Figure 1. Out of these position
D was chosen over the others, based on five criteria: passenger transit time, capital expenses, impact on airport landside and airside operations, and time to realize.
Position A is located within the airside, which is difficult to realize due to a mandatory security check, and the shuttle service would not be completely separated from the airport operations.
Position B is located outside of the airport area and simply too far away leading to an extra transit time to the terminals that has to be taken into account, which nullifies the time advantage of airtaxis compared to public transportation on the ground.
Position C is the roof of the Terminal 1 building, which is still landside and poses a direct connection to the check-in.
Finally, location D in front of Terminal 2 was selected because of its low capital expenses, short time to realize, the easy transit between vertiport and terminal, and the lack of negative effects on airside security.
The other vertiport at the Trade Fair is located on top of the roof of Hall 4 to ensure a general reachability. Nevertheless, one issue remains. Position
D is located between the runways RWY 25R and RWY 25C. Thus, the airtaxis somehow need to pass the approach cone of the northern RWY 25R without disturbing the airport operations, see
Figure 2. Thus, suitable corridors had to be designed.
2.2. Corridor Design
We note first that for our simulations, and the design phase, the east-to-west operation mode at the airport is assumed. Since the climbing phase upon departure is usually steeper than the descending phase during landing, arriving airplanes stay longer in the lower airspace, which is relevant for the design of the corridors for the airtaxis. Additionally, the runway configuration is used more often since Frankfurt is located in the zone of westerlies. According to FRAPORT this configuration is used 70% of the time at the Frankfurt Airport [
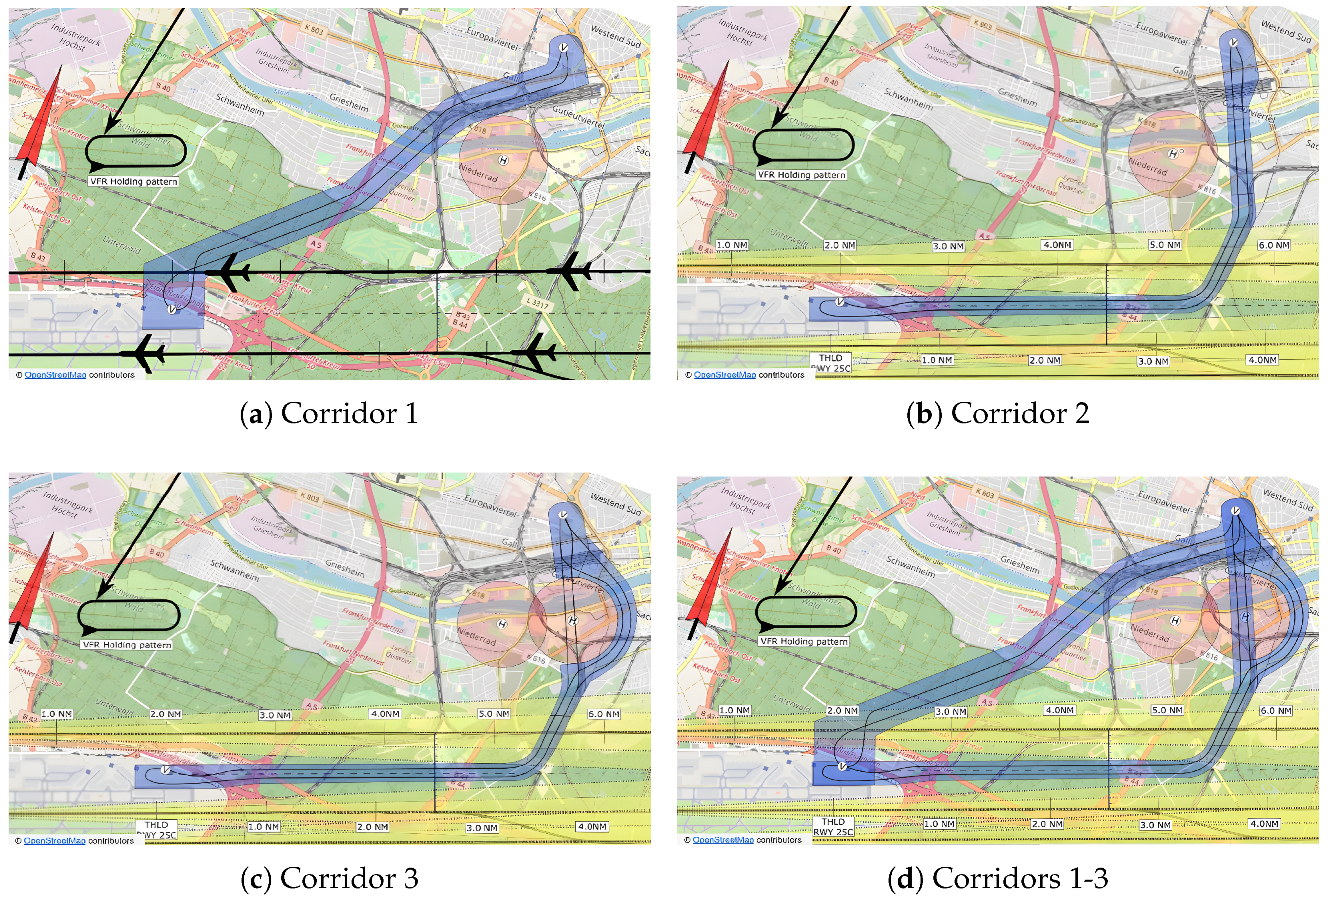
18]. As shown in
Figure 2, not only the approach cones have to be avoided but also a visual flight rules (VFR) holding pattern in the north of the airport and two no-fly zones (NFZs) around the helipads at the university hospital. To avoid the fixed-wing aircraft arriving at the airport we considered two options: The first one is to cross the approach cone of the northern runway in case the separation, i.e., 90
, allows, see
Figure 3a. The separation values will be discussed later on in
Section 4. The second option is to fly from the airport to the east in between of the two runways until the vertical separation of approximately 1100 ft permits passing underneath the approach cone, see
Figure 3b. Note that if the operation mode would be west-to-east the second corridor would not need to extend so far to the east and could cross underneath the departing airplanes a bit further to the west. Around the western helipad at the university hospital we assume a permanent NFZ with a radius of 1 km. This helipad is almost exclusively used for helicopter emergency medical services (HEMS) operations, and our airport shuttle service is not allowed to interfere with any medical helicopter. The eastern helipad is used on average two times per day. Consequently, an NFZ with the same size only has to be established on demand. Taking all constraints into account, we proposed three possible corridors, see
Figure 3. All three corridors contain a separated route for each direction. The separation of the two routes was set to
NM, assuming the deviation of the airtaxis from their paths is sufficiently small.
2.3. Recorded Air Traffic Data
In the Concept of Operations for European U-space Services—Extension for Urban Air Mobility (CORUS-XUAM) project [
15], and the follow-up publication [
4], we tested the throughput potential of the designed corridors incorporating recorded radar data provided by the Deutsche Flugsicherung (DFS) covering one full day in August 2022 in the region of Frankfurt. Contained were flights departing from or arriving at the Frankfurt Airport, flights crossing the region, as well as medical and police helicopters. Overall the radar data include 1944 objects of which 1210 carry flight IDs. The same data were used in our last study [
16] in which we added a vertiport simulation and a demand analysis for the shuttle service.
2.4. Simulation Setup
In [
4], we investigated the throughput potential of the three corridors. For different schedules—every 5 min, 4 min, 2 min, 90
—we tested if an airtaxi can start at each of the two vertiports. If using the first corridor would lead to a conflict with the recorded traffic or another airtaxi that is already flying, the second corridor is tested. Consequently, if a medical helicopter is occupying the region around the eastern helipad at the university hospital, the third corridor is tested. If all three corridors, i.e., generated trajectories, lead to a conflict, the departure is delayed, and the procedure is repeated. In case the airtaxi cannot start before the next one requests a flight the current request is canceled. The trajectory generation was done utilizing the Copter Flight Management System (CFMS) toolbox [
19] with the performance model in
Table 1. The performance model uses a total power approach with coefficients for aerodynamic, propulsion, and electric systems of the airtaxi.
For the conflict detection we used the NDMap, which is a performance-optimized conflict detection tool for objects and flight paths in arbitrary dimensions [
20,
21]. In our last study, we added a vertiport simulation to the described setup and in contrast to testing the throughput potential used a rather realistic demand leading to the flight requests.
2.5. Limitations
Our first setup described in
Section 2.4 has the following limitations. At first only the airspace was considered as a limiting factor. Later, in [
16] a vertiport operation including time to recharge or change the battery, transit time inside the vertiport, and time for boarding and deboarding was added. A number of available vehicles or parking lots at each vertiport was not considered in any of our simulations. Within the CORUS-XUAM project we did not consider a demand for the airport shuttle service. However, this was included in [
16]. The demand analysis also fixed the issue of considering airtaxi flights in the night while the airport is actually closed. Since during that time no airplanes arrive at the northern runway the first corridor was always free, which led to an overestimation of the number of possible flights. Nevertheless, our old demand analysis is based on the radar data provided by the DFS. This data does not contain the full information that was needed to calculate the demand, e.g., the aircraft type was missing. As outlined in [
16], the call sign was provided, which led to a likely aircraft type and thus to the seating arrangement and finally the demand. However, over time, between seasons, or even regularly the aircraft type may change and inferring the type using the call sign is unreliable. Using a new set of data from Flightradar24, which includes the aircraft type for specific days as well, we are now able to fix the issue of incomplete and partly unclean data.
3. Vertiport Simulator
The vertiport simulator maintains a pool of vertipads that record time-based reservations. Takeoff and landing requests arrive on dedicated message queues. The corridor management system repeatedly queries the simulator for an available vertipad and then reserves one. The is_available operation scans existing reservations to detect interval conflicts across all vertipads. If no conflict appears, the reserve operation allocates the vertipad and appends the new booking.
3.1. Setup of the Vertiports
At startup, each vertiport receives an ID, the number of vertipads, and a turnaround_time. The turnaround_time applies equally to landings and takeoffs and sets the minimum interval between flights on the same vertipad.
We launched two simulator instances—one for the Trade Fair vertiport and one for the airport vertiport. We set the turnaround_time to 5 min at the Trade Fair and 10 min at the airport, matching estimates from the literature [
22,
23]. Limited battery capacity and safety rules [
24] require each eVTOL (electric vertical take-off and landing) to recharge or swap batteries between flights, enforcing the turnaround interval. Even without these constraints, operators would minimize pad occupancy to maximize throughput.
Section 5 demonstrates that about 10 vertipads suffice to meet peak demand under perfect timing.
3.2. Demand Analysis
To obtain a rather realistic demand schedule for the airport shuttle, we utilized the recorded data from Flightradar24 mentioned in
Section 2.3. We use the recordings of the 1 and 2 August in 2022 since the data show that the airport was in west-to-east and east-to-west operation mode, respectively. In the following all numbers are taken from the 2 August since the east-to-west operation mode is the more difficult scenario for our use-case. The radar data include a flight and aircraft id, the call sign, aircraft type, a radar track id, latitudinal, and longitudinal coordinates, altitude, speed, current time, and the scheduled departure and destination airport as well as the real destination. Assembling all measured coordinates with the same track number we generated 13,554 trajectories covering all flights within Germany during the chosen day. In contrast to our previous study, not only the call sign but also the aircraft type is known exactly. Out of the 13,554 trajectories, only the ones starting or ending at the Frankfurt Airport are relevant for the demand for both directions of the airtaxi shuttle service. There are 574 departures and 585 arrivals which matches with 589 departures and 590 arrivals listed by FRAPORT itself for a day in February 2025 [
25]. Taking into account that our data are from August 2022 which was towards the end of the pandemic it fits quite well with the values from 2025. The small discrepancy between arrivals and departures seems odd on a first view but this mismatch disappears when looking at the same data for the previous and following day. The numbers of arrivals and departures are flipped for those days. Most of the domestic flights are carried out using an Airbus A320 or Airbus A321. The data also show some helicopters throughout the city, international flights, and most importantly private jets. Having the aircraft types, the number of seats in each travel class can be assigned to the flights. Different seating arrangements for different airlines are not considered. Even within one airline, it may happen that different distributions are used. However, those differences would not lead to larger changes in the calculated demand. In total, 54 different airplanes and, thus, seating setups are relevant for our data. Each arriving airplane leads to a demand at the airport vertiport with a delay of 30 min. Departing airplanes create a demand at the vertiport in the city center roughly 90 min before departure (80 min to travel through the airport plus
min flight time). We assume three different demand distributions (low, medium, high) and dedicated demand ratios based on the travel class (first, business, premium economy, and economy) as assembled in
Table 2.
For each demand classification, three different ratios are given. The coefficients of each row are multiplied with the number of seats of each class and the values are added. Afterward, the maximum (rounded up) over the three resulting values is used as the number of passengers that would like to use the airtaxis. Note that we are using three distributions to account for airplanes that do not have all travel classes, e.g., if an airplane has first class seats the first row is always dominating the others. If there is no first class, then we assume that passengers of the most expensive class, say premium economy class, would book the more expensive last-mile transport option. Most domestic flights only have seats for the economy class, thus, the last row leads to the maximum in this case. If the other more expensive travel classes exist, then the last row is always dominated by the others for all 54 configurations that are relevant for our simulation. Private jets are treated the same way. Here all seats are assumed to be in the first class but since most of them are likely to be unused, the same multipliers as for the big passenger airplanes are used. Since the flight trajectories also contain the time, we obtain a demand distribution over one complete day.
Table 3 shows the number of passengers that would like to book an airtaxi for the three demand models (low, medium, high). Since so far no real airtaxi flights are in place, any analyses towards the demand ratio would include assumptions. Therefore, we chose a spectrum to cover several cases. The total number of seats taking all related airplanes from our data set into account is 213,266.
However, the total number of passengers per day that FRAPORT is claiming is only 162,600. Thus, our overall demand is probably overestimated. One reason could be that not all seats are used. Nevertheless, our demand ratio is chosen very small compared to other authors [
11]. We also used the simulation tools presented in [
26,
27] to estimate the maximum market share for our use-case which is the route between airport and city center. Passengers with a different destination were not taken into account. The value of 8.3% is an upper bound for the market share, which could only be reached if airtaxis are well received by the public. A realistic passenger perception should lead to a much lower estimate. The estimation tool also does not run different transportation modes directly against each other. For the calculation a ticket price of 55 EUR per passenger was assumed. In [
11] a UAM market share of 3.6% is assumed for the Los Angeles International Airport. In the following sections, the medium demand case is our baseline and simulation results refer to this case if not stated otherwise.
3.3. Vertiport Capacity
Our representative simulation runs, especially 10pad4pax5min for 10 vertipads, four passengers per vehicle and five minutes turnaround time, indicate that oversizing vertiport capacities, beyond the minimal number of vertipads needed to attend all scheduled flights with perfect timing, considerably improves flight completion rate. For a simple revenue function (assuming the revenue per leg much higher than the vertipad costs per scheduled flight), one would then find that the airport–city shuttle attains its highest return at a pad utilization of roughly two theoretical slots per scheduled leg. Queuing analysis of the peak hour for a multimodal normal distribution then further limits pad utilization if average waiting times are to remain modest, implying that a practical design should offer more pads than these central sites could likely afford, running into a real-estate bottleneck. (Even if our projected passenger volume exceeds FRAPORT’s figures and assumes a comparatively optimistic market share cf. LAX [
11]). Mitigation options include faster turn-arounds (e.g., nose-in/tail-out operations), one-way boarding surges during peaks, time-of-day or congestion pricing to flatten demand, satellite pads linked by autonomous shuttles and ≥4-seat eVTOLs. An upcoming publication will study suitable vertiport sizing in more detail.
4. Combined Simulation Setup
Our framework integrates a traffic simulation-modeling airtaxis, regular flights, and helicopters at Frankfurt Airport as well as two simplified vertiport simulations. Every flight departs a vertiport, follows a predefined corridor in the traffic simulation, and then lands at the opposite vertiport.
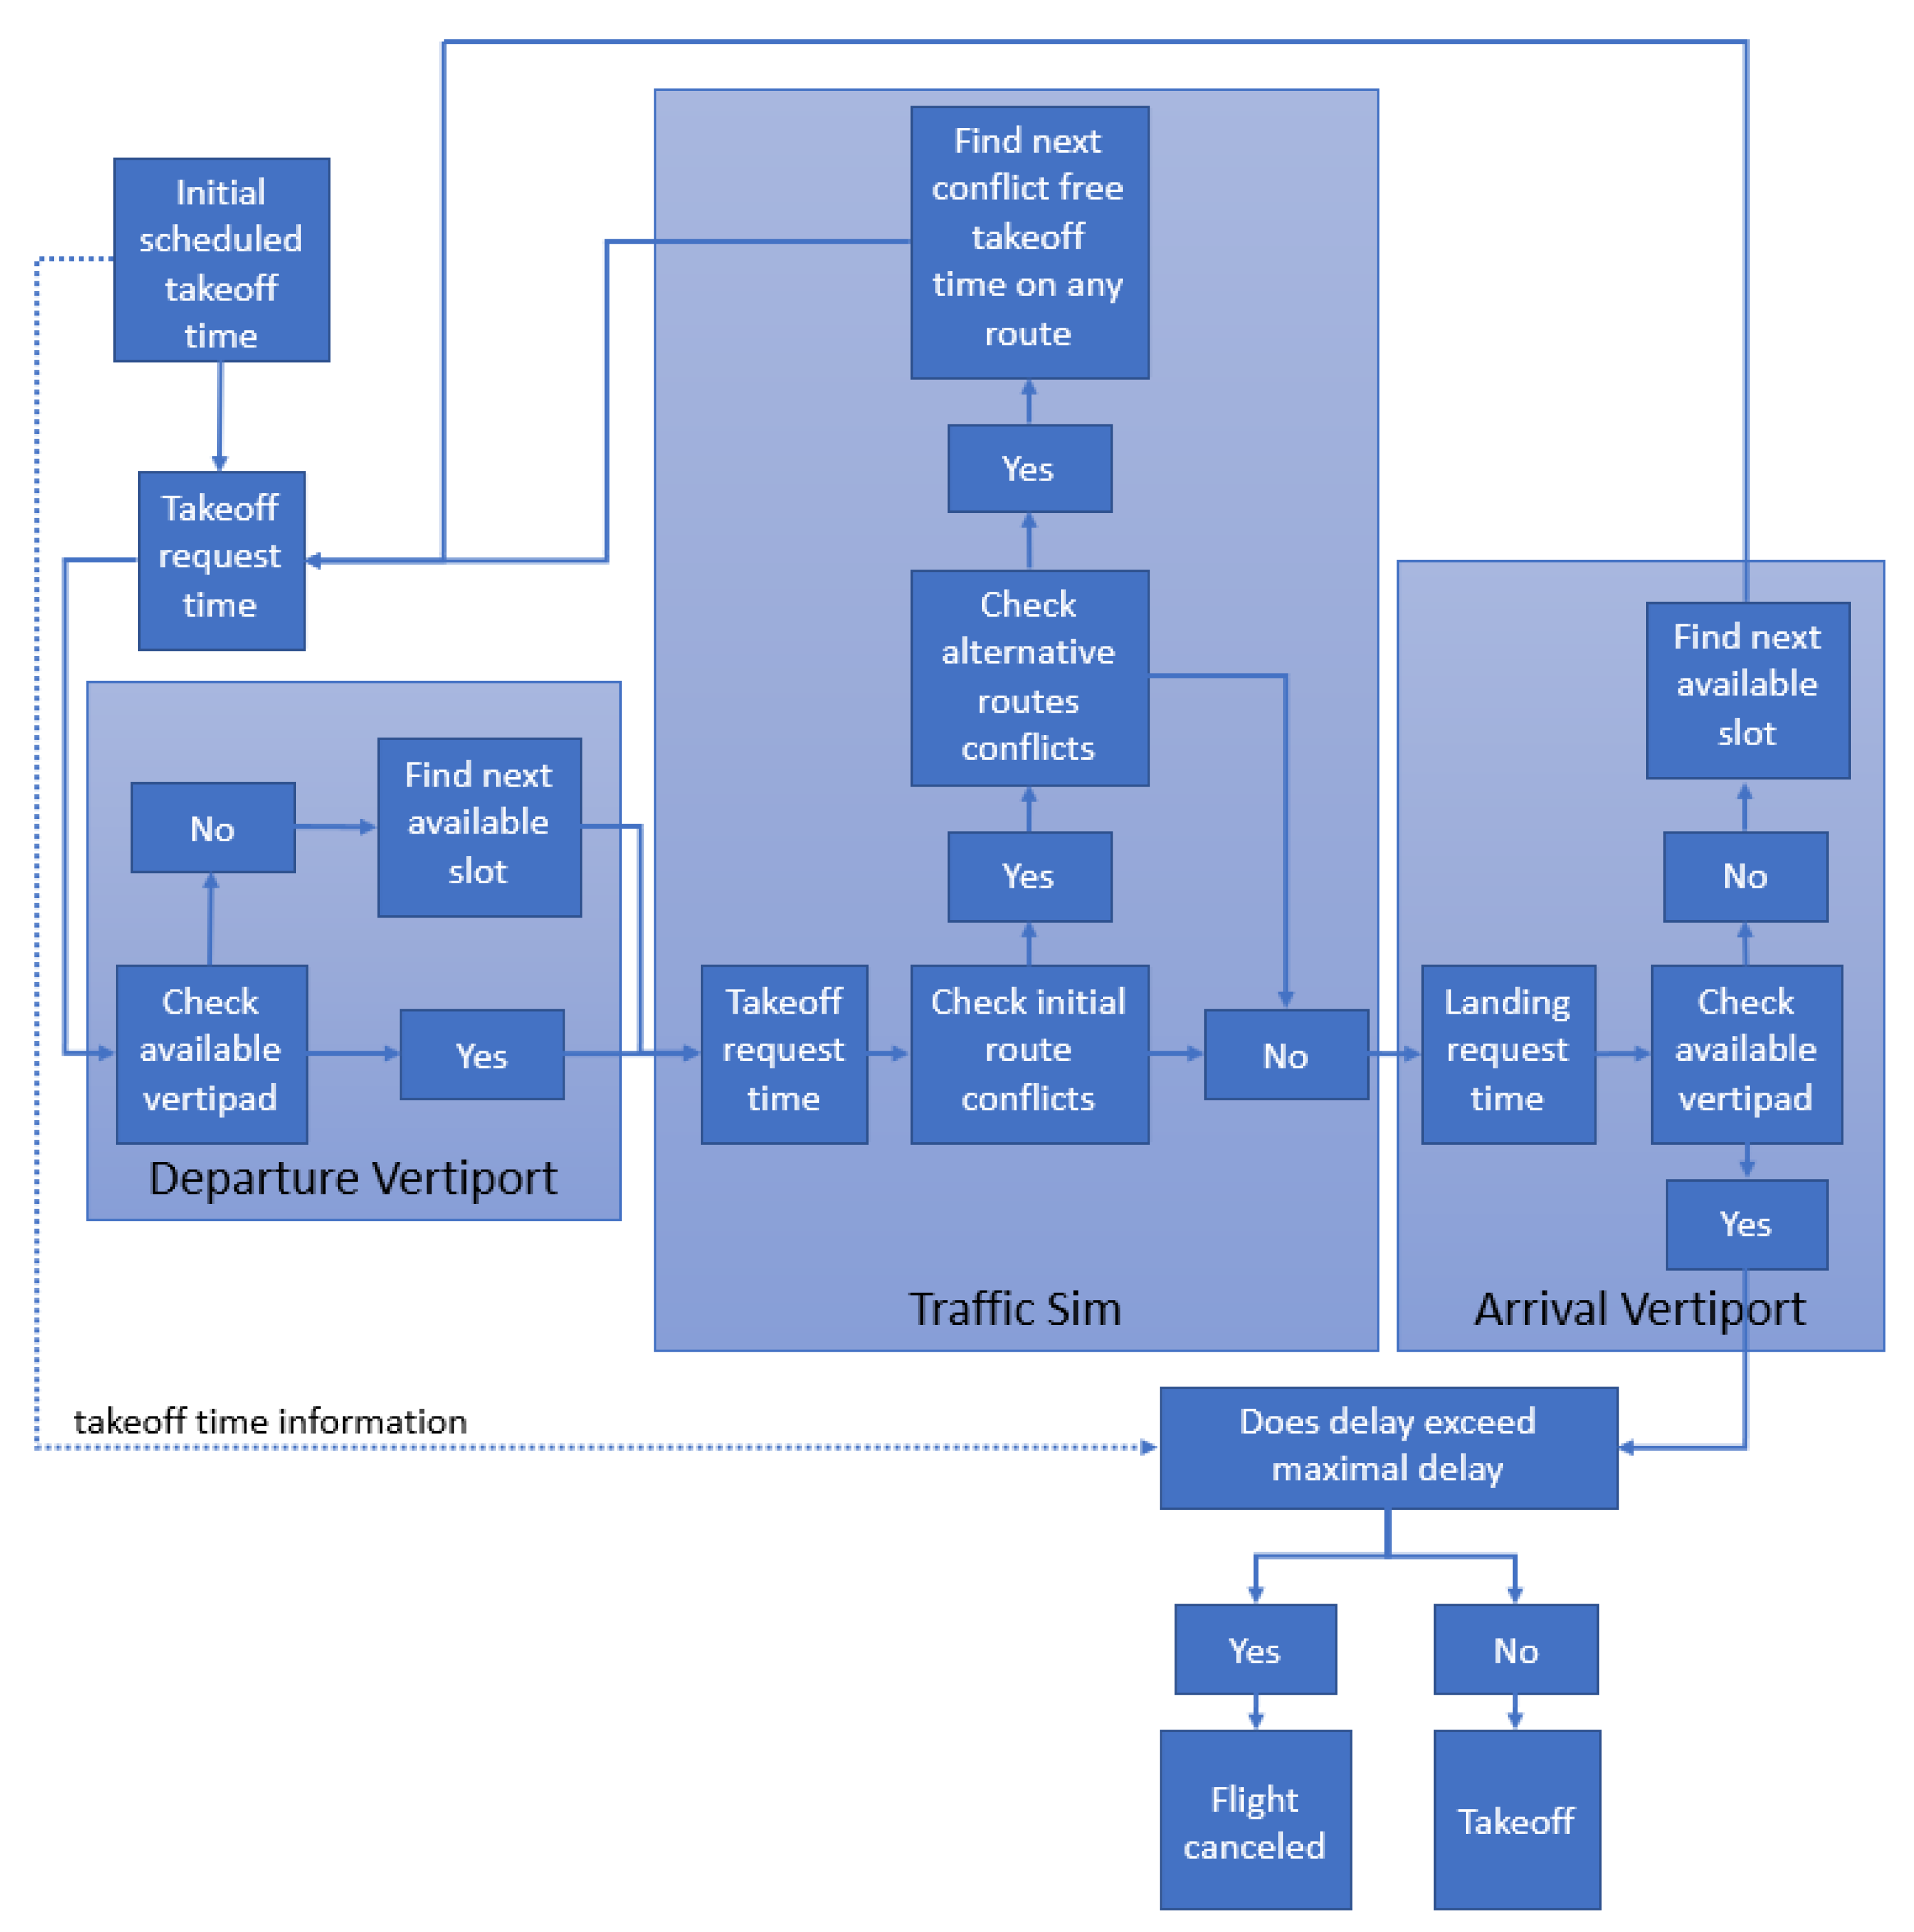
Figure 4 illustrates the airtaxi flight request sequence.
The airtaxi sends a takeoff request to its departure-vertiport simulation. If the requested timeslot on a vertipad is free, the system grants it; otherwise, it allocates the next open slot. The simulation sends the (possibly adjusted) takeoff time to the traffic module. The module then generates a 4D trajectory using the Urban Air Mobility (UAM) performance model and defines the main-corridor route. If conflicts arise with existing airtaxi or fixed-wing paths, the system evaluates alternative corridors. We detect conflicts via NDMap [
20,
21], applying the separation minima in
Table 4.
Should all corridors conflict, the system increments the takeoff slot and repeats route generation until it finds a conflict-free path. Changing the slot triggers a new departure-vertiport request. After securing a conflict-free corridor, the system requests a landing slot at the destination vertiport. If the current landing slot is occupied, it assigns the next open slot. The module then back-calculates a compatible takeoff time and reinitiates the departure request. When the landing slot is confirmed, the system compares the revised takeoff time against the maximum allowable delay. We set the maximum delay to 15 min in our experiments. Exceeding this threshold triggers a cancellation, since excessive waits negate the airtaxi’s advantage and force passengers to choose alternate transport. If the delay falls within limits, the system reserves both vertiports and registers the trajectory for future conflict checks.
To accelerate processing, the simulation caches previously refused slots and immediately rejects matching requests. Our framework handles requests in any sequence. Although we process requests in chronological order here, the scheduler also supports priority inserts (e.g., emergency flights) at any position. We generate takeoff schedules for each vertiport from the demand profiles in
Section 3.2. Airport-vertiport demand derives from arriving flights. Passengers disembark, traverse the terminal, and board their airtaxi. We model this delay explicitly by adding passenger transfer time to the scheduled takeoff. Conversely, city-vertiport demand stems from departing aircraft. Passengers must board their aircraft on time. We schedule city-vertiport departures so airtaxis deliver passengers with sufficient time for terminal processing before their flights. If passenger counts exceed one airtaxi’s capacity, we dispatch multiple vehicles. Thus, we allow on-demand scheduling of additional airtaxis. The airtaxi schedules are computed as follows:
Limitations: We do not model the finite inventory or storage requirements of vertiport vehicles. The model also omits weather effects—wind, rain, and visibility changes. These factors could divert trajectories, induce in-flight delays, or ground operations entirely. Finally, we lack empirical data for vertipad occupancy and passenger uptake rates, so we base these parameters on expert estimates from DLR colleagues on vertiport research.
5. Simulation Results
Before presenting the results of this study, we briefly summarize key findings from previous simulations to provide context for comparison.
5.1. Previous Studies and Baseline Performance
The earliest simulations [
4] used a generic demand model without vertiport simulation, relying on 24 h of radar data from the DFS. The corridor supported up to 1900 airtaxi flights per day before reaching capacity. Throughput was limited by background traffic, including helicopters and small aircraft, which intermittently blocked the corridor.
In [
16], we then introduced vertiports with varying pad counts and blockage times. With ten pads and a five-minute turnaround, the system processed 1126 flights against a 2812-flight demand. Seventy-seven percent of delays-and subsequent cancellations for delays over 15 min-stemmed from corridor conflicts with background traffic. Upscaling to four-seat airtaxis yielded 1058 flights served of 1391 demanded. Vertiports, in theory, could handle up to 2400 operations in 20
(one departure every five minutes on ten pads). In configurations with three pads and ten-minute blockage, 56% of delays shifted to vertiports, while corridors still caused 44% of delays.
5.2. New Simulation Scenario
Our new scenario addresses earlier bottlenecks by ensuring at least one corridor remains always open for airtaxi traffic. Approach tracks are fixed on the glide slope, and irregular corridor traffic is filtered out. This guarantees an available corridor unless blocked by another airtaxi. The new scenario sports heavier traffic than previously, from just before 04:00 until slightly after midnight—just over 20 of operations—with demand ranging from 1452 to 4702 flights. While the assumption that always at least one corridor is free is likely overly optimistic, it can be assumed that the corridors are protected from traffic (other then HEMS and police flights). Additionally, the corridors can be designed such that there is no intersection with the routes that medical and police helicopters usually take. This motivates this simulation run with no interruption; in future research different interruptions could be added, with some considerations on how the corridors should be protected from passing traffic, for example, no-fly zones. All vertiports in every scenario use ten pads; smaller configurations were excluded. Each demand level was paired with two possible passenger capacities (two or four seats) and two pad occupancy times (five or ten minutes), yielding four runs per demand. Simulations covered east-wind and west-wind days and three demand matrices (low, medium, high), for a total of 24 runs.
5.3. Summary of Results
Table 5 lists, for each scenario, the number of flights served, scheduled demand, and the vertiports’ theoretical maximum throughput in 20
. Every demand scenario uses airtaxis carrying either 2 or 4 passengers and 5 min or 10 min of turnaround time, resulting in 4 simulation runs for each demand scenario. The scenarios use traffic at 2 different days with east and west wind, respectively. Each of these days uses demand based on a high, medium, and low demand matrix. In total, this led to 24 simulation runs.
With one corridor always available, vertiports became the primary bottleneck when demand exceeded pad capacity. On the busiest day (east, high, 5 min, 2 pax), 2182 flights were served out of 4702 requested; the five-minute pad time limited throughput, reaching 91% of the vertiports’ 2400-flight capacity. A ten-minute pad time cut throughput to 1216 flights, maxing out the 1200-flight capacity over 20 h. The number of flights surpass the maximal number as some flights start before 4 a.m. and others are scheduled even after 12 p.m. (since some aircraft land late and people need to get to the vertiport before the airtaxi can takeoff). Thus, the operational time slightly exceeds the 20 h used to calculate the maximum. Unlike in preceding simulations, some simulation with lower demand (medium and low demand scenarios with 4 passengers per airtaxi) and high capacity vertiports (5 min of blockage at vertipads) could cover the full demand in these scenarios. The west-wind scenario with medium demand 4 passengers per airtaxi and 5 min blockage at vertipads could serve all 1791 flights that were demanded within the allowed 15 min of delay for each flight.
Table 6 breaks down delay causes between the departure vertiports, corridors, and arrivals.
Since the background traffic in these scenarios allows for at least one open corridor at all times, the corridor causes fewer delays than in preceding simulations. Especially in simulation runs where the demand exceeds the capacity of the vertiports, the takeoff vertiport causes over 90% off all delays (and cancellations). As airtaxi flights are added time sorted in the simulation, the landing vertiport is nearly always free for landing operations. In the busies scenario mentioned above, 2182 of 4702 flights could be served. The Vertiports theoretical maximum of 2400 operations is not reached in this simulation, where roughly 90% of all delays are caused by the departure vertiport. The other 10% are caused by the corridor, whose load is already above the estimated maximum of 1900 flights from earlier simulations. Thus, this scenario puts both vertiports and corridor at their limit. Other simulations, especially with 10 min blockage of the vertipads, put the limiting factor nearly completely on the vertiport side. For example, the east wind scenario for low demand, 2 passengers per airtaxi and 10 min of blockage, serves 1119 of 2431 flights with 98.24% of all delays caused on the departure vertiport.
5.4. Outliers and Vehicle Imbalances
Four scenarios exhibited significant delays at the arrival-vertiport of up to 21%, when one vertiport’s departures overwhelmed the other’s arrivals under tight scheduling windows, namely the east wind medium demand scenario with 5 min vertipad blockage and 2 pax with 10% delay caused at the arrival vertiport, the east wind medium demand scenario with 10 min vertipad blockage and 2 pax with 17% delay, the west wind high demand scenario with 5 min vertipad blockage and 2 pax with 18% delay, and the west wind medium demand scenario with 5 min and 2 pax with a 21% delay. Heavy departure loads can block inbound flights at arrival vertiports, because flights enter the simulation by scheduled departure time (with a maximum of 15 min delay before cancellation). This “vertiport clash” sometimes cascades into cancellations. Flights are added by their scheduled takeoff time but could be delayed up to 15 min to take the first available takeoff slot. If no slot is available within these 15 min the flight will be canceled. Thus, airtaxis from the other side could be added afterwards to the system even when their scheduled departure time is earlier. Since the corridor flight time is only 8 min, the arrival vertiport is still blocked from delayed outgoing traffic that has already been added to the system. To give an example on how this situation works. At 6:00 many vehicles are scheduled at vertiport A. Thus, vehicles take off continuously from vertiport A until the maximum delay of 15 min is reached. The last vehicle of the 6:00 slot takes off at 6:15. Any additional demand from this slot will be canceled. A vehicle scheduled at 6:01 from the vertiport B suffers no delay for takeoff, but could not land at 6:09 because at this point (until 6:16) flights are still taking off from vertiport A. Thus, takeoff at 6:08 from vertiport B would allow landing at vertiport A, but the flights from 6:00 are already arriving at vertiport B and do not allow any takeoffs. If further flights are scheduled from the vertiport A, these flights could now completely block vertiport B. A more complex scheduler could detect these situations and give priority to the blocked side to solve the issue.
Figure 5,
Figure 6,
Figure 7,
Figure 8,
Figure 9 and
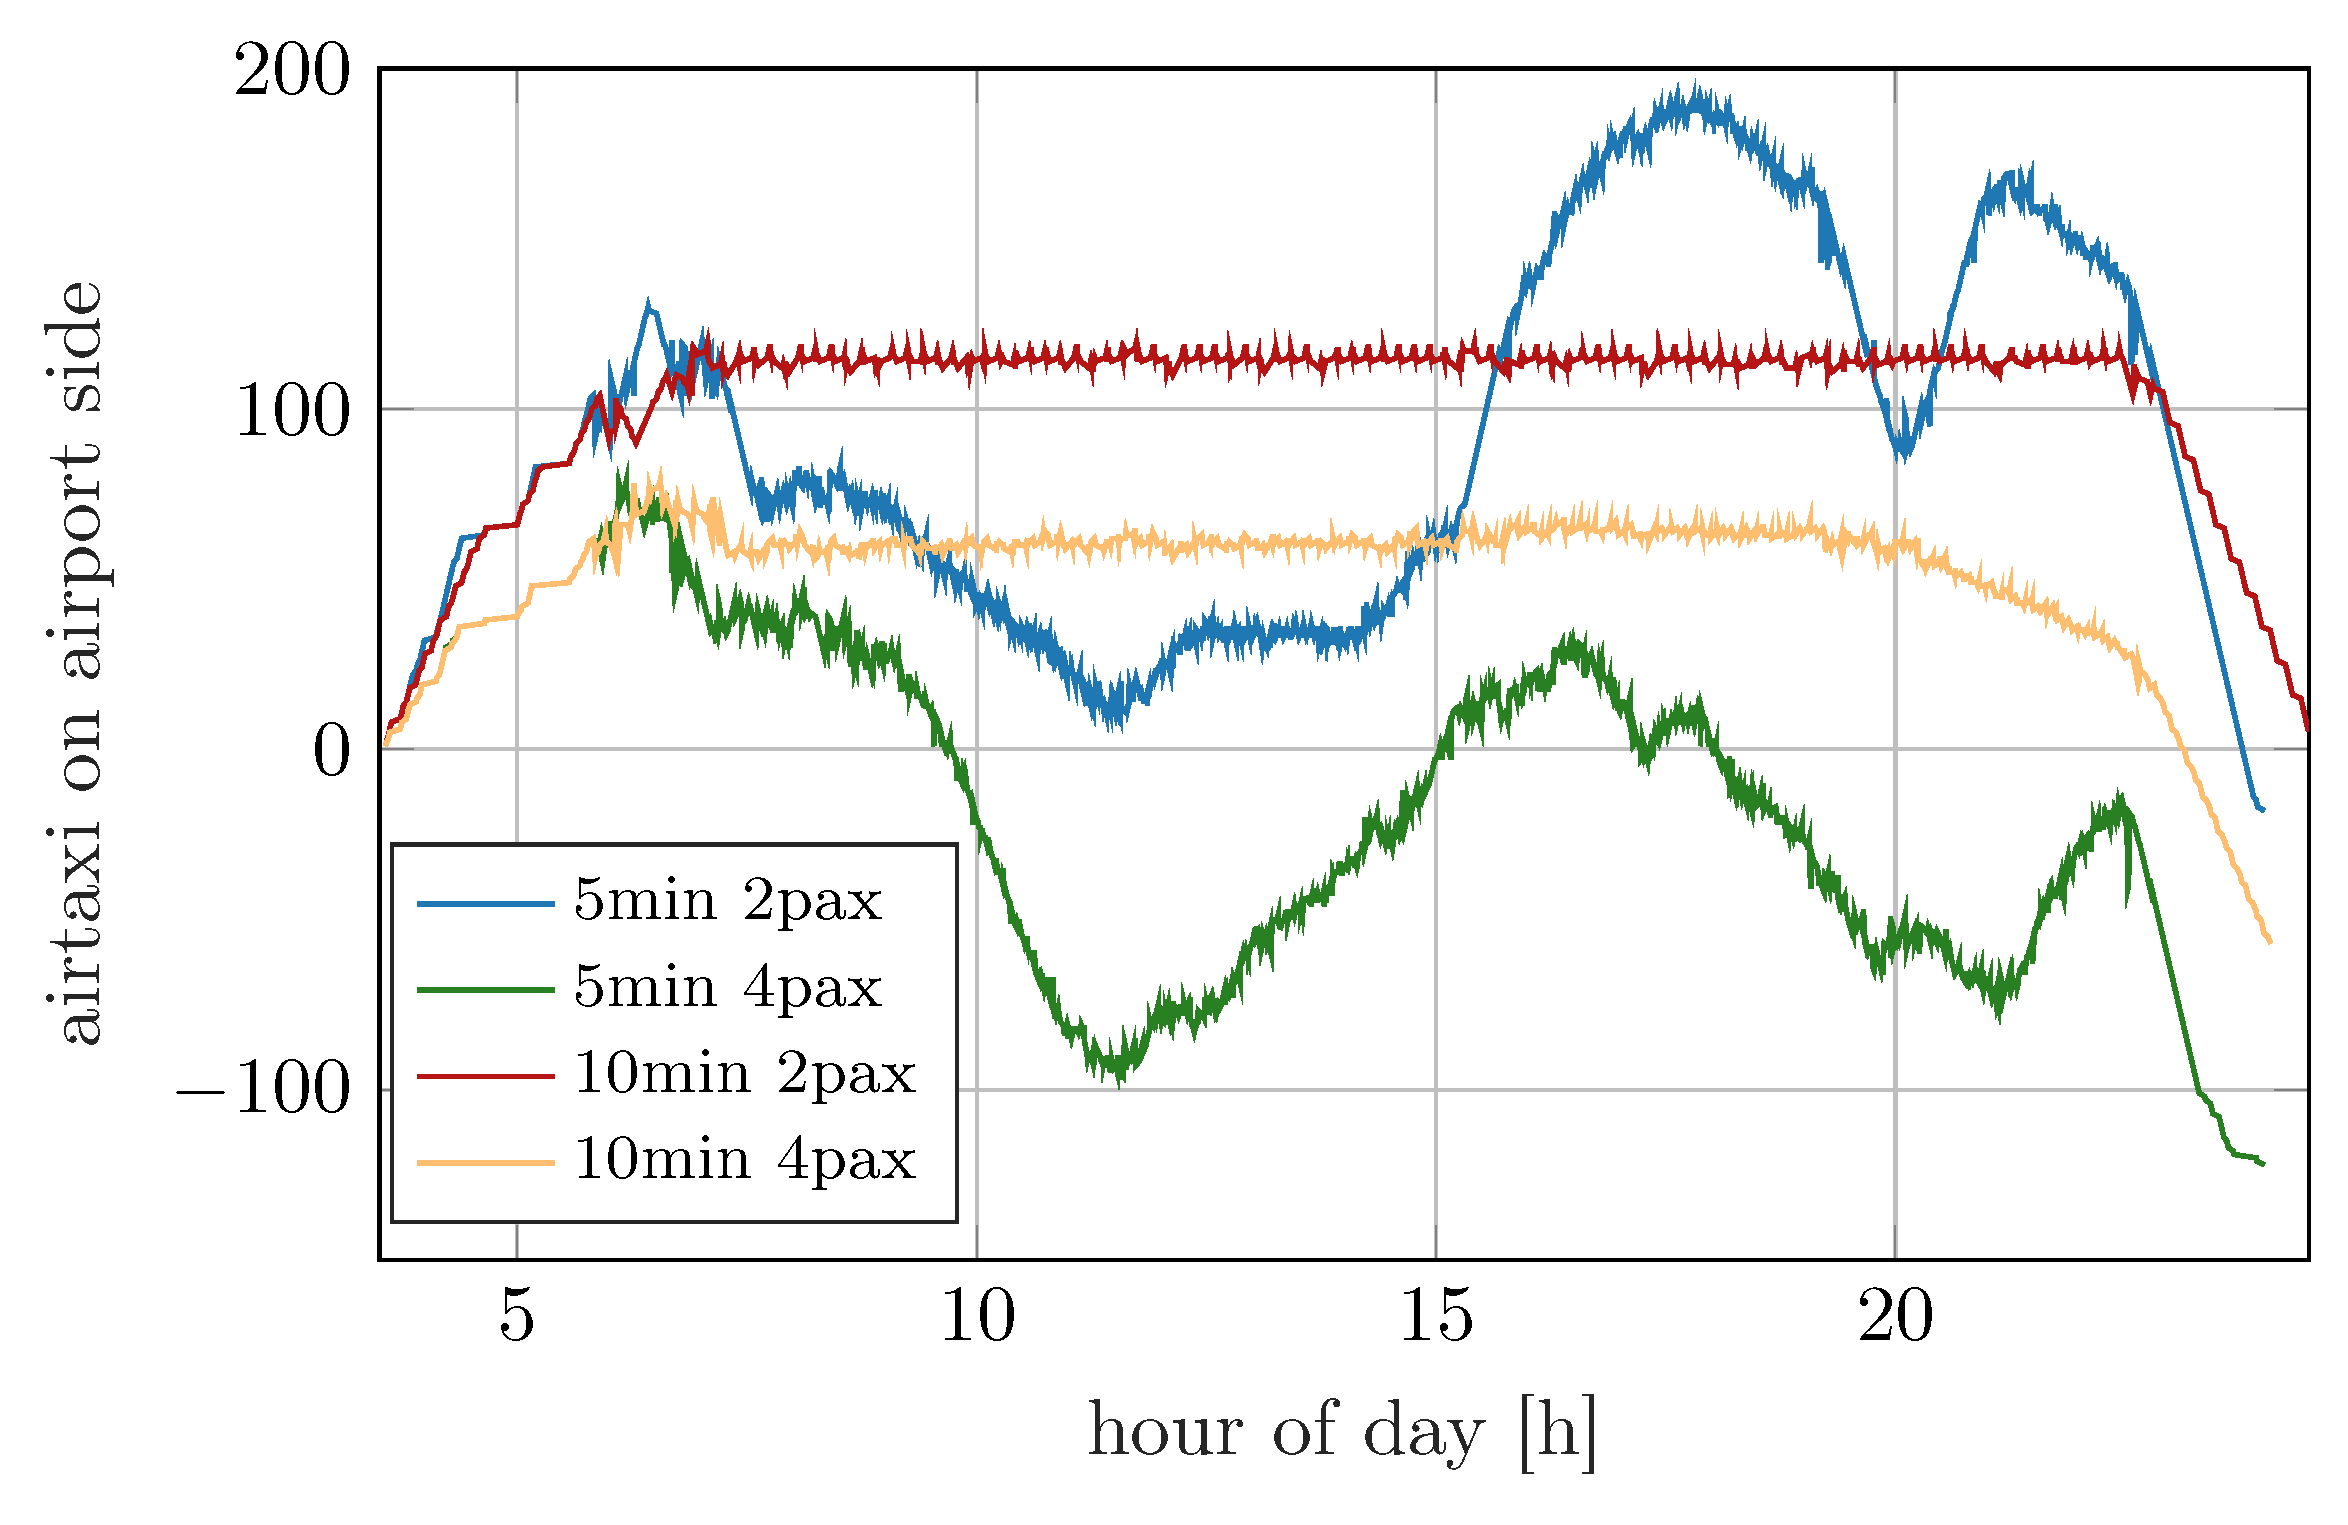
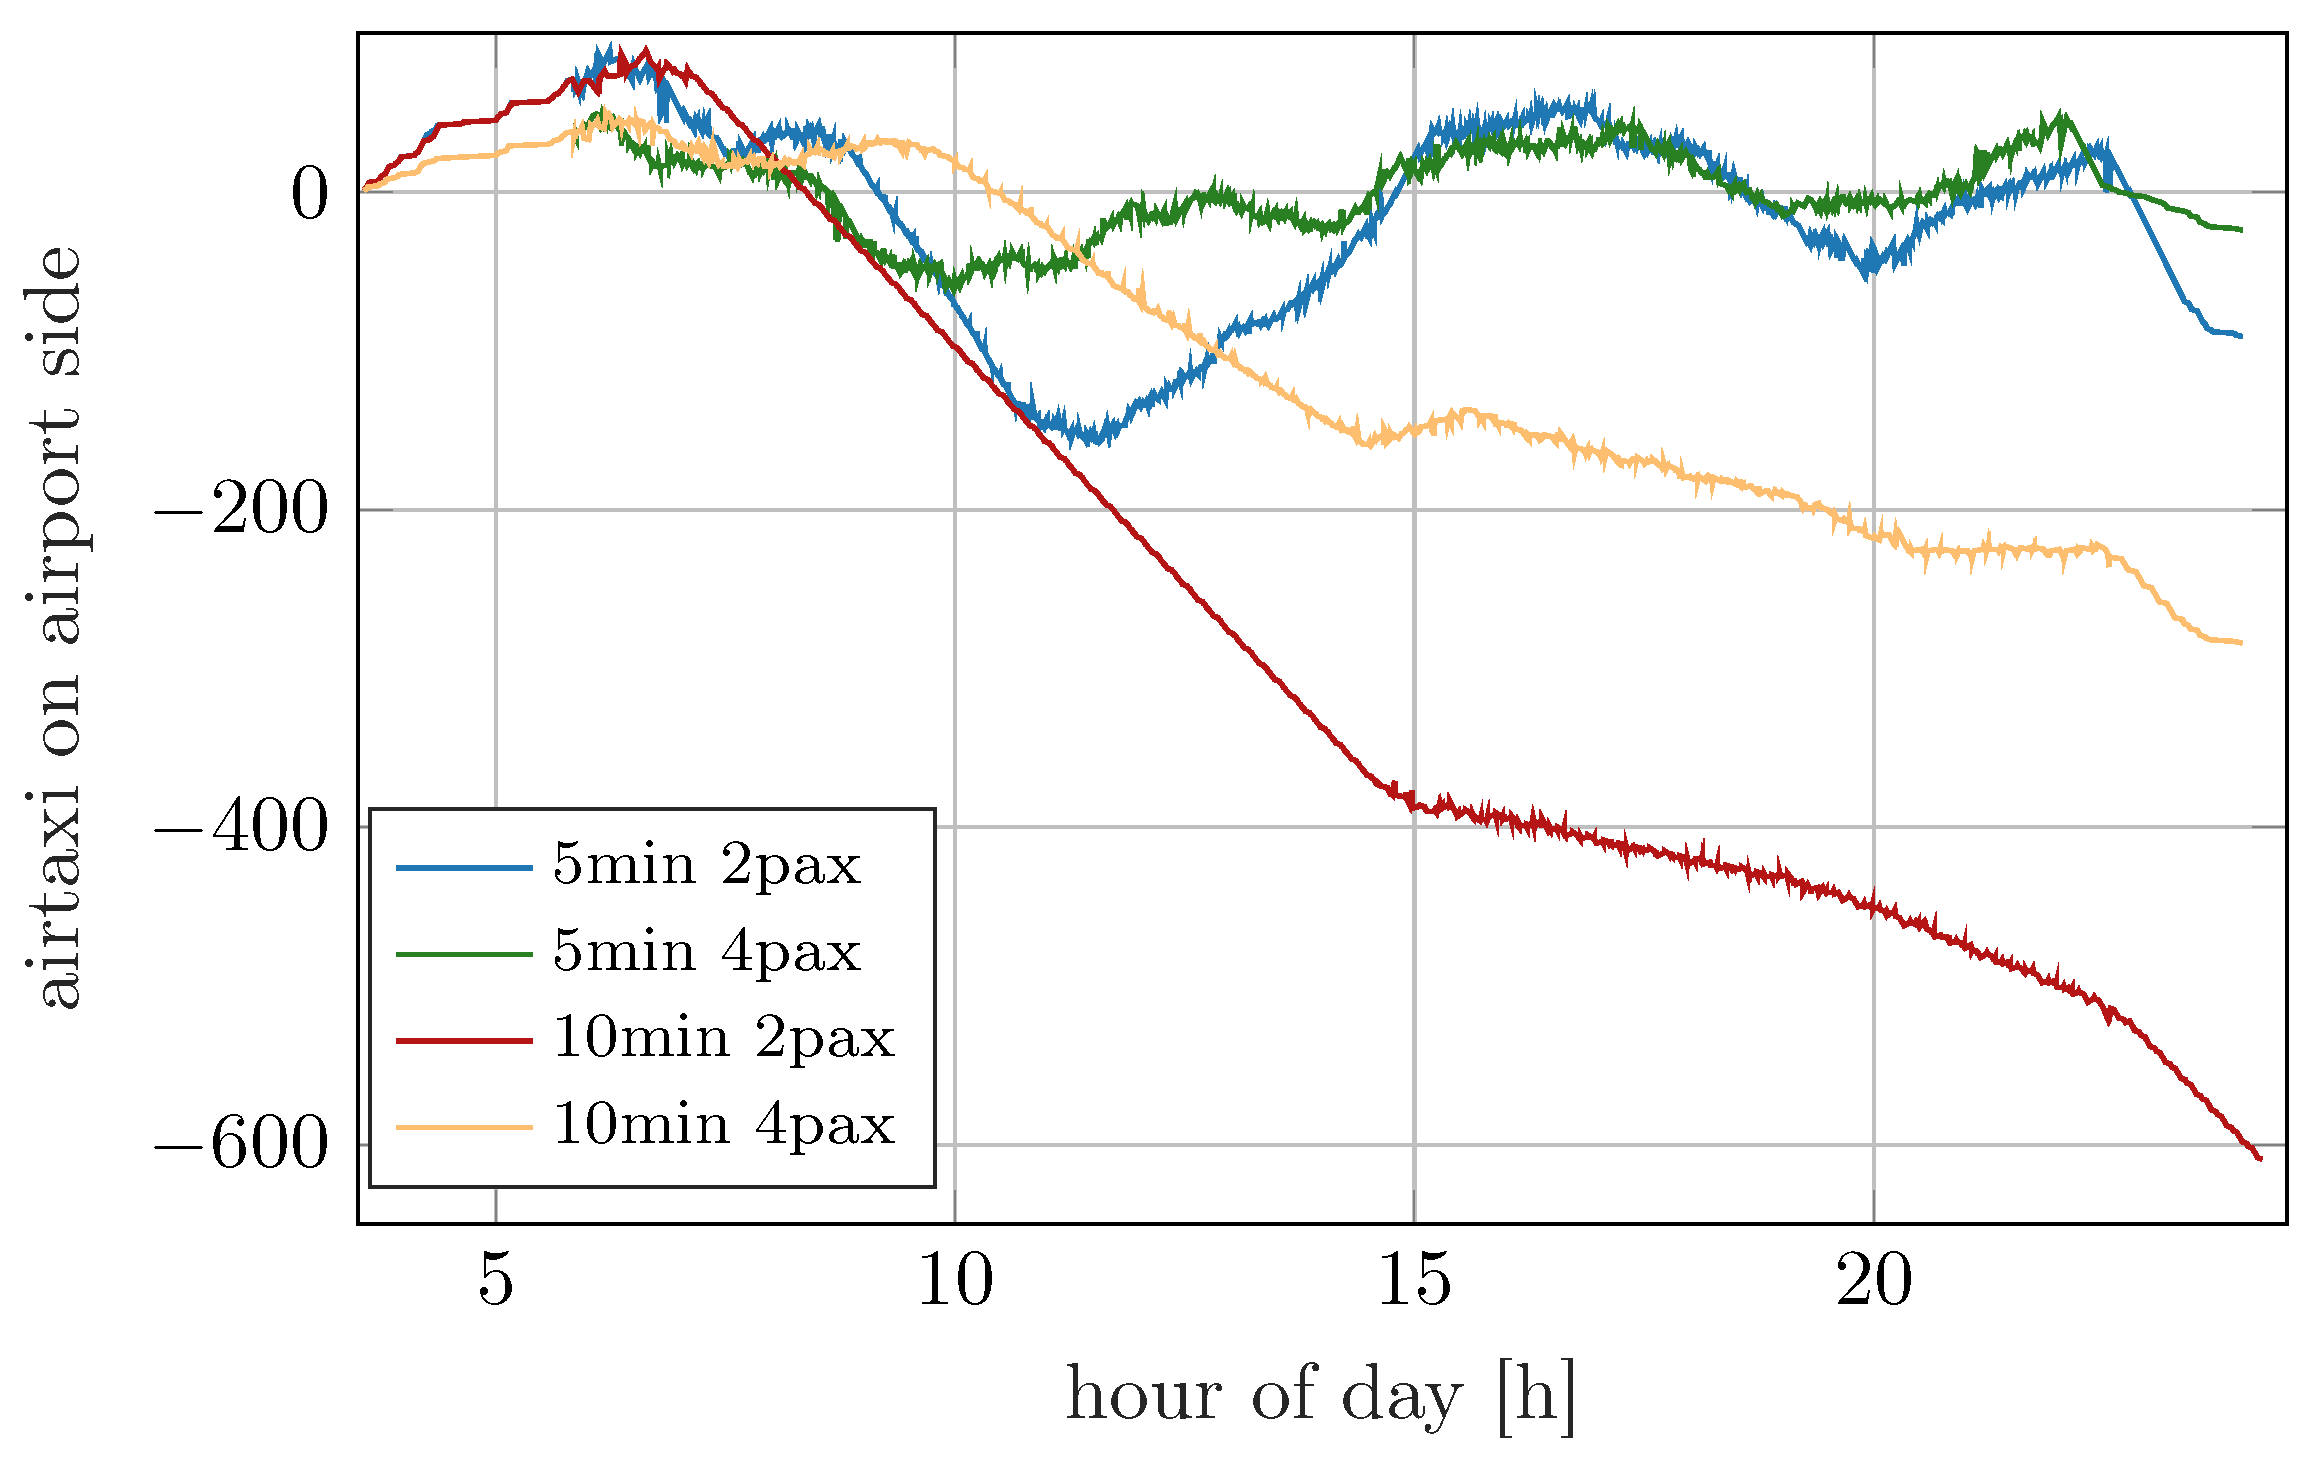
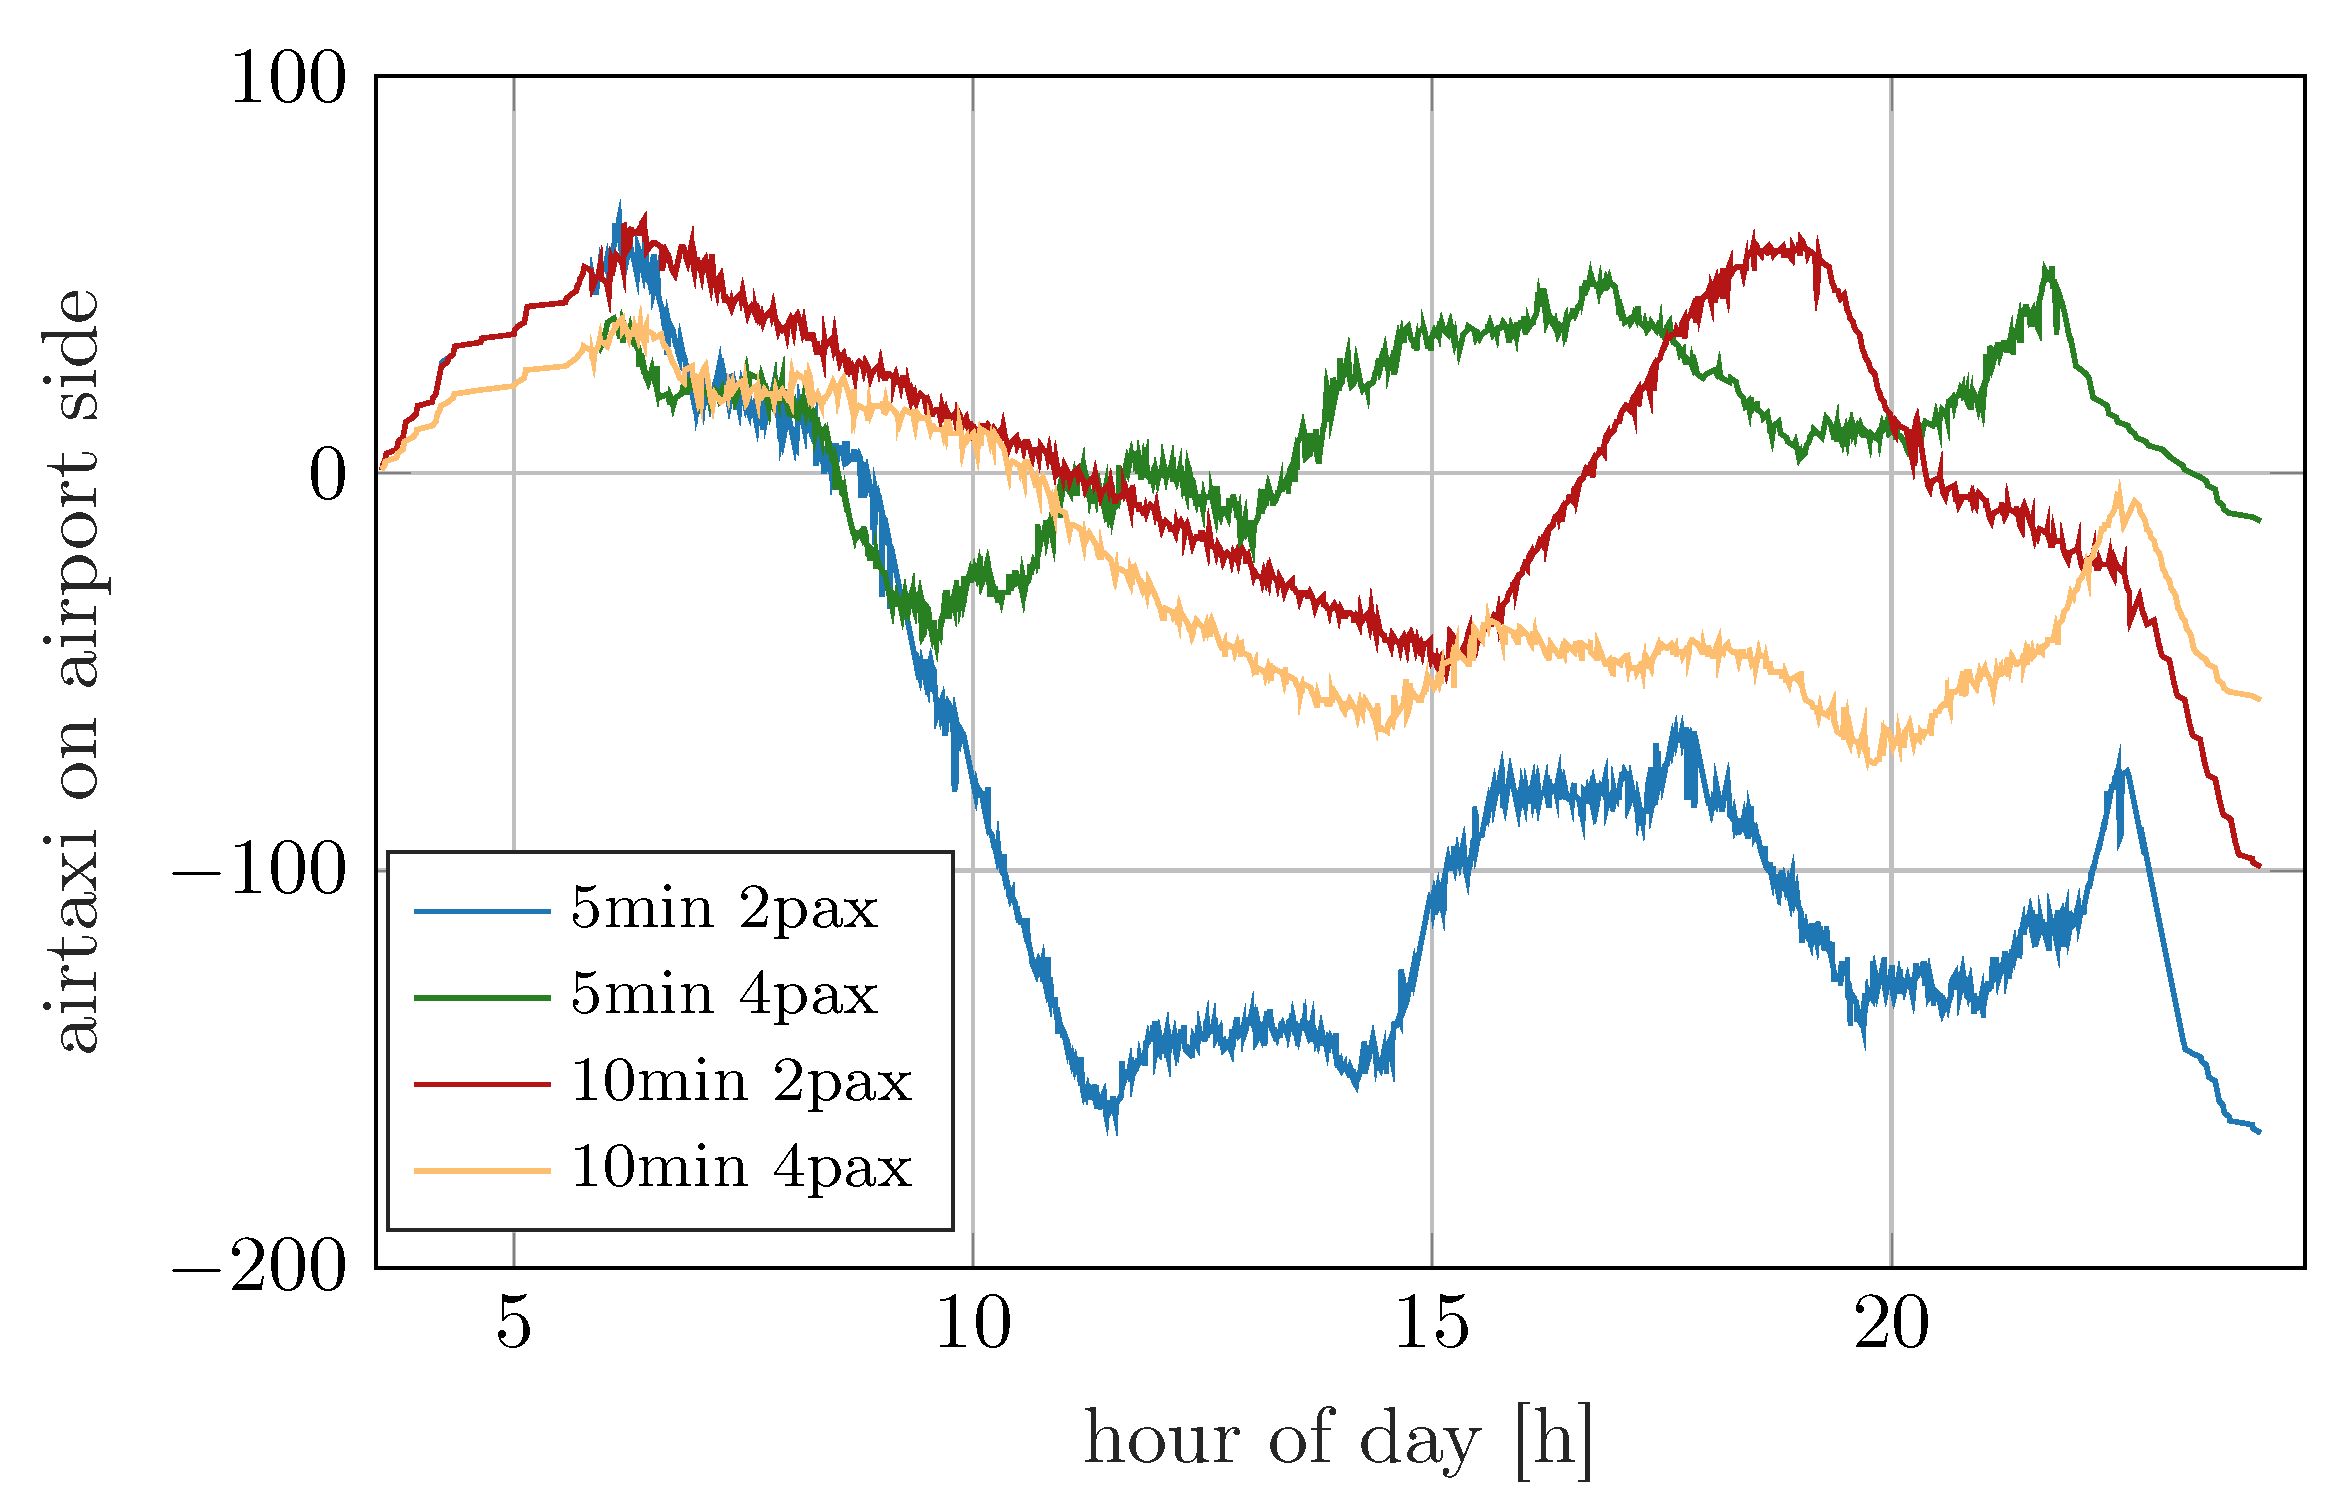
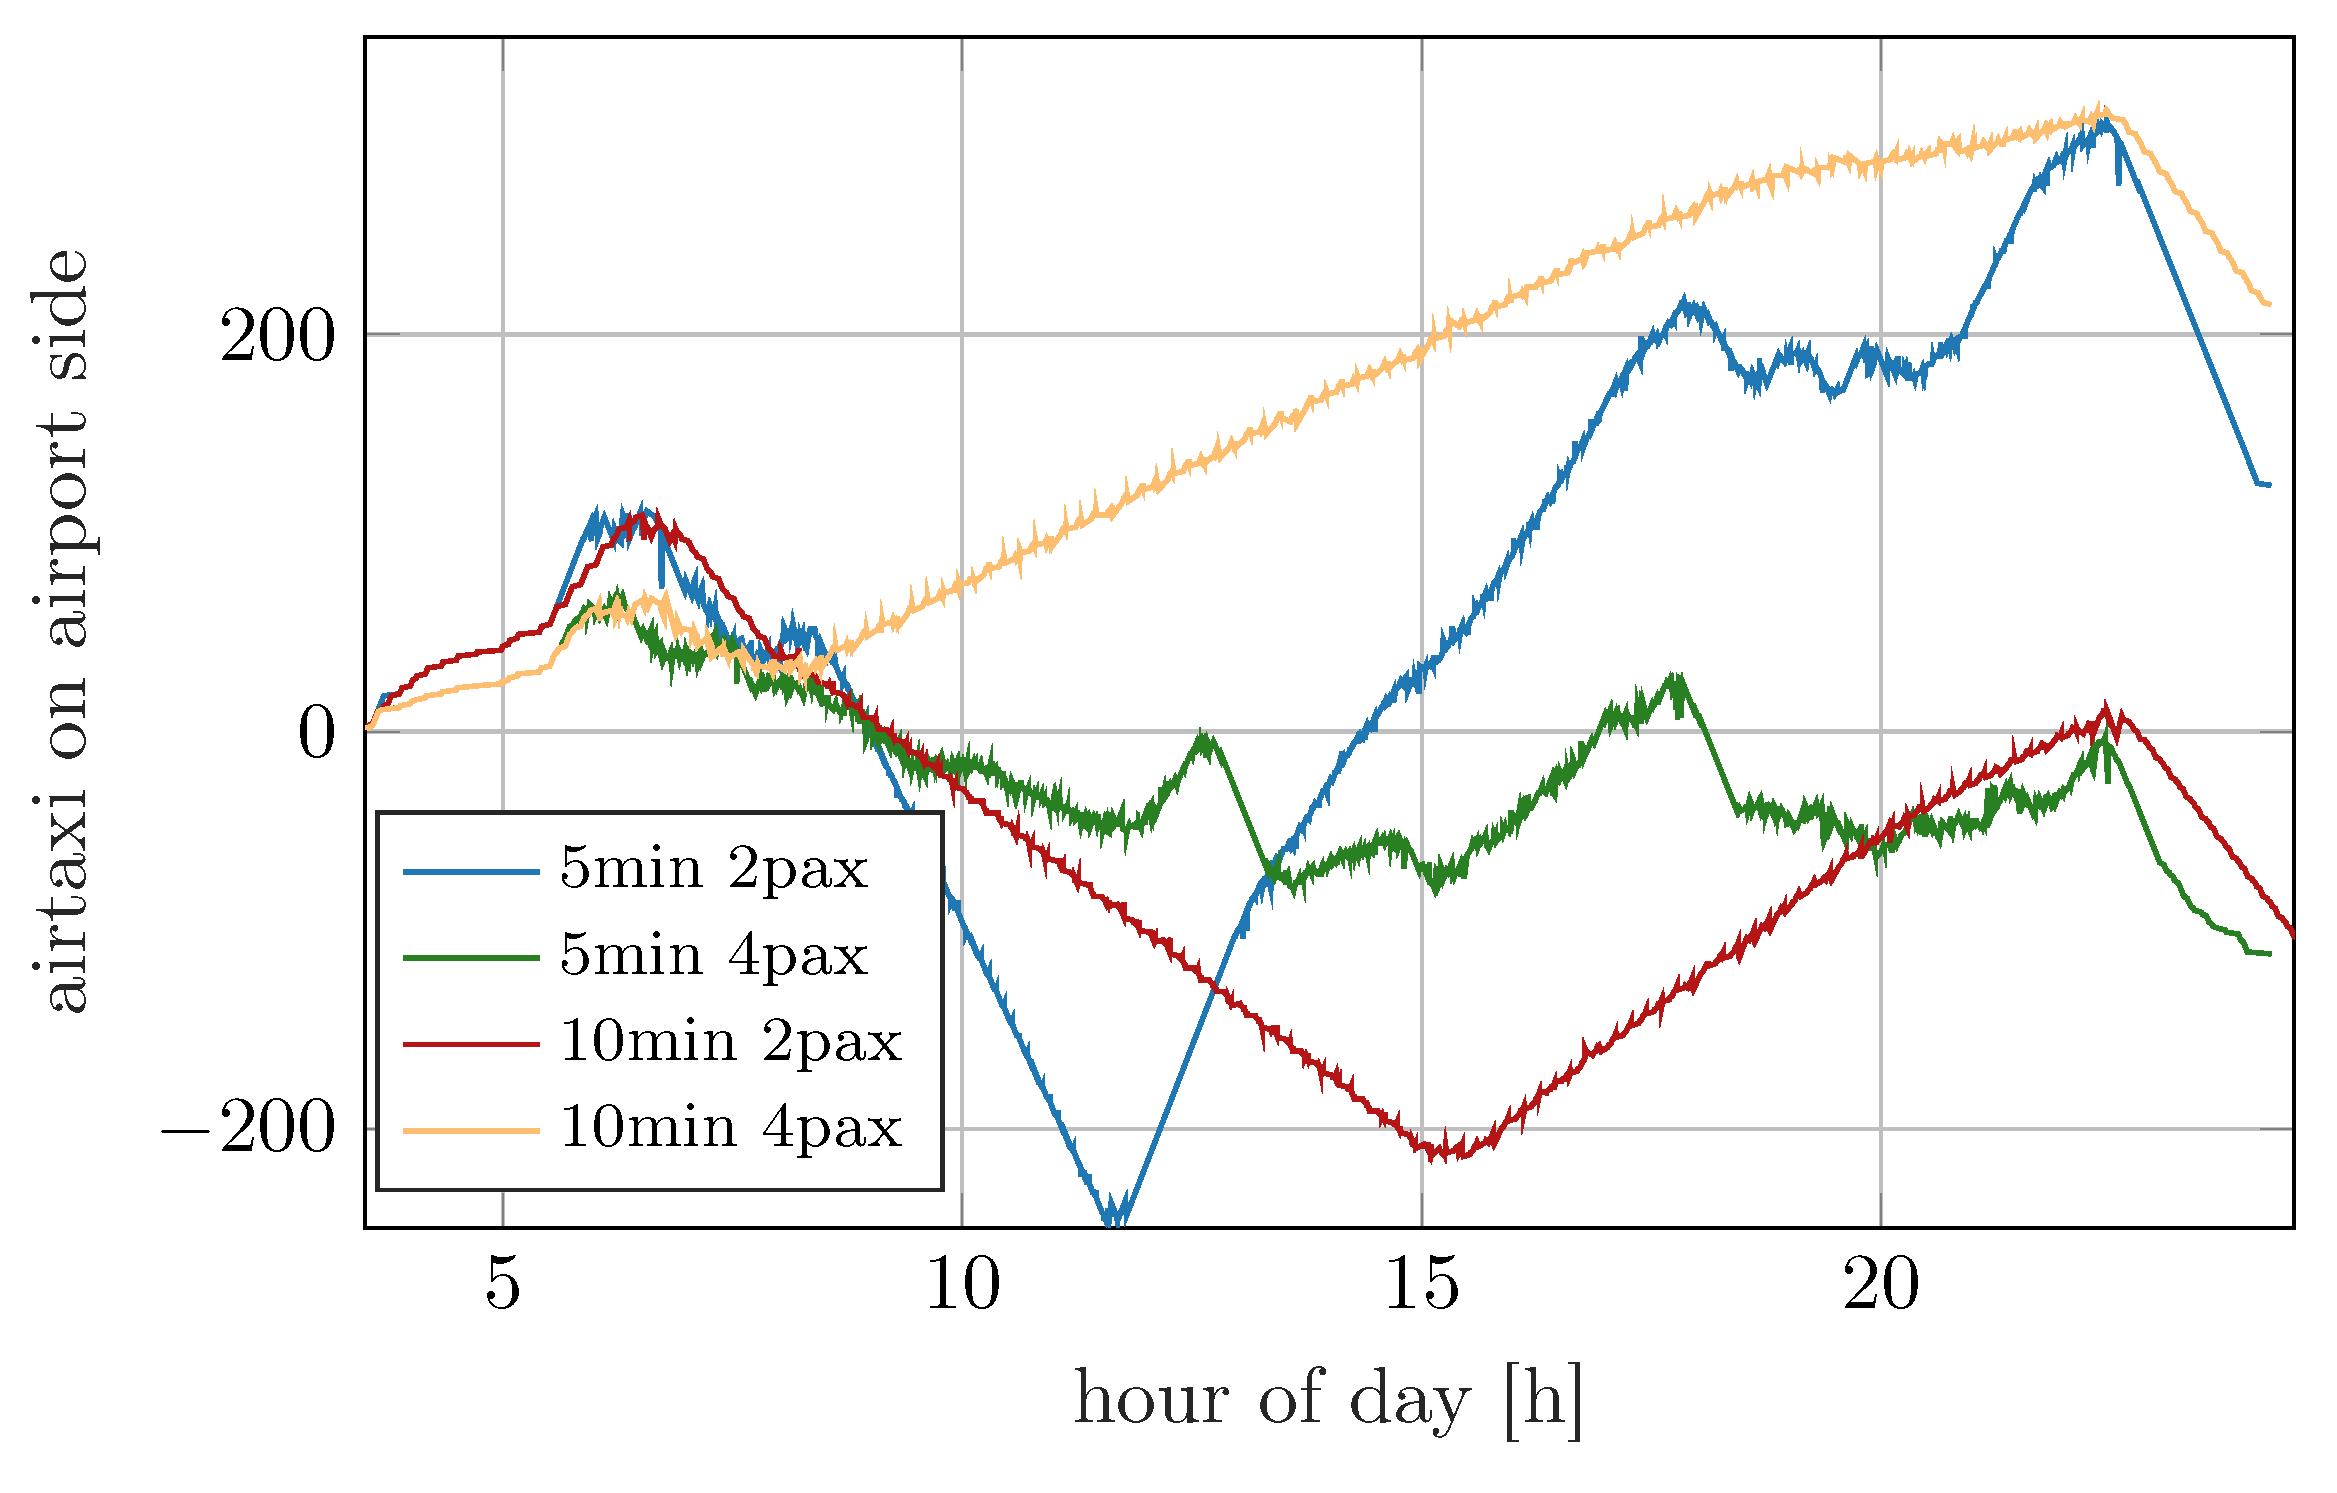
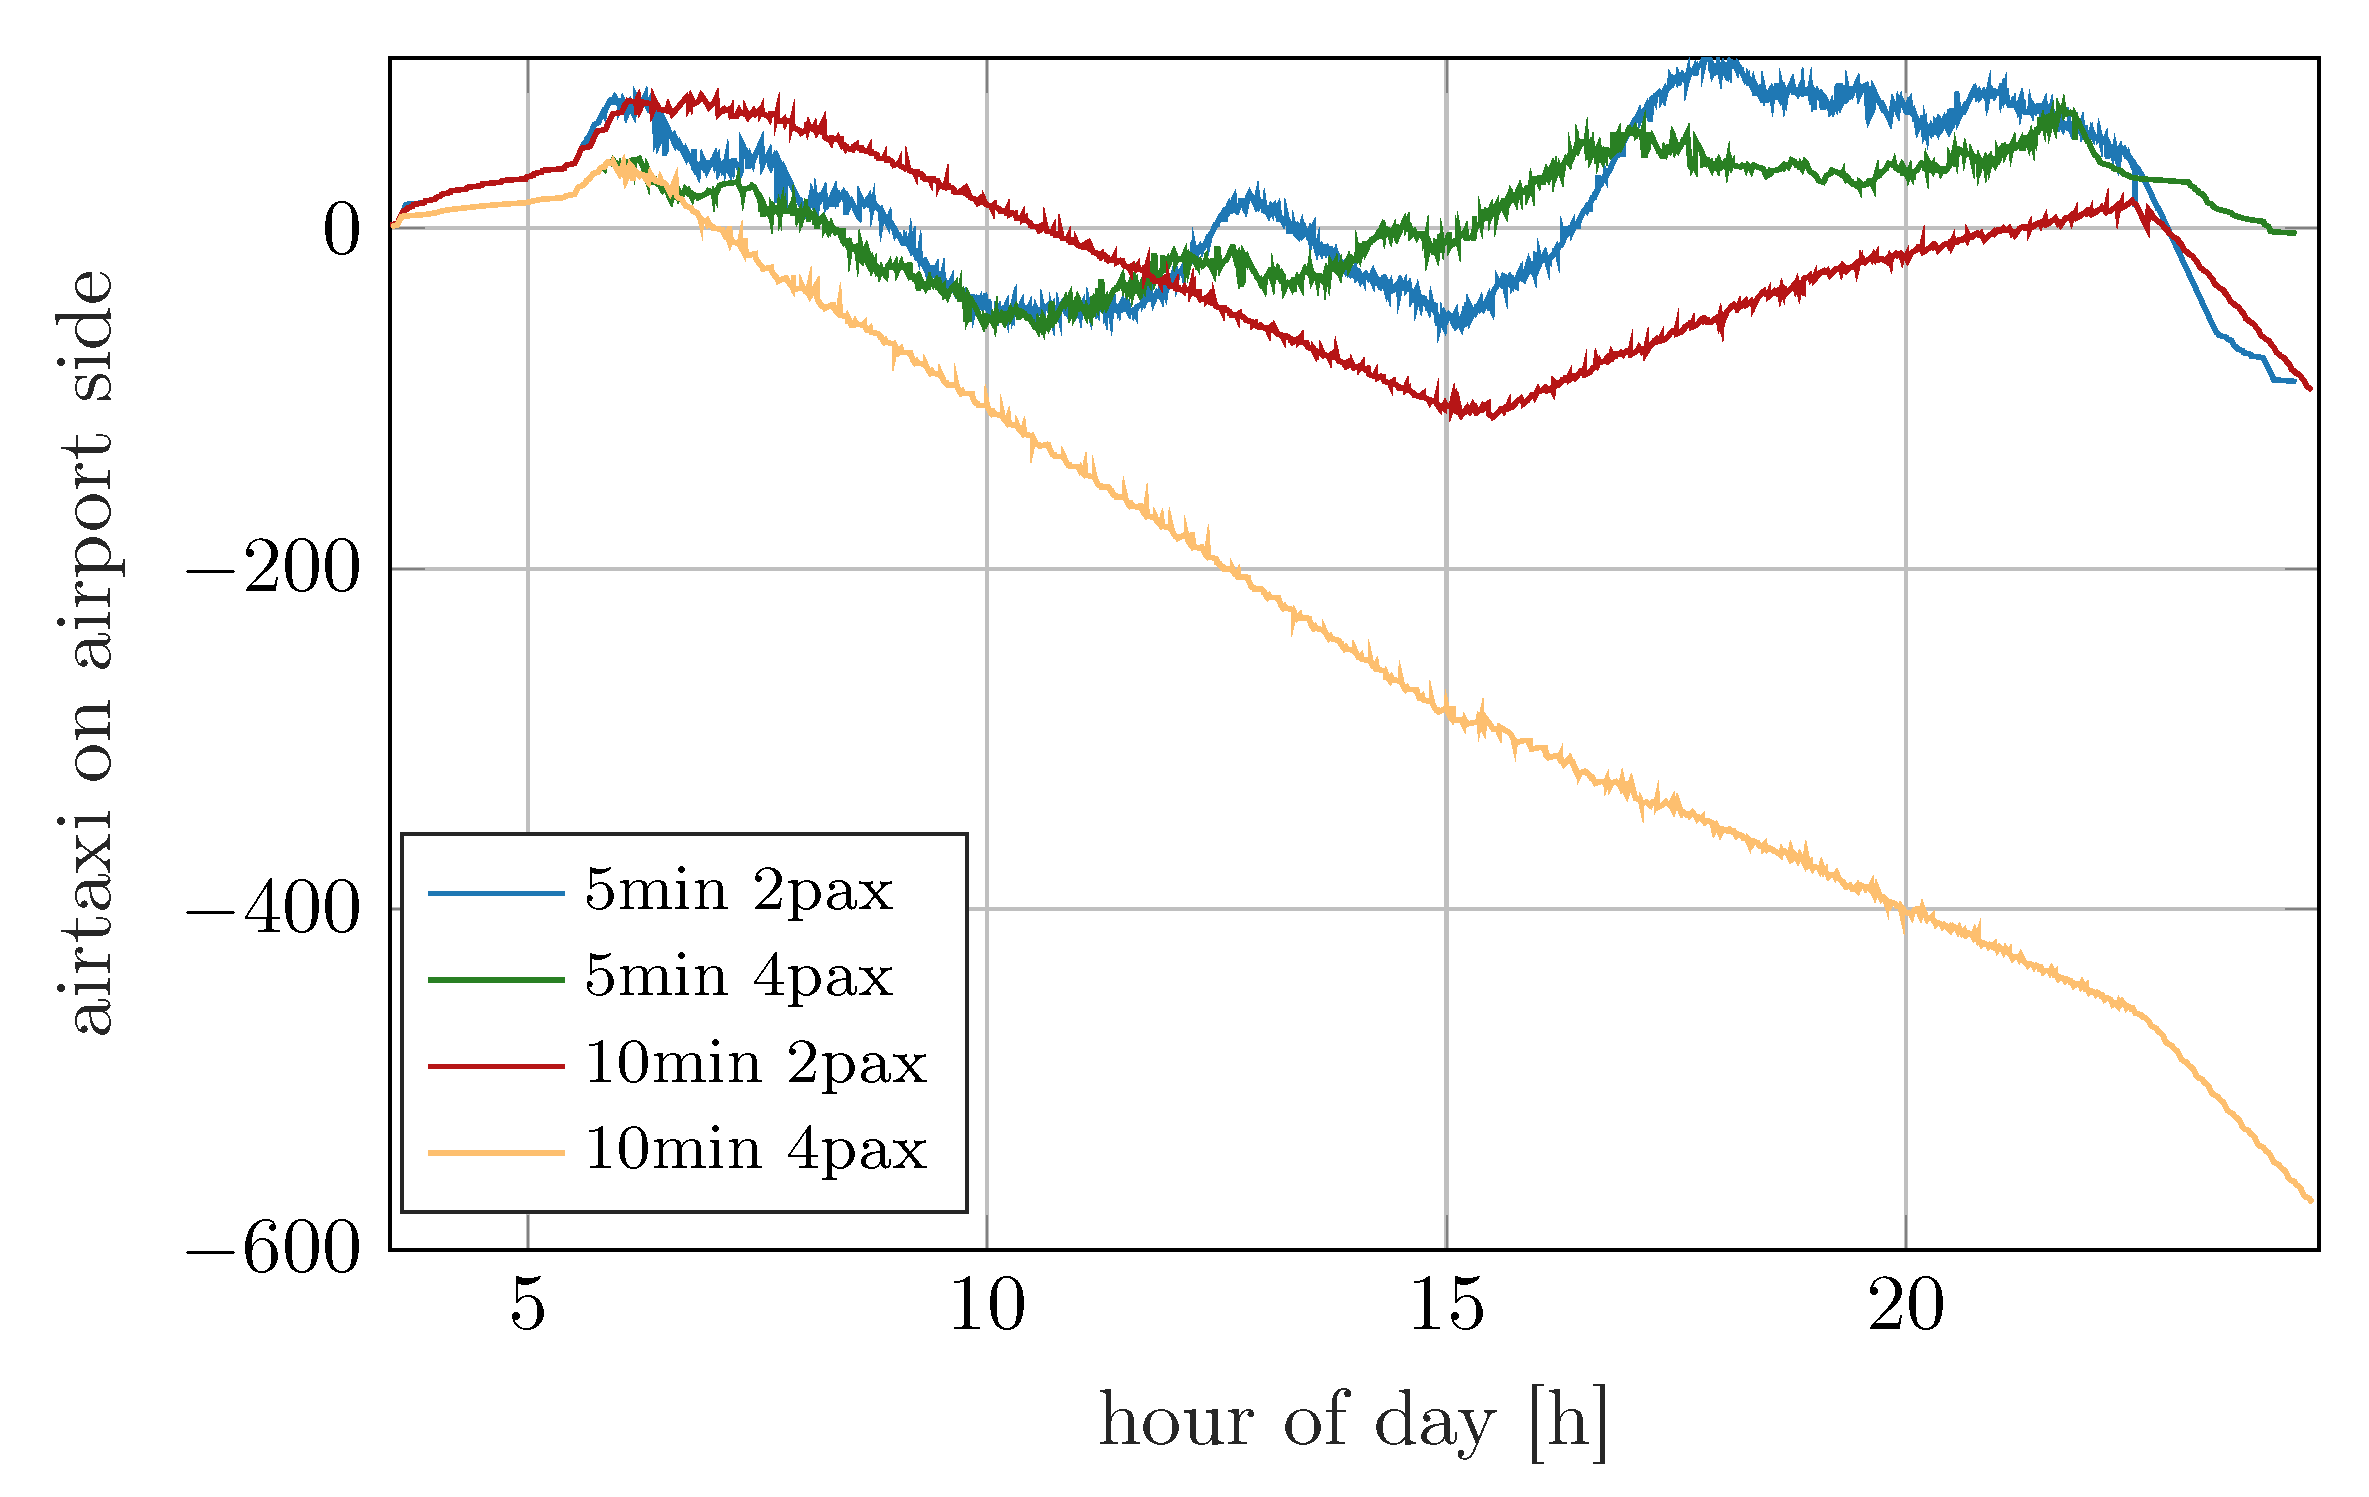
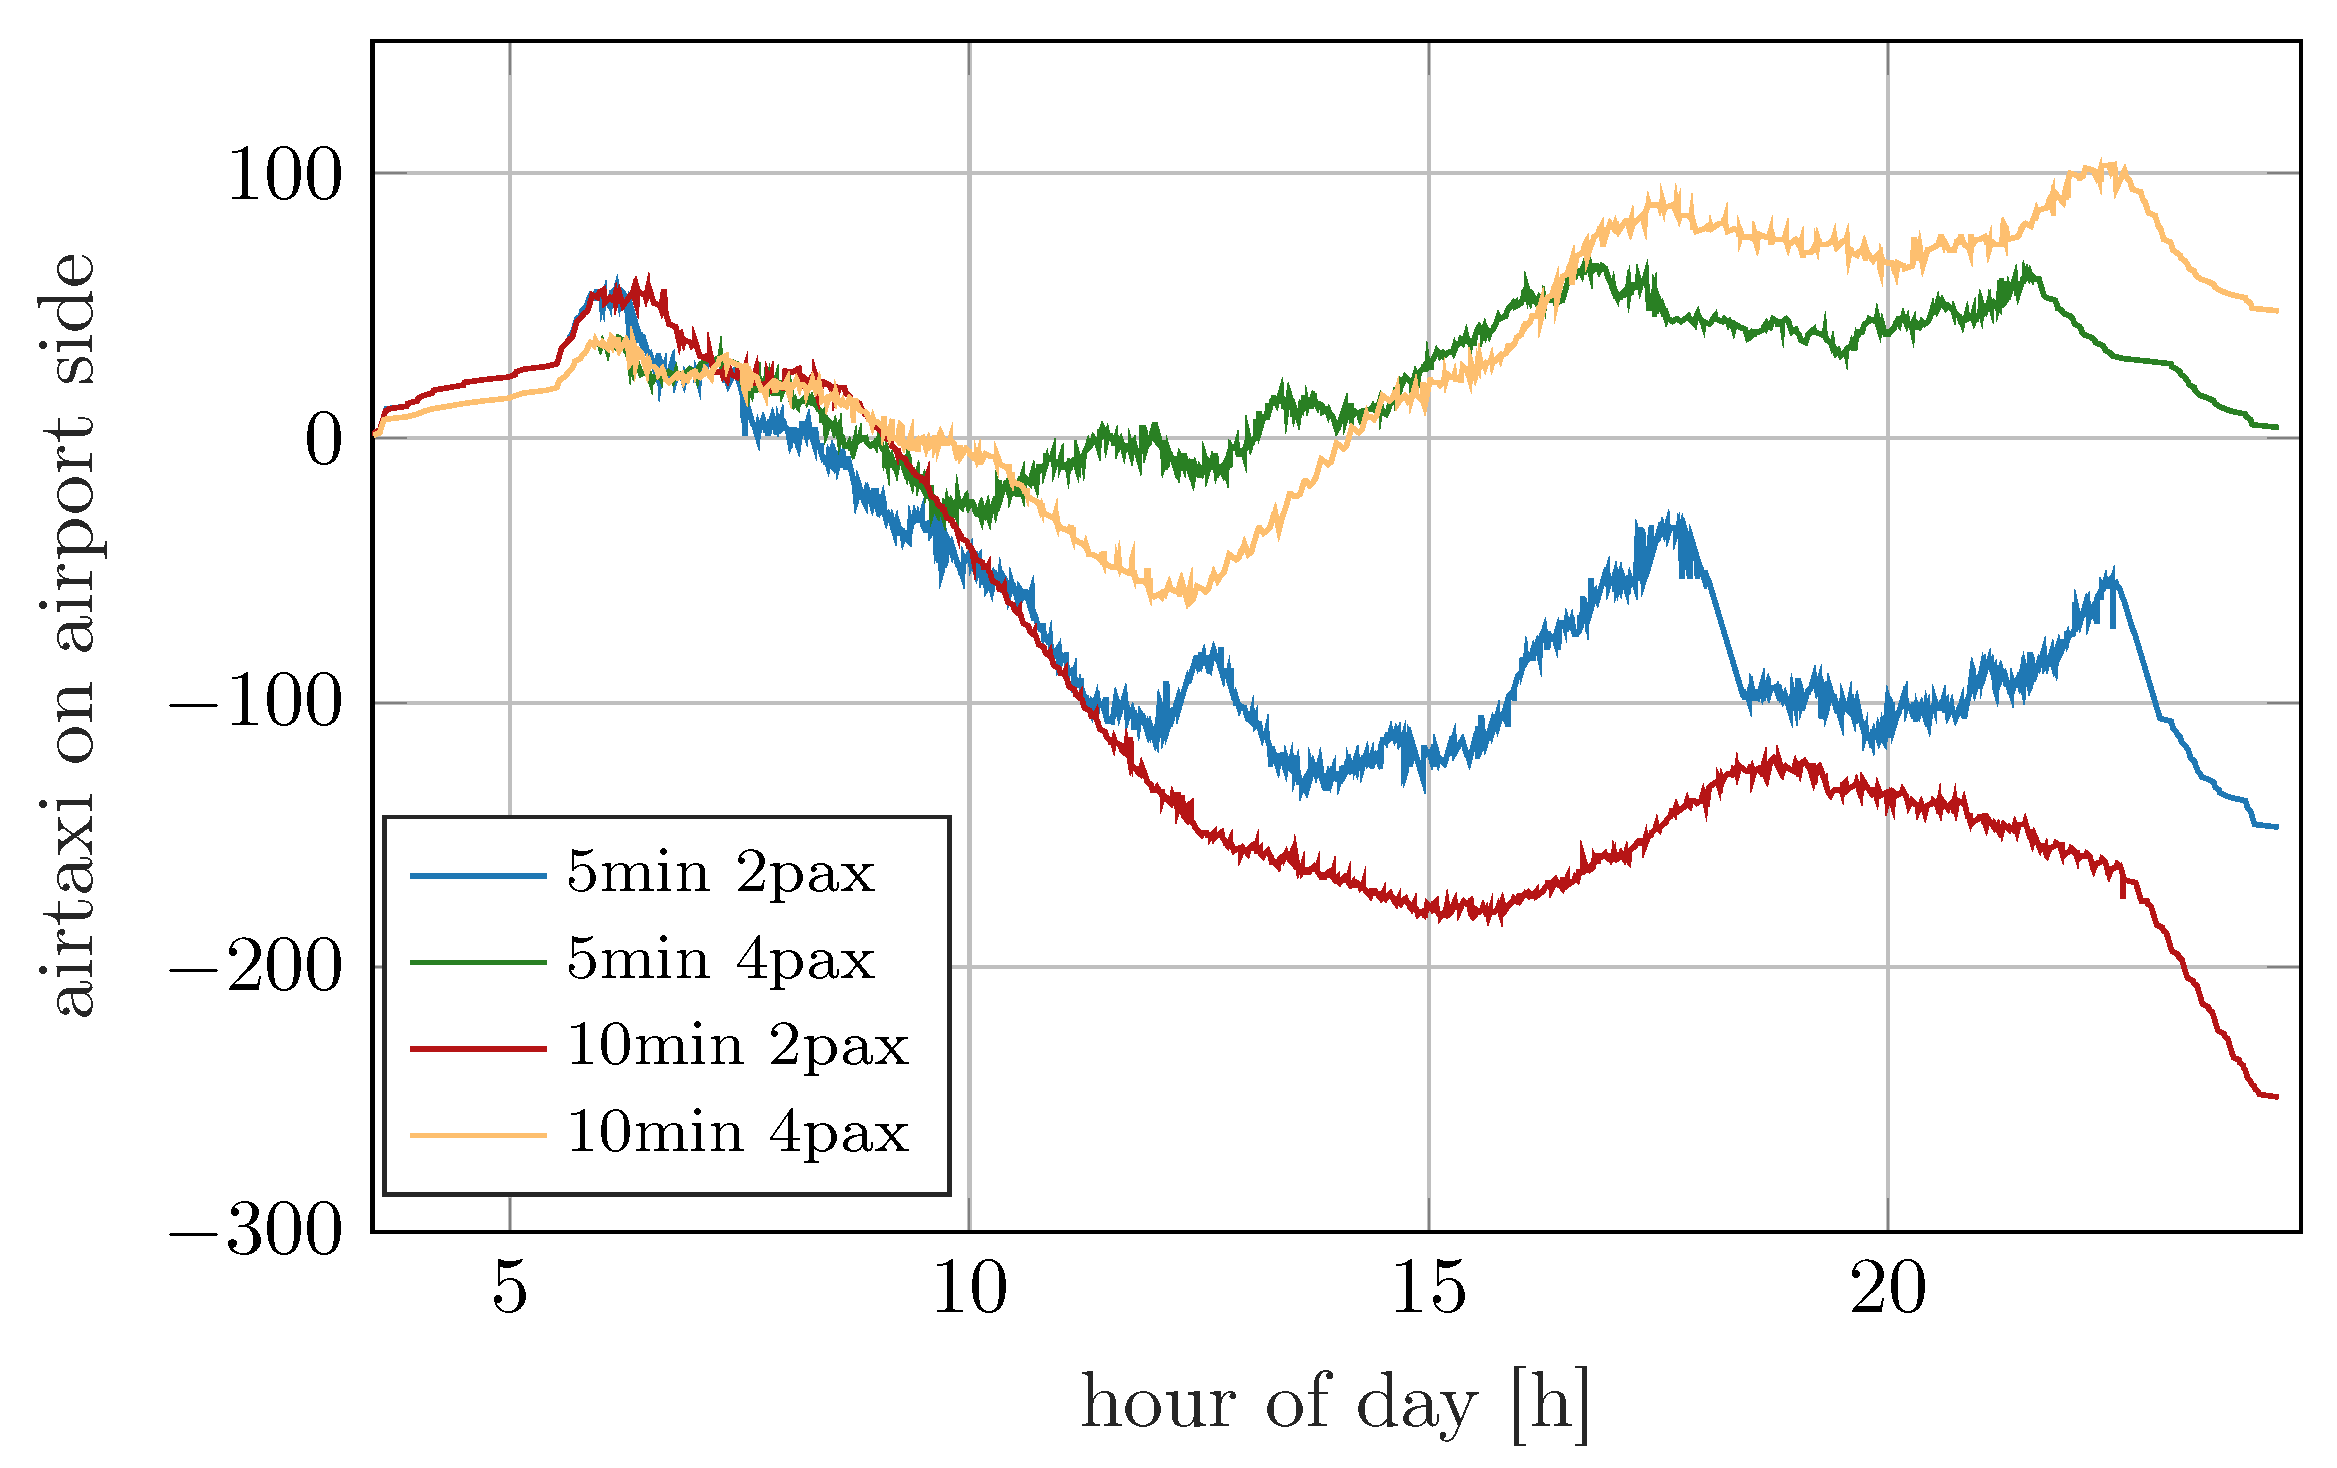
Figure 10 illustrate vehicle imbalances at the airport vertiport over time. We track vehicle count by incrementing at arrival and decrementing at departure. Unequal demand and cancellation asymmetry can lead to hundreds of parked vehicles at one site. For instance, in the west, medium, 4 pax, 10 min scenario (
Figure 9), the trade fair side accumulates over 500 vehicles late in the day. The east wind high demand scenario (
Figure 5) has 48 passengers more at the airport side than on the trade-fair side which could cause up to 48 vehicles in the worst case. When one side blocks takeoffs at the other side, leading to asymmetric cancellations, the vehicle count could sum up to several hundred airtaxis at one vertiport: For example, the east, medium, 2 pax, 10 min scenario (
Figure 6) sees a 600-vehicle deficit, indicating severe imbalance.
A pause in the stream of airtaxis from one side gives the other side a chance to start airtaxis, so that the overwhelming changes direction. This could be seen in the west wind high demand 2 passengers 10 min scenario (
Figure 8) that caused the high number in arrival vertiport delays. Here the vehicles first gather at the airport side until the direction changes and airtaxi pile up at the trade fair side with over 200 airtaxis. The direction than switches again until it nearly evens out. Then a final change leads to over 100 vehicles more at the Trade Fair side than at the airport vertiport. In the same demand scenario, but with 4 instead of 2 passengers, the direction stays one-sided; even as the airport side manages to launch some vehicles, even more vehicle from the Trade Fair side manage to arrive and block departures from the airport. In the end, there is a vehicle pile up of over 200 vehicles at the airport, with a maximum of over 300 vehicles in the evening. The most one-sided situation is observed in the east wind medium demand 2 passengers and 10 min scenario, where the airport side manages to start most of its vehicle after the initial arrival from the Trade Fair. This leads to a steep decline in vehicles until
airtaxis are reached at the airport side. Afterward, the Trade Fair vertiport manages to start some vehicles. This reduces the steepness of the declining vehicle number but the airport side still starts more vehicles than the Trade Fair side. At the the end of the day over 600 vehicles pile up at the Trade Fair. A surprisingly balanced schedule is shown in the east wind high demand scenarios for 10 min of blockage at vertipads and both vehicle sizes (
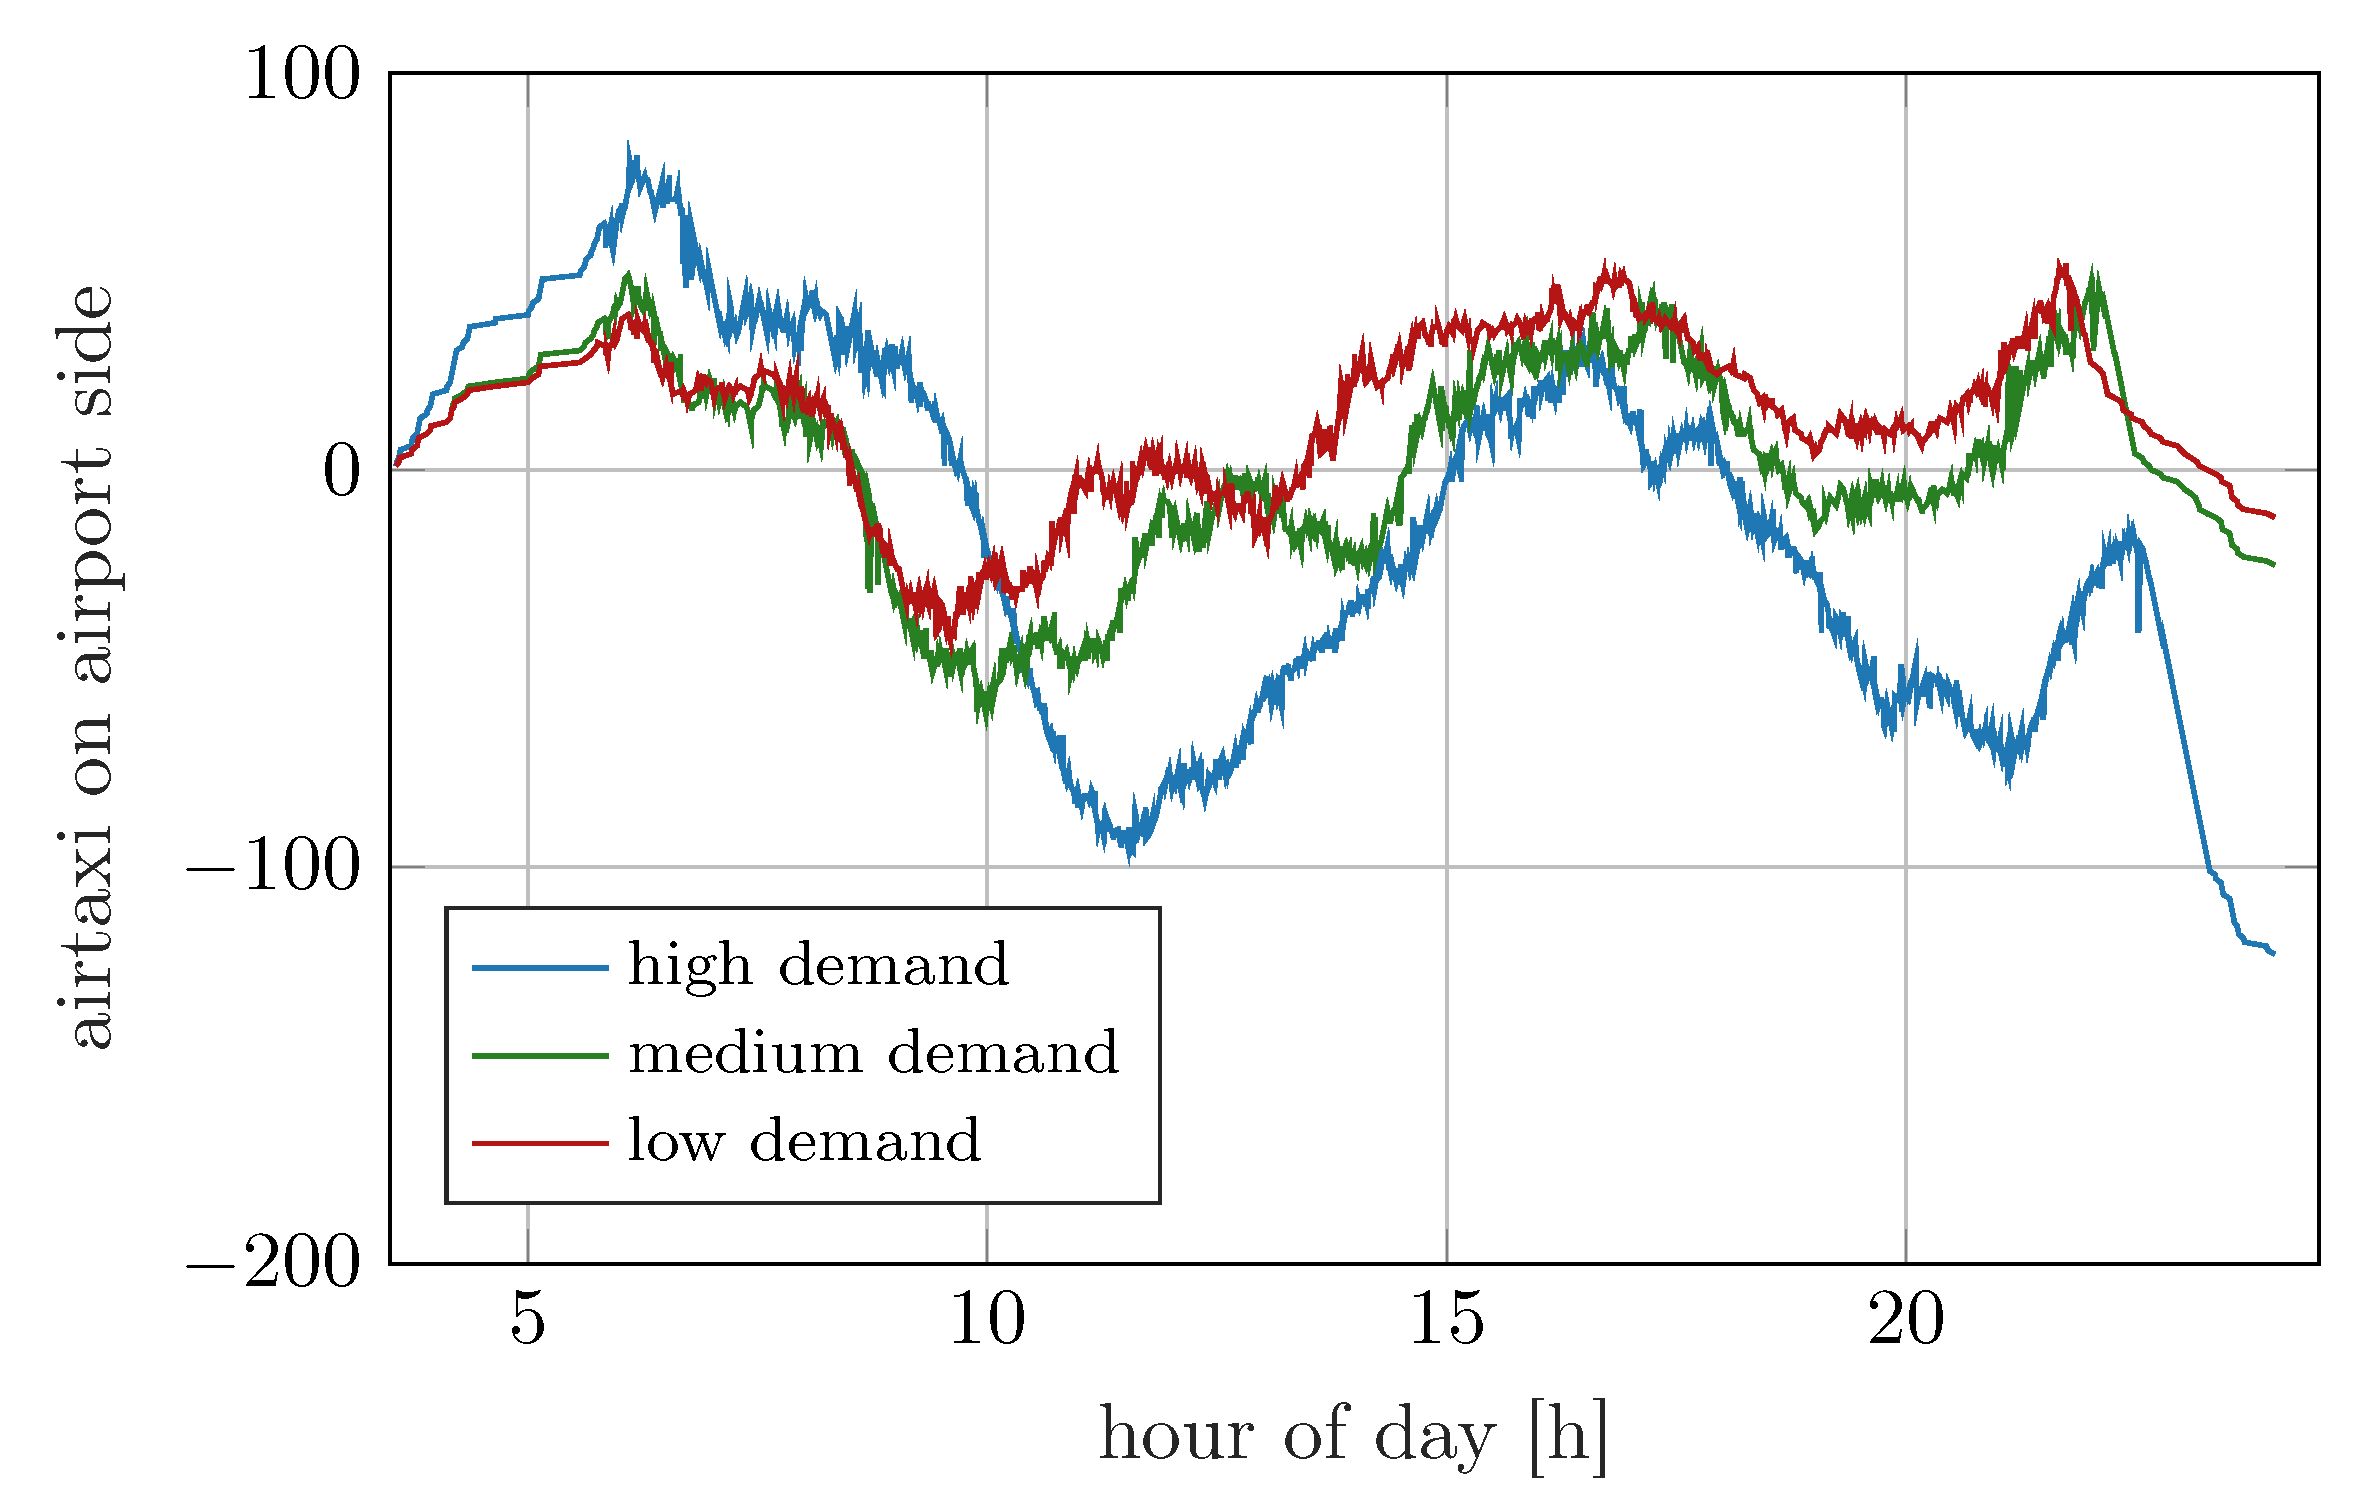
Figure 5). Here, the number of vehicles stay nearly constant over the day and, thus, show a similar number of arrival and departures. In this scenario, both sides manage to start a similar amount of airtaxis without overwhelming the other side. Vehicles still pile up at the airport vertiport from initial arrivals when people want to reach the earliest departing flights while no flights are arriving. This mismatch is reduced at the end of the day when people leave the airport from the last arriving flights. At the end, only 6 vehicles sit at the Trade Fair side showing a nearly even overall schedule while the vertiports operate at their limit. Even without overwhelming, the airtaxi traffic could be one-sided over the day:
Figure 11 shows the numbers of vehicles at the airport vertiport for the east wind 4 passengers 5 min scenarios and all demand configurations.
The low and medium scenario in this configuration managed to serve all flights without cancellation and, thus, show the airtaxis as they have been scheduled from demand (and some delay that never exceeds 15 min). These scenarios still show over 50 vehicles at one vertiport at some points over the day. The high demand scenario already enters a small overwhelming situations, and the airport side manages to launch more vehicles than the trade-fair side, where over 100 vehicles pile up at the end of the day. A more complex scheduling mechanism instead of a purely time sorted adding of flights to the system could address the overwhelming situation and at least to some degree the one sided traffic. The demand still stays asynchronous and the vehicle situation needs to be addressed in future simulations by either empty flights or request denials due to no available vehicle on that vertiport side. Huge fleets of unoccupied vehicles seem economically inefficient and, thus, unlikely.
6. Conclusions
The simulation results highlight the importance of appropriately sized vertiports to accommodate peak-hour demand. Only the scenario featuring the largest vertiport and reduced demand, enabled by larger-capacity airtaxis, could nearly meet the projected traffic levels, even though the theoretical capacity of the vertiport was nearly double the actual demand. In airport shuttle operations, passenger demand tends to cluster around peak arrival and departure times, further intensifying the need for sufficient vertiport throughput. In the current simulations, where at least one corridor remained open at all times, vertiports emerged as the dominant constraint.
Future research (see
Section 3.3) will explore the optimal sizing of vertiports under varying demand conditions for economical viability. Once vertiport capacity is sufficient, the corridor becomes the primary bottleneck. In the current simulation, the corridor network lacked sufficient redundancy. Although the system could compensate for temporary closures of the main corridor due to landing aircraft, prolonged blockages caused by irregular traffic (e.g., helicopters) rendered the service unreliable—an unacceptable outcome for a premium, time-sensitive airport shuttle. Additionally, schedule asymmetries between the two vertiports led to imbalances in vehicle distribution, with one vertiport accumulating idle airtaxis while the other experienced shortages.
Future simulations should consider persistent vehicle fleets, including the need for repositioning flights, either stored or flown empty, to rebalance supply. These repositioning flights would increase operational load on both vertiports and corridors, potentially aggravating existing bottlenecks. When operating near the capacity, the importance of a well-balanced schedule becomes evident. Several scenarios demonstrated that an uncoordinated scheduling can lead to overwhelming situations, where one vertiport becomes saturated and blocks operations at the other. Conversely, balanced schedules, achieved in two of the simulation runs, show that it is possible to maintain high throughput without excessive delays, although some passengers may still need to switch to alternative transport modes. Even on days when all passenger demand was met, asymmetries persisted. Because airtaxi demand is tied to commercial flight schedules, which are not evenly distributed throughout the day, there are periods with significantly more inbound or outbound traffic. This imbalance led to accumulations of over 50 vehicles at a single vertiport during certain times. Addressing this issue would require either a sufficiently large vehicle pool and storage capacity at both vertiports or a strategic plan for empty return flights, which would further strain the infrastructure.
Future research should explore the design of robust schedules for high-demand days. Moreover, the current scenario includes only two vertiports. Introducing additional vertiports, such as in nearby cities like Offenbach, would significantly increase network complexity. In this case, more corridors, e.g., connecting almost every vertiport with every other, should be considered. Demand patterns could become highly directional, e.g., in the morning there might be more flights from the outskirts to the city center. For instance, morning traffic may concentrate toward the city center, while outbound demand remains low, leading to a surge in empty repositioning flights. In such cases, dynamic rerouting during flight (rather than pre-takeoff corridor selection) may be necessary to maintain system flexibility and efficiency. Expanding the network in a future study to include multiple vertiports will be essential in understanding the broader operational dynamics of urban air mobility systems.
To conclude, our simulation, historical background traffic, and used demand model shows that in principle the presented airtaxi operation is technically feasible. The throughput of designed airtaxi corridors is high enough to support the rather optimistic demand model with the historic air traffic data. However, the number of vertiports for smooth operations can grow too large and some re-balancing flights have to be assumed in the future. One must be aware that the demand models found in the relevant literature do not come from real airtaxi operations; there simply are none. Similarly, whether the airtaxi operation is financially feasible has yet to be put to the test in practice.
Author Contributions
Conceptualization, F.M., C.K., E.N. and R.K.; methodology, F.M., C.K., E.N. and R.K.; software, F.M., E.N., C.K. and R.K.; validation, F.M.; formal analysis, C.K.; investigation, F.M. and C.K.; data curation, C.K. and R.K.; writing—original draft preparation, F.M., C.K., E.N. and R.K.; writing—review and editing, F.M., C.K., E.N. and R.K.; visualization, F.M.; All authors have read and agreed to the published version of the manuscript.
Funding
This research received no external funding.
Data Availability Statement
The research in this paper is based on data bought from 3rd party: Flightradar24 (
https://www.flightradar24.com). The data sample included flight traffic around Frankfurt airport on the 1 and 2 August in 2022 and could be bought directly from Flighradar24. We are not allowed to share it directly. Assumptions on airtaxi performance and the demand model are mentioned in the paper. The source code used could not be shared.
Acknowledgments
We thank Jan Pertz from the Department of Air Transport Management at the Institute of Air Transport for supplying projected estimates of the airtaxi demand among airplane passengers.
Conflicts of Interest
The authors declare no conflicts of interest.
Abbreviations
| ATM | air traffic management |
| eVTOL | electric vertical take-off and landing |
| CFMS | Copter Flight Management System |
| ConOps | concept of operations |
| CORUS | Concept of Operations for European U-space Services |
| CORUS-XUAM | Concept of Operations for European U-space Services—Extension for Urban Air |
| | Mobility |
| DFS | Deutsche Flugsicherung |
| HEMS | helicopter emergency medical services |
| IFR | instrumental flight rules |
| NFZ | no-fly zone |
| RWY | runway |
| SESAR | Single European Sky ATM Research Programme |
| UAM | Urban Air Mobility |
| VFR | visual flight rules |
References
- Teutsch, J.; Petersen, C.; Schwoch, G.; Lieb, T.J.; Bos, T.; Zon, R. On the Impact of UAS Contingencies on ATC Operations in Shared Airspace. In Proceedings of the 2023 Integrated Communication, Navigation and Surveillance Conference (ICNS), Herndon, VA, USA, 18–20 April 2023; IEEE: Piscataway, NJ, USA, 2023; pp. 1–15. [Google Scholar] [CrossRef]
- Schwoch, G.; Lieb, T.J.; Shamim, M.; Vanhandenhove, G. Interaction between ATM and UAS operators in U-space operations and potential automation benefits. In Proceedings of the 2024 Integrated Communications, Navigation and Surveillance Conference (ICNS), Herndon, VA, USA, 23–25 April 2024; IEEE: Piscataway, NJ, USA, 2024; pp. 1–9. [Google Scholar] [CrossRef]
- Sievers, T.F.; Geister, D.; Schwoch, G.; Peinecke, N.; Schuchardt, B.I.; Volkert, A.; Lieb, J. DLR Blueprint–Initial conops of U-space Flight Rules (UFR). In DLR Institute of Flight Guidance, Braunschweig, Germany; German Aerospace Center (DLR), Linder Höhe: Cologne, Germany, 2024. [Google Scholar] [CrossRef]
- Kallies, C.; Schweiger, K.; Karásek, R.; Morscheck, F.; Lambers, D. Development and Evaluation of a U-space Route Structure for the City of Frankfurt connecting Airport and Trade Fair via fast-time Simulation. In Proceedings of the 2023 Integrated Communication, Navigation and Surveillance Conference (ICNS), Herndon, VA, USA, 18–20 April 2023; IEEE: Piscataway, NJ, USA, 2023; pp. 1–8. [Google Scholar] [CrossRef]
- Riccardi, G.; Brucculeri, L.; Fornaciari, E.; D’Onofrio, M.; Zilli, A.; Leanza, D.; Ferrara, G.; Molinario, M.; Esposito, G.; Favier, A. CORUS-XUAM: Tackling Urban Air Mobility Airspace Integration Challenges; International Council of the Aeronautical Sciences: Bonn, Germany, 2024. [Google Scholar]
- Schweiger, K.; Preis, L. Urban Air Mobility: Systematic Review of Scientific Publications and Regulations for Vertiport Design and Operations. Drones 2022, 6, 179. [Google Scholar] [CrossRef]
- Li, J.; Zhang, H.; Yi, J.; Deng, C.; Zhou, J. Capacity assessment of vertiports with a scheduling algorithm considering quality of service. Aeronaut. J. 2025, 129, 1791–1809. [Google Scholar] [CrossRef]
- Preis, L.; Hornung, M. A Vertiport Design Heuristic to Ensure Efficient Ground Operations for Urban Air Mobility. Appl. Sci. 2022, 12, 7260. [Google Scholar] [CrossRef]
- Schweiger, K.; Knabe, F. Vertidrome Airside Level of Service: Performance-Based Evaluation of Vertiport Airside Operations. Drones 2023, 7, 671. [Google Scholar] [CrossRef]
- Stolz, M.; Papenfuß, A.; Dunkel, F.; Linhuber, E. Harmonized Skies: A Survey on Drone Acceptance across Europe. Drones 2024, 8, 107. [Google Scholar] [CrossRef]
- Rimjha, M.; Hotle, S.; Trani, A.; Hinze, N.; Smith, J.C. Urban Air Mobility Demand Estimation for Airport Access: A Los Angeles International Airport Case Study. In Proceedings of the 2021 Integrated Communications Navigation and Surveillance Conference (ICNS), Dulles, VA, USA, 19–23 April 2021; IEEE: Piscataway, NJ, USA, 2021; pp. 1–15. [Google Scholar] [CrossRef]
- Asmer, L.; Jaksche, R.; Pak, H.; Kokus, P. A city-centric approach to estimate and evaluate global Urban Air Mobility demand. Ceas Aeronaut. J. 2024, 15, 1–16. [Google Scholar] [CrossRef]
- CORUS. SESAR Concept of Operations for U-Space; SESAR Joint Undertaking: Brussels, Belgium, 2019; Available online: https://www.sesarju.eu/sites/default/files/documents/u-space/CORUS%20ConOps%20vol2.pdf (accessed on 5 June 2025).
- CORUS-XUAM. U-Space Concept of Operations, 4th ed.; SESAR Joint Undertaking: Brussels, Belgium, 2022; Available online: https://www.sesarju.eu/sites/default/files/documents/reports/U-space%20CONOPS%204th%20edition.pdf (accessed on 5 June 2025).
- DFS Deutsche Flugsicherung GmbH; Deutsches Zentrum für Luft- und Raumfahrt e.V. (DLR); Droniq GmbH; NATS; Volocopter GmbH. DN7.1 CORUS-XUAM DEMO EXE#2 Report. Available online: https://cordis.europa.eu/project/id/101017682/results (accessed on 3 February 2025).
- Morscheck, F.; Kallies, C.; Nagel, E.; Karásek, R. Development and Evaluation via Fast-Time Simulation of an Air Taxi Shuttle Service for the City of Frankfurt Connecting Airport and Trade Fair. In Proceedings of the 2025 Integrated Communication, Navigation and Surveillance Conference (ICNS), Brussels, Belgium, 8–10 April 2025; IEEE: Piscataway, NJ, USA, 2025; pp. 1–9. [Google Scholar]
- Flightradar24. Live Air Traffic. Available online: https://www.flightradar24.com/ (accessed on 11 April 2025).
- FRAPORT. Operation Mode Frankfurt Airport. Available online: https://www.fraport.com/de/nachhaltigkeit/nachbarschaftsdialog/laerm-und-luft/flugbetrieb/betriebsrichtung.html (accessed on 5 June 2025).
- Morscheck, F. A modular experimental flight management and 4D trajectory generation system for unmanned multicopter, Urban Air Mobility vehicles and other VTOL vehicles. In Proceedings of the 2021 IEEE/AIAA 40th Digital Avionics Systems Conference (DASC), San Antonio, TX, USA, 3–7 October 2021; IEEE: Piscataway, NJ, USA, 2021; pp. 1–9. [Google Scholar] [CrossRef]
- Kuenz, A. High Performance Conflict Detection and Resolution for Multi-Dimensional Objects. Doctoral Thesis, Leipniz Universität Hannover, Hannover, Germany, 2015. Available online: https://repo.uni-hannover.de/bitstreams/34a5c6a4-e966-4711-8eec-91164476d669/download (accessed on 5 June 2025).
- Kuenz, A. The 5th dimension in conflict management-XYZT+ capability. In Proceedings of the 2015 IEEE/AIAA 34th Digital Avionics Systems Conference (DASC), Prague, Czech Republic, 13–17 September 2015; IEEE: Piscataway, NJ, USA, 2015; p. 1A5-1. [Google Scholar] [CrossRef]
- Zelinski, S. Operational analysis of vertiport surface topology. In Proceedings of the 2020 AIAA/IEEE 39th Digital Avionics Systems Conference (DASC), San Antonio, TX, USA, 11–15 October 2020; IEEE: Piscataway, NJ, USA, 2020; pp. 1–10. [Google Scholar] [CrossRef]
- Guerreiro, N.M.; Hagen, G.E.; Maddalon, J.M.; Butler, R.W. Capacity and throughput of urban air mobility vertiports with a first-come, first-served vertiport scheduling algorithm. In Proceedings of the AIAA Aviation 2020 Forum, Virtual Event, 15–19 June 2020; p. 2903. [Google Scholar] [CrossRef]
- Hagag, N.; Gasche, S.; Jäger, F.; Kallies, C. Energy Demand Analysis for eVTOLs in Cluttered and Dynamic Environments based on Adaptive Trajectory Prediction. In Proceedings of the 2024 Integrated Communications, Navigation and Surveillance Conference (ICNS), Herndon, VA, USA, 23–25 April 2024; IEEE: Piscataway, NJ, USA, 2024; pp. 1–15. [Google Scholar] [CrossRef]
- FRAPORT. Departures and Arrivals at the Frankfurt Airport. Available online: https://www.fraport.com/de/konzern/ueber-uns/zahlen--daten-und-fakten1.html (accessed on 6 February 2025).
- Pertz, J.; Lütjens, K.; Gollnick, V. Evaluation of Business Travel as a Potential Customer Field of a local AAM Market, In Proceedings of the 26th Air Transport Research Society World Conference, Kobe, Japan, 1–7 July 2023; Elsevier: Amsterdam, The Netherlands, 2023. Available online: https://elib.dlr.de/196084/1/114_Pertz.pdf (accessed on 5 June 2025).
- Pertz, J.; Niklaß, M.; Swaid, M.; Gollnick, V.; Kopera, S.; Schunck, K.; Baur, S. Estimating the Economic Viability of Advanced Air Mobility Use Cases: Towards the Slope of Enlightenment. Drones 2023, 7, 75. [Google Scholar] [CrossRef]
| Disclaimer/Publisher’s Note: The statements, opinions and data contained in all publications are solely those of the individual author(s) and contributor(s) and not of MDPI and/or the editor(s). MDPI and/or the editor(s) disclaim responsibility for any injury to people or property resulting from any ideas, methods, instructions or products referred to in the content. |
© 2025 by the authors. Licensee MDPI, Basel, Switzerland. This article is an open access article distributed under the terms and conditions of the Creative Commons Attribution (CC BY) license (https://creativecommons.org/licenses/by/4.0/).


