Abstract
The aerodynamic performance of nacelle inlets under crosswind conditions is crucial for engine stability and efficiency. Current parametric investigations are predominantly focused on cruise operations, with minimal consideration given to crosswind conditions. This study employs an iCST-based parametric modeling approach to construct geometric models. A systematic examination of key geometric parameters—including the throat axial location, fan face radius, and leading-edge radii of the inner and outer contours is conducted. The reliability of the numerical methodology was established through a two-step validation process using both the iCST-generated non-axisymmetric model and the DLR-F6 benchmark model, followed by a geometric sensitivity analysis based on parametrically generated axisymmetric models. The results demonstrate that the inner contour leading-edge radius (ROC_I/R_hi) has the most substantial influence on flow separation. When ROC_I/R_hi decreases from 7.84% to 3.46%, the peak maximum circumferential total pressure distortion index (IDCmax) is increased by 86.78% with a 53.85% rearward shift in the complete reattachment mass flow rate. Correspondingly, a similar reduction in the outer contour leading-edge radius (ROC_O/R_hi) from 9.38% to 4.69% results in a 55.50% increase in peak IDCmax and a 33.33% rearward shift. Comparatively, the fan face radius shows minimal impact on flow distortion (increases by 9.72%), but more pronounced effects on total pressure recovery, while rearward movement of the throat axial location (35.00% to 69.00%) causes a 30.03% rise in IDCmax and 43.75% complete flow reattachment delay. It is concluded that the leading-edge optimization is crucial for crosswind resilience, with the inner contour geometry being particularly influential, providing parametric foundations for robust inlet design across a wide range of operating regimes. In addition, it is also found that the effects of Reynolds number (Re) lie in two folds: (1) For a fixed model scale, the aerodynamic performance of the inlet suffers a remarkable degradation with rapidly rising IDCmax as the crosswind velocity-based Re is increased to cause significant flow separations. (2) For a fixed crosswind velocity, the peak IDCmax progressively decreases with the increasing scale based Re, while σ exhibits an overall enhancement as Re rises.
1. Introduction
The nacelle inlet is a crucial component of civil aircraft engines, responsible for delivering a uniform and stable flow into the engine. Since cruise conditions account for the majority of flight mission profiles, nacelle design is typically optimized at this design point to achieve a high drag reduction efficiency, thereby significantly reducing fuel consumption and enhancing economic performance. However, while prioritizing cruise performance, the inlet must also ensure adequate engine operating margins under various off-design conditions, such as ground operation, angle of attack, crosswind, and wind shear. Among these, ground crosswind is a prevalent off-design factor that can induce flow separation within the nacelle inlet, resulting in total pressure distortion. Aviation regulatory standards, including FAR Part 25 [1] and CCAR-25-R4 [2], explicitly mandate aircraft safe operation under crosswind conditions of 20 knots (not exceeding 25 knots), underscoring the critical need to investigate their impacts on nacelle inlet performance.
Previous studies have provided valuable but conflicting findings regarding the aerodynamic effects of crosswind on nacelle inlets. In the 1990s, the collaborative Lara nacelle inlet project [3] employing Hybrid Laminar Flow technology demonstrated through ONERA F1 wind tunnel tests that under 90° crosswind conditions (28–35 knots), total pressure distortion exhibits a distinctive three-stage variation with increasing mass flow: initial growth, sharp decline, and subsequent rapid recovery. Significantly, complete flow reattachment with nearly eliminated distortion was observed within a specific mass flow range—a phenomenon exhibiting enhanced stability at elevated crosswind intensities [4]. Subsequent studies have further illustrated these complexities. Colin [5,6,7] systematically evaluated turbulence models and simulation approaches for predicting separation and complete reattachment, though none were proven entirely satisfactory. Zhang [8] observed similar reattachment behavior while accounting for ground effects, whereas Nichols [9] reported fully stalled conditions without reattachment; Tourrette [10] and Kokubo [11] presented fundamentally opposite trends in distortion development. These inconsistent results demonstrate the pronounced sensitivity of flow phenomena to nacelle geometry while exposing knowledge gaps in geometric parameter influences. The absence of separation zone disappearance in the authors’ preliminary simulations of NACA-1-85-100 and DLR inlets further substantiates the decisive role of geometric design.
During ground operations, aircraft may be subject to ground effect [8,12,13,14,15], creating a methodological divergence in nacelle crosswind research regarding the treatment of ground influence. Although ground effect can alter flow characteristics through mechanisms such as ground vortex formation, the coupled interaction between ground and crosswind effects proves challenging to quantify. To maintain focus on the fundamental crosswind mechanisms, this study deliberately excludes consideration of ground effect. Within this established methodological framework, it is essential to examine the predominant technical approaches currently employed to address crosswind-induced flow separation.
Current flow control strategies have evolved along two primary directions: first, active control techniques including plasma actuation and steady/oscillating jets [9,16,17]; second, aerodynamic configuration optimization approaches, such as Zhang’s [18] auxiliary inlet design for submerged inlets and Zhao’s [19] investigation of tube-and-wing-body parameters, which enhance inherent separation resistance. Comparatively, developing separation-resistant nacelle configurations through aerodynamic design from the conceptual stage represents a fundamentally superior solution. However, achieving this objective requires first overcoming the prominent deficiency in current parametric studies regarding crosswind conditions.
Despite significant advances in nacelle parameterization research, existing efforts demonstrate a pronounced bias toward cruise conditions. Investigations by Burley [20] on hub location and internal contraction ratio, Younghans [21] on cowl geometry, Qi [22] on super-elliptic lip parameters, and Wei’s [23] multi-condition analysis of leading-edge radius effects have failed to address crosswind operations systematically. Notably, this research gap is intrinsically linked to the limitations of conventional parameterization methods. Super-elliptic equations and polynomial functions often fail to ensure surface curvature continuity, thereby imposing fundamental constraints on geometric exploration.
To address these limitations, this study employs the Class Shape Transformation (CST) method developed by Kulfan [24] and its enhanced intuitive variant (iCST) [25,26]. This approach integrates class and shape functions to ensure curvature continuity while explicitly linking design variables to geometric constraints. Compared to parameterization methods employed in Qi [22] and Wei [23]’s studies, iCST demonstrates superior geometric control precision and surface smoothness. The methodology has been successfully extended by Tejero [27] for non-axisymmetric nacelle construction.
In summary, the relationship between mass flow and distortion under crosswind conditions remains unclear, and previous parametric studies have largely overlooked crosswind operations. This study systematically addresses these research gaps, with the primary objective of quantifying the effects of key geometric parameters—specifically throat axial location, fan face radius, and lip leading-edge radius—on nacelle inlet performance under crosswind-induced flow separation conditions. To this end, the iCST parameterization method was employed to develop a parametric nacelle model, enabling precise geometric control and smooth surface continuity. Through numerical simulations investigating crosswind effects across 0–35 knot velocities, the coupled interactions between engine suction (mass flow) and crosswind influences were analyzed, with particular focus on assessing the impacts of Reynolds number and the key geometric parameters at the maximum regulatory crosswind velocity (25 knots) specified in airworthiness standards. This research aims to determine the influence of geometric parameters on nacelle inlet performance under crosswind flow separation conditions and provide validated design insights for developing robust nacelle inlets that maintain performance compliance with airworthiness requirements across both design and off-design operating regimes.
2. Research Object and Methodology
This study employs the iCST method to construct geometric models, subsequently conducting grid independence verification and validation of the simulation methodology. For validation of the simulation approach, non-axisymmetric parametric models were generated to demonstrate methodological reliability, using the DLR-F6 benchmark model to validate the turbulence model and discretization scheme. To ensure the generality of the research conclusions, axisymmetric models constructed using parametric methods were employed in this study. The investigation began with an examination of Reynolds number effects induced by crosswind velocity and model scale, then proceeded to a parametric analysis of key geometric features, including the throat axial location, fan face radius, and leading-edge radii of both inner and outer contours. The research workflow is schematically illustrated in Figure 1, while detailed operating conditions are comprehensively documented in Appendix A.1.
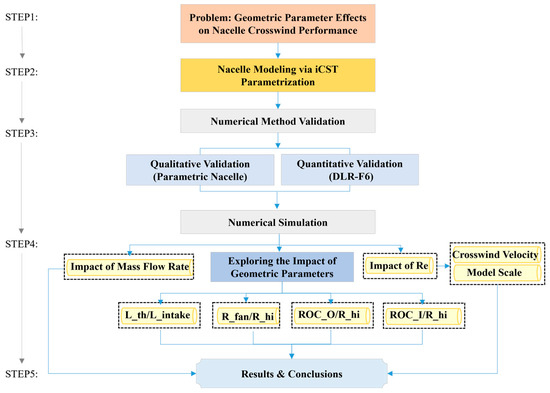
Figure 1.
Research methodology flowchart.
2.1. Nacelle Parameterization Method
With reference to [26], this study employs the iCST parameterization method to reconstruct the lower section of the LARA nacelle inlet, thereby generating an axisymmetric nacelle model. The CST parameterization method describes the geometric profile through the product of a shape function and a class function , with the endpoint further modified by the term , Where denotes the radial offset from the trailing edge to the leading-edge point.
The class function defines the fundamental profile of the curve, where the exponents and determine the geometric characteristics at the start and end points. For shapes such as nacelles and airfoils, which typically feature a rounded leading edge and a tapered trailing edge, the values are conventionally set to and .
The shape function provides precise control over the contour’s detailed geometry. The coefficients govern the local shape characteristics of the curve, while represents the Bernstein polynomial basis. The shape function critically determines both the fitting accuracy and the complexity of the curve representation.
Christie [26] proposed seven key constraints for nacelle outer contour design: the leading-edge radius of curvature (ROC_O), the highlight-plane radius (R_hi), the radial coordinate at the maximum thickness location (R_m), the axial location of the maximum thickness (L_m), the trailing-edge radial coordinate (R_te), the axial tangential angle at the trailing edge relative to the engine axis (β_o), and the nacelle length (L_nac). A schematic of these parameters is provided in Figure 2. These seven constraints collectively determine the order and the coefficients of the shape function. The internal contour was constructed using the same method.
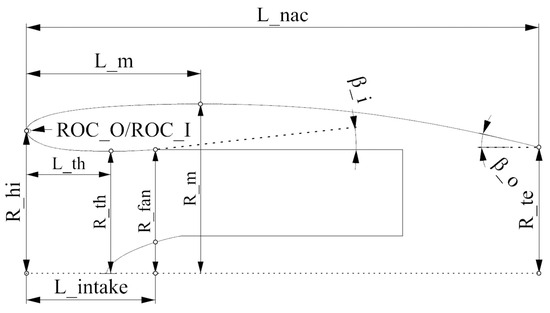
Figure 2.
Geometric parameter definition of the nacelle.
Direct application of these key geometric parameters as inputs to reconstruct the lower section of the experimental LARA nacelle model resulted in significant deviations between the parameterized contour and the original geometry. Therefore, while keeping the nacelle length (L_nac) and the trailing-edge tangential angle (β_o) constant, an iterative process was employed to minimize the distance error primarily over the forward nacelle segment. This process adjusted the key parameters until the parameterized profile achieved the closest possible agreement with the original geometry. The final values of the key parameters for the nacelle contour are listed in Table 1. This study employs the super-elliptic equation to parameterize the centerbody. However, the influence of the centerbody shape and its axial location on nacelle flow separation and reattachment characteristics is not involved. The centerbody parameters are fixed to and .

Table 1.
Geometric parameters of the baseline inlet configuration.
2.2. Numerical Methods and Setup
The computational domain is modeled after the ONERA F1 wind tunnel, with the nacelle vertically mounted on the tunnel wall. The test section measures 11 m × 4.5 m × 3.5 m (length L × width W × height H). The boundary conditions were configured with reference to [5,6,7]. The wind tunnel inlet is configured as a velocity inlet, while the wind tunnel outlet is designated as a pressure outlet. The wind tunnel walls are treated as adiabatic free-slip walls. Both the nacelle wall and the centerbody wall are specified as adiabatic no-slip walls. To facilitate mass flow regulation, the nacelle outlet was configured as a pressure outlet with a specified target mass flow rate, where the outlet pressure automatically adjusts to achieve the desired mass flow [28]. To assess the impact of the initially specified pressure on both distortion and mass flow, a sensitivity analysis was conducted, as detailed in Appendix A.2. The configuration of the boundary conditions is illustrated in Figure 3.
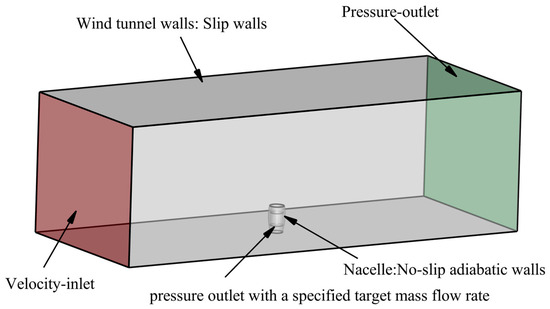
Figure 3.
Configuration of the computational domain.
The computational model was discretized using structured grids generated with Pointwise. The flow field around the nacelle was computed using the commercial software ANSYS Fluent 2022 by solving the Reynolds-Averaged Navier–Stokes (RANS) equations. During the computational process, the distortion index IDCmax was monitored until full convergence was achieved, with a convergence criterion of less than 1% variation in IDCmax, as shown in Figure A1. Detailed CFD setup parameters are provided in Table 2.
Table 2.
CFD setups for the simulations.
The k-ω SST turbulence model was employed in this numerical investigation, which has been extensively adopted not only for external flow predictions [29,30,31,32,33] but has also gained significant preference in internal flow studies of inlets [34,35,36]. Due to its superior predictive capabilities for flow separation across subsonic, transonic, and supersonic regimes, it has become one of the most widely utilized turbulence models in the aerospace field.
The accuracy and reliability of k-ω SST model predictions are contingent upon strict grid resolution requirements. The grid parameters implemented in this study are detailed in Table 2. Higher flow velocities necessitate reduced first-layer grid heights, making the 35-knot crosswind condition at 15 kg/s mass flow rate the most stringent case for grid design. Figure 4 presents the y+ distribution for this operational condition, confirming compliance with the k-ω SST model’s near-wall resolution requirements.
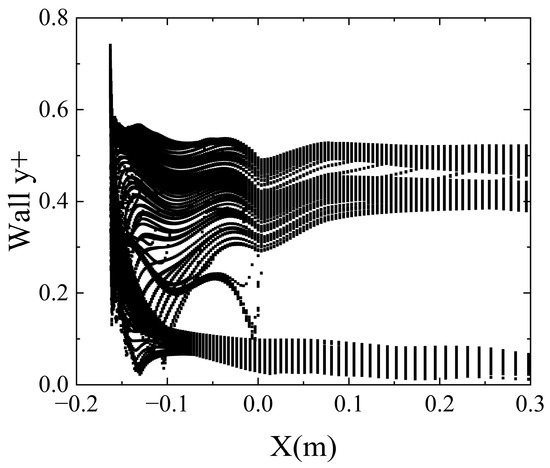
Figure 4.
Distribution of the wall y+ (Vc = 35 kt, qm = 15 kg/s).
2.3. Definition of Nacelle Performance Parameters
The total pressure recovery coefficient (σ) is utilized to quantify the degree of total pressure loss after the airflow passes through the inlet. It is defined by the following formula:
where denotes the area-averaged total pressure at the Aerodynamic Interface Plane (AIP) and represents the free-stream total pressure.
The maximum circumferential total pressure distortion index (IDCmax) is employed to quantify the non-uniformity of the total pressure distribution. The formula for calculating IDCmax is defined as follows:
where is the area-averaged total pressure at the AIP, denotes the ring-averaged total pressure of the **-th ring, represents the minimum total pressure within the **-th ring, and is the number of probe rings. The arrangement of the AIP total pressure probes follows the SAE ARP1420 standard [37], distributed in equal-area rings. The total pressure rake consists of five rings and eight radial arms, with each arm spaced at 45-degree intervals. The probe configuration is illustrated in Figure 5.
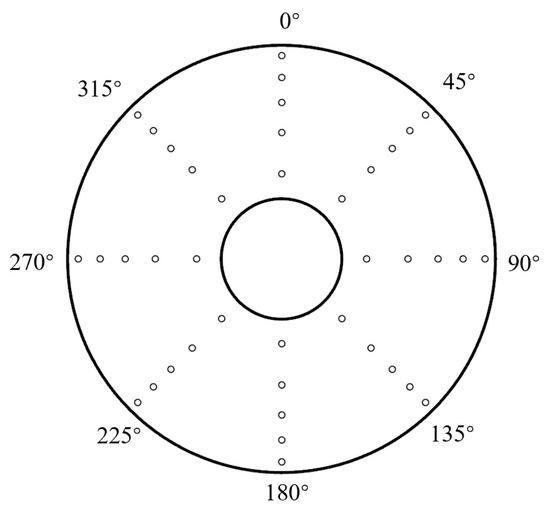
Figure 5.
Schematic of the AIP total pressure rake.
2.4. Validation of the Computational Method
2.4.1. Mesh Independence Examination
Three sets of computational grids with approximately 3.5 million, 8.58 million, and 12.52 million elements were generated. Since flow separation primarily originates in the lip region, mesh refinement was applied in this area to better resolve the separation phenomenon, as shown in Figure 6. One of the primary focuses of this study is the performance degradation of the nacelle inlet resulting from internal flow separation induced by crosswind. To accurately capture this complex flow phenomenon, a low-mass-flow, high-separation operating condition was selected for grid independence verification. The specific values of the total pressure recovery coefficient (σ), total pressure distortion index (IDCmax), and the corresponding relative error [38] for each mesh configuration are summarized in Table 3.
where and represent the converged variables obtained from the fine mesh and coarse mesh of two successively refined grid configurations, respectively.
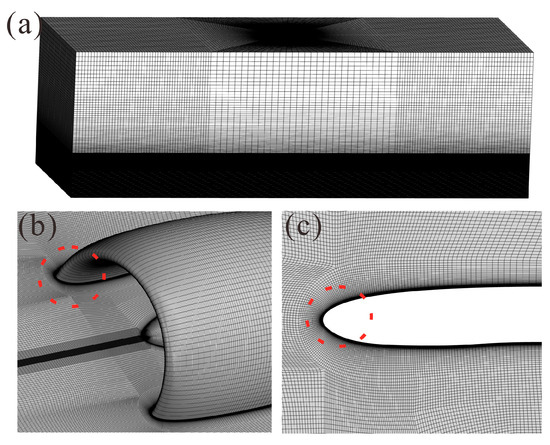
Figure 6.
Computational mesh of the nacelle: (a) overall mesh; (b) mesh near the nacelle; (c) mesh near the lip (indicated by the red circle).
Table 3.
Variation in nacelle performance with grid resolution.
It can be observed that once the grid size reaches 8.58 million elements, both the total pressure recovery coefficient and the total pressure distortion index exhibit negligible changes with further mesh refinement. As shown in Figure 7 at a grid size of 3.5 million elements, a localized high-speed region (indicated by the red circle) exists within the nacelle passage; however, this anomalous flow phenomenon essentially disappears when the grid count increases to 8.58 million. This confirms that the numerical results have achieved grid independence. This indicates that the numerical results have achieved grid independence. To minimize computational mesh influence, all models in the parametric study maintain a consistent mesh density of approximately 8.58 million elements and identical nodal topology, as shown in Figure 6.
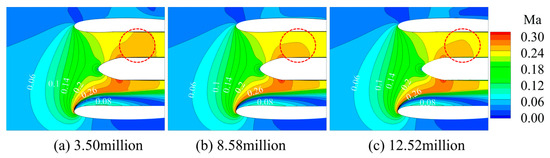
Figure 7.
Influence of grid resolution on nacelle flow field.
2.4.2. Validation of Numerical Method
Although extensive experimental research has been carried out on nacelle performance in crosswind conditions, the scarcity of publicly accessible test models hinders the validation of numerical approaches. To verify the reliability of the numerical approach employed in this study, the parametric method described in Section 2.1 was applied to the upper, side, and lower sections of the Lara inlet. After parameterizing these three profiles, interpolation was performed between adjacent profiles to generate sections at various circumferential positions. Finally, a three-dimensional non-axisymmetric nacelle was constructed using surface modeling techniques (see Appendix A.3 for detailed implementation). It should be noted that the nacelle model generated through this approach only approximates the original geometry, in general, configuration. This 3D non-axisymmetric nacelle model was used for method validation. As shown in Figure 8, while certain deviations exist between the numerical simulation results and experimental data, the overall trends show consistency. Discrepancies between the simulation results and experimental data are provided in Table A1 and Table A2, with the root mean square error (RMSE) calculated to be 3.18. Note that the mass flow rate shown in this figure has been corrected to be consistent with the reference for the full-scale inlet. This demonstrates that the numerical simulation method adopted in this study provides credible qualitative descriptions.
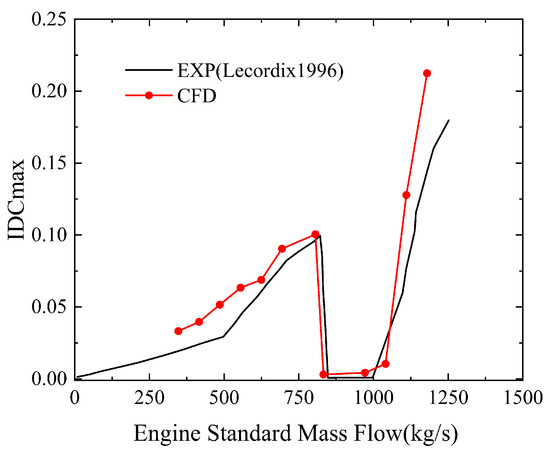
Figure 8.
Validation of numerical results with experimental data [3].
Since the 3D non-axisymmetric models generated by the parametric methodology may exhibit inherent variations, the aforementioned validation only demonstrates the accuracy of the model parameters in trend prediction. To further validate the reliability of the methodology, a more rigorous validation is conducted for the computational model employed in this study, utilizing the DLR-F6 benchmark model and its corresponding experimental data [31,32]. The computational conditions were set with a freestream Mach number of 0.72, freestream pressure of 132,778 Pa, freestream temperature of 305 K, and angle of attack of 1.003°. Figure 9 and Figure 10 present the computational results, comparing the pressure distribution at the wing spanwise location of 0.239. The CFD results demonstrate excellent agreement with experimental data, accurately capturing the shock wave location. Based on the comprehensive validation, the CFD methodology employed in this study is confirmed to exhibit high reliability.
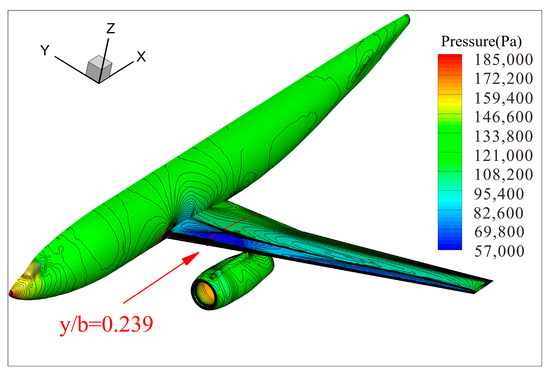
Figure 9.
CFD results for the DLR-F6 model.
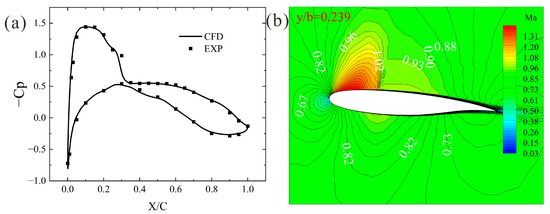
Figure 10.
(a) Pressure distribution at the wing spanwise location of 0.239 [31], (b) Mach number distribution at the wing spanwise location of 0.239.
3. Results and Discussion
3.1. Basic Crosswind Distortion Characteristics
An analysis of the basic flow characteristics of the nacelle inlet under crosswind conditions is first conducted. Figure 11 shows the contour plot of the total pressure recovery coefficient of the nacelle under crosswind conditions, along with the definitions of the line1 to line5 sections. It is seen that the total pressure is mostly lost at the windward side of the crosswind. Figure 12 presents Mach number contours at cross-sections line1 to line5 at three different crosswind velocities. In the absence of crosswind, the internal flow within the nacelle exhibits a well-defined symmetric distribution. The streamtube contracts sharply from the far field to the lip plane, with the airflow accelerating gradually and reaching its maximum velocity near the lip region. Subsequently, the flow decelerates slightly due to the adverse pressure gradient, ultimately passing uniformly through the AIP without any flow separation.
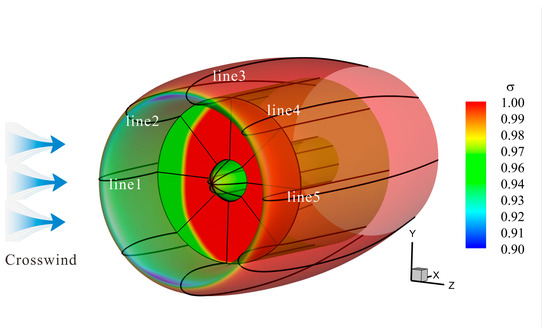
Figure 11.
Schematic of different circumferential sections (qm = 6 kg/s, Vc = 25 kt).
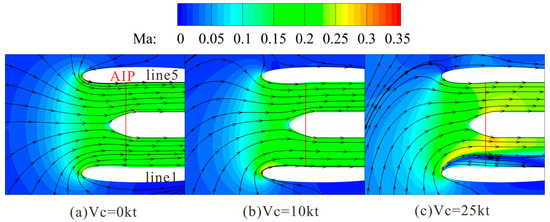
Figure 12.
Mach number contours at line1–line5 section under different crosswind velocities (qm = 6 kg/s).
When a crosswind is present, the streamtube deflects toward the windward side. The degree of deflection increases with higher crosswind velocities. Due to the crosswind effect, the flow acceleration at the lip in the line1 section becomes more pronounced. Conversely, the high-speed region near the lip in the line5 section gradually diminishes under crosswind influence. At a crosswind velocity of 10 knots, no flow separation is observed inside the inlet, and the flow remains relatively uniform. However, when the crosswind velocity reaches 25 knots, a separation zone emerges in the line1 section, extending from the leading edge toward the AIP. The reattachment point is located downstream of the AIP. The presence of this separation zone reduces the effective flow area of the nacelle. Consequently, under the same mass flow rate, the flow acceleration in the line1 section intensifies, disrupting the originally uniform flow.
As observed from the static pressure variation at the line1 section in Figure 13, in the absence of crosswind, the airflow experiences significant favorable pressure gradients followed by adverse pressure gradients as it passes around the lip. On the outer surface of the leading edge, the flow rapidly accelerates to its maximum velocity under the favorable pressure gradient, then decelerates abruptly due to the adverse pressure gradient on the inner surface. Although the adverse pressure gradient on the inner surface is substantial, the flow remains attached. Under crosswind conditions, the adverse pressure gradient on the inner lip surface intensifies. At a crosswind velocity of 25 knots, the pressure change near the leading edge becomes nearly vertical, indicating an extremely strong adverse pressure gradient that triggers flow separation at the leading edge.
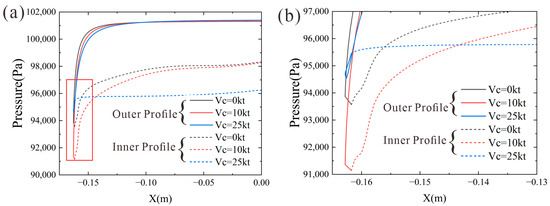
Figure 13.
(a) Effect of crosswind velocity on pressure distribution at line1 section; (b) Close-up view of the boxed region in (a).
Under crosswind-free conditions, the pressure distributions along line1–line5 should coincide due to the axisymmetric nature of the model. Therefore, the pressure distribution under crosswind-free conditions (line, Vc = 0 kt) is compared with that under crosswind conditions (line1–line5) to analyze the influence of crosswind on pressure distribution across different circumferential sections, as shown in Figure 14. Comparing with the pressure distribution under crosswind-free conditions, the introduction of crosswind attenuates the adverse pressure gradient originally present along line4 and line5. On line5, the pressure effect even shifts from adverse to favorable. Conversely, the adverse pressure gradient intensifies on line1 to line3 under crosswind influence. The impact of crosswind on the pressure distribution varies significantly across different circumferential sections of the nacelle. Consequently, as seen in Figure 14, flow separation occurs on line1 and line2, while line3 to line5 remain attached. Among the five sections, line1 experiences the most severe exacerbation of adverse pressure gradient under crosswind effects.
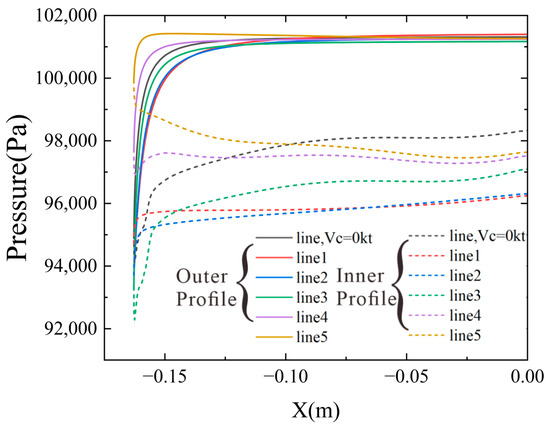
Figure 14.
Static pressure variation at different circumferential sections (qm = 6 kg/s, Vc = 25 kt).
3.2. Influence of Mass Flow Rate
At a fixed crosswind velocity of 25 knots, the mass flow rate through the nacelle was varied to analyze the coupling effects of engine suction and crosswind on the flow field. The mass flow rate ranged from 5 to 15 kg/s. At lower mass flow rates, the entire flow field remained subsonic, while at higher mass flow rates, localized supersonic regions emerged. Figure 15 illustrates the evolution of the nacelle flow field with increasing mass flow rates. The pressure distribution along line1 for three selected mass flow conditions is plotted in Figure 16.
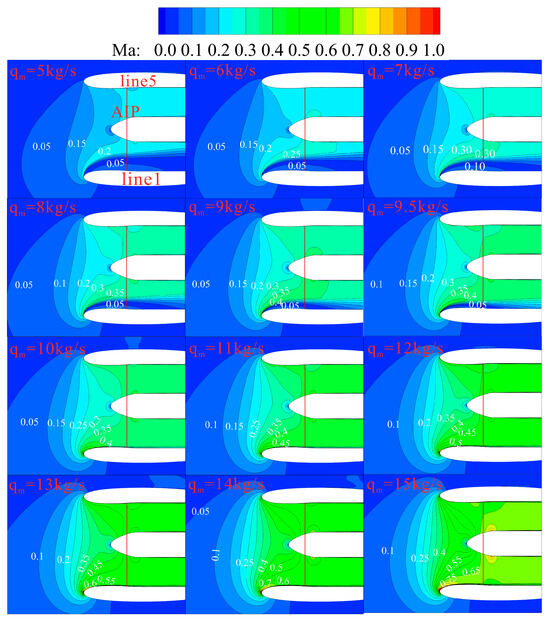
Figure 15.
Evolution of the flow field at line1-line5 section with varying mass flow rate (Vc = 25 kt).
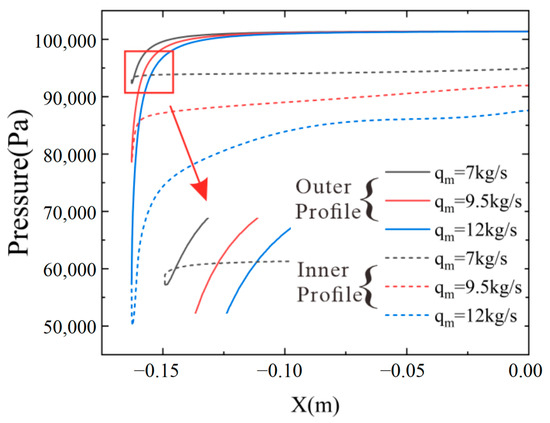
Figure 16.
Effect of mass flow rate on pressure distribution at line1 section (Vc = 25 kt).
Within the mass flow range of 5 to 9.5 kg/s, the combined effects of crosswind and the strong adverse pressure gradient at the lip leading edge of line1 (as shown in Figure 15 and Figure 16) induced flow separation originating from the leading edge. As the mass flow rate increased further to 10 kg/s, the separation zone disappeared. Beyond this critical mass flow rate, the flow maintained relative uniformity with further increases in mass flow rate. At 15 kg/s, a minimal separation zone was observed near the leading edge of line1, though it was not prominent. Analysis of Figure 16 reveals that as the mass flow rate increases, the flow acceleration around the outer lip surface at line 1 under the favorable pressure gradient intensifies, leading to a significant reduction in the wall static pressure. Along the inner contour, after transitioning through the favorable pressure gradient near the leading edge, the flow encounters a pronounced adverse pressure gradient region. The magnitude of this adverse pressure gradient gradually decreases with increasing mass flow rate. Consequently, the adverse pressure effect on line1 diminishes, resulting in the disappearance of the separation zone at 10 kg/s.
To quantitatively analyze the coupled effects of crosswind and engine suction, the variations in the total pressure recovery coefficient (σ) and the distortion index (IDCmax) with mass flow rate are plotted in Figure 17. In the absence of crosswind, IDCmax remains close to zero. However, the situation changes substantially as crosswind is introduced. Under the crosswind condition, as the mass flow increases from the lowest level studied, the intensity of the separation zone initially strengthens (as observed in Figure 15), causing IDCmax to rise. Subsequently, due to the enhanced favorable pressure gradient induced by higher mass flow rates, the flow reattaches and the separation zone dissipates, leading to a rapid decrease in distortion. Since no further separation occurs beyond this reattachment point, the distortion level remains low. The mass flow rate at which the distortion drops sharply divides the variation into two distinct phases: one in which the distortion increases gradually with mass flow rate, and the other in which the distortion remains at a low level despite increasing mass flow rates. As evidenced by Figure 15 and Figure 17, the IDCmax effectively reflects the flow separation characteristics within the nacelle. A sharp decrease in IDCmax indicates the complete disappearance of internal flow separation and the establishment of complete reattached flow conditions.
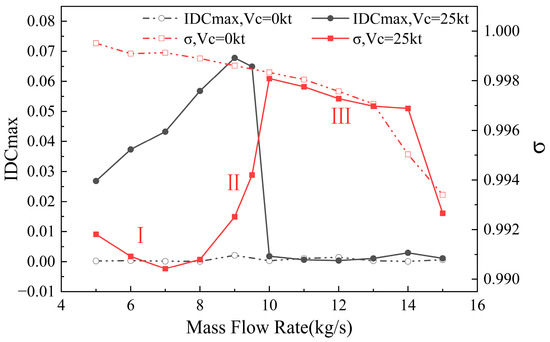
Figure 17.
Variation in IDCmax and σ with mass flow rate.
For the total pressure recovery coefficient, in the absence of crosswind, it decreases gradually with increasing mass flow rates due to the heightened total pressure loss caused by intensified boundary layer effects near the wall. Under crosswind conditions, the variation in the recovery coefficient exhibits three phases: in Phase I, the strength of the separation zone increases with mass flow, resulting in greater total pressure loss and a decline in the recovery coefficient. In Phase II, although the low-pressure zone intensifies, the shrinkage of the separation zone due to higher mass flow rates (as shown in Figure 15) ultimately leads to a rebound in the total pressure recovery coefficient. In Phase III, the total pressure recovery coefficient exhibits a renewed decline. This behavior stems primarily from intensified boundary layer effects at high mass flow rates, which increase total pressure loss, as well as potential flow separation triggered by localized supersonic regions at even higher mass flow conditions.
3.3. Influence of Reynolds Number
The Reynolds number is defined as
where is the air density, is the crosswind velocity, is the highlight diameter of the nacelle inlet, namely , is the dynamic viscosity of air.
Since the model scaling effect is involved in this study, the performance of the nacelle can not be compared if the mass flow rate of each scaled model is not corrected. Therefore, the concept of mass flow rate density is used, which is defined as the mass flow rate per area, namely, , where is the area of the AIP, is the mass flow rate of the nacelle inlet through the AIP.
The Reynolds number is related to both velocity and model scale. First, the mass flow rate of kg/s ( kg/(s·m2)) is focused on to analyze the effect of Reynolds number by changing the crosswind velocity and fixing the model scale. The computational operating condition is shown in Table 4, and the results are shown in Figure 18 and Figure 19. Five crosswind velocity values were studied, as shown in Table 5, and the results are shown in Figure 20 and Figure 21. Finally, the Reynolds number effect with respect to the three model scales was analyzed, whose operating conditions are shown in Table 6, and the results are shown in Figure 22.
Table 4.
Computational conditions for crosswind velocity-based Reynolds number effect analysis at the mass flow rate density of 77.95 kg/(s·m2).
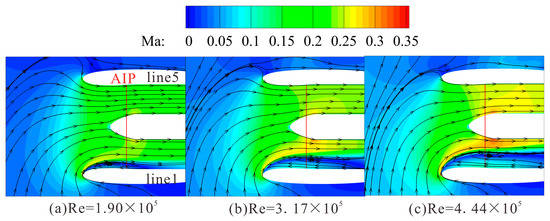
Figure 18.
Mach number distribution at the line1–line5 section under different Reynolds numbers at the mass flow rate density of 77.95 kg/(s·m2).
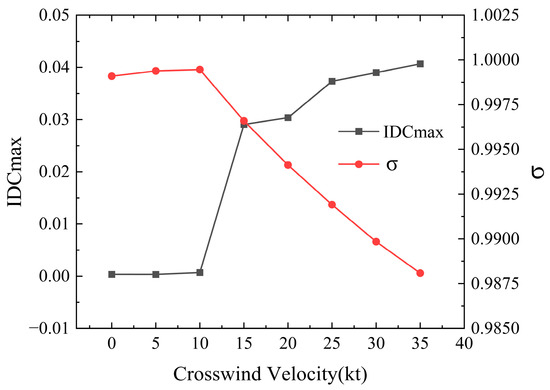
Figure 19.
Variation in IDCmax and σ under different Reynolds numbers at the mass flow rate density of 77.95 kg/(s·m2).
Table 5.
Computational conditions for crosswind velocity-based Reynolds number effect analysis at various mass flow rate densities.
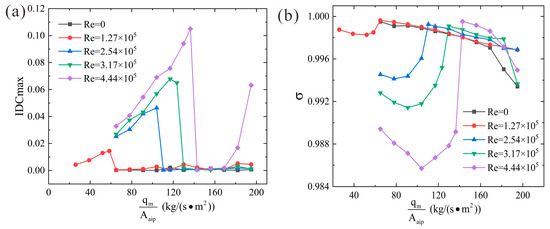
Figure 20.
Influence of Re on nacelle performance at various mass flow rate densities; (a) IDCmax; (b) .
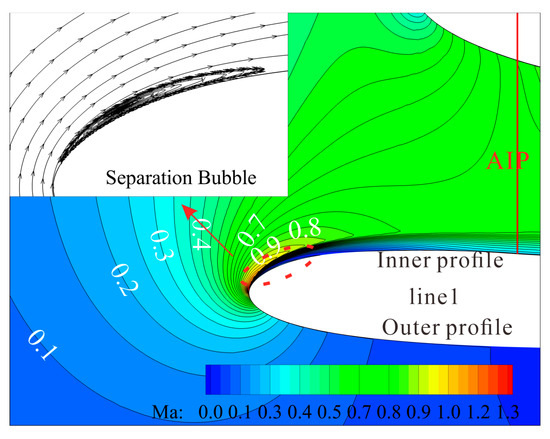
Figure 21.
Mach number contours and separation bubble at line1–line5 section (
= 194.87 kg/(s·m2), Re = ).
Table 6.
Computational conditions for model scale-based Reynolds number effect analysis.
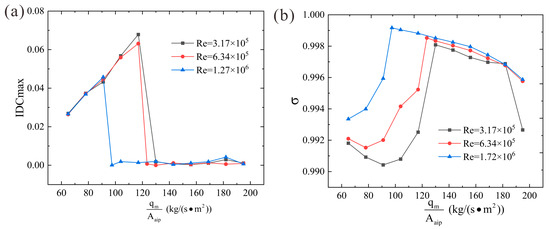
Figure 22.
Influence of model scale-based Re on nacelle performance at various mass flow rate densities; (a) IDCmax; (b) .
The analysis of the Reynolds number effects was first conducted at a mass flow rate density of 77.95 kg/(s·m2). By fixing the mass flow rate density at 77.95 kg/(s·m2) and varying the Re (based on varying crosswind velocity), the impact of Re on the inlet performance was analyzed. Based on the observations from Figure 18, Based on Figure 18, an adverse pressure gradient persists even at the lowest Reynolds number, inducing flow separation within the nacelle inlet. This separation zone continues to expand as the Re increases. This separation zone continues to expand as the Re increases. Due to the separation caused by crosswind, the effective flow area of the nacelle decreases, which becomes more pronounced with higher crosswind velocities. To adapt to the required mass flow rate at the outlet, the Mach number within the nacelle passage increases with the rising crosswind velocity, particularly more evidently on the separation side.
From Figure 19, it can be observed that at Re ranging from 0 to , no separation occurs inside the nacelle, resulting in low distortion. Beyond this range, however, separation emerges, leading to a rapid increase in distortion. As the Re continues to rise, distortion also shows an increasing trend. Conversely, the total pressure recovery coefficient remains relatively stable when no separation is present, but decreases with increasing Re once separation occurs. In the previous analysis of the influence of mass flow rate, it was noted that distortion drops sharply at a certain mass flow rate. Combined with the observations in Figure 20a, the IDCmax initially increases with mass flow rate density, then decreases rapidly, and finally stabilizes within a certain mass flow density range under crosswind conditions. This indicates that the low-distortion Re range (0–1.72 × 10⁵) in Figure 19 corresponds to the completely reattached flow regime shown in Figure 20a.
As observed in Figure 20a, under crosswind conditions, the peak distortion index IDCmax may occur at two distinct mass flow rate density points, one at which immediately before the rapid decline in distortion, and the other where local supersonic induced separation. For Re = , these correspond to mass flow rate densities of 136.41 kg/(s·m2) and 194.87 kg/(s·m2), respectively. The magnitude of the distortion peak and its corresponding mass flow position are closely related to the Re. As the Re increases, the distortion peak rises progressively, and its associated mass flow position shifts toward higher levels. When the Re increases from to kt, the peak IDCmax rises from 0.0145 to 0.1050, representing an increase of 624.14%, while the complete flow reattachment mass flow rate shifts rearward from 64.96 kg/(s·m2) to 142.91 kg/(s·m2), corresponding to a 120.00% delay. These results clearly demonstrate the substantial impact of Re (based on varying crosswind velocity) on nacelle performance.
Now, explain the increase in both the peak IDCmax and the complete reattachment flow rate with increasing Re in Figure 20. As shown in Figure 18, it is evident that higher crosswind velocities (Re) degrade the flow uniformity within the nacelle, manifesting as increased distortions at the AIP. The backward shift in the mass flow position of the distortion peak can be explained by the earlier analysis of the line1 section: an increase in crosswind velocity (Re) amplifies the adverse pressure gradient near the wall (as observed in Figure 13). Although this gradient diminishes with increasing mass flow rates (as observed in Figure 16), a higher mass flow rate is required to counteract the enhanced adverse pressure gradient caused by stronger crosswinds (higher Re). Consequently, the mass flow position corresponding to the distortion peak shifts backward as the crosswind velocity increases.
Upon closer examination of Figure 20a, it can be observed that at a Reynolds number of , the distortion shows an increasing trend at the largest mass flow rates. As shown in Figure 21, this is because the larger mass flow rate induces local supersonic flow near the lip of the line1 section, leading to the formation of a local separation bubble. The bubble dissipates the total pressure of the airflow and creates a low-pressure zone downstream, thereby disrupting the uniformity of the flow at the AIP and increasing distortion. Similar separation bubbles are observed under other high-mass-flow conditions, but their size is smaller and they do not develop into significant separation; consequently, their effects on distortion and the total pressure recovery coefficient are negligible.
As shown in Figure 20b, the total pressure recovery coefficient exhibits a consistent trend under increasing Re. It first decreases, then increases, and finally decreases again with rising mass flow rates. The recovery coefficient also displays a trough during this variation. The reasoning for the shift in its mass flow position is similar to that for the distortion. However, the recovery coefficient depends not only on the scope of the low-pressure zone at the AIP but also on its intensity. Therefore, the maximum distortion does not necessarily coincide with the minimum total pressure recovery coefficient. Specifically, the mass flow rate at which the recovery coefficient is minimized is generally lower than that at which the distortion is maximized.
The Re is influenced not only by crosswind velocity but also by model scale. An increase in model scale leads to a corresponding increase in Re. As observed in Figure 22, the peak IDCmax progressively decreases with increasing Re. Specifically, as Re increases from to , the peak distortion is reduced from 0.0678 to 0.0457, representing a 32.6% reduction. Furthermore, the complete reattachment mass flow rate shifts rearward from 97.44 kg/(s·m2) to 129.91 kg/(s·m2), corresponding to a 33.32% delay. Regarding the total pressure recovery coefficient, the entire performance curve exhibits an overall enhancement as Re rises.
Based on the preceding analysis, the variations in peak IDCmax and complete reattachment mass flow rate with increasing Re exhibit distinct patterns. Both crosswind velocity intensification and model scale enlargement contribute to Re growth, yet their aerodynamic consequences diverge fundamentally. For Re increases driven by crosswind velocity (10 kt to 35 kt), the peak distortion intensifies by 0.0905 with a rearward shift of 77.95 kg/(s·m2) in the complete reattachment mass flow rate. Conversely, the increase in Re through model scale (Dhi from 0.36 m to 1.44 m) reduces the peak distortion by 0.0221 and decreases the reattachment mass flow density by 32.47 kg/(s·m2). Similarly, the total pressure recovery coefficient exhibits opposite trends under these two mechanisms.
Quantitatively, the model scale effect dominates the Re modification—the Re increase from the dimensional expansions exceeds the crosswind-induced increment () by a factor of 4.42. However, aerodynamic sensitivity reveals an inverse hierarchy: crosswind velocity generates a 4.10 times greater change in peak distortion and a 2.40 times larger shift in reattachment flow than model scale, despite its smaller contribution to the Reynolds number. The underlying physics governing these opposing influences—and the disproportionate impact of crosswind velocity despite its modest Re number effect—remains unresolved and warrants further investigation.
3.4. Influence of Geometric Parameters
This section investigates the effects of four geometric parameters on the nacelle inlet performance under crosswind conditions, i.e., the axial location of the throat, the fan face radius, the leading-edge radius of the outer contour, and the leading-edge radius of the inner contour. Following the analysis of crosswind velocity and mass flow rate effects, the studied flow separation consistently originates near the lip leading edge. Consequently, the influence of the leading-edge radius is more pronounced than that of the throat axial location or the fan face radius.
3.4.1. Influence of Throat Axial Location
While keeping the other design parameters unchanged, three configurations were developed based on the baseline configuration by varying the axial location of the throat. The ratios of the throat axial location to the inlet length (L_th/L_intake) were set at 69.00%, 65.44%, 50%, and 35%, as illustrated in Figure 23. As the throat position moves toward the leading edge, the radius of curvature of the internal contour near the leading edge increases, resulting in the transition of the leading-edge profile from sharp to blunt. Additionally, slight modifications occur in the aft segment of the geometric contour. The total pressure recovery coefficient and IDCmax of the nacelle were calculated for each configuration under crosswind conditions of 25 knots across a mass flow rate range of 5–15 kg/s.
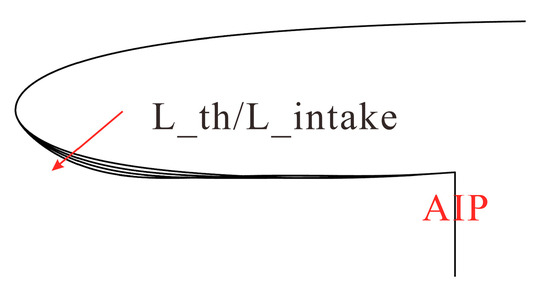
Figure 23.
Schematic of throat axial location variation, with the arrow indicating the direction of increase.
As observed in Figure 24, the wall pressure distribution along the internal contour exhibits significant variations. As the L_th/L_intake ratio decreases, the bluntness of the leading edge increases, thereby reducing the flow acceleration effect around the lip. Consequently, the peak pressure rises, and the pressure rise along the internal contour becomes more gradual, enabling the flow to better resist separation. For the configuration with L_th/L_intake = 35%, the forward shift in the throat location necessitates a non-monotonic expansion from the throat to the AIP to satisfy the curvature continuity requirement. Thus, after an initial rapid rise near the leading edge, the pressure shows a decreasing trend over a certain axial distance.
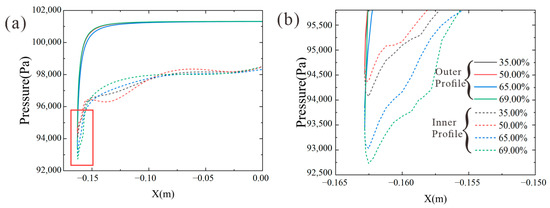
Figure 24.
(a) Influence of throat axial position (L_th/L_intake) variation on pressure distribution at line1 section(qm = 6 kg/s, Vc = 0 kt); (b) Close-up view of the boxed region in (a).
Overall, the forward shift in the throat location reduces the adverse pressure gradient near the leading edge of the internal contour. As shown in Figure 25a, this results in a decrease in the peak distortion and a forward shift in the corresponding mass flow rate. Meanwhile, Figure 25b indicates an overall improvement in the total pressure recovery coefficient. However, when the configurations operate under high-separation mass flow conditions (within the dashed box area), the distortion index IDCmax is largely unaffected by the axial location of the throat. Similarly, beyond the separation zone, the total pressure recovery coefficient remains nearly insensitive to the throat axial location over a certain mass flow range. When the throat axial location shifts from 35.00% to 69.00%, the maximum IDCmax increases from 0.0576 to 0.0749, representing a growth of 30.03%. Correspondingly, the complete reattached mass flow rate shifts rearward from 8 kg/s to 11.5 kg/s, with a mass flow rate shift magnitude of 43.75%. Regarding the total pressure recovery coefficient, all four configurations exhibit consistent variation trends: it initially decreases with increasing mass flow rate, then rises, and finally declines again with further mass flow rate increase. The underlying mechanisms have been analyzed in the mass flow rate analysis subsection. Furthermore, as L_th/L_intake increases from 35.00% to 65.44%, the total pressure recovery coefficient demonstrates a clear decreasing trend with the rearward shift in the throat axial location. However, when the ratio reaches 69.00%, the total pressure coefficient variation curve intersects with that of the 65.44% configuration near 8 kg/s, indicating that at identical mass flow rates, the total pressure recovery coefficient does not decrease monotonically with increasing L_th/L_intake.
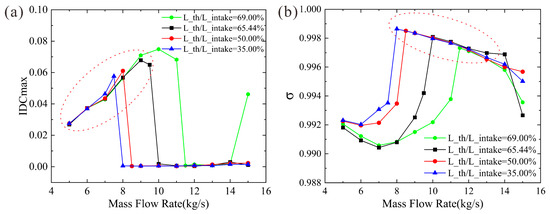
Figure 25.
(a) Influence of throat axial position on the IDCmax-mass flow rate relationship (Vc = 25 kts); (b) Influence of throat axial position on the σ-mass flow rate relationship (Vc = 25 kts). The red circles indicate regions where the performance is insensitive to geometric variations.
3.4.2. Influence of Fan Face Radius
Based on the configuration with L_th/L_intake = 35%, four variants were developed by varying the fan face radius, resulting in fan-to-highlight radius ratios (R_fan/R_hi) of 86.96%, 88.26%, 89.57%, and 90.87%. As shown in Figure 26, changes in the fan face radius primarily affect the diffuser section, with minor influences on the leading edge of the internal contour. An increase in the diffuser area ratio leads to higher pressure losses. The total pressure recovery coefficient and IDCmax of the nacelle were computed for each configuration under crosswind conditions of 25 knots across a mass flow rate range of 5–15 kg/s.
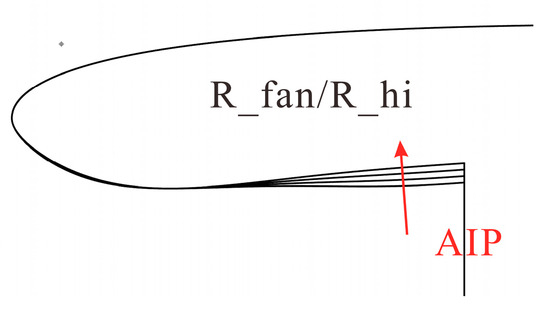
Figure 26.
Schematic of fan face radius variation, with the arrow indicating the direction of increase.
From the pressure distribution in Figure 27, fan face radius predominantly influences the pressure field in the aft segment of the inlet, with minimal impact near the leading edge. The pressure peak and pressure gradient at the leading edge remain largely unaffected by changes in the fan face radius ratio. As observed in Figure 28a, variations in R_fan/R_hi have a minimal effect on the distortion trend with mass flow rate. The mass flow rate for the disappearance of separation shifts backward by only 0.5 kg/s between configurations R_fan/R_hi = 88.26% and 89.57%, and their pressure peaks are nearly identical. Even when R_fan/R_hi increases to 90.87%, only a minimal rearward shift in this mass flow rate is observed, indicating that the pressure characteristics near the leading edge are insensitive to changes in fan face radius.
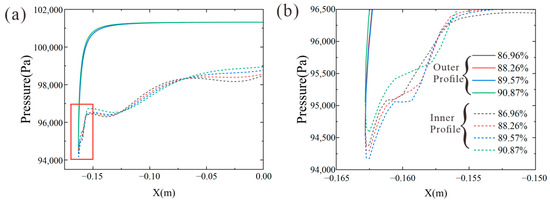
Figure 27.
(a) Influence of fan face radius (R_fan/R_hi) variation on pressure distribution at line1 section (qm = 6 kg/s, Vc = 0 kt); (b) Close-up view of the boxed region in (a).
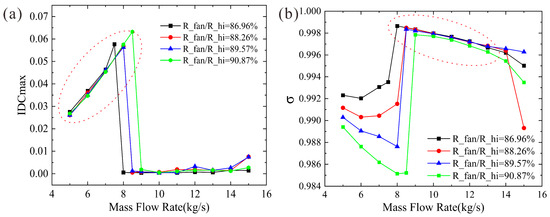
Figure 28.
(a) Influence of fan face radius on the IDCmax-mass flow rate relationship (Vc = 25 kts); (b) Influence of fan face radius on the σ-mass flow rate relationship (Vc = 25 kts). The red circles indicate regions where the performance is insensitive to geometric variations.
However, for the total pressure recovery coefficient, Figure 28b reveals a significant decline in the mass flow range of 5–7.5 kg/s as the diffuser area ratio increases. The performance gap between configurations becomes more pronounced at progressively higher mass flow rates. Within this range, the separation point is located near the lip leading edge, and Figure 29 shows that the separation zone expands with increasing diffuser area ratio, leading to a broader low-pressure zone at the AIP. This expansion reduces the total pressure recovery coefficient as the fan face radius increases. Beyond this range, the separation zone dissipates due to a weakened adverse pressure gradient at higher mass flow rates, and the recovery coefficient remains relatively stable across configurations.
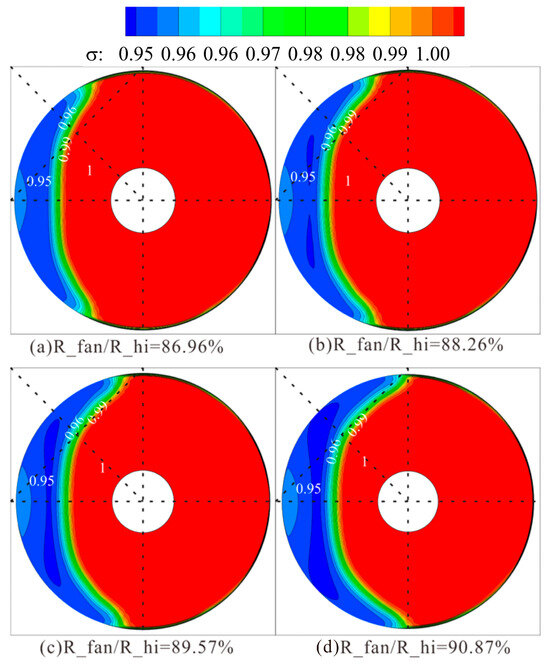
Figure 29.
AIP total pressure recovery distribution under various fan face radii (qm = 6 kg/s, Vc = 25 kt).
In summary, the fan face radius significantly affects the total pressure recovery coefficient and the extent of the low-pressure zone at the AIP before separation disappearance, but has a minimal impact on the distortion index IDCmax. When R_fan/R_hi increases from 86.96% to 90.87%, the maximum IDCmax merely rises from 0.0576 to 0.0632, representing an increase of 9.72%, while the mass flow rate for complete reattachment shifts rearward from 8 kg/s to 9 kg/s, with a shift magnitude of 12.5%. Changes in the fan face radius have a lesser influence on distortion and the mass flow rate for the disappearance of separation compared to variations in the throat axial location. Geometrically, the throat axial location directly alters the contour near the leading edge of the internal profile where flow separation originates. In contrast, the fan face radius primarily modifies the diffuser section, increasing pressure loss and thereby exerting a more pronounced effect on the total pressure recovery coefficient.
3.4.3. Influence of Leading-Edge Radius
This subsection investigates the effects of the lip leading-edge radius of both the outer contour and inner contour. For the outer contour leading-edge radius (ROC_O), four configurations were constructed with ROC_O/R_hi = 2.34%, 4.69%, 7.03%, and 9.38%. Similarly, for the inner contour leading-edge radius (ROC_I), four configurations were developed with ROC_I/R_hi = 1.73%, 3.46%, 5.19%, and 7.84%. Specifically, the configuration with ROC_O/R_hi = 4.69% corresponds to the same physical model as ROC_I/R_hi = 3.46%. The geometric configuration is illustrated in Figure 30. The total pressure recovery coefficient and IDCmax of the nacelle were computed for each configuration under crosswind conditions of 25 knots across a mass flow rate range of 5–15 kg/s.
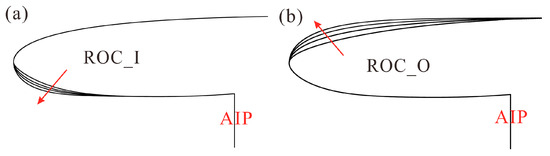
Figure 30.
Schematic of leading-edge radius variations for outer and inner contour, with the arrow indicating the direction of increase; (a) Inner contour; (b) Outer contour.
Figure 31 presents the variations in the distortion index IDCmax and the total pressure recovery coefficient with mass flow rate under a crosswind velocity of 25 knots for these configurations. The relationship between distortion and mass flow rate reveals that the leading-edge radius significantly influences the distortion trend. The peak distortion decreases as the leading-edge radius increases, and the mass flow rate at which distortion drops sharply shifts forward. As shown in Figure 31a,c, when configurations operate under high-separation mass flow conditions (within the dashed box area), the distortion index IDCmax remains largely independent of the leading-edge radius.
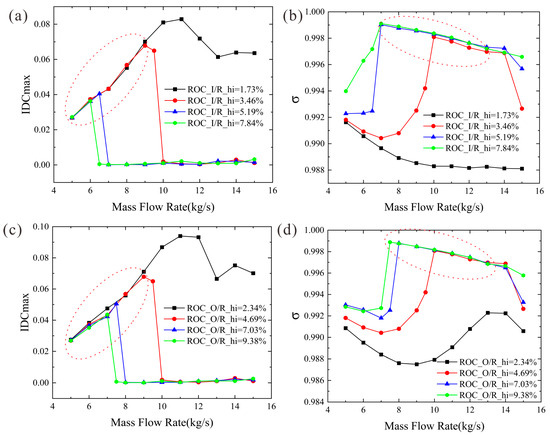
Figure 31.
Influence of leading-edge radius on the IDCmax-mass flow rate relationship and σ-mass flow rate relationship (Vc = 25 kts); (a) Effect of ROC_I on IDCmax; (b) Effect of ROC_I on σ; (c) Effect of ROC_O on IDCmax; (d) Effect of ROC_O on σ. The red circles indicate regions where the performance is insensitive to geometric variations.
For the ROC_O/R_hi = 2.34% configuration, the distortion decreases from 0.0934 to 0.0665 after reaching its peak, while for ROC_I/R_hi = 1.73%, it reduces from 0.0829 to 0.0614. This indicates that both configurations with a smaller leading-edge radius exhibit severe internal flow separation across all mass flow conditions. In contrast, for other configurations, the peak distortion drops rapidly to near zero at certain mass flow rates, confirming the disappearance of flow separation. When ROC_O/R_hi decreases from 9.38% to 4.69%, the peak distortion increases from 0.0436 to 0.0678, representing a 55.50% rise, while the mass flow rate for complete reattachment shifts rearward from 7.5 kg/s to 10 kg/s, with a rearward shift magnitude of 33.33%. Correspondingly, when ROC_I/R_hi decreases from 7.84% to 3.46%, the peak distortion intensifies from 0.0363 to 0.0678, an increase of 86.78%, and the mass flow rate for complete reattachment shifts rearward from 6.5 kg/s to 10 kg/s, demonstrating a rearward shift of 53.85%.
As observed in Figure 31b, except for the ROC_I/R_hi = 1.73% configuration, the variation trends of the total pressure recovery coefficient with mass flow rate are similar across the other configurations. As the leading-edge radius decreases, the recovery coefficient declines, and the entire curve shifts downward and to the right. Specifically, when ROC_I/R_hi increases to 7.84%, the descending trend of the total pressure recovery coefficient during the initial mass flow rate increase was not captured, presumably because the investigated mass flow range was too narrow for this configuration. After reaching the mass flow rate for the disappearance of separation (within the dashed box area), the recovery coefficient becomes nearly identical to that under crosswind-free conditions.
To qualitatively analyze the influence of the leading-edge radius, four outer contour configurations were selected for analysis at a mass flow rate of 6 kg/s. As shown in Figure 32, the overall structure of the total pressure recovery coefficient contours is similar among the four configurations. As the leading-edge radius increases, the low-pressure zone at the AIP generally contracts, resulting in an improved recovery coefficient. However, when the leading-edge radius is ROC_I/R_hi = 2.34%, the separation zone expands slightly, leading to a marginally lower total pressure recovery coefficient compared to the configuration with ROC_I/R_hi = 4.69%. The same trend applies to the inner contour leading-edge radius.
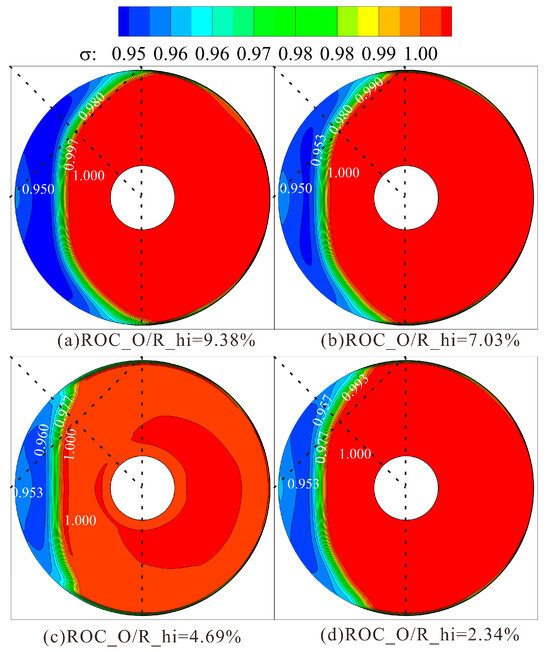
Figure 32.
Contours of total pressure recovery coefficient at AIP under different outer contour leading-edge radius (qm = 6 kg/s, Vc = 25 kt).
From Figure 30, it is evident that the geometric variation in the inner contour is less pronounced than that of the outer contour. However, the ROC_I/R_hi = 5.19% configuration exhibits a greater forward shift in the mass flow rate for the disappearance of separation compared to the ROC_O/R_hi = 7.03% configuration. This demonstrates that flow separation under crosswind conditions is more sensitive to changes in the inner contour than to the outer contour.
To elucidate the mechanism whereby the inner contour leading-edge radius exerts a more pronounced influence on the complete reattached mass flow rate than the outer contour leading-edge radius, the wall pressure distributions of three configurations are plotted in Figure 33: ROC_O/R_hi = 7.03%, ROC_I/R_hi = 5.19%, and ROC_O/R_hi = 4.69% (ROC_I/R_hi = 3.46%). As evidenced in the figure, the pressure variation near the lip for the ROC_I/R_hi = 5.19% configuration becomes more gradual compared to that of ROC_I/R_hi = 3.46%. Although a similar mitigating effect is observed for ROC_O/R_hi = 7.03% relative to ROC_O/R_hi = 4.69%, the degree of moderation is less pronounced than in the former case. Consequently, the ROC_I/R_hi = 5.19% configuration exhibits superior crosswind resistance relative to the ROC_O/R_hi = 4.69% configuration. This phenomenon may be attributed to the fact that the contour modification in the ROC_I/R_hi = 5.19% configuration is less extensive than that in the ROC_O/R_hi = 7.03% configuration, yet it results in a more significant forward shift in the complete reattached mass flow rate.
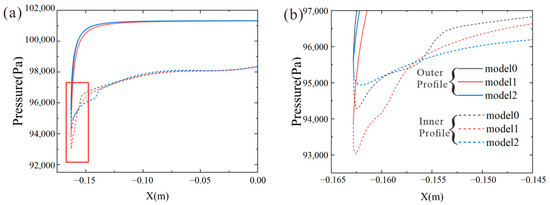
Figure 33.
(a) Comparison of wall pressure distributions at line1 section for model0 (ROC_O/R_hi = 7.03%), model1 (ROC_O/R_hi = 4.69%, ROC_I/R_hi = 3.46%), and model2 (ROC_I/R_hi = 5.19%); (b) Close-up view of the boxed region in (a).
As established in earlier analysis, during airflow around the lip, the line1 section experiences extreme favorable pressure gradients followed by adverse pressure gradients near the leading edge. The severe adverse pressure gradient triggers separation originating from the lip leading edge. Therefore, leading-edge parameters likely influence the peak distortion index IDCmax and the mass flow rate for the disappearance of separation by altering the pressure distribution around the lip.
To isolate the pressure changes induced by the leading-edge radius, Figure 34 and Figure 35, respectively, present the wall pressure distributions along the line1 section for the outer contour and inner contour configurations under crosswind-free conditions at 6 kg/s. The results show that changes in the outer leading-edge radius dictate the pressure distribution on the inner contour. As the leading-edge radius decreases, the peak pressure at the leading edge drops, indicating stronger flow acceleration around the lip. Simultaneously, the adverse pressure gradient near the inner leading edge intensifies as the radius decreases, which is reflected in the steeper pressure rise shown in the figure. Consequently, configurations with a smaller leading-edge radius are more prone to separation. While increasing mass flow rate can mitigate the adverse pressure gradient under crosswind conditions, reducing the leading-edge radius exacerbates it. Thus, for configurations with a smaller leading-edge radius, the mass flow rate required for the disappearance of separation decreases as the flow rate increases.
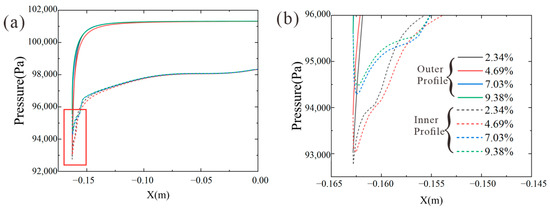
Figure 34.
(a) Influence of outer contour leading-edge radius (ROC_O/R_hi) variation on pressure distribution at line1 section (qm = 6 kg/s, Vc = 0 kt); (b) Close-up view of the boxed region in (a).
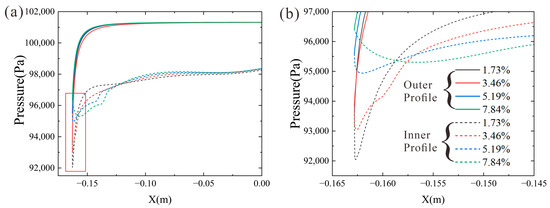
Figure 35.
(a) Influence of inner contour leading-edge radius (ROC_I/R_hi) variation on pressure distribution at line1 section (qm = 6 kg/s, Vc = 0 kt); (b) Close-up view of the boxed region in (a).
This section presents a crosswind performance analysis of the nacelle using the iCST method to parameterize key geometric features: the throat axial location, fan face radius, and leading-edge radii of the inner and outer contours. The iCST method demonstrates robust shape control capabilities, particularly in maintaining a constant lip leading-edge radius when evaluating the effects of throat axial location and fan face radius on nacelle crosswind performance.
However, when investigating the influence of the inner and outer contour leading-edge radii, the original aerodynamic profile had to be artificially segmented into distinct inner and outer contours. This segmentation introduces curvature discontinuity at the leading-edge point, which may subsequently affect crosswind-induced flow separation. The iCST method effectively resolves this leading-edge curvature continuity issue by simply enforcing ROC_O = ROC_I, further demonstrating its superior geometric control capability. For future work, the condition ROC_O = ROC_I can be implemented to systematically investigate the influence of the leading-edge radius under the premise of consistent leading-edge curvature.
In summary, regarding the influence of geometric parameters on the nacelle inlet flow under crosswind conditions, the leading-edge radius exerts the most pronounced effect on both the total pressure distortion and the total pressure recovery. As the leading-edge radius decreases below a critical threshold, flow separation within the nacelle inlet may persist despite increasing mass flow rates, as the enhanced favorable pressure gradient remains insufficient to fully suppress separation. In contrast, variations in the fan face radius primarily affect pressure loss in the diffuser section, with a minimal impact on the pressure peak and pressure gradient near the leading edge. Consequently, changes in the fan face radius have a limited effect on the distortion index IDCmax but significantly influence the total pressure recovery coefficient. The axial location of the throat alters the curvature distribution near the leading edge of the internal contour, thereby moderately affecting both the total pressure distortion and the total pressure recovery.
4. Conclusions
This study systematically investigates the flow characteristics and performance of a nacelle inlet under crosswind conditions through numerical simulation, focusing on the effects of crosswind velocity, mass flow rate, and key geometric parameters. The main conclusions are as follows.
- 1.
- Influence of mass flow rate. The coupling effect of engine suction and crosswind dictates the flow pattern. The total pressure distortion index (IDCmax) initially increases with mass flow rate due to the strengthening of the separation zone, then drops sharply after a critical mass flow rate is reached due to a complete flow reattachment. The total pressure recovery coefficient (σ) exhibits a more complex three-phase trend with increasing mass flow rates, influenced by the competing roles of separation intensity and separation zone area.
- 2.
- Influence of Reynolds number Re. The effects of Re lie in two folds: (1) For a fixed model scale, both IDCmax and σ remain nearly unchanged when no separation is present in the flow field. However, as the crosswind velocity-based Re is increased to cause significant flow separations, the aerodynamic performance of the inlet suffers a remarkable degradation with rapidly rising IDCmax and decreasing σ. Meanwhile, the peak IDCmax 465 rises from 0.0145 to 0.1050, representing an increase of 624.14% with the reattachment mass flow rate delayed by 120%. (2) For a fixed crosswind velocity, the peak IDCmax progressively decreases with increasing Re. Specifically, as Re increases from to , the peak distortion is reduced by 32.6%. Furthermore, the reattachment is delayed by 33.32% in the mass flow rate density. Regarding the total pressure recovery coefficient, the entire performance curve exhibits an overall enhancement as Re rises.
- 3.
- Influence of geometric parameters. (1) Leading-edge radius is the most influential geometric parameter. Increasing the radii of both the inner and outer contours effectively reduces the peak distortion value and advances the mass flow rate required for the disappearance of separation by mitigating the adverse pressure gradient near the lip. Specifically, when ROC_O/R_hi decreases from 9.38% to 4.69%, the peak IDCmax increases by 55.50%, accompanied by a 33.33% rearward shift in the complete reattachment mass flow rate. In contrast, when ROC_I/R_hi decreases from 7.84% to 3.46%, the peak IDCmax demonstrates a more substantial increase of 86.78%, while the complete reattachment mass flow rate exhibits a pronounced rearward shift of 53.85%. An insufficient radius can lead to persistent separation at all the mass flow rates of interest. (2) Moving the throat axial location forward reduces the lip curvature and adverse pressure gradient, thereby lowering the peak distortion, advancing the critical mass flow rate for the disappearance of separation, and improving the pressure recovery coefficient across the majority of the operating range. When the throat axial location shifts from 35.00% to 69.00%, the peak IDCmax increases by 30.03%, and the complete reattachment mass flow rate exhibits a rearward shift of 43.75%. (3) The fan face radius primarily influences the flow in the diffuser section, with limited impact on the lip leading edge. Consequently, it exhibits a more pronounced effect on the total pressure recovery coefficient, while its influence on IDCmax remains relatively minor. When R_fan/R_hi increases from 86.96% to 90.87%, the peak IDCmax changes by only 9.72%, and the complete reattachment mass flow rate shifts rearward by 12.5%.
In summary, optimizing the lip leading-edge geometry is the most effective strategy for mitigating the adverse effects of crosswind. The findings provide insights and a parametric design foundation for nacelle inlets, thereby offering robust performance across both on- and off-design conditions, particularly during challenging crosswind operations.
Future research should establish a systematic framework integrating both ground operations and flight conditions. Specific extensions would include investigating the coupling between ground roll and crosswind effects during takeoff/landing phases, as well as a comprehensive cruise performance analysis. These constitute logical extensions toward evaluating inlet performance across the complete flight envelope.
Author Contributions
Conceptualization, X.S. and B.T.; methodology, X.S.; software, X.S.; formal analysis, C.L. and Z.W.; investigation, X.S. and Z.W.; resources, B.T. and C.L.; writing—original draft preparation, X.S.; writing—review and editing, Z.W.; visualization, X.S. All authors have read and agreed to the published version of the manuscript.
Funding
This research was funded by the Aeronautical Science Foundation of China (Grant No. 20240032052001), the National Natural Science Foundation of China (Grant No. 12172174, 12572287) and the National High-Level Talent Project (Grant No. YQR23019).
Data Availability Statement
The raw data supporting the conclusions of this article will be made available by the authors on request.
Acknowledgments
The authors are grateful for the financial support provided by the Aeronautical Science Foundation of China and the National Natural Science Foundation of China, which made this research possible.
Conflicts of Interest
Author Binbin Tang and Author Changkun Li were employed by Aviation Industries Corporation of China. The remaining authors declare that the research was conducted in the absence of any commercial or financial relationships that could be construed as a potential conflict of interest.
Nomenclature
| AIP | Aerodynamic interface plane |
| The area of the aerodynamic interface plane | |
| Matrix of coefficients | |
| Bernstein polynomial | |
| The maximum length of the profile | |
| Class function | |
| CST | Class-Shape transformation |
| Dhi | Highlight plane diameter |
| Index of summation | |
| iCST | Intuitive class shape transformation |
| IDCmax | Maximum circumferential distortion index |
| L_intake | The length of intake |
| L_m | The axial location of the maximum thickness of the nacelle |
| L_nac | The length of the nacelle |
| L_th | The axial location of the throat |
| Ma | Mach number |
| Super-elliptic exponent | |
| Bernstein polynomial order or super-elliptic exponent | |
| The number of probe rings | |
| First exponent in the class function | |
| Second exponent in the class function | |
| Total pressure | |
| The average total pressure | |
| The minimum total pressure within the **-th ring | |
| Re | Reynolds number |
| qm | Mass flow rate of the nacelle |
| ROC_I | The radius of curvature at the leading edge of the inner profile |
| ROC_O | The radius of curvature at the leading edge of the outer profile |
| R_fan | The radius of the fan face |
| R_hi | The Radius of the highlight plane |
| R_m | The radius of the nacelle at the maximum thickness location |
| R_te | The radius of the nacelle trailing edge |
| R_th | The radius throat |
| Shape function | |
| SIMPLEC | Semi-implicit method for pressure-linked equations |
| SST | Shear-stress transport |
| Vc | Velocity of crosswind |
| Axial coordinate | |
| Radial coordinates | |
| y+ | Wall non-dimensional distance |
| β_i | The boattail angle of the inner profile |
| β_o | The boattail angle of the outer profile |
| Dynamic viscosity | |
| Non-dimensional ordinate | |
| Freestream density | |
| σ | Mass flow averaged total pressure recovery coefficient |
| The converged variable from the fine mesh | |
| The converged variable from the coarse mesh | |
| Non-dimensional abscissa | |
| The radial offset from the trailing edge to the leading edge point |
Appendix A
Appendix A.1. Research Models and Test Conditions
This study encompasses a wide range of crosswind velocities and mass flow rates. The crosswind velocity varies from 0 kt to 35 kt in increments of 5 kt, while the mass flow rate ranges from 5 kg/s to 15 kg/s in increments of 1 kg/s. To more accurately capture the location of the complete reattached mass flow rate, a finer increment of 0.5 kg/s was applied around the peak distortion. For the model scale, the baseline configuration derived from the parameters in Table 1 was systematically scaled by factors of 2 and 4 relative to the original dimensions. The geometric scaling maintained proportional relationships across all critical parameters while preserving aerodynamic similarity.
Given the parametric nature of this investigation, numerous geometric configurations were evaluated. A summary of these configurations is provided in Table A3. It should be noted that the models with ROC_I/R_hi = 3.46%, ROC_O/R_hi = 4.69%, and L_th/L_intake = 65.44% represent the same physical hardware. Similarly, the configuration with L_th/L_intake = 35.00% is identical to that with R_fan/R_hi = 86.96%. In accordance with aviation regulations, which stipulate that crosswind velocity need not exceed 25 knots, this study selected 25 knots as the condition for detailed parametric influence analysis. Each configuration was computed over the mass flow rate range of 5–15 kg/s, with an additional data point added at the mass flow rate corresponding to peak distortion.
Appendix A.2. Sensitivity Analysis of Pressure Outlet
A sensitivity analysis of initial pressure was conducted for the pressure outlet with a specified target mass flow rate. The crosswind velocity was set to 25 kt, the initial pressure to 95,000 Pa, and the mass flow rate to 5 kg/s, with a pressure variation amplitude of 5% for the sensitivity analysis. The total pressure distortion and mass flow rate after convergence were obtained at initial pressures of 92,500 Pa and 97,500 Pa, and the relative errors relative to the 95,000 Pa condition were computed in Table A4. When the initial pressure was varied by ±5%, the maximum relative error in IDCmax was 0.19%, while that in the mass flow rate was 0.01%, confirming the robustness of the computational results to variations in initial pressure.
Appendix A.3. Three-Dimensional Non-Axisymmetric Nacelle Modeling Approach
This appendix details the construction methodology of the asymmetric three-dimensional nacelle model employed in this study. First, based on the two-dimensional sectional information provided in References [3,5,6,7], discrete point data for three key profiles of the Lara nacelle—namely, the upper, side, and lower sections—were extracted. Subsequently, the two-dimensional profile parameterization method described in Section 2.1 of this paper was applied to generate the corresponding parameterized profiles, the results of which are shown in Figure A2. On this basis, interpolation calculations were performed between each pair of adjacent parameterized profiles to generate a series of transitional sections. The outcomes of this transitional profile generation are presented in Figure A3. All profiles were then spatially arranged circumferentially around the nacelle axis according to their actual corresponding azimuthal positions, as illustrated in Figure A4. Finally, a surface construction technique was employed to generate the complete three-dimensional nacelle model, with the final geometry displayed in Figure A5.
Appendix A.4. Detailed Figures and Charts

Figure A1.
Computational convergence status (Vc = 25 kt, qm = 5 kg/s).

Figure A2.
Parameterized profiles of the upper, side, and lower sections for the full-scale model used in Refs. [3,5,6,7].

Figure A3.
Interpolated sections between neighboring profiles.

Figure A4.
Schematic of the circumferential arrangement of profiles.

Figure A5.
Three-dimensional non-axisymmetric nacelle geometry.
Table A1.
Simulation and experimental results [3].
Table A1.
Simulation and experimental results [3].
| qm (kg/s) | 346.94 | 416.33 | 485.72 | 555.11 | 624.50 | 693.89 |
| IDCmax (Experiment) | 0.0194 | 0.0241 | 0.0286 | 0.0442 | 0.0608 | 0.0783 |
| IDCmax (Simulation) | 0.0331 | 0.0396 | 0.0516 | 0.0633 | 0.0688 | 0.0904 |
Table A2.
Continued Simulation and experimental results [3].
Table A2.
Continued Simulation and experimental results [3].
| qm (kg/s) | 805.91 | 832.67 | 971.44 | 1040.83 | 1110.22 | 1179.61 |
| IDCmax (Experiment) | 0.0965 | 0.0585 | 0.0009 | 0.0263 | 0.0773 | 0.1442 |
| IDCmax (Simulation) | 0.1005 | 0.0031 | 0.0042 | 0.0104 | 0.1278 | 0.2124 |
Table A3.
Summary of models for the parametric influence study.
Table A3.
Summary of models for the parametric influence study.
| L_th/L_intake | R_fan/R_hi | ROC_O/R_hi | ROC_I/R_hi |
|---|---|---|---|
| 35.00% | 86.96% | 2.34% | 1.73% |
| 50.00% | 88.26% | 4.69% | 3.46% |
| 65.44% | 89.57% | 7.03% | 5.19% |
| 69.00% | 90.87% | 9.38% | 7.84% |
Table A4.
Pressure outlet initial condition sensitivity.
Table A4.
Pressure outlet initial condition sensitivity.
| Pressure | IDCmax | Relative Error | Mass Flow Rate (kg/s) | Relative Error |
|---|---|---|---|---|
| 90250 | 0.026899 | 0.19% | 5.0007216 | 0.01% |
| 95000 | 0.026847 | 5.0000455 | ||
| 99750 | 0.026811 | 0.13% | 4.9996582 | 0.01% |
References
- Federal Aviation Administration. Part 25: Airworthiness Standards: Transport Category Airplanes. In Federal Aviation Regulations; Federal Aviation Administration: Washington, DC, USA, 2002; p. 7. [Google Scholar]
- CCAR25-R4; Civil Aviation Regulations of China Part 25 Airworthiness Standards for Aircraft. Civil Aviation Administration of China: Beijing, China, 2011.
- Lecordix, J.L.; Mullender, A.; Lecossais, E.; Godard, J.L.; Hepperle, M. Hybrid laminar flow nacelle design. In Proceedings of the 20th Congress of the International Council of the Aeronautical Sciences (ICAS), Sorrento, Italy, 8–13 September 1996. [Google Scholar]
- Quémard, C.; Garçon, F.; Raynal, J.C. High Reynolds number air intake tests in the ONERA F1 and S1MA wind tunnels. In Workshop on Airframe Engine Integration at DLR; DLR: Brunswick, Germany, 1996. [Google Scholar]
- Colin, Y.; Aupoix, B.; Boussuge, J.F.; Chanez, P. Numerical simulation of the distortion generated by crosswind inlet flows. In International Symposium on Air Breathing Engines–2007; 2007. [Google Scholar]
- Colin, Y.; Aupoix, B.; Boussuge, J.F.; Chanez, P. Prediction of crosswind inlet flows: Some numerical and modelling challenges. In Proceedings of the 18th ISABE Conference, Beijing, China, 2–7 September 2007; pp. 1–13. [Google Scholar]
- Colin, Y.; Aupoix, B.; Boussuge, J.F.; Chanez, P. Numerical simulation and analysis of crosswind inlet flows at low Mach numbers. In Proceedings of the 8th International Symposium on Experimental and Computational Aerothermodynamics of Internal Flows Lyon, Lyon, France, 2–5 July 2007. [Google Scholar]
- Zhang, M. Numerical investigation of nacelle intake flow distortion at crosswind conditions. In Proceedings of the 32nd Congress of the International Council of the Aeronautical Sciences, ICAS, Shanghai, China, 6–10 September 2021; pp. 1–11. [Google Scholar]
- Nichols, D.A.; Vukasinovic, B.; Glezer, A.; DeFore, M.C.; Rafferty, B. Steady and Unsteady Control of Nacelle Inlet Flow in Crosswind. In AIAA Scitech 2021 Forum; American Institute of Aeronautics and Astronautics: Reston, VA, USA, 2021; p. 1556. [Google Scholar]
- Tourrette, L. Navier-Stokes simulations of air-intakes in crosswind using local preconditioning. In Proceedings of the 32nd AIAA Fluid Dynamics Conference and Exhibit, St. Louis, MO, USA, 24–26 June 2002; p. 2739. [Google Scholar]
- Kokubo, R.; Fujimura, S.; Yamamoto, M.; Yoshinori, O. Numerical study of inlet distortion under crosswind conditions using OpenFOAM. In AIAA Aviation Forum and Ascend 2024; American Institute of Aeronautics and Astronautics: Reston, VA, USA, 2024; p. 3920. [Google Scholar]
- Shams Taleghani, A.; Ghajar, A. Aerodynamic characteristics of a delta wing aircraft under ground effect. Front. Mech. Eng. 2024, 10, 1355711. [Google Scholar] [CrossRef]
- Shams Taleghani, A.; Ghajar, A.; Masdari, M. Experimental study of ground effect on horizontal tail effectiveness of a conceptual advanced jet trainer. J. Aerosp. Eng. 2020, 33, 05020001. [Google Scholar] [CrossRef]
- Nichols, D.A.; Vukasinovic, B.; Glezer, A.; Rafferty, B. Formation of a Nacelle Inlet Ground Vortex in Crosswind. In AIAA SCITECH 2022 Forum; American Institute of Aeronautics and Astronautics: Reston, VA, USA, 2022; p. 1698. [Google Scholar]
- Trapp, L.G.; Girardi, R. Evaluation of engine inlet vortices using CFD. In Proceedings of the 50th AIAA Aerospace Sciences Meeting Including the New Horizons Forum and Aerospace Exposition, Nashville, TN, USA, 9–12 January 2012; p. 1200. [Google Scholar]
- Abdolahipour, S. Effects of low and high frequency actuation on aerodynamic performance of a supercritical airfoil. Front. Mech. Eng. 2023, 9, 1290074. [Google Scholar] [CrossRef]
- Abdolahipour, S. Review on flow separation control: Effects of excitation frequency and momentum coefficient. Front. Mech. Eng. 2024, 10, 1380675. [Google Scholar] [CrossRef]
- Zhang, J.; Zhan, H.; Mi, B. Study on Aerodynamic Design of the Front Auxiliary Inlet. Aerospace 2023, 10, 700. [Google Scholar] [CrossRef]
- Zhao, X.; Van Hoorn, P.; Yao, H.-D.; Alderman, J. Parameter sensitivity study on inflow distortion of boundary layer ingested turbofans. Aerospace 2022, 9, 426. [Google Scholar] [CrossRef]
- Burley, R. Effect of lip and centerbody geometry on aerodynamic performance of inlets for tilting-nacelle VTOL aircraft. In Proceedings of the 17th Aerospace Sciences Meeting, New Orleans, LA, USA, 15–17 January 1979; p. 381. [Google Scholar]
- Younghans, J.; Hoelmer, W.; Stockman, N. Low speed effects of Reynolds number and lip geometry on high bypass ratio inlet performance. In Proceedings of the 20th Aerospace Sciences Meeting, Orlando, FL, USA, 11–14 January 1982; p. 59. [Google Scholar]
- Min, Q.I.; Zhan-xue, W.A.N.G.; Li, Z.H.O.U.; Wen-jian, D.E.N.G. Numerical Study on Effects of Lip Geometric Parameters on Performance of Nacelle Inlet. J. Propuls. Technol. 2020, 41, 2021–2030. [Google Scholar]
- Wei, Y.B.; Duan, Z.Y.; Guo, Z.D.; Yang, C.F. Parameterization investigation method for nacelle aerodynamic performance. Acta Aeronaut. Astronaut. Sin. 2022, 43, 526742. (In Chinese) [Google Scholar]
- Kulfan, B.M. Universal parametric geometry representation method. J. Aircr. 2008, 45, 142–158. [Google Scholar] [CrossRef]
- Zhu, F.; Qin, N. Intuitive class/shape function parameterization for airfoils. AIAA J. 2014, 52, 17–25. [Google Scholar] [CrossRef]
- Christie, R.; Heidebrecht, A.; MacManus, D. An automated approach to nacelle parameterization using intuitive class shape transformation curves. J. Eng. Gas Turbines Power 2017, 139, 062601. [Google Scholar] [CrossRef]
- Tejero, F.; Christie, R.; MacManus, D.; Sheaf, C. Non-axisymmetric aero-engine nacelle design by surrogate-based methods. Aerosp. Sci. Technol. 2021, 117, 106890. [Google Scholar] [CrossRef]
- Fluent, A. Ansys Fluent Users Guide; Ansys Inc.: Canonsburg, PA, USA, 2023. [Google Scholar]
- Du, P.; Agarwal, R.K. Drag Prediction of NASA Common Research Models Using Different Turbulence Models. In Proceedings of the 35th AIAA Applied Aerodynamics Conference, Denver, CO, USA, 8 June 2017; p. 4233. [Google Scholar]
- Togiti, V.; Eisfeld, B.; Brodersen, O. Turbulence model study for the flow around the NASA common research model. J. Aircr. 2014, 51, 1331–1343. [Google Scholar] [CrossRef]
- AIAA CFD Drag Prediction Workshop. Available online: https://aiaa-dpw.larc.nasa.gov/Workshop2/ (accessed on 15 December 2024).
- Sun, Y.; Li, R.F.; Xiong, Y.D.; Zhou, L.; Wang, L. Research on Influencing Factors of Computational Mesh and Turbulence Model on DLR-F6 Configuration. Aero Weapon. 2017, 5, 60–67. (In Chinese) [Google Scholar]
- Li, C.; Tang, S.; Li, Y.; Geng, Z. A modified RANS model for drag prediction of practical configuration with riblets and experimental validation. Aerospace 2022, 9, 125. [Google Scholar] [CrossRef]
- Huang, C.L.; Dai, R.; Wang, Z.L. Effects of upstream vortex generators on the intake duct performance for a waterjet propulsion system. Ocean. Eng. 2021, 239, 109838. [Google Scholar] [CrossRef]
- Cao, Y.; Qin, Y.; Wang, M. Numerical study on interference effects of the nacelle position on aerodynamic characteristics and nacelle intake performances. Proc. Inst. Mech. Eng. Part G J. Aerosp. Eng. 2024, 238, 117–134. [Google Scholar] [CrossRef]
- Nambiar, V.R.; Pachidis, V. Nacelle intake flow separation reduction at cruise condition using active flow control. Propuls. Power Res. 2022, 11, 337–352. [Google Scholar] [CrossRef]
- SAE APR1420B; Gas Turbine Engine Inlet Flow Distortion Guidelines. SAE International: Warrendale, PA, USA, 2011.
- Meana-Fernández, A.; Oro, J.M.F.; Díaz, K.M.A.; Galdo-Vega, M.; Velarde-Suárez, S. Application of Richardson extrapolation method to the CFD simulation of vertical-axis wind turbines and analysis of the flow field. Eng. Appl. Comput. Fluid Mech. 2019, 13, 359–376. [Google Scholar] [CrossRef]
Disclaimer/Publisher’s Note: The statements, opinions and data contained in all publications are solely those of the individual author(s) and contributor(s) and not of MDPI and/or the editor(s). MDPI and/or the editor(s) disclaim responsibility for any injury to people or property resulting from any ideas, methods, instructions or products referred to in the content. |
© 2025 by the authors. Licensee MDPI, Basel, Switzerland. This article is an open access article distributed under the terms and conditions of the Creative Commons Attribution (CC BY) license (https://creativecommons.org/licenses/by/4.0/).