Article

The Operational Safety Evaluation of UAVs Based on Improved Support Vector Machines

Equipment Management and Unmanned Aerial Vehicle Engineering School, Air Force Engineering University, Xi’an 710051, China
*
Author to whom correspondence should be addressed.
Aerospace 2025, 12(10), 932; https://doi.org/10.3390/aerospace12100932
Submission received: 28 August 2025 / Revised: 28 September 2025 / Accepted: 15 October 2025 / Published: 16 October 2025
(This article belongs to the Special Issue Airworthiness, Safety and Reliability of Aircraft)

Abstract

In response to the challenge of dynamic adaptability in operational safety assessment for UAVs operating in complex operational environments, this study proposes a novel operational safety assessment method based on an Improved Support Vector Machine. An operational safety assessment index system encompassing four dimensions—operator, UAV platform, flight environment, flight mission—is constructed to provide a comprehensive foundation for evaluation. The method introduces a dynamic weighted information entropy mechanism based on a sliding window, overcoming the static features and delayed response of traditional SVM methods. Additionally, it integrates Gaussian and polynomial kernel functions to significantly enhance the generalization capability and classification accuracy of the SVM model in complex operational environments. Experimental results show that the proposed model demonstrates superior performance on test samples, effectively improving the accuracy of operational safety assessment for the Reconnaissance–Strike UAV in complex operational environments, and offering a novel methodology for UAV safety assessment.

1. Introduction

The UAV integrates various functions, such as remote sensing, information acquisition, and electronic data processing. It is capable of precisely targeting time-sensitive critical objectives while also providing ground target location and guidance, supporting joint air–ground operations and electronic warfare, and playing a significant role in modern UAV operations. Due to its high integration and diverse mission types, the UAV requires coordination of multiple subsystems during operational operations. This not only increases the complexity of UAV operation but also heightens the risk of system interference, deception, and jamming in highly contested operational environments, exposing it to severe safety threats such as loss of control, crashes, and forced landings [1]. In this context, providing timely and rational decision-making guidance for its operational operations based on the operational environment and mission characteristics becomes crucial for ensuring its operational effectiveness. Currently, traditional operational safety assessment methods based on static rules struggle to address the multidimensional and highly coupled threat scenarios in complex operational environments, with limited responsiveness in dynamic situations [2]. This exposes significant deficiencies in the existing safety assessment mechanisms, particularly in terms of dynamic adaptability, necessitating the introduction of intelligent and efficient safety assessment algorithm models to optimize decision-making processes and reduce response delays.
The current research on intelligent operational safety assessment algorithms primarily focuses on artificial intelligence-driven methods. Researchers have widely employed models such as deep neural networks, convolutional neural networks, reinforcement learning, and Bayesian inference based on multisource data fusion to intelligently analyze environmental dynamics and predict risk states [3,4,5]. However, existing intelligent algorithms still have notable limitations in operational safety assessment, such as complex model structures, reliance on large-scale labeled data for parameter training, limited generalization ability in unknown situations, and issues with decision delays and instability in highly dynamic operational environments. In response to these challenges, Support Vector Machines (SVMs), with their compact structure and risk-controllable properties, offer a new approach to operational safety assessment for the UAV. The kernel function mechanism of SVM constructs a high-dimensional threat feature space through nonlinear mapping, enabling robust identification of safety threats even with limited sample conditions. Additionally, the structural risk minimization criterion ensures the model’s generalization ability in challenging environments, making it a valuable tool for operational safety assessment in complex operational settings [6,7,8,9,10]. However, SVMs offer promising advantages such as compact structure and controllable risk, their application to operational safety assessment of UAVs faces two key challenges: (i) traditional kernel functions struggle with classification boundary ambiguity under nonlinear and adversarial threats (e.g., electromagnetic distortion, multisource deception interference), and (ii) static parameter configurations limit adaptability to rapidly evolving operational environments, reducing sensitivity to sudden safety events.
To address these research gaps, this paper proposes a novel improved SVM-based operational safety assessment method that incorporates a dynamic weighted information entropy mechanism with a sliding window to enhance temporal adaptability and overcome the feature staticity of traditional models. Furthermore, by integrating Gaussian and polynomial kernel functions, the method alleviates classification ambiguity and improves generalization in complex operational scenarios. Based on a comprehensive four-dimensional safety assessment index system, the proposed approach provides a quantitative and adaptive framework for UAV operational safety evaluation, thereby supporting decision-making in risk prevention and control during operational operations.

2. Construction of Index System Framework for Operational Safety

A scientific and systematic indicator system forms the foundation of operational safety assessment for the UAV, playing a decisive role throughout the evaluation process. Traditional safety analysis methods, which are centered on technical factors, are insufficient for comprehensively identifying UAV risks in complex scenarios. To address this issue, this paper introduces a “Human–Machine–Environment–Management–Mission” five-element model as the fundamental framework for operational safety analysis of the UAV.

2.1. Construction of the Operational Safety Assessment Index System

Man–Machine–Environment System Engineering (MMESE), proposed by Chinese scholars such as Long Shengzhao, is an interdisciplinary research field that focuses on optimizing interactions among humans, machines, and the environment, emphasizing the influence of these interactions on system safety [11]. It has been widely applied in safety analysis, evaluation, and decision-making in aviation, military, and industrial contexts. With the increasing complexity of industrial scenarios and the growing demand for safety, researchers have recognized that technical factors alone are insufficient to address systemic risks. Consequently, management and task elements—covering institutional frameworks, processes, and supervision—are incorporated, forming the “Man–Machine–Environment–Management–Task” (MMEMT) five-element model. This model emphasizes multidimensional collaborative risk prevention, moving beyond analyses focused solely on technical or human factors, and treats safety as a dynamic outcome of interactions among humans, equipment, environment, management, and mission. It has become an essential tool for system safety analysis in China.
However, despite the comprehensive structure and multidimensional perspective of the MMEMT model, it primarily addresses macro-level structural analysis and lacks the capability to model specific failure mechanisms, making it difficult to analyze the generation and evolution of failure events across system dimensions. The Swiss Cheese Model, with its multilayered defense structure and failure vulnerability identification mechanism, effectively complements the MMEMT model at the micro-level. Originally proposed by British psychologist James T. Reason, the Swiss Cheese Model is a widely used framework in risk management and safety protection [12]. By analogy to layers of Swiss cheese, it visually demonstrates how complex systems reduce risk and prevent accidents through multiple defense layers. The integration of the MMEMT model and the Swiss Cheese Model allows the former to provide dimensional structure while the latter provides failure logic, resulting in a highly interpretable, verifiable, and extensible framework for constructing the operational safety Index System for the UAV.
As shown in Figure 1, the MMEMT model provides the structural foundation for the UAV operational safety Index System through the five dimensions of management, mission, personnel, machine, and environment. The Swiss Cheese Model maps these five elements to five layers of protective safety barriers. These barriers are arranged sequentially from management to environment, reflecting the multidimensional risk defense layout of the UAV from organizational systems to natural conditions. Specifically, the management layer forms an institutional safety barrier through rules and supervision, with vulnerabilities arising from regulatory lag or oversight gaps. The mission layer provides dynamic protection in the operational environment but may fail due to UAV coordination issues or deceptive interference. The personnel layer establishes cognitive and operational safety barriers through training and standards but is susceptible to misjudgment in complex operational scenarios. The machine layer relies on technical measures to protect the UAV platform, which may fail due to onboard system faults. Finally, the environment layer acts as a natural buffer, relying on weather, terrain, and natural conditions, which may lead to UAV failure under extreme environmental conditions.
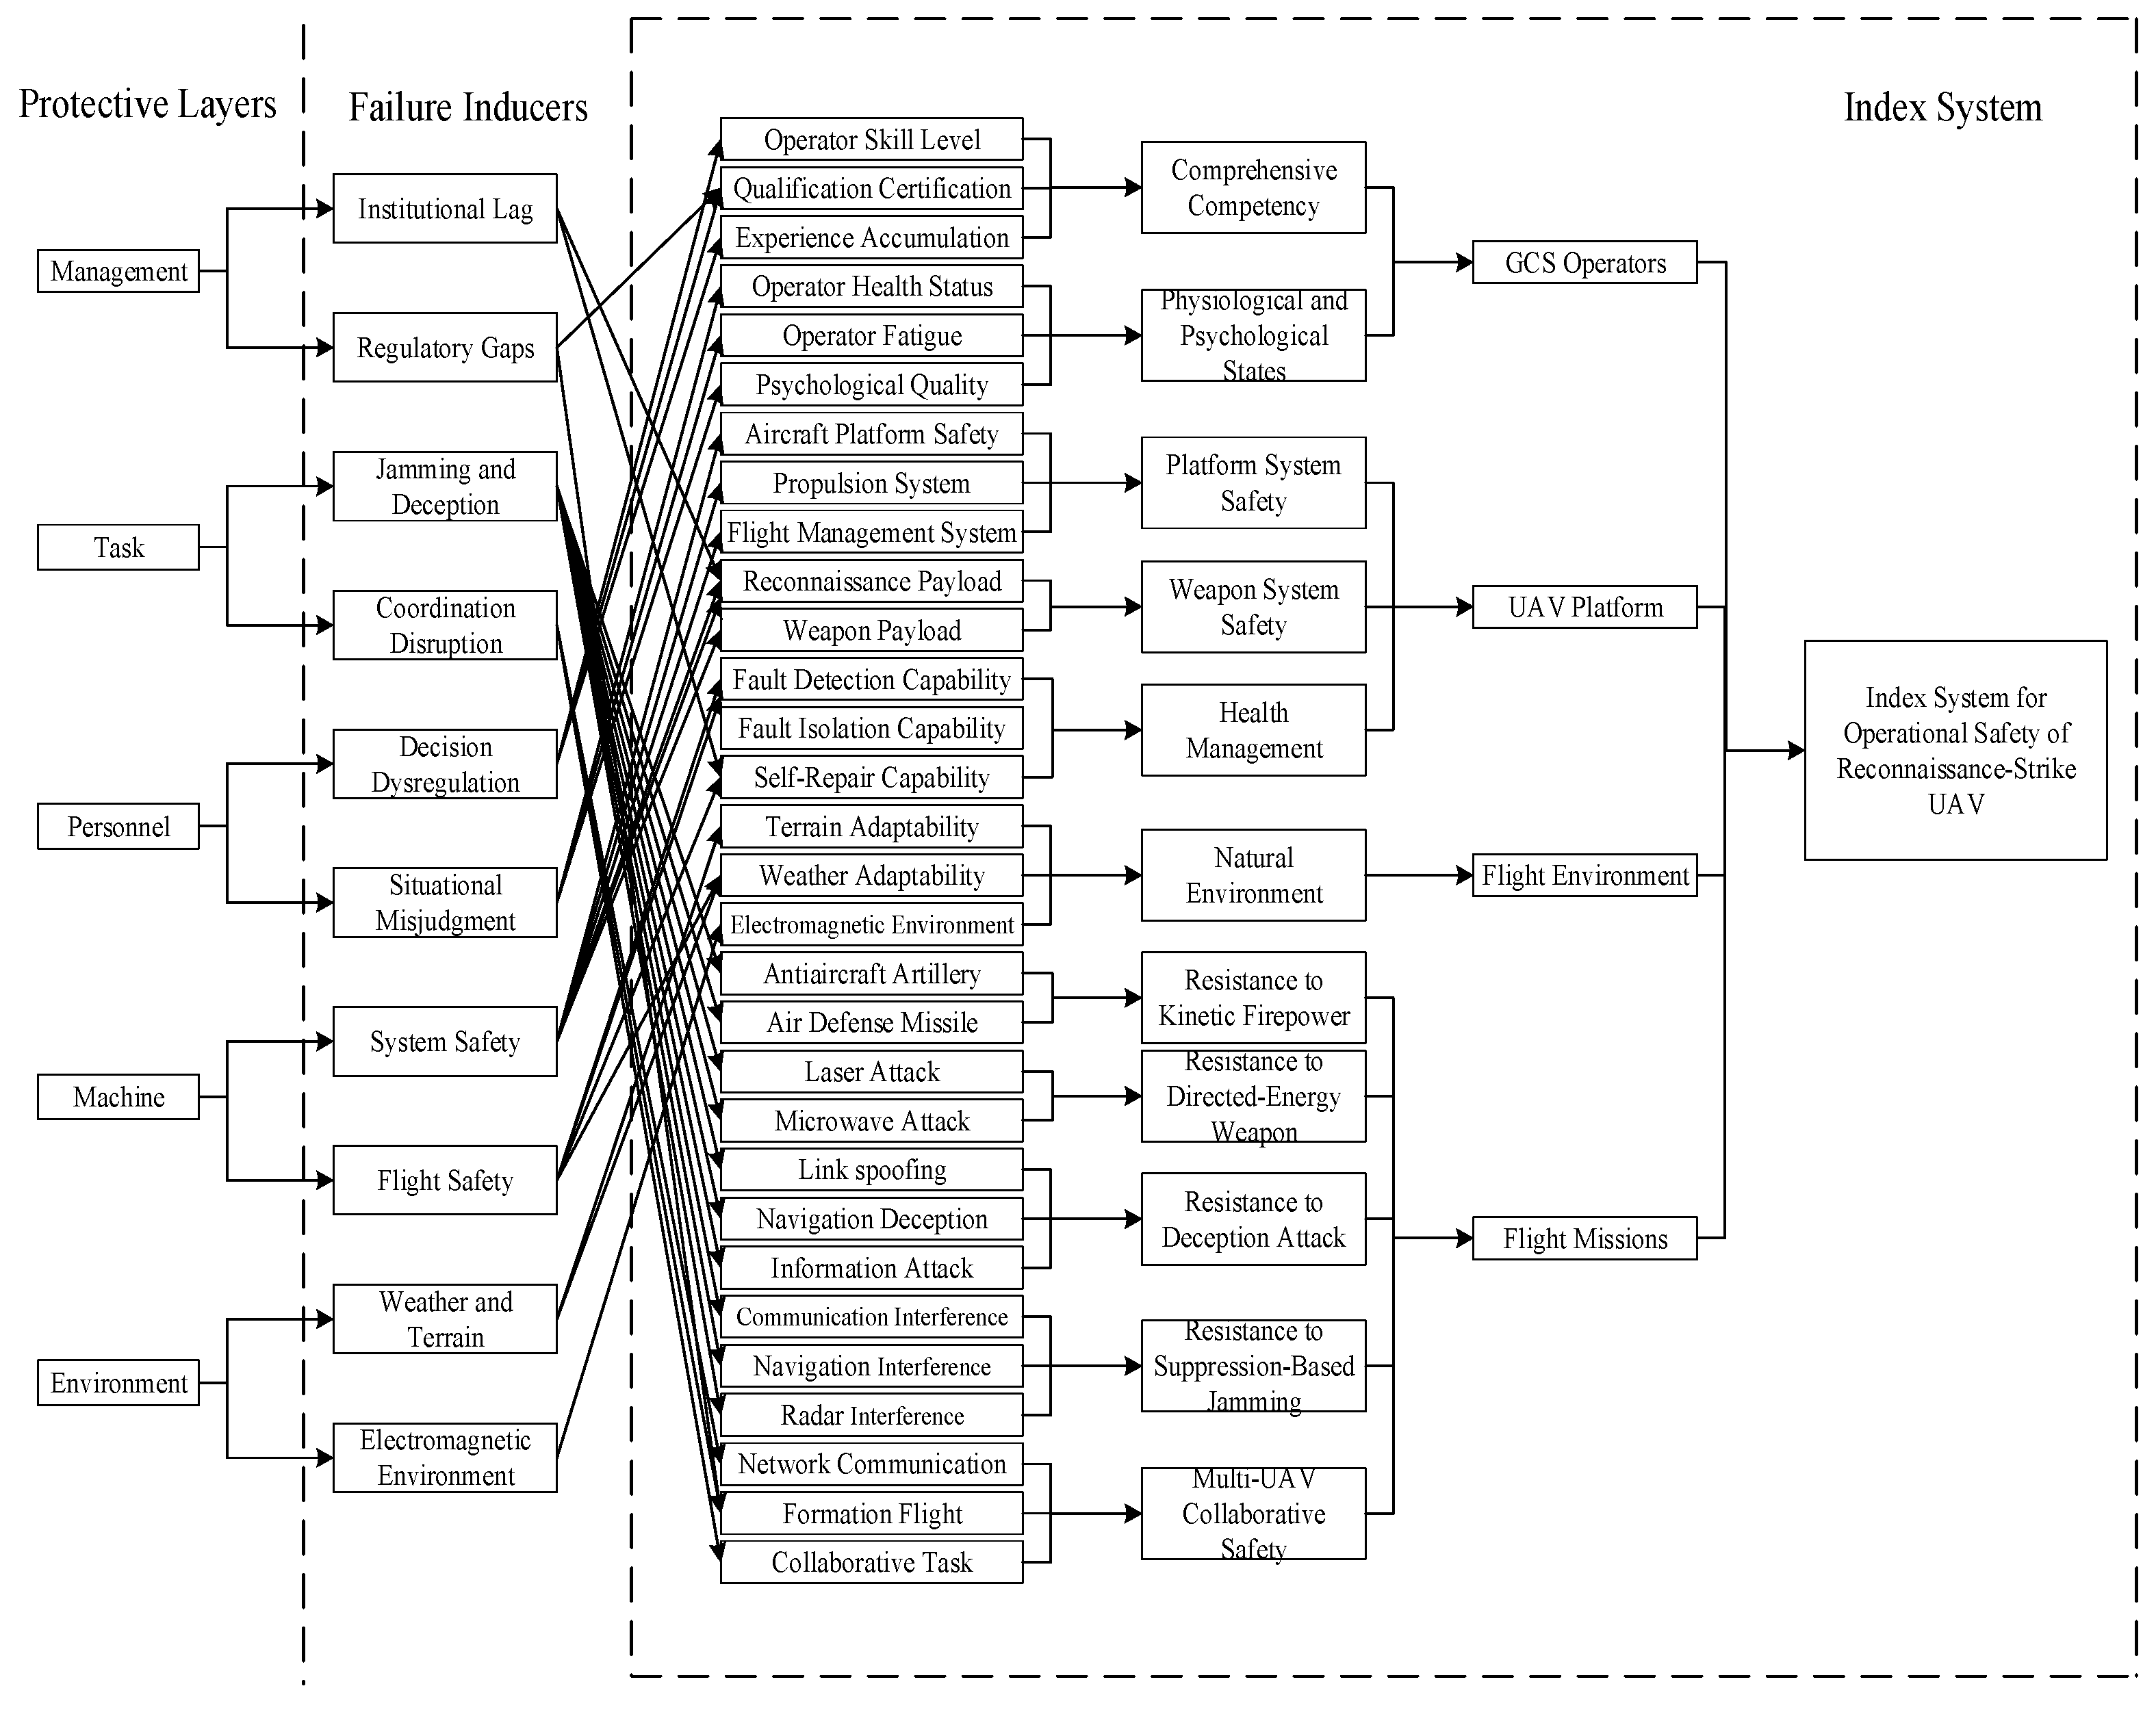
By progressively identifying the failure-inducing factors within each protective barrier, a systematic mapping can be achieved from the operational safety protection mechanisms to failure causes and further to evaluation indices, as illustrated in Figure 2. On the left side lies the initial source of operational safety issues, where each layer can be decomposed into several typical failure causes, such as decision-making disorder, interference and deception, and situational misjudgment. These causes converge into multiple failure points, penetrating the corresponding protective layers and forming specific capability requirements, such as operator skill proficiency, flight platform safety, and system anti-interference capacity. This corresponds to the safety vulnerabilities in the perspective of the Swiss Cheese Model. All failure points are further categorized into eleven operational safety indices, including platform system safety, basic flight safety, and natural environmental safety. Ultimately, these key operational safety indices are aggregated into four primary objects—operators, UAV platforms, flight environment, and flight missions—thus establishing a closed-loop mapping structure of “MMEMT–Swiss Cheese Model–Operational Safety Indices.” This mapping not only addresses the lack of logical connections between structural classifications and risk indicators but also endows the index system with interpretability and traceability, thereby providing methodological support for constructing the operational safety index system of the UAV.
Considering the mission profile of the UAV and its operational characteristics that integrate battlefield reconnaissance and ground strike functions, an operational safety evaluation index system is constructed based on the principles of comprehensiveness, scientific rigor, hierarchy, and conciseness. As illustrated in Table 1 the system comprises four levels: the target level, the criterion level, the element level, and the indicator level. The target level represents the highest tier, indicating the overall operational safety objective of the UAV. The criterion level directly serves the realization of the target level, classified into operators, UAV platforms, flight environment, and flight missions, thereby embodying the concretization and expansion of the target. The element level further subdivides the core safety elements under each criterion, identifying specific safety sub-elements, including operator competence, platform system safety, natural environment safety, multi-UAV cooperative safety, and other key indices (11 in total). The indicator level, being the most detailed and fundamental tier, quantitatively evaluates the specific elements of the previous level. By analyzing the potential failure causes of each element, the 11 key indices are refined into 30 basic indices, which serve as the core basis for the final evaluation of operational safety.

2.2. Analysis of Index System for Operational Safety

In the process of operational safety assessment for the UAV, the comprehensive capabilities and physical and mental state of the operators are crucial factors influencing mission execution safety. Comprehensive capability refers to the technical foundation for the operator to complete UAV missions, encompassing three dimensions: skill level, qualification certification, and experience accumulation. The physical and psychological state represents the physiological and psychological assurance for operators to maintain high operational efficiency, including health status, fatigue level, and psychological quality.
The safety of the UAV platform is the core guarantee for mission execution, encompassing three dimensions: system reliability, equipment performance and health management. Platform system safety involves three key subsystems: the aircraft platform, propulsion system, and flight management system, with the flight management system primarily addressing the UAV’s navigation and flight control systems. Weapon system safety includes the security of reconnaissance and weapon payloads. Health management safety improves platform reliability through self-maintenance, covering fault detection, fault isolation, and self-repair capabilities.
The flight environment represents the natural environment in which the UAV operates during missions. Natural environment safety includes three core challenges: terrain, weather, and electromagnetic conditions. These challenges correspond to the UAV’s ability to adapt to complex terrains, severe weather conditions, and natural electromagnetic environments.
Flight missions are the core manifestation of the operational effectiveness of the UAV. The safety assessment of its operations should cover three dimensions: physical attacks, electronic warfare defense, and multi-UAV cooperation. Physical attack resistance includes the ability to resist Kinetic Firepower and directed-energy attacks. The ability to resist kinetic firepower is the basis for UAV survival in conventional operational environments, addressing threats from anti-aircraft artillery and air defense missiles. Directed-Energy weapons represent emerging threats, requiring targeted defense against laser and microwave attacks. Electronic warfare threats include resistance to deception and interference. Deception resistance focuses on countering covert threats, such as falsified or tampered information or signals. Core sub-indicators include resistance to link deception, satellite navigation spoofing, and information attacks. Resistance to suppression and interference focuses on countering threats from high-intensity noise or energy suppression, which disrupt communication, navigation, and sensing systems. Sub-indicators include resistance to communication interference, satellite navigation jamming, and radar interference. Multi-UAV cooperation is an emerging trend in future warfare and requires ensuring the operational safety of networked systems, formations, and mission coordination.

2.3. Quantitative Data Acquisition of Indicators

In the operational safety evaluation index system for the UAV, the observability of different safety indices varies significantly. To obtain high-quality index data, it is essential to design optimal data acquisition methods tailored to each specific index [13]. Common methods for data acquisition of these indices are summarized in Table 2.
The two indices concerning operators’ comprehensive capability and physical–mental state are essentially subjective evaluation indices. Although they can be indirectly quantified through physiological parameters such as electroencephalography (EEG) and heart rate variability, the deployment of such sensors is technically difficult and time-consuming, making large-scale sample collection impractical. Therefore, these two indices acquire data through the Delphi method.
The indices of platform system safety and weapon system safety are closely related to the structural reliability, fault tolerance, and coupling characteristics of platform hardware systems, which exhibit strong physical and structural attributes. Their system behavior responses under different operating conditions can be derived through simulation, enabling the calculation of index scores. Accordingly, these indices obtain data via the model parameter calculation method.
Health management safety and multi-UAV cooperative safety rely heavily on the long-term stability of system operations and the performance of system interactions in complex missions, making them suitable for mining from existing mission execution records. Hence, these two indices acquire data from historical task record data.
Indices such as resistance to firepower attacks, resistance to directed energy attacks, resistance to deception, and resistance to suppression interference describe the defensive capability of the UAV in highly contested operational environments, where real-flight sampling is infeasible. Simulation platforms can construct diverse electronic countermeasure environments with adjustable disturbance intensities and interference modes, allowing iterative testing. Thus, these indices obtain data through simulation.
In addition, after completing preliminary data acquisition, function fitting techniques are applied to model the feature responses at different risk levels, thereby constructing multiple sets of feature response curves with engineering rationality. By combining these fitted curves, large-scale sample generation can be achieved. This approach significantly increases the quantity and coverage of samples, providing a stable and high-quality data foundation for subsequent model training. Specifically, the final dataset contains approximately 1200 samples, distributed across four safety levels (L1–L4) with 300 samples per level. Table 1 presents representative examples of the constructed safety indices, while the complete dataset used for training and evaluation is substantially larger.

3. Operational Safety Level Classification

Based on the construction of the operational safety evaluation index system, the quantitative classification of operational safety levels serves as a critical step in transforming safety assessment into practical application. Clarifying the threat types of UAVs is a prerequisite for safety level classification. The threats faced by UAVs can be categorized into five major types: loss of control, forced landing, crash, deception, and threats to friendly forces [14]. Their hazard levels and impacts are summarized in Table 3.
Based on the probability of occurrence and the severity of consequences following failure, the operational safety levels of the UAV are categorized into four levels: L1 to L4. The scope of threats covered by each level and their typical application scenarios are summarized in Table 4.
Each simulated episode was automatically mapped to one of the four safety levels (L1–L4) using a deterministic rule set derived from the threat combinations in Table 4. Specifically, L1 corresponds to minimal threats with full mission success, L2 to moderate single threats with successful mission completion, L3 to high or multiple threats with partial mission degradation, and L4 to severe threats resulting in mission failure.

4. Research on Improved SVM Evaluation Model

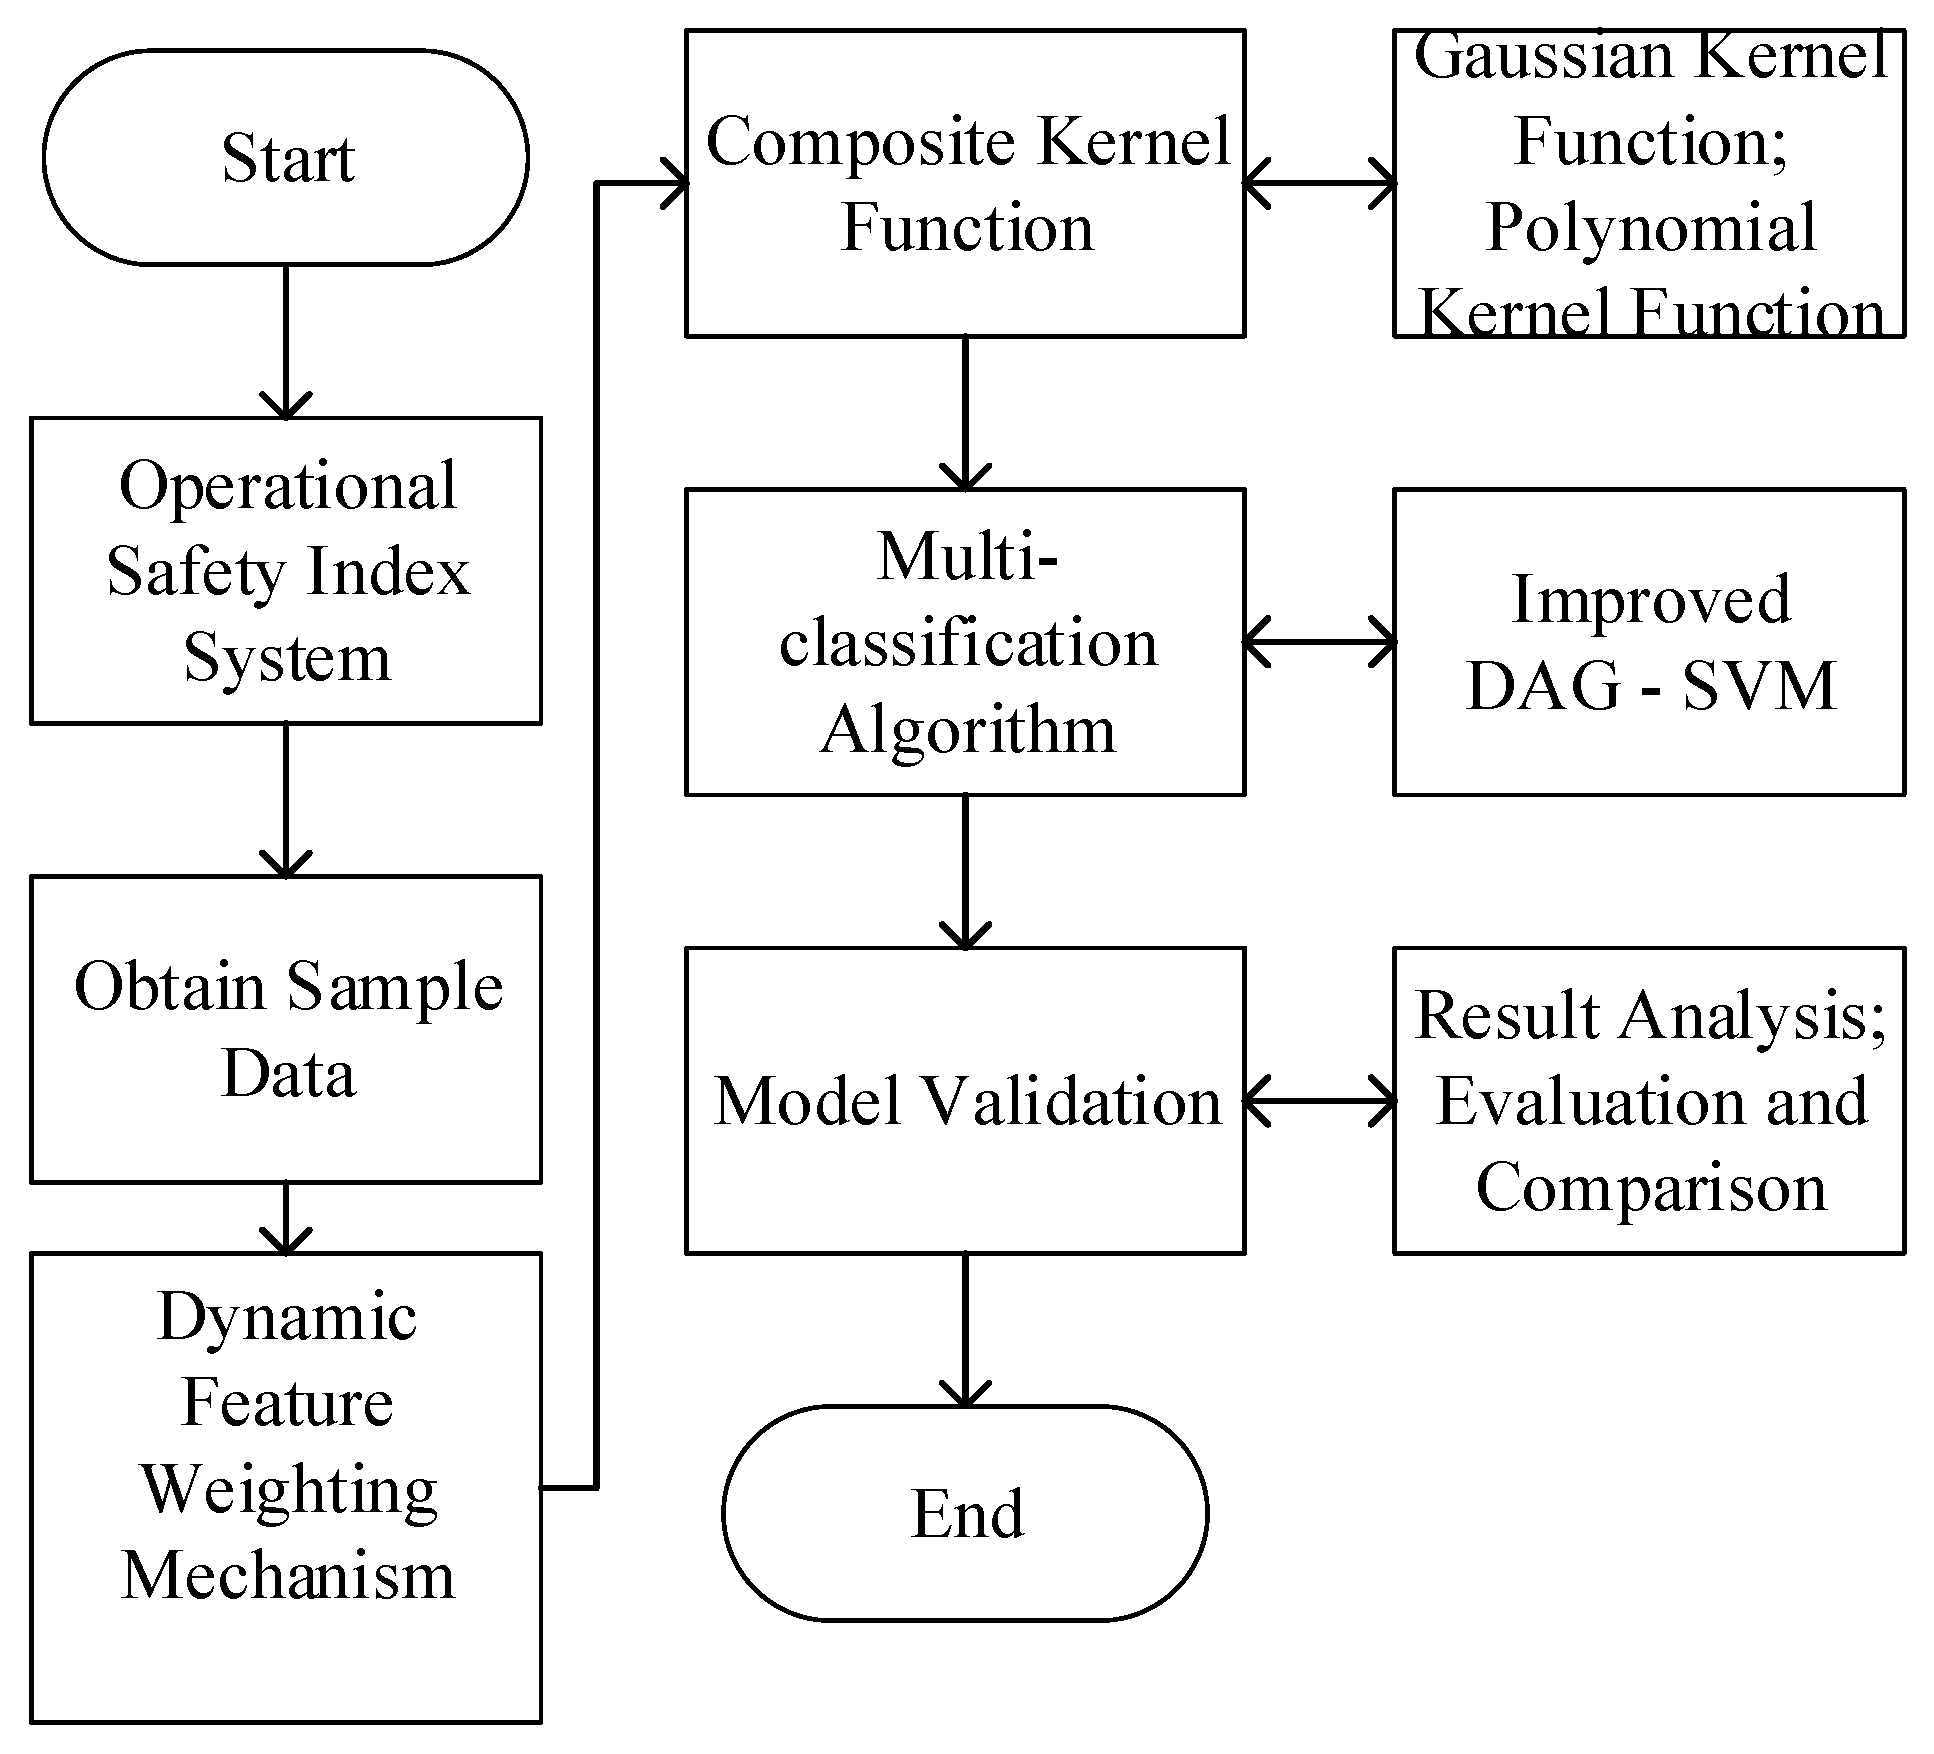
To address the issue of dynamic adaptability in the operational safety assessment of the UAV under complex operational environments, an improved SVM-based evaluation model is proposed. This model achieves closed-loop optimization of the assessment process through “dynamic feature adjustment–hybrid kernel modeling–efficient multi-class decision-making,” as illustrated in Figure 3. First, a dynamic weighted information entropy mechanism based on a sliding window is introduced, where the entropy-based weight updating mechanism resolves the evaluation lag problem inherent in traditional static weighting approaches. Second, a hybrid-kernel SVM model is constructed by integrating Gaussian and polynomial kernel functions, enhancing adaptability to complex data distributions. Finally, an improved DAG-SVM multi-classification algorithm is employed to classify and evaluate the four operational safety levels of the UAV.

4.1. Improved Dynamic Feature Weighting Mechanism Based on Information Entropy

To address the challenge that static parameter configurations of operational safety features for the UAV cannot adapt to the dynamic evolution of battlefield situations, this study introduces a sliding-window-based dynamic weighted information entropy mechanism. The core idea is to exploit the dynamic characteristics of information entropy to adjust the weights of different operational safety features, thereby enabling the SVM model to adapt to rapidly changing battlefield conditions and diverse threat scenarios.
H t ( X i ) = k = 1 T λ T k p ^ ( x i k ) log 2 p ^ ( x i k )
Specifically, λ is the forgetting factor that controls the decay rate of historical data; T denotes the window length and defines the temporal range over which entropy is computed; Ht(Xi) is the dynamic information entropy of the i-th safety assessment indicator at time t, measuring its uncertainty; Xi is the time-series set of the i-th safety assessment indicator; i is the indicator index and uniquely identifies a safety assessment indicator; k is the sample index within the sliding window and denotes the ordinal position of a historical data point in the current time window, with k ∈ [1, T]; p ^ ( x i k ) is the estimated probability density value of the i-th indicator at the k-th sample point; and xik is the quantized value of the i-th indicator at the k-th sample point.
p ^ ( x i k ) = n ( x i k ) + ε j = 1 m n ( x i j ) + m ε
The corrected probability density function is further employed in the exponentially decayed sliding-window entropy calculation. Here, ε controls the decay rate of historical data; p ^ ( x i k ) denotes the corrected probability density estimate of the i-th indicator at the k-th sample point; nik represents the raw occurrence count of the i-th indicator at the k-th sample point; xik is the quantized value of the i-th indicator at the k-th sample point; Ni denotes the total raw occurrence count of all values of the i-th indicator within the sliding window; I is the indicator index, uniquely identifying a safety assessment indicator; k is the sample index within the sliding window; j is the summation index used to traverse all possible values of the i-th indicator within the sliding window; and m is the number of distinct values of the i-th indicator observed in the sliding window. Due to significant fluctuations in feature weights under high-intensity adversarial environments, directly using normalized entropy values as weights can induce high-frequency oscillations in decision-making, thus undermining the model’s stability. To address this, the proposed model incorporates a double exponential smoothing strategy for weight updating
w i ( t ) = α H t ( X i ) j = 1 n H t ( X j ) + ( 1 α ) ω i ( t Δ t )
where α represents the smoothing factor, which balances the contribution of current entropy values and historical weights, while Δt denotes the time interval for weight updates.
Moreover, in complex operational environments, certain operational safety threats exhibit latent characteristics. To enhance the model’s adaptability to such risks, a dynamic detection mechanism based on the gradient of entropy change (ΔH) is employed to identify emerging risk trends
Δ H = H t ( X i ) H t Δ t ( X i ) Var H [ t τ win , t Δ t ] ( X i ) > τ
When ΔH > τ (threshold), the corresponding feature is considered to be entering a rapidly unstable state, potentially indicating emergent operational safety risks. On this basis, an adaptive feature reorganization strategy is applied: the top 30% of features ranked by entropy are retained as core features, while features with the fastest-rising entropy gradients but currently low entropy values are added as emerging features.
To determine the optimal hyper-parameters, a grid search strategy was employed over the following ranges: window length T ∈ [3, 10], entropy weighting coefficient λ ∈ [0.5, 0.95], balance parameter α ∈ [0.5, 0.9], and threshold τ ∈ [1.0, 2.0].

4.2. Ensemble Kernel SVM Model

SVM is a binary classification model primarily used for data classification tasks. Its main objective is to find a hyperplane that separates the samples, where the separation principle is to maximize the margin, i.e., the distance from the boundary to the edge points of the dataset. This ultimately transforms into a convex quadratic programming problem for solution [15,16,17].
Let the training data be X = { x 1 , x 2 , , x n } , with labels Y = { y 1 , y 2 , , y n } . Then the training sample set D can be represented as
D = { ( x 1 , y 1 ) , ( x 2 , y 2 ) , ( x n , y n ) }
Given D, let ω = [ ω 1 , ω 2 , , ω n ] T be an n-dimensional vector. The hyperplane can be described by the following linear equation
ω T x + b = 0
where ω is the weight vector, x and b are the bias terms. It can be mathematically proven that the distance from a support vector to the hyperplane is
γ = 1 | | ω | |
To maximize this distance, one only needs to minimize | | ω | | .
For linearly inseparable problems, feature transformation via kernel functions can be employed to add new features, thereby converting a low-dimensional linearly inseparable problem into a high-dimensional linearly separable one. Commonly used kernel functions include the linear kernel, polynomial kernel, and radial basis function (RBF) kernel.
The linear kernel does not perform dimensionality lifting through a kernel function; it seeks a linear decision boundary in the original feature space and is mainly applicable to linearly separable problems.
The polynomial kernel performs dimensional lifting by adding higher-order features. However, when the polynomial degree is high, the computational complexity increases significantly. Its expression is given by
K ( x , y ) = ( α x T y + c ) d
In the expression above, α represents a tuning parameter, d is the highest-order term, and c is an optional constant.
The radial basis function (RBF) kernel is highly flexible and widely used. Compared with the polynomial kernel, it has fewer parameters and often achieves better performance. Therefore, when the optimal kernel function is uncertain, the RBF kernel is usually validated first. Because it resembles the Gaussian function, it is also referred to as the Gaussian kernel. Its expression is given by
K ( x , y ) = exp ( | | x y | | 2 2 h 2 )
where a larger h2 makes the Gaussian kernel smoother, resulting in higher bias and variance, poorer generalization ability, and a greater risk of overfitting. Conversely, a smaller h2 leads to more rapid changes in the Gaussian kernel, lower bias and variance, and higher sensitivity to noisy samples.
Traditional SVM models often employ a single kernel function, but such a mono-kernel structure limits the model’s generalization capability in complex operational environments. To address the issue of blurred classification boundaries in the assessment of the Operational Safety of UAVs, a battlefield-complexity-driven ensemble kernel function is proposed, which combines the Gaussian kernel with the polynomial kernel in a weighted manner. Its mathematical form is
K ( x , y ) = ω h e x p ( x y 2 2 h 2 ) + ( 1 ω h ) ( x T y + c ) d
In the expression above, ωh denotes the dynamic weight coefficient. Parameters h, c, and d represent the hyperparameters of the Gaussian kernel and the polynomial kernel, respectively. The first term corresponds to the Gaussian kernel function, while the second term corresponds to the polynomial kernel function. K(x,y) denotes the combined kernel function; x is the feature vector of the sample to be evaluated, and y is the feature vector from the training dataset. The operator exp(⋅) denotes the natural exponential function, which maps the sample distances in low-dimensional space into similarity measures in high-dimensional space through an exponential form, thereby enabling nonlinear capture of local features. The hyperparameter h of the Gaussian kernel is a key parameter controlling the local influence range of the kernel, which determines the model’s sensitivity to local variations among samples. The hyperparameter c of the polynomial kernel is introduced to avoid the kernel value equaling zero when the input is zero, thus enhancing the model’s ability to capture weakly correlated features. The parameter d controls the nonlinearity degree of the polynomial kernel, determining the model’s capacity to characterize global feature interactions. Finally, T denotes the vector transpose operator, which converts a column vector into a row vector to ensure dimensional compatibility in inner product operations.
Based on the battlefield complexity index Ct, calculated by the sliding window entropy, this index is defined as the weighted standard deviation of feature entropy. The dynamic adjustment of ωh is given by
ω h = 1 1 + e x p ( k ( C t C 0 ) )
where C0 is the complexity threshold, and k is the tuning factor. When Ct > C0, the operational environment is classified as a high-complexity scenario, and increasing ωh enhances the local responsiveness of the Gaussian kernel. Conversely, when CtC0, the operational environment is considered a low-complexity scenario, and decreasing ωh improves the global fitting performance of the polynomial kernel.

4.3. Improve Multi Classification Algorithm

Given that the operational safety assessment of the UAV is inherently a multi-class classification problem, while traditional SVM models are limited to binary classification tasks, it is necessary to adopt multi-class algorithms to effectively predict the four safety levels. The mainstream strategies can be categorized into One-vs-One (OvO) and One-vs-All (OvA) approaches. In addition, several improved methods have been proposed, such as the direct multi-class SVM (Crammer–Singer, CS) model and decision-tree-based hierarchical structures (DAG-SVM, DS) [18,19,20,21,22].
The core idea of OvO is to train an independent binary SVM for every pair of classes, with the final prediction determined by a majority voting mechanism. This method requires fewer data subsets during training and can effectively handle nonlinear decision boundaries; however, it incurs high computational costs during prediction, particularly when the sample size is large.
In contrast, the OvA strategy trains a binary classifier for each class by treating the target class as positive and all others as negative. During prediction, the decision function values from all classifiers are computed, and the class with the maximum score is chosen as the output. OvA offers lower training complexity and computational costs, making it suitable for scenarios with relatively balanced class distributions. However, when sample imbalance exists, OvA is prone to classification ambiguities, which may compromise accuracy.
The CS model takes a fundamentally different approach by directly defining a multi-class loss function and jointly learning all class discriminant functions. Its core principle is to maximize the margin between the correct class score and the maximum score of all incorrect classes. The CS model is particularly suitable for high-dimensional, low-class-number problems requiring high real-time performance, but its reliance on linear separability limits its applicability in strongly nonlinear scenarios.
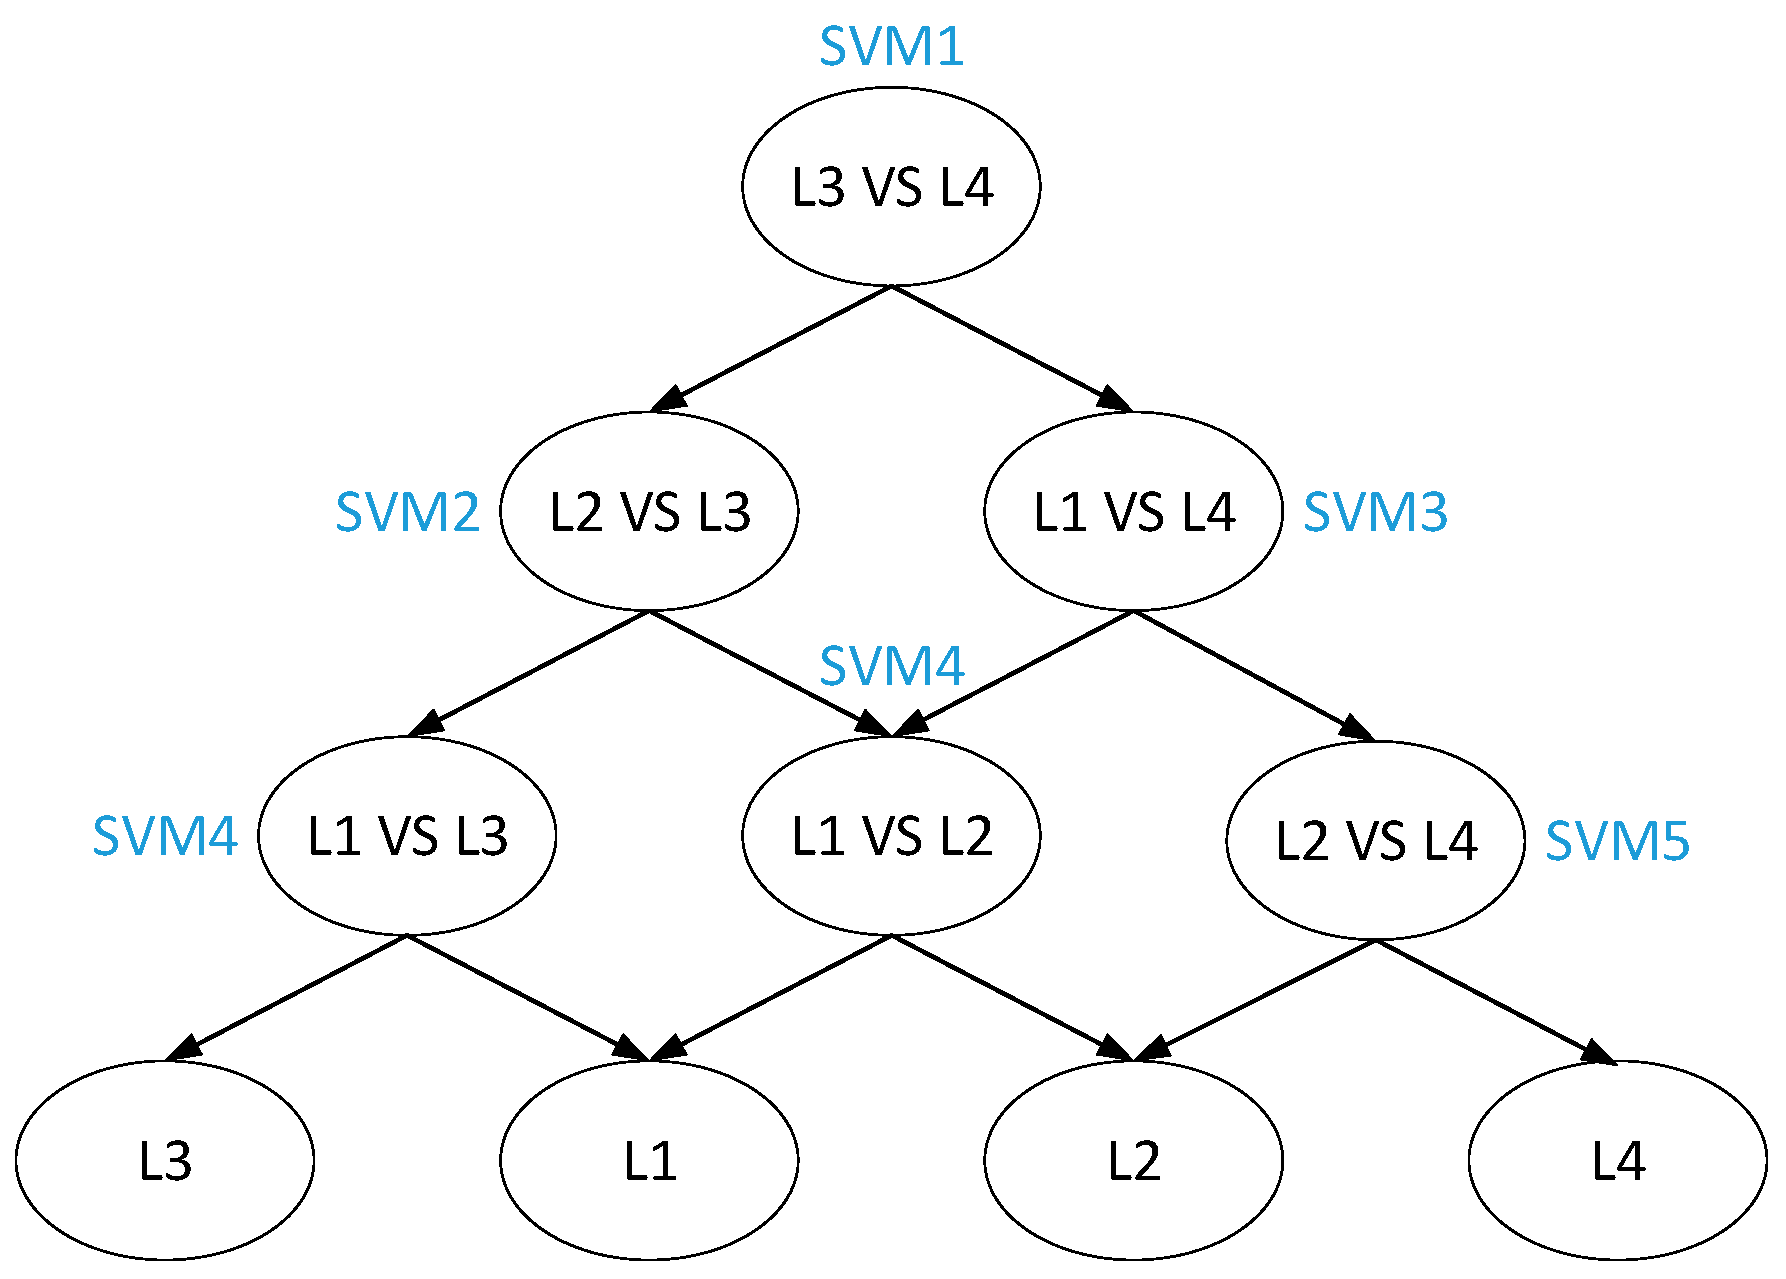
The DS model is an efficient prediction strategy built upon OvO classifiers. While its training process is identical to OvO, prediction does not rely on majority voting. Instead, the K(K − 1)/2 classifiers are organized into a binary decision tree. During prediction, the input sample traverses the tree from the root node, eliminating categories step by step until reaching a leaf node. For a four-class problem, this design requires at most three binary decisions, significantly reducing computational costs during prediction. A detailed comparison of these multi-class algorithms is summarized in Table 5.
To further address the issue of blurred classification boundaries in the operational safety assessment of the UAV, the DS strategy is selected as the optimal hierarchical structure for multi-class classification, as illustrated in Figure 4. In the DS framework, each node processes only one pairwise class boundary, enabling the use of locally optimal classifiers and kernel functions to maximize the efficiency of the hybrid-kernel mechanism. By adopting a hierarchical elimination process, the algorithm reduces the complexity of the four-class prediction task from six pairwise comparisons in OvO to only three, while retaining the advantages of high training efficiency for individual SVMs and fast overall prediction speed.
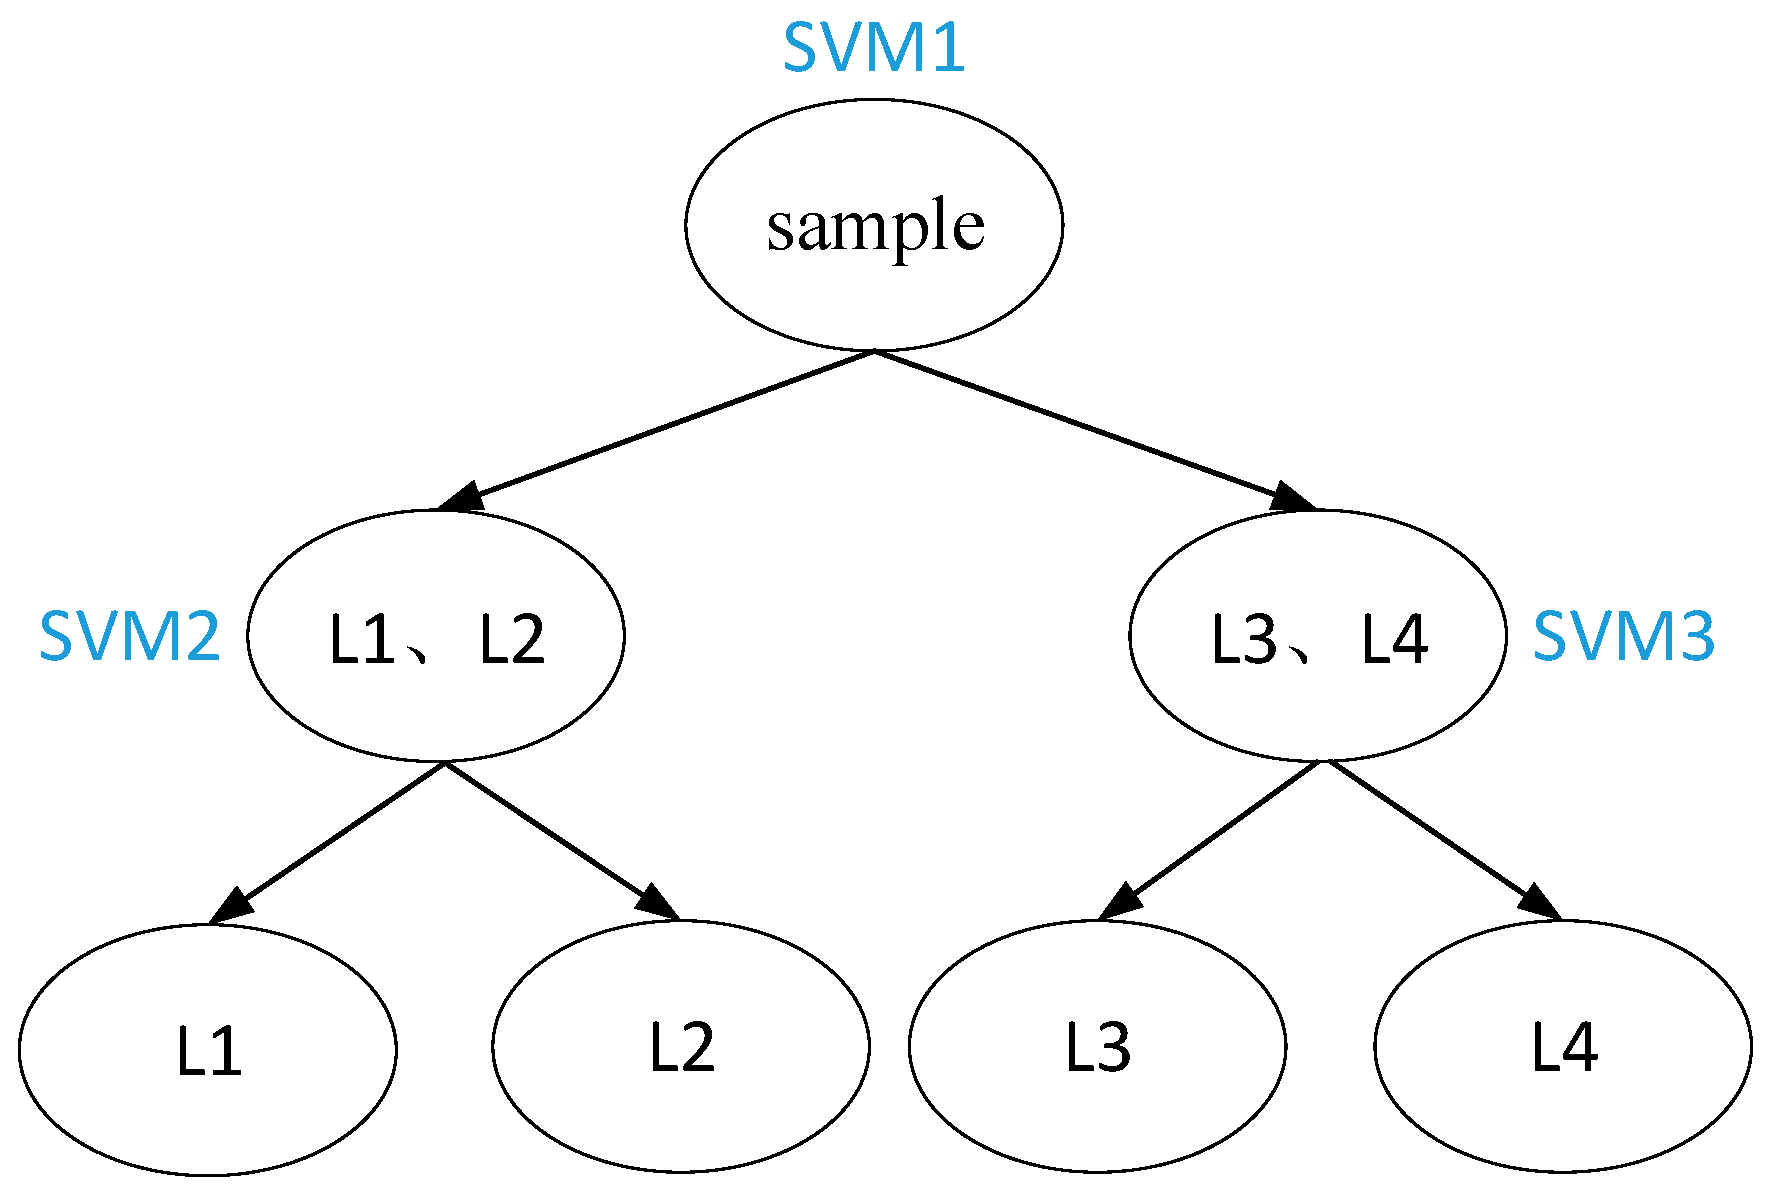
Although DAG-SVM offers high prediction efficiency, its root node exerts a disproportionate influence on the final decision, and the approach requires a relatively large number of SVMs. To mitigate these issues and reduce model complexity while preserving the binary-tree elimination paradigm, we redesign the structure to perform layer-wise binary partitioning of indicators at each level. In the four-class setting, this refinement requires only three SVMs to complete the classification (cf. Figure 5), thereby decreasing the decision dependence on the root node and improving robustness, yet retaining the fast inference characteristic of DAG-style traversal.
The improved DS algorithm establishes a low-redundancy, clearly structured multi-class prediction framework. While retaining the advantages of the original DS approach—progressive class elimination, well-defined decision boundaries, and efficient traversal paths—it significantly reduces model redundancy and computational overhead. Moreover, by alleviating the over-reliance on root-node decisions, it effectively mitigates the risk of misclassification at the initial stage. This refined architecture thus represents the most practically valuable multi-class classification scheme for the operational safety assessment of UAVs.

5. Combat Simulation and Evaluation Verification Analysis

Based on the Index System established in Section 2 for the assessment of The Operational Safety, four different safety levels of the UAV are selected. An improved SVM-based evaluation model is employed to validate the assessment results.

5.1. Operational Planning

In a regional conflict hotspot, the Blue force deploys high-value, time-sensitive targets with rapid maneuvering capability, capable of conducting swift strikes against the Red forward units and critical facilities. The fleeting strike opportunities demand immediate responses. The Red force, therefore, relies on a UAV to engage these time-sensitive targets, aiming to neutralize the threat while countering Blue’s diverse attack means, thereby creating a secure environment for subsequent operational operations.

5.1.1. Force Deployment

The Red force deploys two UAVs equipped with high-definition electro-optical/infrared reconnaissance payloads, synthetic aperture radar (SAR), and laser designators. They are armed with air-to-ground missiles and small precision-guided bombs, possessing long-endurance cruising and integrated reconnaissance–strike capabilities, capable of performing search-and-strike tasks independently or in coordination. Ground support includes one ground control center with a multi-source intelligence fusion system and anti-jamming communication links. Intelligence support is provided by early warning aircraft and reconnaissance satellites, while the electronic warfare unit offers communication jamming detection and satellite navigation suppression to secure the electromagnetic environment for UAV operations.
The Blue force deploys two highly mobile missile launch vehicles and one command vehicle, functioning as time-sensitive targets with the ability to relocate rapidly and complete missile-launch preparations within short time frames. They operate in a mixed terrain of hills and highways in the western part of the theater. Their countermeasures include firepower, directed-energy weapons, and electronic attacks: firepower is provided by two forward-deployed self-propelled howitzers and one short-range air-defense system; directed-energy weapons include a vehicle-mounted laser interception system and a microwave jamming device; electronic warfare measures consist of communication jammers, satellite navigation spoofing equipment, radar jammers, and data-link deception terminals, all designed to interfere with or deceive UAV communications, navigation, radar, and command signals.

5.1.2. Combat Process

Mission preparation and takeoff. The ground control center completes mission data loading and pre-flight inspection. UAVs conduct taxiing, takeoff, and climb, entering the outer patrol route of the theater. During this phase, the Blue side may activate satellite navigation spoofing, while the Red side enables anti-spoofing algorithms for trajectory correction.
Search orbiting. Upon entering the target area, the UAV conducts figure-eight orbits for search, alternating between electro-optical payloads and SAR scanning over the hilly road terrain. Blue may activate radar and communication jamming systems; in response, Red initiates radar anti-jamming modes and microwave self-organizing networks to maintain reconnaissance and command transmission.
Transition to attack. Once SAR detects a suspected convoy and electro-optical payloads confirm target features, the UAV exits orbiting, adjusts course, and maneuvers into attack position. Blue may employ short-range air-defense and laser interception systems; Red responds with evasive maneuvers and laser-resistant payload protection.
Engagement. Upon reaching attack position, the UAV locks the target with a laser designator and launches air-to-ground missiles, followed by a second wave of precision-guided bombs. Blue may deploy microwave jamming and link-deception terminals; Red counters with electromagnetic shielding, switching to pre-programmed autonomous attack mode if abnormal command signals are detected.
Withdrawal and return. After missile impact and damage assessment, the UAV disengages, returns via patrol routes, and initiates descent near the theater boundary. Blue may engage with self-propelled artillery and communication jamming, while Red uses early warning intelligence to plan detour routes and ensure secure data transmission.
Recovery and landing. UAVs loiter over the recovery airfield awaiting landing clearance. Upon mission confirmation, the ground control center authorizes landing. Blue may continue satellite navigation jamming, while Red secures safe landing with localized navigation systems.

5.2. Simulation of Offensive–Defensive Confrontation Based on ABMS

To effectively evaluate the anti-attack capability of the UAV in complex operational environments, this study employs Agent-Based Modeling and Simulation (ABMS) to construct confrontation scenarios, thereby obtaining quantitative values for indicators [23,24]. The ABMS approach is particularly suitable for modeling systems such as the UAV, which exhibit high uncertainty and intelligent responsiveness. It enables the representation of the dynamic behavioral evolution of agents in interactive environments, thereby providing behavior-driven quantitative data for complex indices.
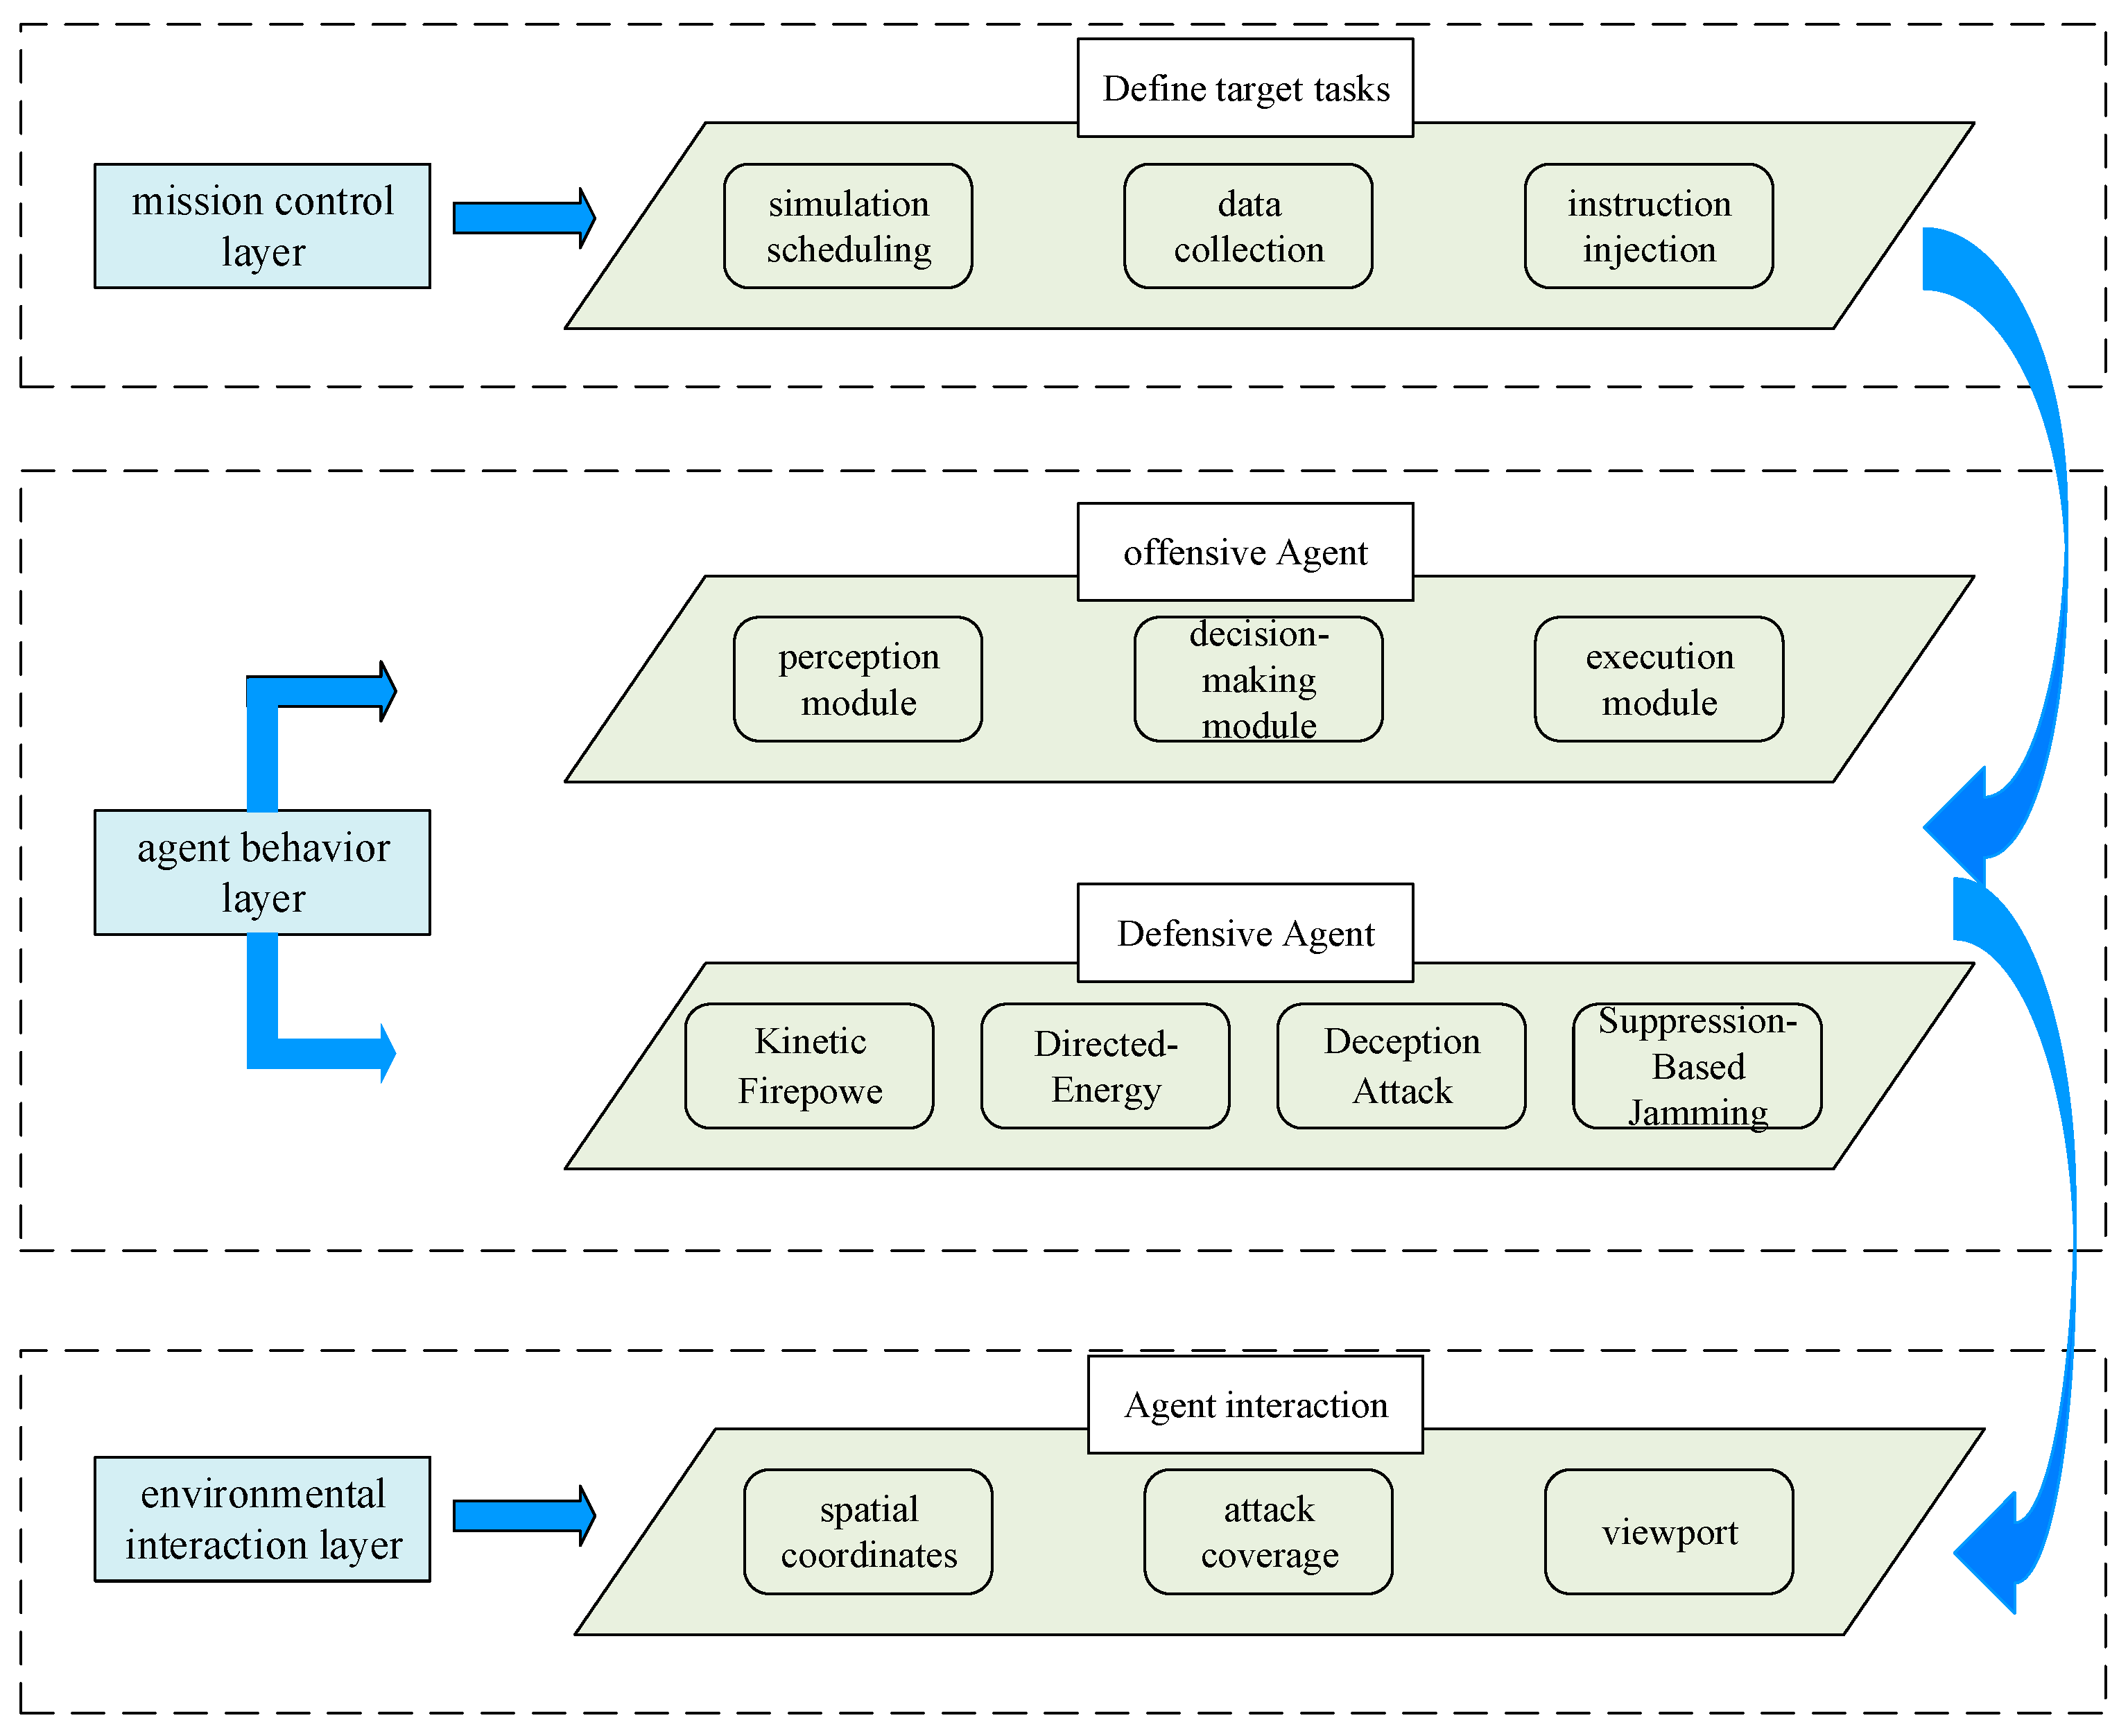
The agent model is structured into three hierarchical layers: the mission control layer, the agent behavior layer, and the environmental interaction layer (Figure 6). The mission control layer includes a simulation scheduling module for time progression and state synchronization, a data collection module for recording simulation data, and an instruction injection module for setting battlefield conditions and contingencies. The agent behavior layer consists of two categories of agents: offensive agents, represented by the UAV, and defensive agents, represented by adversarial defense systems. Offensive agents include a perception module (sensors, interference detection, threat recognition), a decision-making module (path planning, target assessment, autonomous evasion), and an execution module (strike operations, flight adjustment). Defensive agents are autonomous entities with their own states, behavioral rules, and the ability to exchange perception information. The environmental interaction layer defines how offensive and defensive agents interact, including two- and three-dimensional visual domains and attack zones.

5.2.1. The Offensive Agent

The offensive agent, as the intelligent control core of the UAV, consists of three functional modules: perception, decision-making, and execution (Figure 7). The perception module serves as the first interface with the battlefield, handling critical tasks such as target recognition and threat detection. Sub-units include a target recognition unit for high-value enemy targets, radar/laser sensing for ground threats, signal integrity detection for communication stability, and GPS confidence evaluation for navigation interference.
The decision-making module acts as the central processing unit, converting perception data into executable strategies. It includes a path planning engine that dynamically generates optimal trajectories based on geographic, threat, and navigation data; a risk evaluator for analyzing enemy density and interference; a target strike determiner for timing and strike mode; and an action selector that integrates mission demands, residual energy, and risk assessments to select optimal strategies.
The execution module serves as the actuator, implementing flight control, strike control, and evasive maneuvers. Specifically, flight control manages altitude and speed, strike control triggers weapon systems upon target confirmation, and evasive control activates autonomous avoidance behaviors when threats are detected. Together with perception and decision-making, the execution module forms a closed-loop system for efficient information-to-action control.

5.2.2. The Defensive Agent

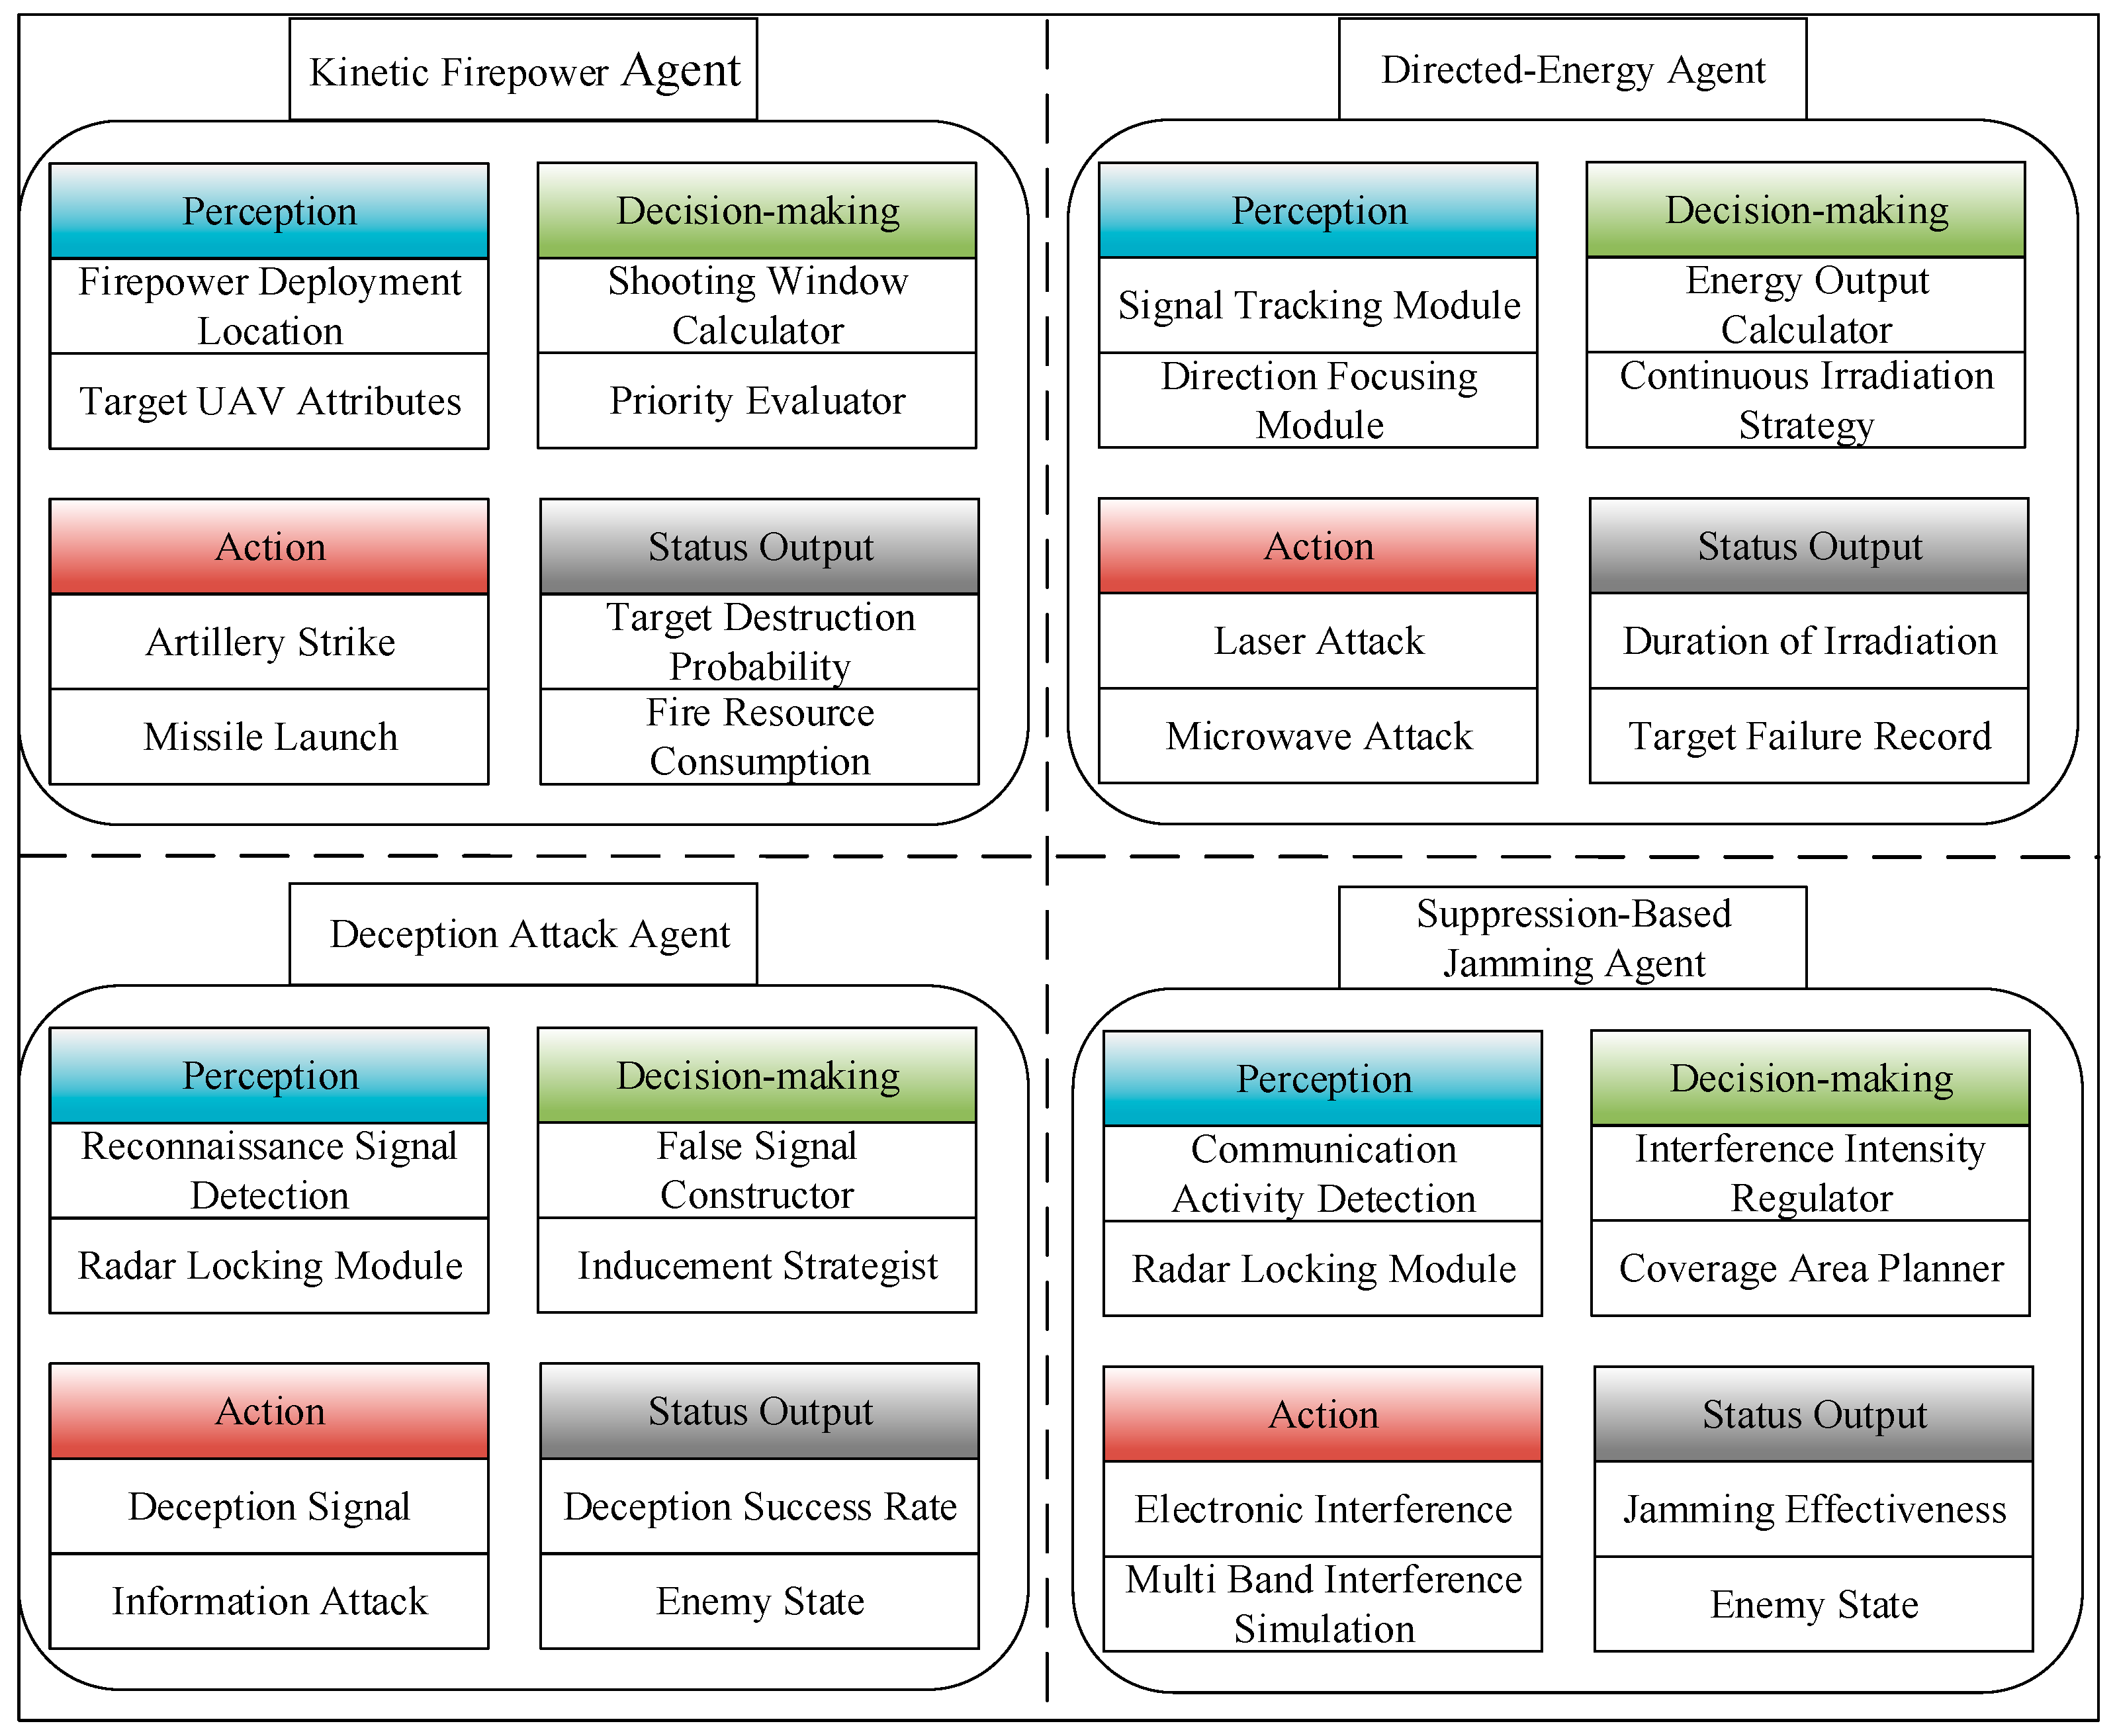
Defensive agents simulate adversarial multi-source threat systems and are categorized into four functional types: firepower strike, directed-energy weapons, deception systems, and suppression jamming (Figure 8). Each agent includes four components: perception, decision-making, action, and status output.
The perception unit gathers battlefield information such as enemy positions and trajectory. The decision-making unit selects responses including strike initiation, jamming waveform, deception parameters, and electromagnetic power levels. The action module executes commands such as fire strikes, directed-energy attacks, deception, and electronic interference. The status output module dynamically generates threat response states, which are mapped to operational safety indices: resistance to firepower attacks, directed-energy attacks, deception attacks, and suppression jamming. These serve as input features for the SVM model to support classification of The Operational Safety levels.
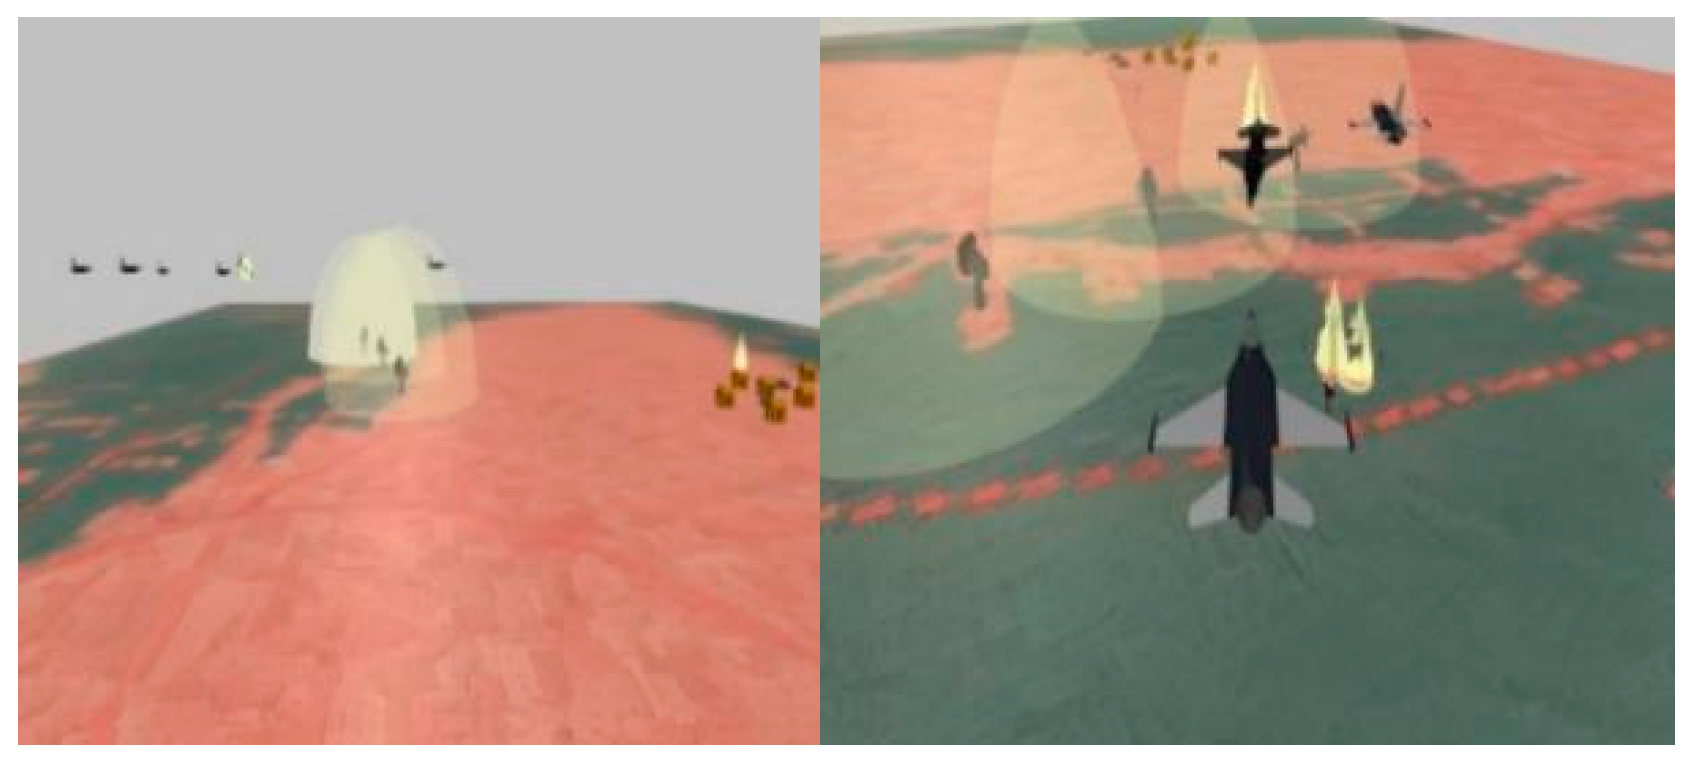
Compared with other agent-based simulation platforms, AnyLogic provides multi-method modeling capabilities, strong visualization, and extensibility, satisfying multi-level and multi-dimensional simulation requirements. It also offers intuitive representation and validation of simulation processes. Therefore, AnyLogic is selected as the implementation platform for the ABMS model (Figure 9).

5.3. Validation of the Evaluation Model

To verify the effectiveness and practicality of the proposed method, this section utilizes the obtained quantitative indicator values. After normalization, the indicator data are used to construct an SVM training dataset, as shown in Table 6. To ensure correctness and reliability of the labels, three domain experts independently reviewed 20% of the dataset. The agreement between rule-based labels and expert judgments was high, indicating substantial inter-rater reliability. Since the labels were generated through a rule-based scheme and validated by domain experts, the classifier’s predictions can be interpreted as meaningful safety constructs rather than artifacts of simulation design.
These training samples are then fed into the improved SVM model for training and validation. According to Equations (1)–(4), the feature-weighted reconstructed samples are generated through the following procedure:
Step 1: The sliding window length is set to T = 5, including five historical samples to capture short-term variations in feature values. Model parameters are configured as follows: forgetting factor λ = 0.9, smoothing coefficient ε = 0.1, weight smoothing factor α = 0.7, gradient threshold τ = 1.5, time interval Δt = 1, and initial historical weight ωi(0) = 0.0833.
Step 2: For each continuous feature value, three discrete intervals are defined to facilitate probability statistics and weight estimation: [0, 0.33), [0.33, 0.66), and [0.66, 1.0].
Step 3: Within each sliding window, the frequency of each feature value in the three intervals is counted, denoted as n1, n2, and n3. The total weighted frequency ∑nj is then obtained, and the Laplace-smoothed probabilities p ^ 1 ~ p ^ 3 are calculated using Equation (7).
Step 4: The entropy variation of each feature is calculated using Equation (6). Subsequently, the double-exponential smoothing weights are updated according to Equation (8), yielding the feature weight values ωi(t).
Step 5: After weight updating, each original feature value in the training samples is multiplied by its corresponding updated weight ωi(t), producing the reconstructed weighted samples. These processed samples are then utilized for SVM training, as presented in Table 7.
Step 6: To determine whether feature-weight reorganization is required, the entropy variation gradient ΔHA is computed between the current and historical windows using Equation (9). By comparing ΔHA with the threshold, the necessity of feature reorganization is assessed.
It should be noted that Table 6 and Table 7 only provide illustrative examples of raw and processed data, respectively. The complete dataset used in this study consists of 1500 samples in total, with class distributions of L1: 225, L2: 450, L3: 525, and L4: 300. The labeling of the dataset into L1–L4 categories was performed using a rule-based scheme derived from the criteria in Table 4, which was subsequently reviewed and verified by three domain experts to ensure consistency and correctness.
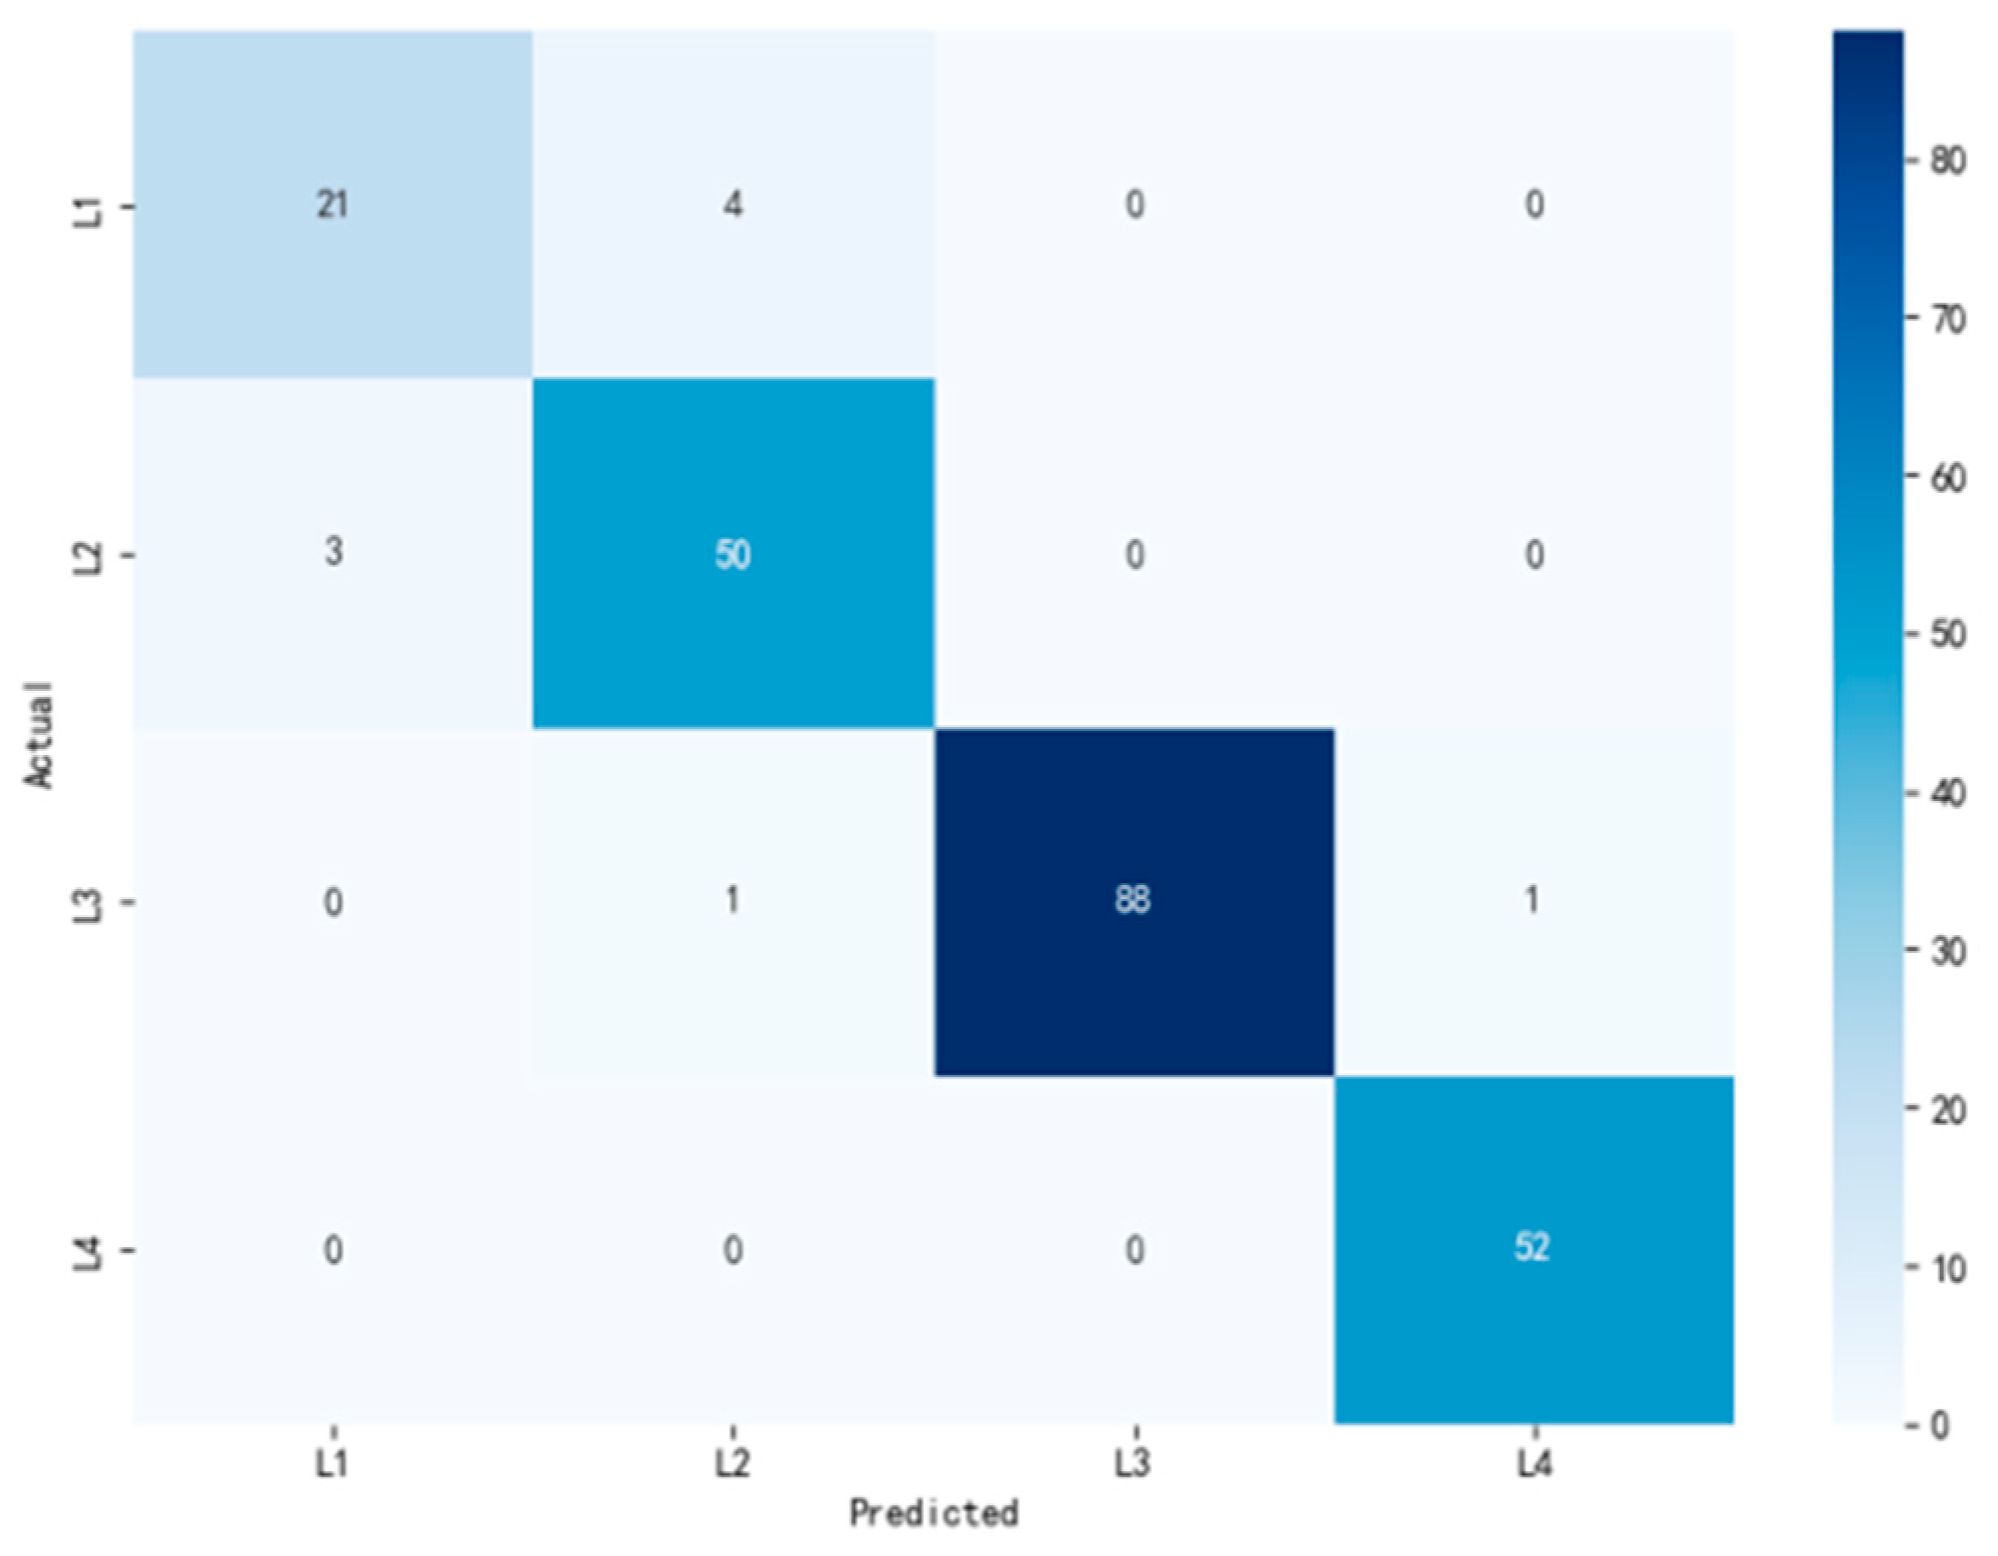
The processed dataset was divided into 80% for training and 20% for testing and subsequently input into the hybrid-kernel SVM model for training and validation. The classification report is presented in Figure 10. As shown, the model exhibits excellent performance on the test samples, achieving an overall accuracy of 96%, with macro- and weighted-average F1-scores of 0.94 and 0.96, respectively, indicating balanced predictive performance across different levels of The Operational Safety. Classifications of L3 and L4 are nearly perfect, while L2 demonstrates stable recognition despite being a region prone to ambiguity in safety assessment. The recall rate of L1 is relatively low, primarily due to the small number of samples representing the safest category and its susceptibility to confusion under low-risk disturbances.
The confusion matrix in Figure 11 further illustrates the differentiated model performance across the four safety levels. For L4, true positives (TP) reach 52 with no false positives (FP), achieving perfect classification. For L3, precision is also outstanding, with only one misclassification each into L2 and L4, likely due to blurred boundary features. By contrast, L1 and L2 exhibit more pronounced cross-misclassifications: 4 cases of L1 → L2 (16%) and 3 cases of L2 → L1 (5.66%), revealing partial overlap in their feature spaces.
To ensure external validity, we conducted stratified 10-fold cross-validation in addition to the 80/20 hold-out split. This prevents potential artifacts caused by small-sample effects or class imbalance. To further ensure the reliability of the experimental outcomes, all experiments were repeated independently 10 times. The reported results are expressed as mean values with their corresponding 95% confidence intervals (CI). In addition, paired t-tests were performed to compare the improved SVM with the baseline models. The results confirm that the improvements are statistically significant (p < 0.05) across all evaluation metrics, demonstrating that the observed performance gains are robust and not attributable to random fluctuations.
These findings demonstrate that the improved SVM model, enhanced by an entropy-driven dynamic feature weighting mechanism, achieves a 96% overall accuracy in classifying the operational safety levels of the UAV. Detection at lower safety levels is nearly flawless, validating the superiority of the entropy-driven architecture in identifying core threats. However, higher safety levels still face challenges of feature space overlap and data imbalance. Future research will address these issues by employing adversarial sample generation, leveraging generative adversarial networks (GANs) to synthesize boundary-critical samples. To systematically address the imbalance problem, we applied cost-sensitive learning by assigning higher misclassification penalties to the L1 class. Additionally, experiments with SMOTE-based oversampling were conducted, confirming that performance gains are consistent across different imbalance mitigation strategies. This will compel the model to learn more robust decision boundaries, thereby enabling comprehensive operational safety evaluation of the UAV under contested environments.

5.4. Analysis of the Evaluation Results

Taking the reconnaissance–strike UAV as the evaluation object within a combat scenario, the operational safety level was assessed using the improved SVM model. The assessment incorporated actual parameters from its time-sensitive target strike mission, as summarized in the table. The evaluation indicators covered four dimensions: operators, UAV platform, flight environment, and mission profile. The corresponding sample data are presented in Table 8.

5.4.1. Result Analysis

Figure 12 illustrates the sensitivity analysis for the four main hyper-parameters (T, λ, α, τ). The results indicate that the proposed model remains robust within a reasonable range of parameter variations. In particular, performance is stable when T ∈ [4, 6], λ ∈ [0.8,0.9], α ∈ [0.6, 0.8], and τ ∈ [1.3, 1.6]. This confirms that the reported improvements are not overly sensitive to fine-tuning of hyper-parameters.
The evaluation results indicate that, among ten test samples, nine were classified as safety level L2 and one as L3, thus assigning the UAV an overall operational safety level of L2. The single misclassification occurred in the eighth sample, caused by a minor fluctuation in the weapon safety index C4 due to a change in weapon load configuration. Because the training dataset contained an insufficient proportion of non-standard load samples, the model developed an overly sensitive classification logic toward dynamic weapon changes, erroneously interpreting transient fluctuations during configuration adjustment as a degradation in safety level. This outcome confirms the model’s overall effectiveness in identifying L2-level scenarios, while also highlighting the need to enhance robustness against unconventional weapon configurations.
According to the improved SVM model, the UAV’s operational safety level in this mission is determined to be L2–high protection. This level indicates that the UAV can withstand Level I + Level II threat combinations, such as a single type of directed-energy attack combined with medium-intensity electronic interference, while remaining vulnerable in highly complex electromagnetic deception scenarios. To mitigate this risk, multi-source navigation fusion should be strengthened to reduce reliance on a single satellite navigation system. Additionally, upgrading the link encryption protocol with dynamic key generation can increase the command verification success rate to above 95%, thereby countering spoofing attacks from adversarial link-deception terminals.
From a mission planning perspective, UAVs should avoid high-risk areas where ≥3 types of Level I threats overlap. If entry into such areas is unavoidable, temporary deployment of electronic warfare support units for active suppression should be considered, ensuring that the UAV’s operational safety level can be temporarily elevated to L1 protection.

5.4.2. Comparison of Evaluation Results

To better understand the contribution of each component in the improved SVM, we conducted ablation experiments by incrementally adding entropy weighting, the hybrid kernel, and the improved DAG-SVM. The results in Table 9 indicate that each component contributes positively to the final performance. Entropy weighting improves feature discrimination, the hybrid kernel enhances non-linear representation, and the improved DAG-SVM optimizes multi-class classification efficiency. The combination of all three leads to the best overall accuracy and F1-score.
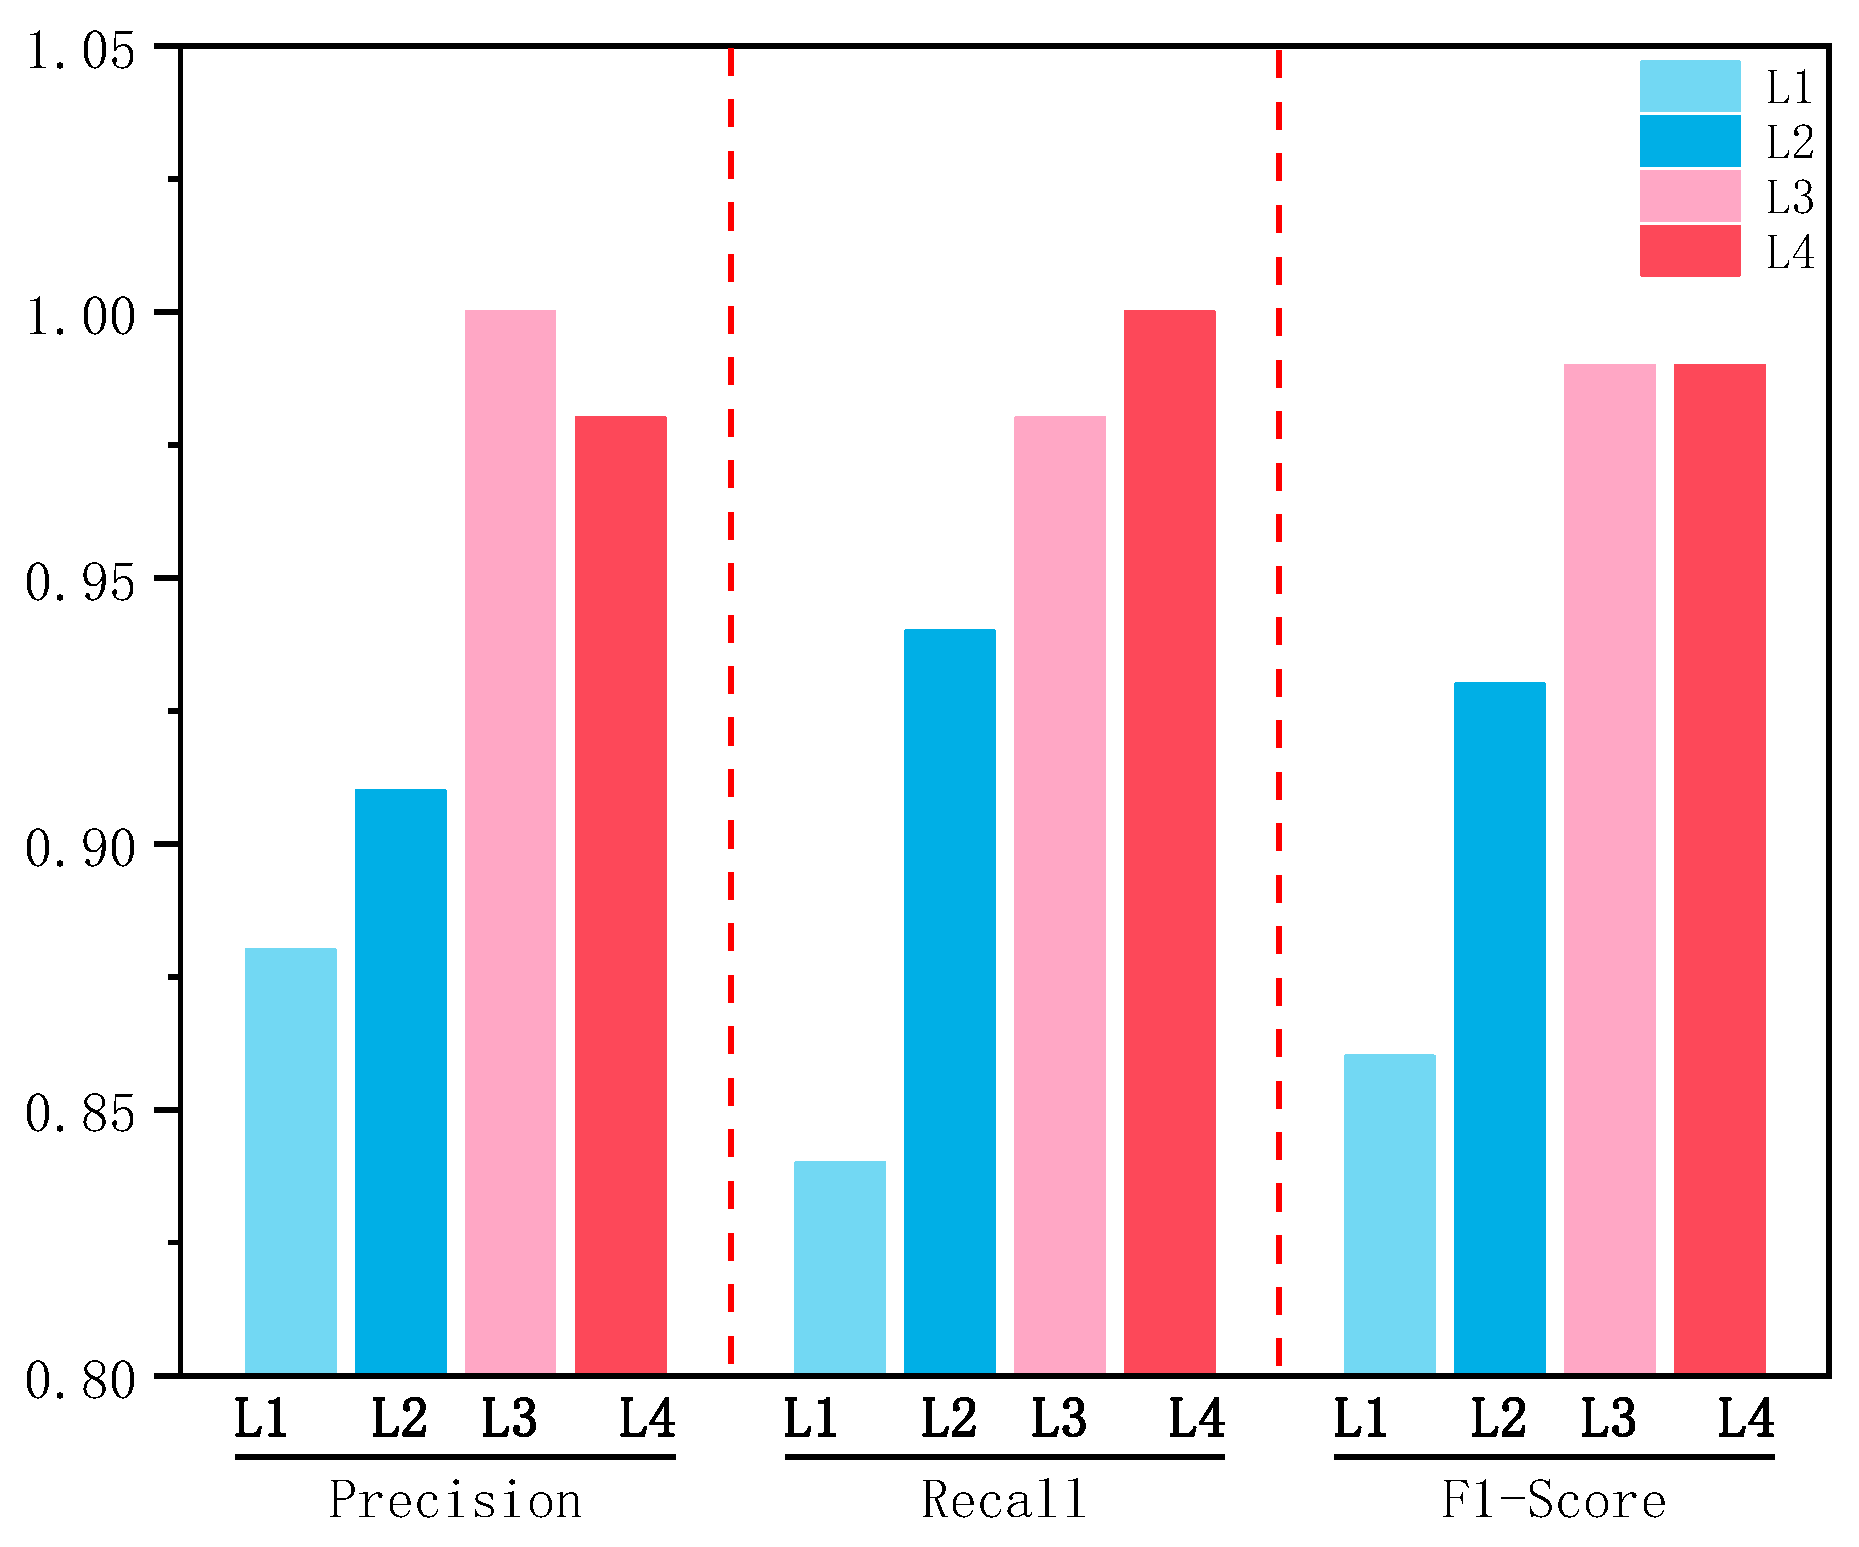
The comparative results between the improved SVM and the traditional SVM in terms of key classification metrics are shown in Figure 13. The improved SVM achieves an overall accuracy of 96%, representing an improvement of 11 percentage points over the traditional SVM. Its macro-average F1-score reaches 0.94, which is 20.5% higher than the baseline, indicating a significant enhancement in classification balance. Notably, the recall rate for L1 increases from 65% to 84%, reflecting the adaptive capability of the entropy-driven dynamic weighting mechanism for minority classes. The experimental results demonstrate that the improved SVM achieves consistently higher accuracy, recall, and F1 scores compared to the baseline SVM. This improvement is primarily attributed to the entropy-based feature weighting, which enhances the discriminative power of relevant variables, and the systematic optimization of SVM hyperparameters, which improves the model’s generalization ability.
To further validate the effectiveness of the proposed improved SVM model, we conducted comparative experiments against several commonly used baseline classifiers. Recent work by Chechkin, Pleshakova, and Gataullin (2025) introduced a Hybrid KAN-BiLSTM Transformer with multi-domain dynamic attention for cybersecurity tasks [25]. Their results highlight the effectiveness of combining kernel adaptive networks with recurrent and attention-based architecture, providing a relevant benchmark for our study. Specifically, Logistic Regression, Random Forest, Convolutional Neural Network and Long Short-Term Memory Network were implemented as benchmark methods. All models were trained and evaluated on the same dataset under identical experimental conditions. The results, summarized in Table 10, demonstrate that the improved SVM consistently outperformed the baseline models across all metrics.
Figure 14 compares the computational efficiency under different dataset sizes. When the sample size increases from 500 to 1500, the training time of the improved SVM rises from 8 s to 15 s (an increase of 87.5%), whereas the traditional SVM increases from 15 s to 35 s (an increase of 133.3%). This improvement stems from the sliding-window entropy mechanism of the improved SVM, which updates feature weights iteratively with local data rather than recalculating the entire dataset. Furthermore, at a sample size of 1500, the prediction speed of the improved SVM remains at 100 samples/s, doubling the performance of the traditional SVM. This advantage is attributed to the modified DAG-SVM multiclass algorithm, which reduces the number of four-class comparisons from six to three, thereby lowering decision complexity.
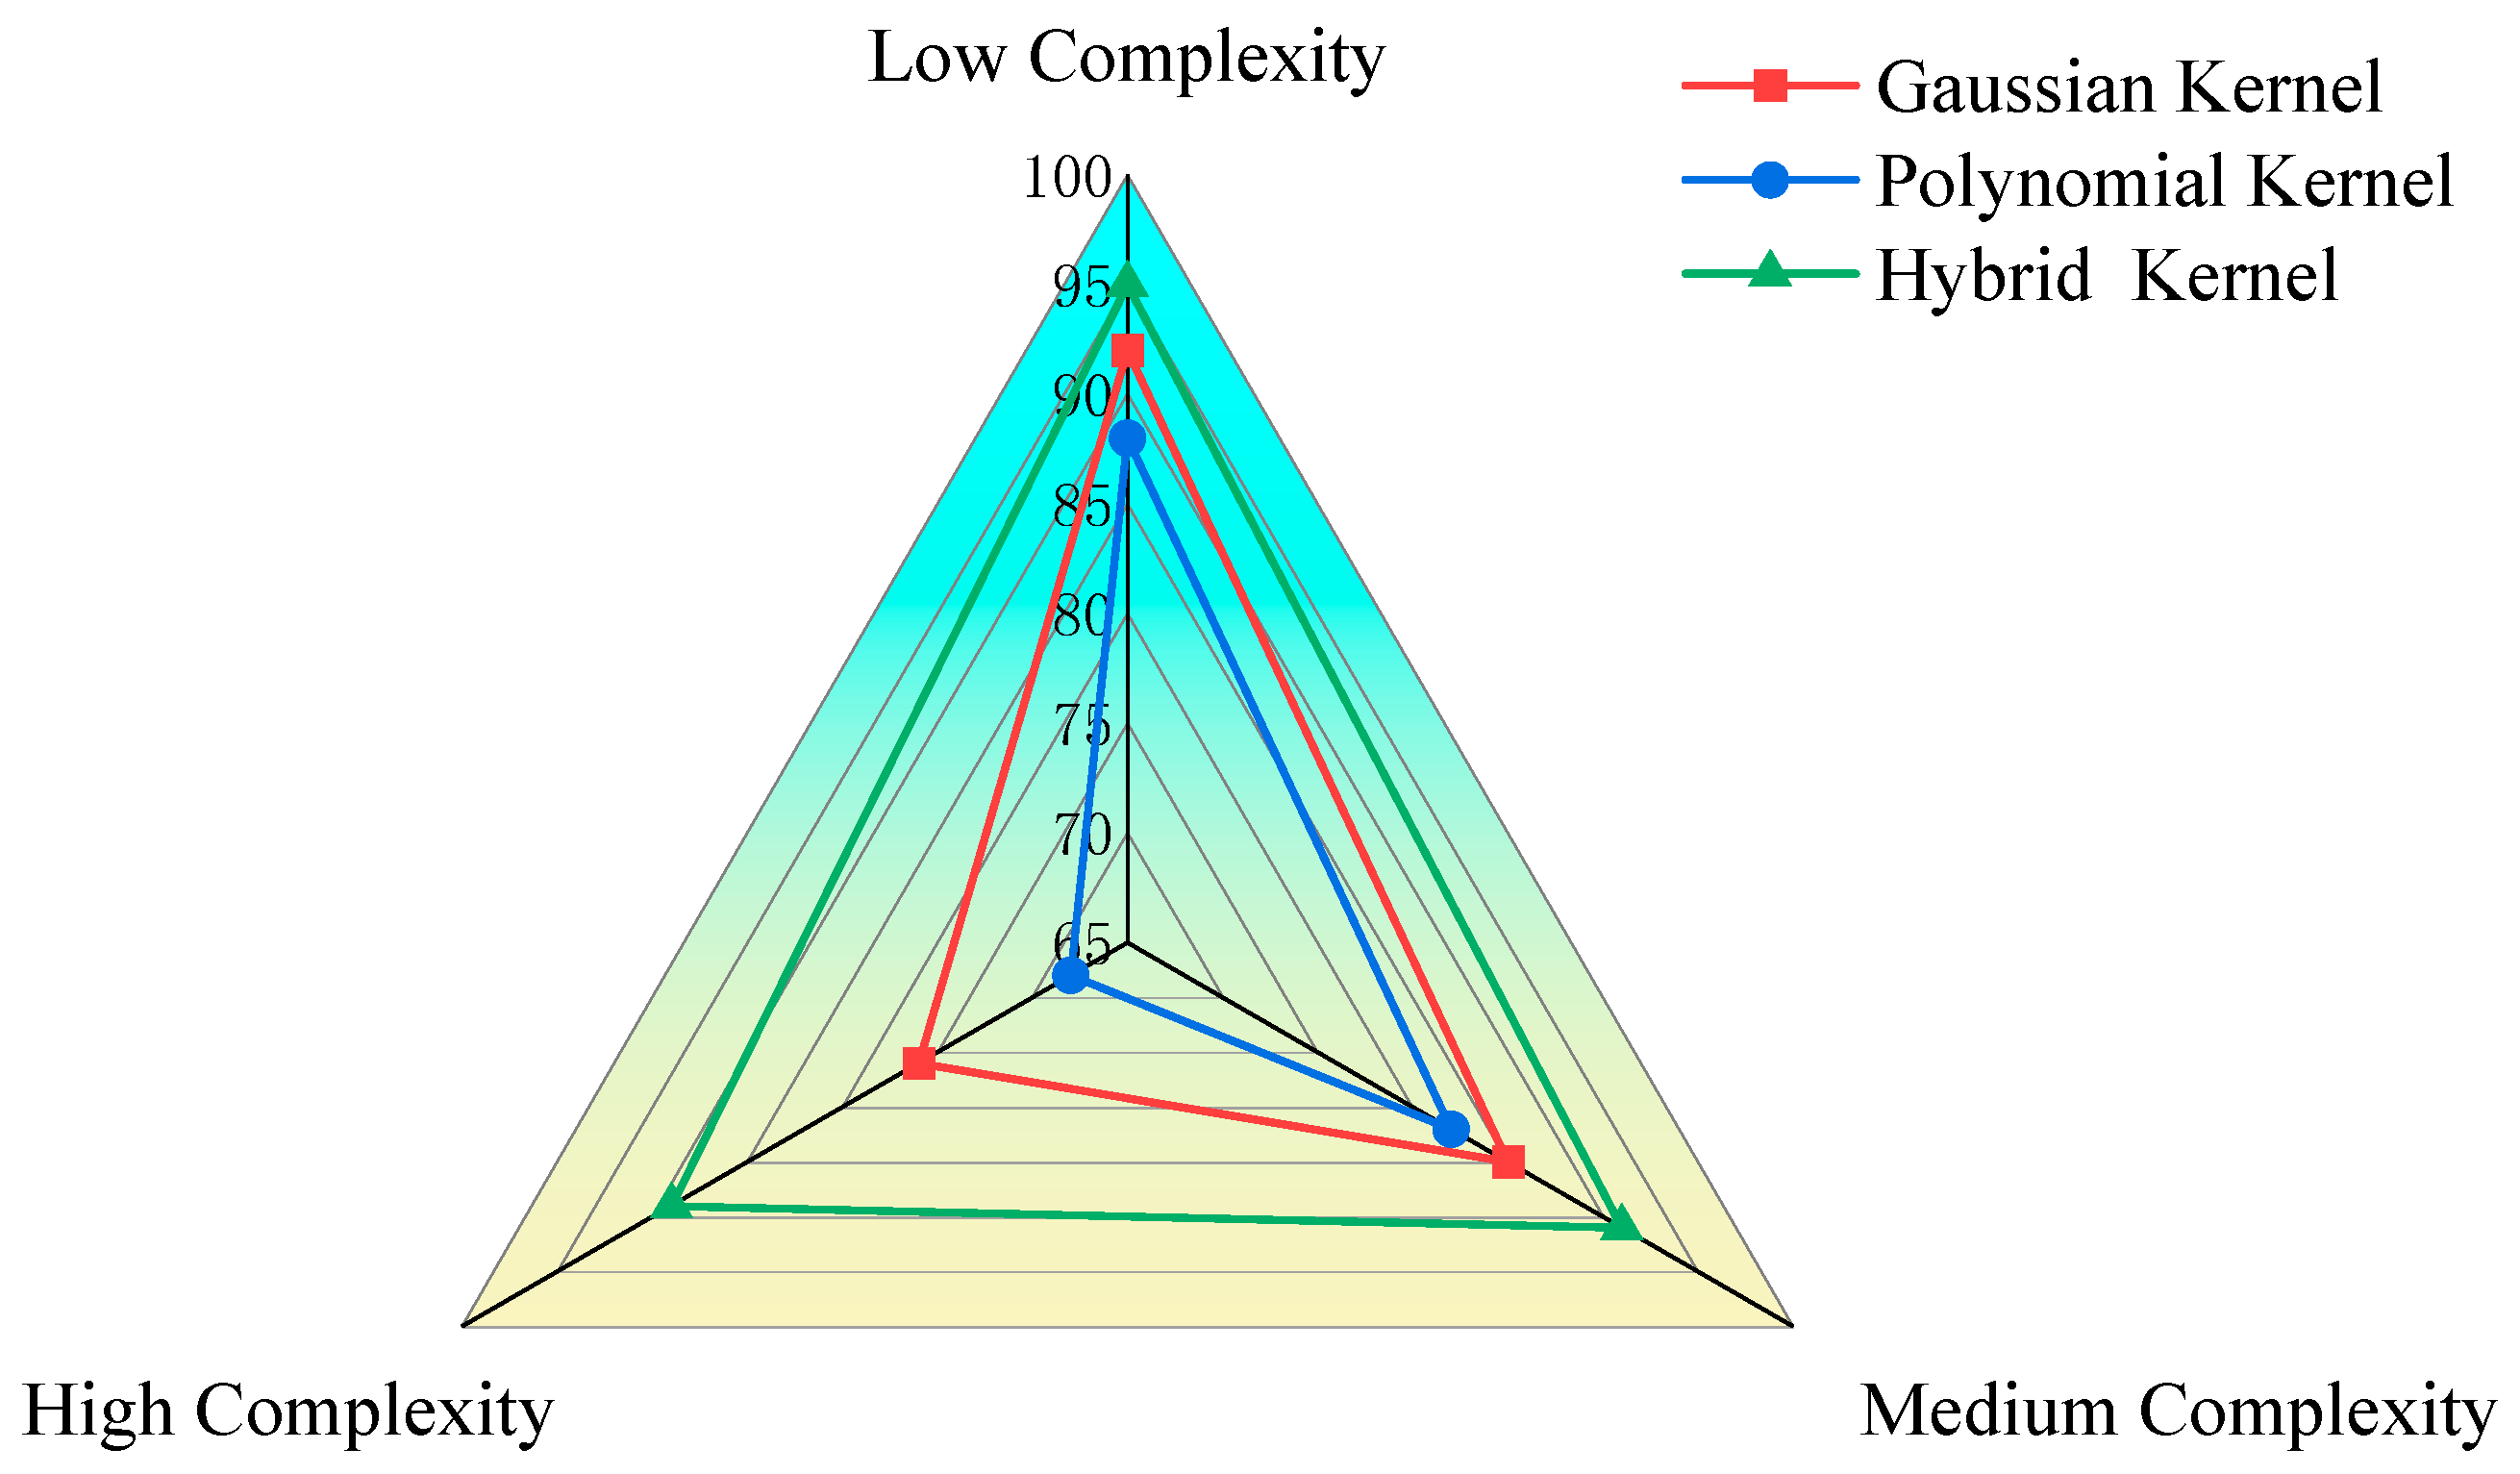
Figure 15 presents a radar-chart comparison of classification accuracy under low, medium, and high battlefield complexity using different kernel functions. The hybrid kernel achieves accuracies of 95%, 91%, and 89%, all significantly higher than those of the Gaussian and polynomial kernels. In high-complexity battlefield scenarios, the hybrid kernel improves accuracy by 13 percentage points over the Gaussian kernel and 21 percentage points over the polynomial kernel, validating its effectiveness in handling heterogeneous threat coupling. Moreover, the dynamic parameter adjustment mechanism of the hybrid kernel optimizes kernel combination strategies according to battlefield entropy variations, enabling the improved SVM to maintain stable classification performance across different threat densities and mission phases.

6. Conclusions

This study addresses the problem of dynamic adaptability in the operational safety evaluation of UAVs in complex operational environments by proposing an improved SVM-based evaluation method. Built upon a four-dimensional indicator system, the method integrates an entropy-driven dynamic feature weighting mechanism, a hybrid Gaussian–polynomial kernel, and an improved binary-tree-based multiclass algorithm, thereby strengthening both the discriminative capability and adaptive performance of conventional SVM models in UAV safety assessment tasks. These results demonstrate both the quantitative superiority of the improved SVM in terms of accuracy, efficiency, and speed, as well as the qualitative advantages introduced by entropy-based feature weighting and kernel optimization.
Experimental validation shows that the improved SVM achieves an accuracy of 96% under complex battlefield conditions, outperforming the traditional SVM by 11 percentage points. Moreover, its training efficiency and prediction speed are optimized by 87.5% and 100%, respectively, offering a new technical pathway for UAV operational safety evaluation.
Nonetheless, several aspects warrant further exploration. First, the training efficiency and deployment scalability of the model must be optimized for large-scale swarm applications. Second, although the current indicator system is systematic, it remains insufficient in capturing psychological cognition and decision-making behaviors; future work may integrate cognitive computing and game-theoretic modeling to enrich evaluation dimensions. Furthermore, considering the growing demand for cooperative operations and swarm intelligence in future battlefields, the improved SVM framework holds strong potential for extension to multi-UAV collaborative safety evaluation.
Beyond the current contributions, several strategic directions can be envisioned for future development. First, incorporating real-world datasets such as UAV telemetry and in-kind operational records would further enhance the robustness and practical relevance of the proposed framework. Second, extending the methodology to leverage advanced paradigms—such as transfer learning, federated learning, and adaptive online modeling—will improve its adaptability to dynamic environments. Finally, broadening the application scope to encompass more complex mission scenarios and cross-domain safety assessments will help translate the proposed approach into operational practice.
This research is conducted within the scope of academic study on autonomous systems safety assessment. The proposed methodology is intended solely for analytical and educational purposes. All simulations are based on synthetic data generated in controlled environments; no sensitive or classified datasets were used. We acknowledge the dual-use nature of autonomous technologies and emphasize that the methods should not be applied for unauthorized military purposes. The authors are aware of relevant export-control regulations and affirm that this work complies with applicable legal and ethical standards.

Author Contributions

Writing—original draft, Y.Z.; Writing—review & editing, S.L. All authors have read and agreed to the published version of the manuscript.

Funding

This research was funded by the National Natural Science Foundation of China, grant number 72271243; and the Key Program of the National Social Science Foundation of China, grant number 21AGL030.

Data Availability Statement

Data is contained within the article.

Conflicts of Interest

The authors declare no conflicts of interest.

References

  1. Zhou, Y.; Liu, S.; Wang, K. An Assessment on Use and Safety of Reconnaissance-Strike UAV Based on Improved Bayesian Network. J. Air Force Eng. Univ. 2025, 26, 86–95. (In Chinese) [Google Scholar]
  2. Gholami, M.; Sanjari, M.J.; Safari, M.; Akbari, M.; Kamali, M.R. Static Security Assessment of Power Systems: A Review. Int. Trans. Electr. Energy Syst. 2020, 30, e12432. [Google Scholar] [CrossRef]
  3. Shen, Z.; Pan, P.; Zhang, D.; Huang, S. Rapid Structural Safety Assessment Using a Deep Neural Network. J. Earthq. Eng. 2020, 26, 2625–2641. [Google Scholar] [CrossRef]
  4. Basak, S.; Lu, L. Safety Assessment of Passive Safety Systems in Nuclear Reactors Using Artificial Neural Networks. Reliab. Eng. Syst. Saf. 2025, 264, 111355. [Google Scholar] [CrossRef]
  5. Xiong, L.; Li, Z.; Zhong, D.; Xu, P.; Tang, C. Rule-Guidance Reinforcement Learning for Lane Change Decision-Making: A Risk Assessment Approach. Chin. J. Mech. Eng. 2025, 38, 30. [Google Scholar] [CrossRef]
  6. Zhu, J.; Yang, L.; Wang, X.; Zheng, H.; Gu, M.; Li, S.; Fang, X. Risk Assessment of Deep Coal and Gas Outbursts Based on IQPSO-SVM. Int. J. Environ. Res. Public Health 2022, 19, 12869. [Google Scholar] [CrossRef]
  7. Zheng, K.; Chen, Y.; Jiang, Y.; Qiao, S. A SVM-Based Ship Collision Risk Assessment Algorithm. Ocean Eng. 2020, 202, 107062. [Google Scholar] [CrossRef]
  8. Zhang, S.; Zhang, A.; Chen, P.; Li, H.; Zeng, X.; Chen, S.; Dong, T.; Shi, P.; Lang, Y.; Zhou, Q. Application of Artificial Intelligence Hybrid Models in Safety Assessment of Submarine Pipelines: Principles and Methods. Ocean Eng. 2024, 312, 119203. [Google Scholar] [CrossRef]
  9. Li, F.; Wang, W.; Xu, J.; Yi, J.; Wang, Q. Comparative Study on Vulnerability Assessment for Urban Buried Gas Pipeline Network Based on SVM and ANN Methods. Process Saf. Environ. Prot. 2019, 122, 23–32. [Google Scholar] [CrossRef]
  10. He, L.; Li, Z.; Yang, X.; Zhou, Y.; Qu, Z.; Ren, Z. Research on Quantitative Safety Risk Assessment Methods at Vehicle Controllability Level. IEEE Access 2025, 13, 82527–82539. [Google Scholar] [CrossRef]
  11. Tan, Y.; Zheng, Y.; Yi, W.; Li, S.; Chen, P.; Cai, R.; Song, D. Intelligent Inspection of Building Exterior Walls Using UAV and Mixed Reality Based on Man-Machine-Environment System Engineering. Autom. Constr. 2025, 177, 106344. [Google Scholar] [CrossRef]
  12. Bonsu, J.; van Dyk, W.; Franzidis, J.-P.; Petersen, F.; Isafiade, A. A Systems Approach to Mining Safety: An Application of the Swiss Cheese Model. J. S. Afr. Inst. Min. Metall. 2016, 116, 776–784. [Google Scholar] [CrossRef]
  13. Zhang, X.; Liu, Y.; Zhang, Y.; Guan, X.; Delahaye, D.; Tang, L. Safety Assessment and Risk Estimation for Unmanned Aerial Vehicles Operating in National Airspace System. J. Adv. Transp. 2018, 2018, 731585. [Google Scholar] [CrossRef]
  14. Kobaszyńska-Twardowska, A.; Łukasiewicz, J.; Sielicki, P.W. Risk Management Model for Unmanned Aerial Vehicles during Flight Operations. Materials 2022, 15, 2448. [Google Scholar] [CrossRef]
  15. Wen, Z.; Fan, Z.; Su, H. An APPSO–SVM Approach Building the Monitoring Model of Dam Safety. Soft Comput. 2022, 26, 11451–11459. [Google Scholar] [CrossRef]
  16. Huang, Q.; Sun, H.; Wei, Y.; Zhang, J.; Jin, X. Comprehensive Assessment of Mental Workload of Armored Vehicle Operators Based on SVM and DS Evidence Theory. Cogn. Technol. Work 2025, 27, 137–157. [Google Scholar] [CrossRef]
  17. Li, S.; Chen, G.; Men, J.; Li, X.; Zhao, Y.; Xu, Q.; Zhao, J. A Novel Dynamic Risk Assessment Method for Hazardous Chemical Warehouses Based on Improved SVM and Mathematical Methodologies. J. Loss Prev. Process Ind. 2024, 89, 105302. [Google Scholar] [CrossRef]
  18. Pawara, P.; Okafor, E.; Groefsema, M.; He, S.; Schomaker, L.R.B.; Wiering, M.A. One-vs-One Classification for Deep Neural Networks. Pattern Recognit. 2020, 108, 107528. [Google Scholar] [CrossRef]
  19. Xu, X.; Li, Y.; Yuan, C. Conditional Image Generation with One-Vs-All Classifier. Neurocomputing 2021, 434, 261–267. [Google Scholar] [CrossRef]
  20. Lee, C.-P.; Lin, C.-J. A Study on L2-Loss (Squared Hinge-Loss) Multiclass SVM. Neural Comput. 2013, 25, 1302–1323. [Google Scholar] [CrossRef] [PubMed]
  21. Zhang, Q.; Wang, Y.; Huang, L.; Jiang, B.; Wang, X. Fast CU Partition Decision for H.266/VVC Based on the Improved DAG-SVM Classifier Model. Multimed. Syst. 2021, 27, 1–14. [Google Scholar] [CrossRef]
  22. Wang, F.; Wang, Z.; Zhang, Q. FSVM- and DAG-SVM-Based Fast CU-Partitioning Algorithm for VVC Intra-Coding. Symmetry 2023, 15, 1078. [Google Scholar] [CrossRef]
  23. Bodine, E.N.; Panoff, R.M.; Voit, E.O.; Weisstein, A.E. Agent-Based Modeling and Simulation in Mathematics and Biology Education. Bull. Math. Biol. 2020, 82, 101. [Google Scholar] [CrossRef] [PubMed]
  24. Stieler, D.; Schwinn, T.; Leder, S.; Maierhofer, M.; Kannenberg, F.; Menges, A. Agent-Based Modeling and Simulation in Architecture. Autom. Constr. 2022, 141, 104426. [Google Scholar] [CrossRef]
  25. Chechkin, A.; Pleshakova, E.; Gataullin, S. A Hybrid KAN-BiLSTM Transformer with Multi-Domain Dynamic Attention Model for Cybersecurity. Technologies 2025, 13, 223. [Google Scholar] [CrossRef]
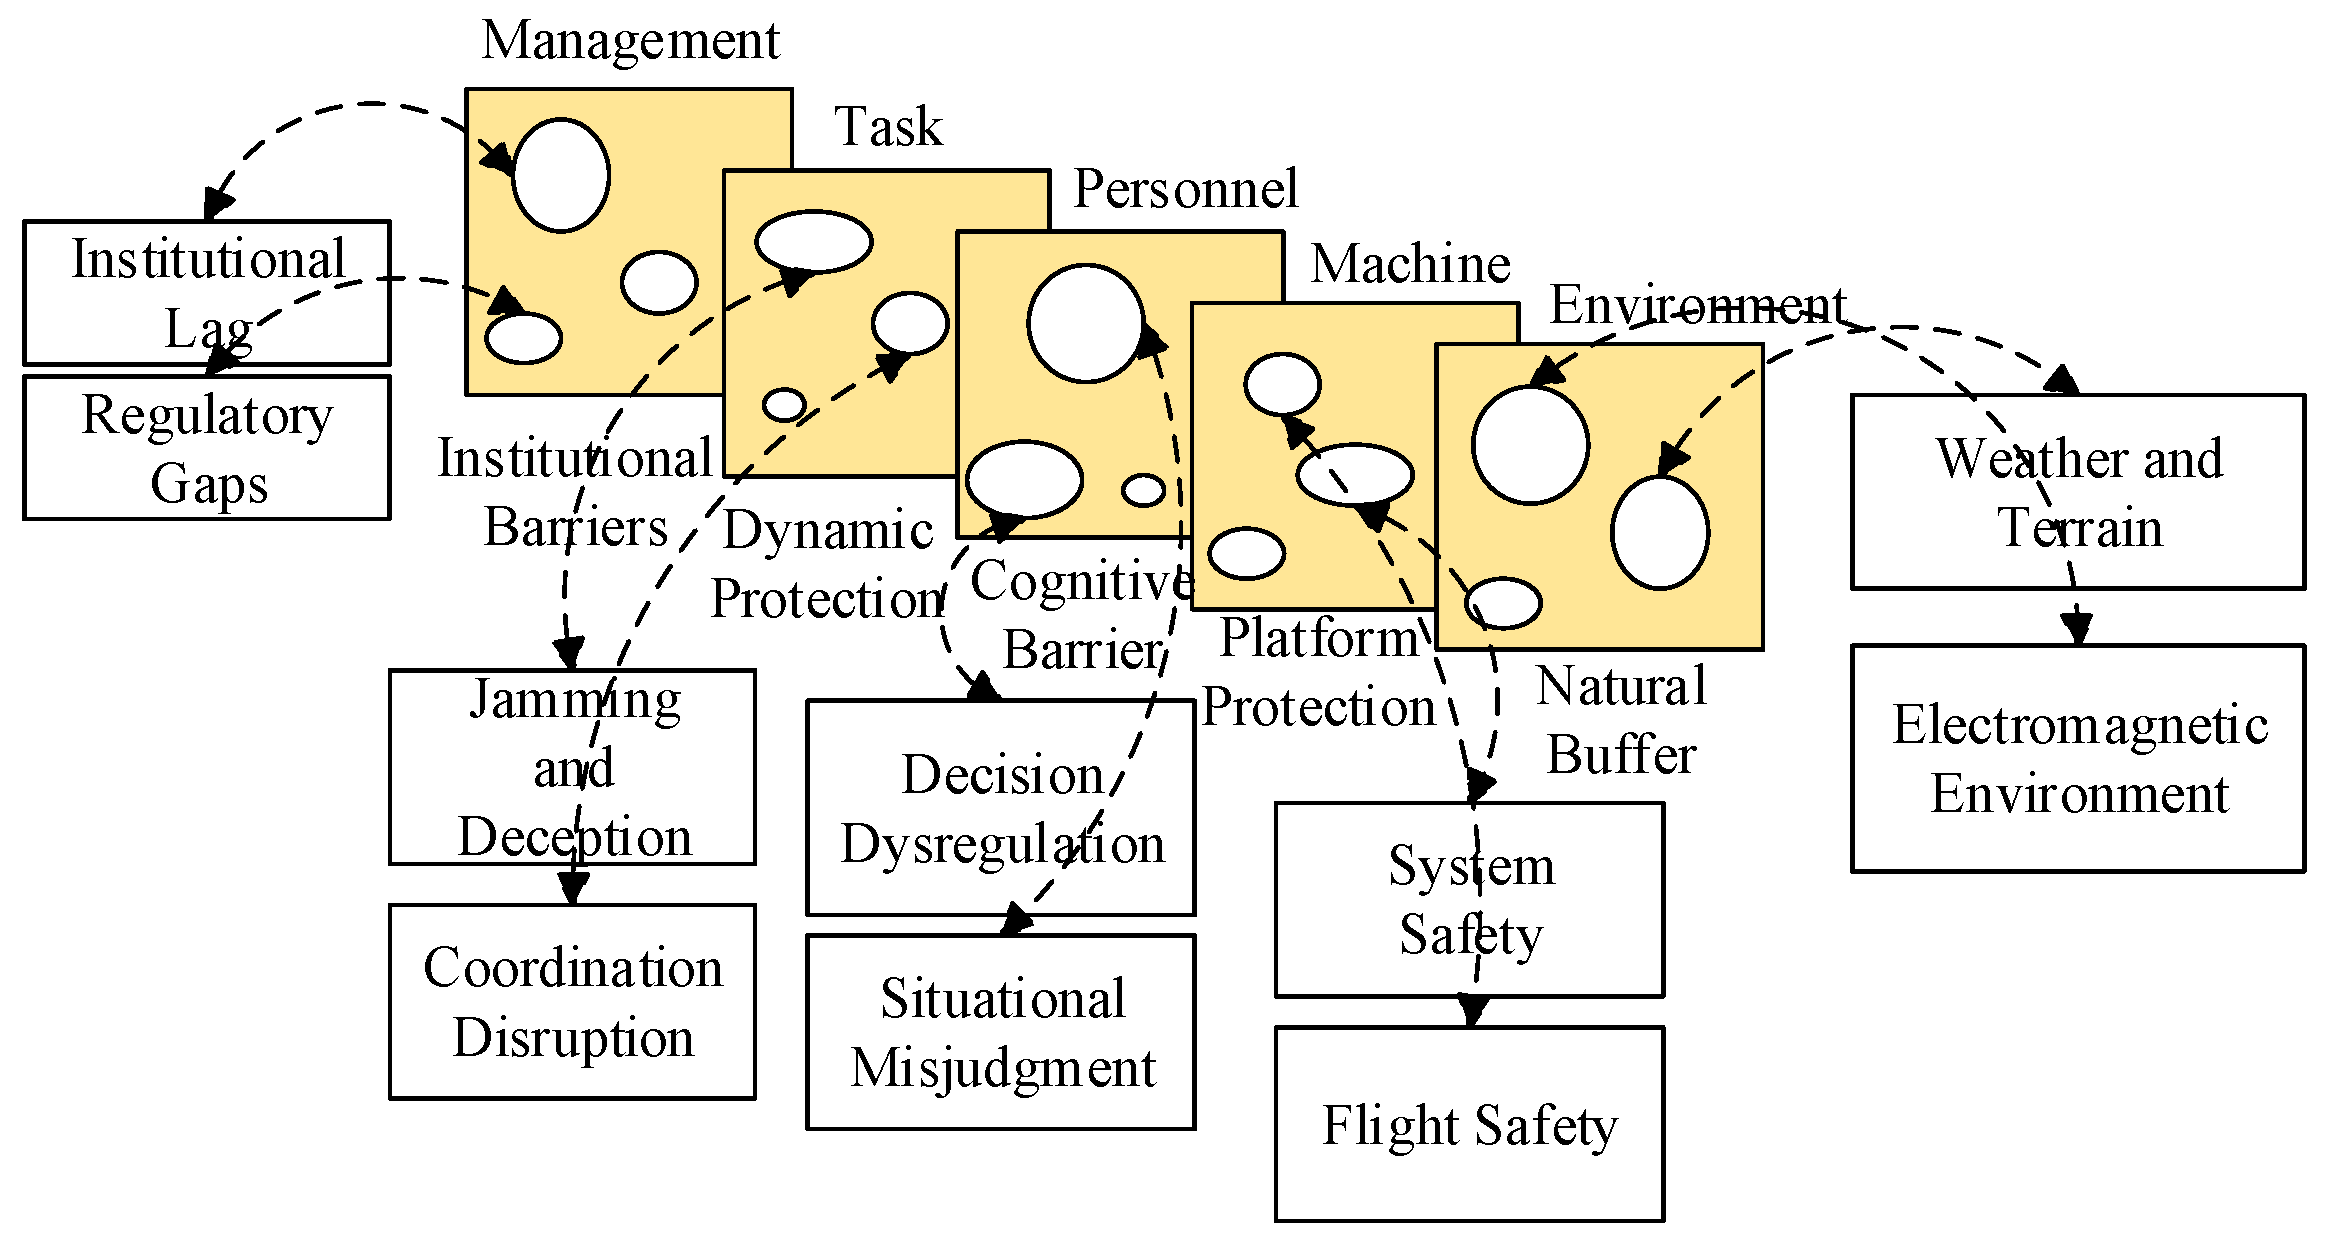
Figure 1. Swiss Cheese Model Based on the MMEMT Framework.
Aerospace 12 00932 g001
Figure 2. Indicator mapping relationship.
Aerospace 12 00932 g002
Figure 3. Improved SVM evaluation process.
Aerospace 12 00932 g003
Figure 4. DAG-SVM multi classification algorithm.
Aerospace 12 00932 g004
Figure 5. Improved DAG-SVM multi classification algorithm.
Aerospace 12 00932 g005
Figure 6. Agent-based modeling framework.
Aerospace 12 00932 g006
Figure 7. Attacking agent model structure diagram.
Aerospace 12 00932 g007
Figure 8. Defender agent model structure diagram.
Aerospace 12 00932 g008
Figure 9. Simulation interface.
Aerospace 12 00932 g009
Figure 10. Classification report on the improved SVM model.
Aerospace 12 00932 g010
Figure 11. Confusion matrix of the improved SVM model.
Aerospace 12 00932 g011
Figure 12. Sensitivity analysis of hyper-parameters.
Aerospace 12 00932 g012
Figure 13. Classification performance comparison.
Aerospace 12 00932 g013
Figure 14. Calculation efficiency comparison.
Aerospace 12 00932 g014
Figure 15. Performance comparison of kernel functions.
Aerospace 12 00932 g015
Table 1. Evaluation Index System for the UAV.
Target LayerCriterion LayerElement LayerIndicator Layer
Evaluation Index System
(A)
GCS Operators
(B1)
Comprehensive Competency
(C1)
Operator Skill Level (D1)
Qualification Certification (D2)
Experience Accumulation (D3)
Physiological and Psychological States (C2)Operator Health Status (D4)
Operator Fatigue (D5)
Psychological Quality (D6)
UAV Platform
(B2)
Platform System Safety (C3)Aircraft Platform Safety (D7)
Propulsion System (D8)
Flight Management System (D9)
Weapon System Safety (C4)Reconnaissance Payload (D10)
Weapon Payload (D11)
Health
Management
(C5)
Fault Detection Capability (D12)
Fault Isolation Capability (D13)
Self-Repair Capability (D14)
Flight
Environment
(B3)
Natural
Environment
(C6)
Terrain Adaptability (D15)
Weather Adaptability (D16)
Electromagnetic (D17)
Flight Missions
(B4)
Resistance to
Kinetic Firepower
(C7)
Antiaircraft Artillery (D18)
Air Defense Missile (D19)
Resistance to
Directed-Energy
(C8)
Laser Attack (D20)
Microwave Attack (D21)
Resistance to
Deception Attack
(C9)
Link spoofing (D22)
Navigation Deception (D23)
Information Attack (D24)
Resistance to
Suppression-Based Jamming (C10)
Communication
Interference (D25)
Navigation Interference (D26)
Radar Interference (D27)
Multi-UAV
Collaborative Safety (C11)
Network Communication (D28)
Formation Flight (D29)
Collaborative Task (D30)
Table 2. Common index data acquisition methods.
MethodAcquisition Method
Historical task record dataThis involves retrieving historical logs from the UAV, including flight records, sensor data, and
environmental records.
Simulation dataUsing a flight simulation platform to create typical mission scenarios, this method simulates flight data and
unexpected events.
Field test sampling dataExperimental tasks are designed with embedded sensors and recording modules to collect flight status data
during real-world tests.
Delphi methodA systematic expert knowledge collection method that allows professionals to assess and score mission risks.
Model parameter calculationBy establishing mathematical, physical, engineering, or statistical models, the parameters of the system are calculated.
Table 3. Threat type and hazard level.
Method Threat TypeHazard LevelCore Impact
Loss of controlHigh (Level II)Mission chain disruption
Forced landingLow (Level IV)Difficulty in equipment
recovery
CrashMedium (Level III)Induction of secondary hazards
DeceptionExtreme (Level I)Leakage of classified
information
Table 4. Safety classification standard.
Safety LevelThreat Scope CoverageTypical Application Scenarios
L1 (Extreme Protection)Addressing ≥3 types of
Level I threats
Strategic operations,
penetration of nuclear facilities
L2 (High Protection)Combination of Level I +
Level II threats
High-value target
reconnaissance and strikes
L3 (Standard Protection)Addressing a single Level I or Level II threatRoutine battlefield patrols,
border surveillance
L4 (Basic Protection)Addressing Level III or
lower threats
Low-intensity area reconnaissance, training missions
Table 5. Comparison of multiple classification algorithms.
AlgorithmTraining ComplexityPrediction SpeedApplicability
OvOHighSlowNonlinear,
small-sample scenarios
OvALowMediumFast training,
balanced data distribution
CSMediumFastLinear data, high real-time requirements
DSHighFastEmbedded deployment, nonlinear scenarios
Table 6. Raw sample data (10).
C1C2C3C4C5C6C7C8C9C10C11L
0.3880.2710.8280.3560.5420.1400.8020.0740.9860.7720.198L3
0.0050.8150.7060.7290.0740.3580.1150.8630.6230.3300.063L3
0.3100.3250.7290.6370.4720.1190.7130.7600.5610.7700.493L1
0.5220.4270.0250.1070.6360.3140.5080.9070.2490.4100.755L4
0.2280.0760.2890.1610.8080.6330.8710.8030.1860.8920.539L1
0.8060.7850.8010.8000.4680.5760.5520.7280.7640.6450.577L2
0.8070.8960.3180.1100.4270.8180.8600.0060.5100.4170.222L3
0.5630.4740.6910.5250.2730.3610.4460.5910.4590.3610.351L3
0.7170.6090.7870.7220.5050.6690.4810.5560.7550.6800.559L2
0.7960.8810.7670.7130.4670.5520.4240.6780.6240.6320.735L2
Table 7. Sample data after processing (10).
C1C2C3C4C5C6C7C8C9C10C11L
0.0090.0290.0620.0130.0420.0150.0520.0120.0880.0900.008L3
0.0010.0760.0220.0110.0090.0340.0090.1610.0220.0310.005L3
0.0330.0350.0020.0110.0350.0170.0410.1240.0240.0830.038L1
0.0510.0240.0020.0060.0440.0210.0290.1200.0160.0380.073L4
0.0250.0070.0310.0150.0550.0490.0520.0550.0130.0260.052L1
0.0630.0510.0250.0300.0470.0840.0460.0900.0480.0760.021L2
0.1060.0770.0340.0140.0280.0540.0480.0010.0190.0130.018L3
0.0460.0390.0570.0430.0220.0300.0370.0490.0380.0300.029L3
0.0580.0500.0640.0590.0430.0570.0390.0450.0630.0580.046L2
0.0650.0750.0610.0580.0390.0470.0340.0540.0520.0540.063L2
Table 8. Test sample data.
C1C2C3C4C5C6C7C8C9C10C11
0.720.680.850.820.780.650.700.620.550.600.80
0.730.690.840.810.770.660.710.630.560.610.79
0.710.670.830.800.760.640.690.610.540.590.81
0.700.660.820.790.750.630.680.600.530.580.82
0.740.700.860.830.790.670.720.640.570.620.78
0.690.650.810.780.740.620.670.590.520.570.83
0.720.680.800.770.760.650.700.620.550.600.79
0.0460.0390.0570.0430.0220.0300.0370.0490.0380.0300.029
0.0580.0500.0640.0590.0430.0570.0390.0450.0630.0580.046
0.0650.0750.0610.0580.0390.0470.0340.0540.0520.0540.063
Table 9. Ablation results of the improved SVM model.
Model VariantAccuracyF1-Score
Baseline SVM0.870.86
+Entropy weighting0.900.90
+Hybrid kernel0.930.92
+Improved DAG-SVM0.940.93
Full Model (ours)0.960.94
‘+’ indicates cumulative addition: starting from the baseline SVM and progressively adding Entropy weighting, Hybrid kernel, and Improved DAG‑SVM to obtain the full model, so each row reflects the incremental improvement from the added component.
Table 10. Comparison results of classification performance of various algorithms.
AlgorithmAccuracyMacro F1L1 Recall Rate
Logistic Regression0.720.680.58
Random Forest0.860.830.77
Convolutional Neural Network0.880.850.79
Long Short-Term Memory Network0.900.880.82
Improved SVM0.960.940.84
Disclaimer/Publisher’s Note: The statements, opinions and data contained in all publications are solely those of the individual author(s) and contributor(s) and not of MDPI and/or the editor(s). MDPI and/or the editor(s) disclaim responsibility for any injury to people or property resulting from any ideas, methods, instructions or products referred to in the content.